Cambridge A Level Biology 9700 — 2018 Oct/Nov Paper 5 · Variant 2
9700/52/O/N/18 · 2 questions · 30 marks · ≈34 min
The question paper and its mark scheme, free to read here and free to download. This is Cambridge’s own paper, exactly as it was sat.
Question paper8 pages
Mark scheme9 pages
Answers below. Sit the paper first if you are practising.
Questions as text
Q1 · Apparatus that can be used to measure the loss of water vapour from leaves
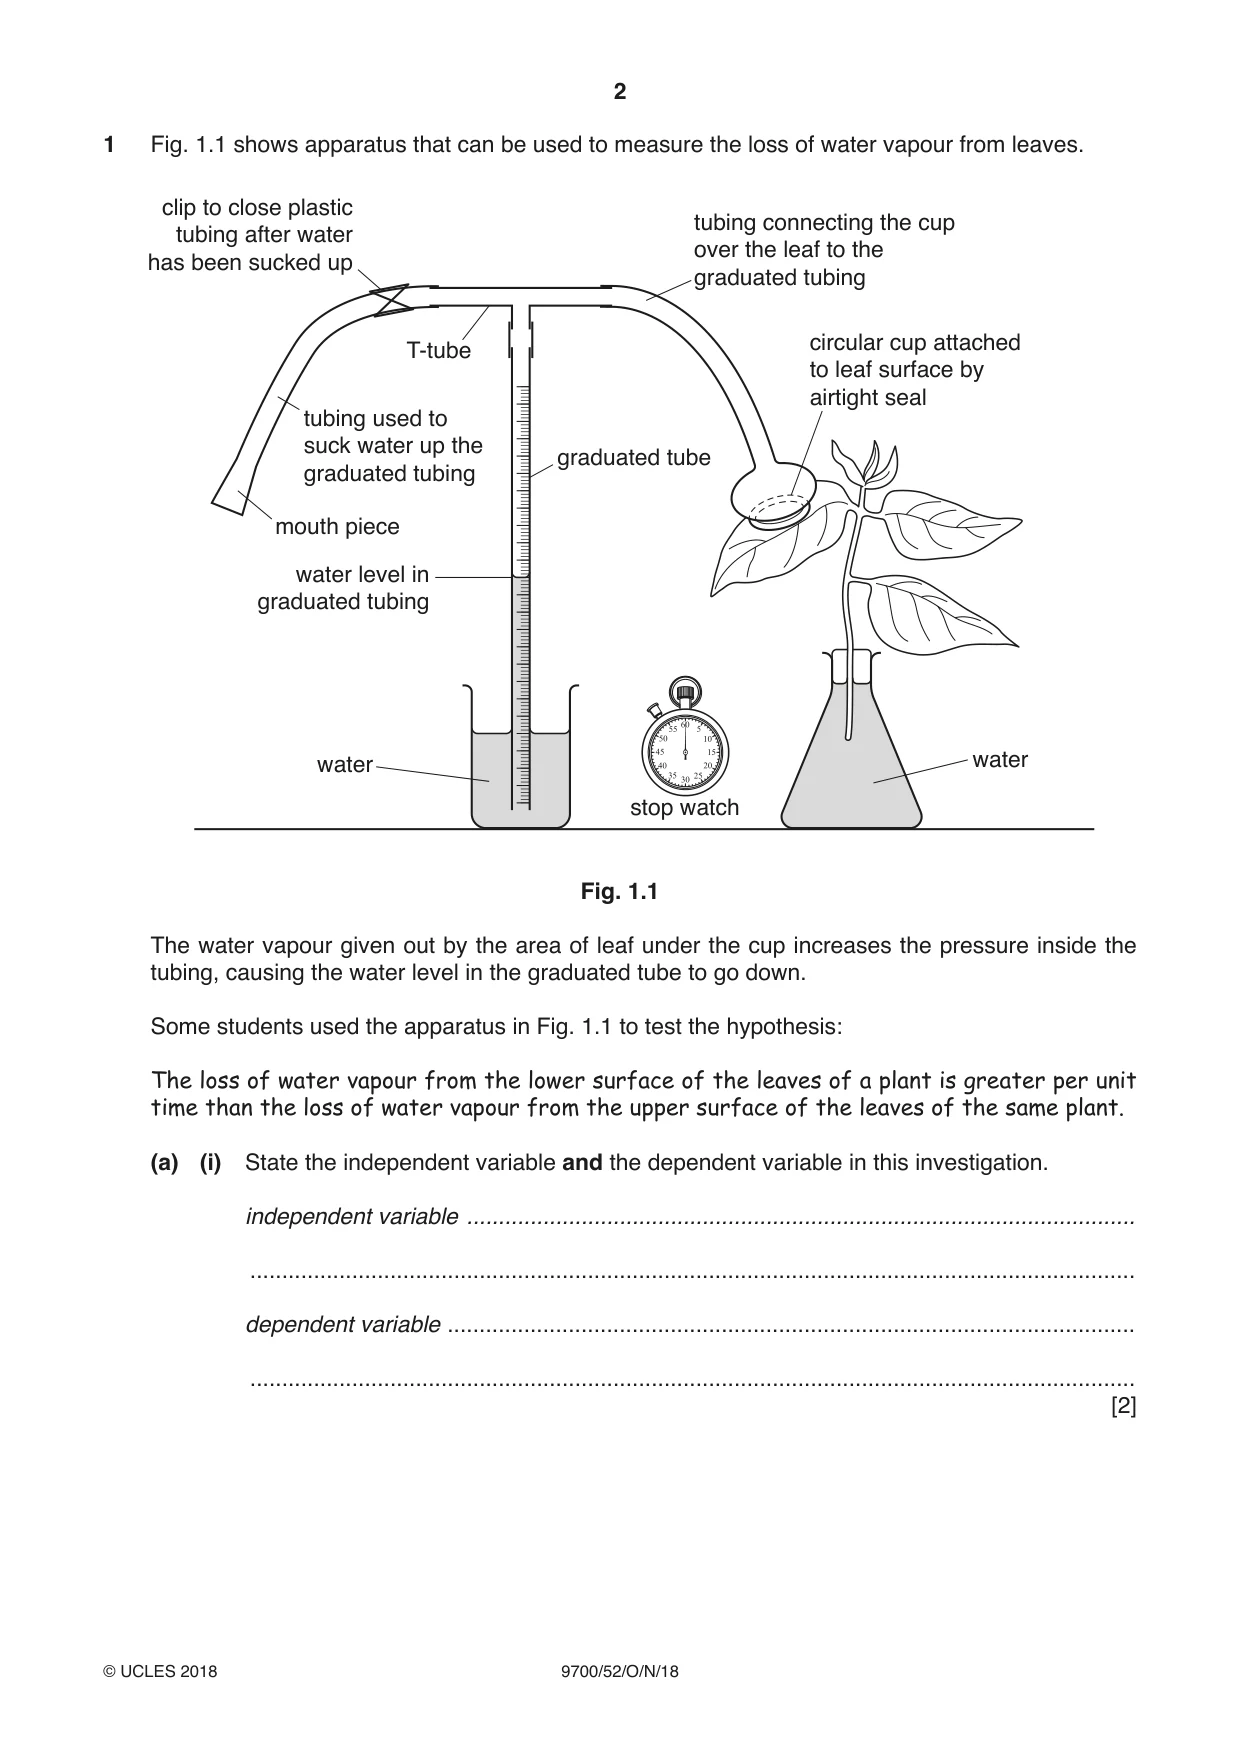
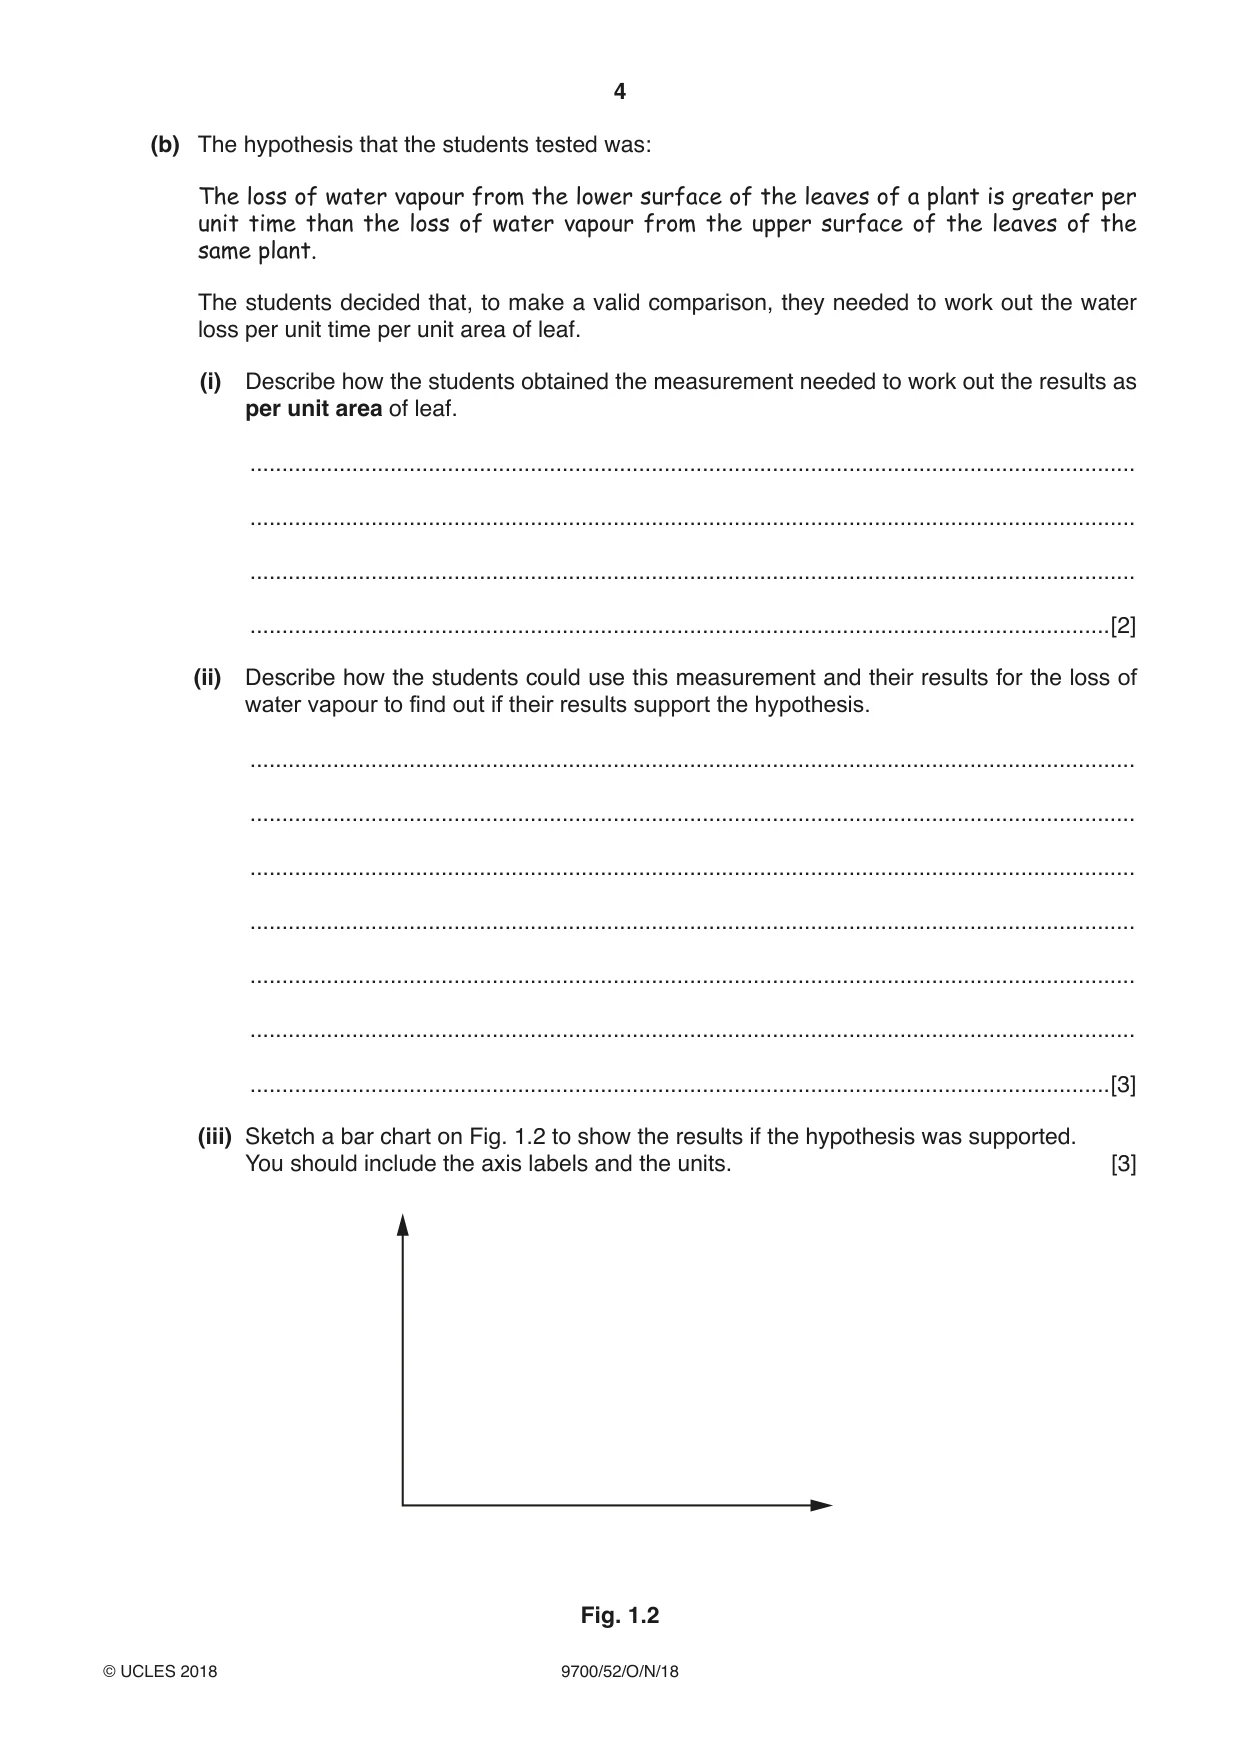
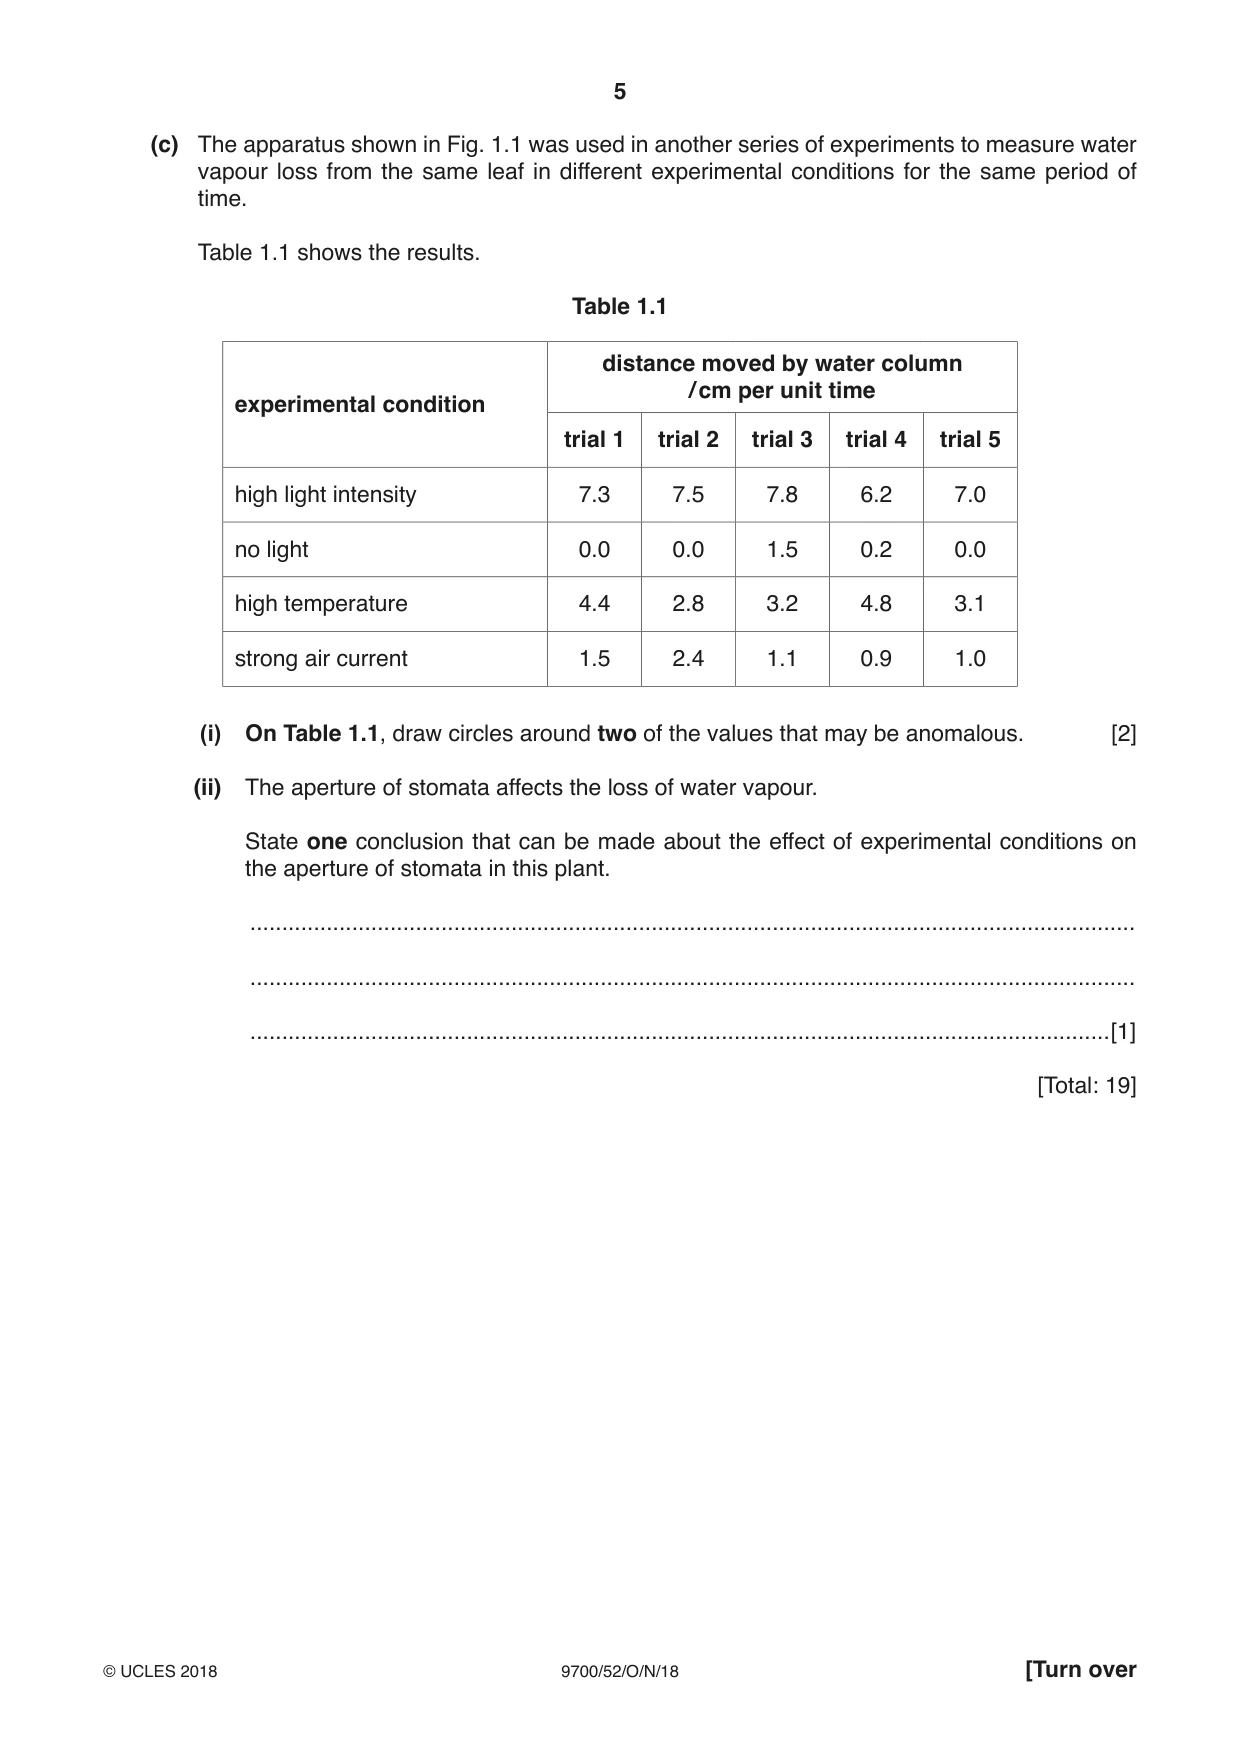
1 Fig. 1.1 shows apparatus that can be used to measure the loss of water vapour from leaves. clip to close plastic tubing connecting the cup tubing after water over the leaf to the has been sucked up graduated tubing circular cup attached T-tube to leaf surface by airtight seal tubing used to suck water up the graduated tube graduated tubing mouth piece water level in graduated tubing water water stop watch Fig. 1.1 The water vapour given out by the area of leaf under the cup increases the pressure inside the tubing, causing the water level in the graduated tube to go down. Some students used the apparatus in Fig. 1.1 to test the hypothesis: The loss of water vapour from the lower surface of the leaves of a plant is greater per unit time than the loss of water vapour from the upper surface of the leaves of the same plant. (a) (i) State the independent variable and the dependent variable in this investigation. independent variable ......................................................................................................... ........................................................................................................................................... dependent variable ............................................................................................................ ........................................................................................................................................... [2] (ii) Describe a method by which the students could use the apparatus shown in Fig. 1.1 to measure loss of water vapour in order to test the hypothesis. Your method should be set out in a logical order and be detailed enough to let another person follow it. ........................................................................................................................................... ........................................................................................................................................... ........................................................................................................................................... ........................................................................................................................................... ........................................................................................................................................... ........................................................................................................................................... ........................................................................................................................................... ........................................................................................................................................... ........................................................................................................................................... ........................................................................................................................................... ........................................................................................................................................... ........................................................................................................................................... ........................................................................................................................................... ........................................................................................................................................... ........................................................................................................................................... ........................................................................................................................................... ........................................................................................................................................... ........................................................................................................................................... ........................................................................................................................................... ........................................................................................................................................... ........................................................................................................................................... ........................................................................................................................................... ........................................................................................................................................... ........................................................................................................................................... .......................................................................................................................................[6] (b) The hypothesis that the students tested was: The loss of water vapour from the lower surface of the leaves of a plant is greater per unit time than the loss of water vapour from the upper surface of the leaves of the same plant. The students decided that, to make a valid comparison, they needed to work out the water loss per unit time per unit area of leaf. (i) Describe how the students obtained the measurement needed to work out the results as per unit area of leaf. ........................................................................................................................................... ........................................................................................................................................... ........................................................................................................................................... .......................................................................................................................................[2] (ii) Describe how the students could use this measurement and their results for the loss of water vapour to find out if their results support the hypothesis. ........................................................................................................................................... ........................................................................................................................................... ........................................................................................................................................... ........................................................................................................................................... ........................................................................................................................................... ........................................................................................................................................... .......................................................................................................................................[3] (iii) Sketch a bar chart on Fig. 1.2 to show the results if the hypothesis was supported. You should include the axis labels and the units. [3] Fig. 1.2 (c) The apparatus shown in Fig. 1.1 was used in another series of experiments to measure water vapour loss from the same leaf in different experimental conditions for the same period of time. Table 1.1 shows the results. Table 1.1 distance moved by water column / cm per unit time experimental condition trial 1 trial 2 trial 3 trial 4 trial 5 high light intensity 7.3 7.5 7.8 6.2 7.0 no light 0.0 0.0 1.5 0.2 0.0 high temperature 4.4 2.8 3.2 4.8 3.1 strong air current 1.5 2.4 1.1 0.9 1.0 (i) On Table 1.1, draw circles around two of the values that may be anomalous. [2] (ii) The aperture of stomata affects the loss of water vapour. State one conclusion that can be made about the effect of experimental conditions on the aperture of stomata in this plant. ........................................................................................................................................... ........................................................................................................................................... .......................................................................................................................................[1] [Total: 19]
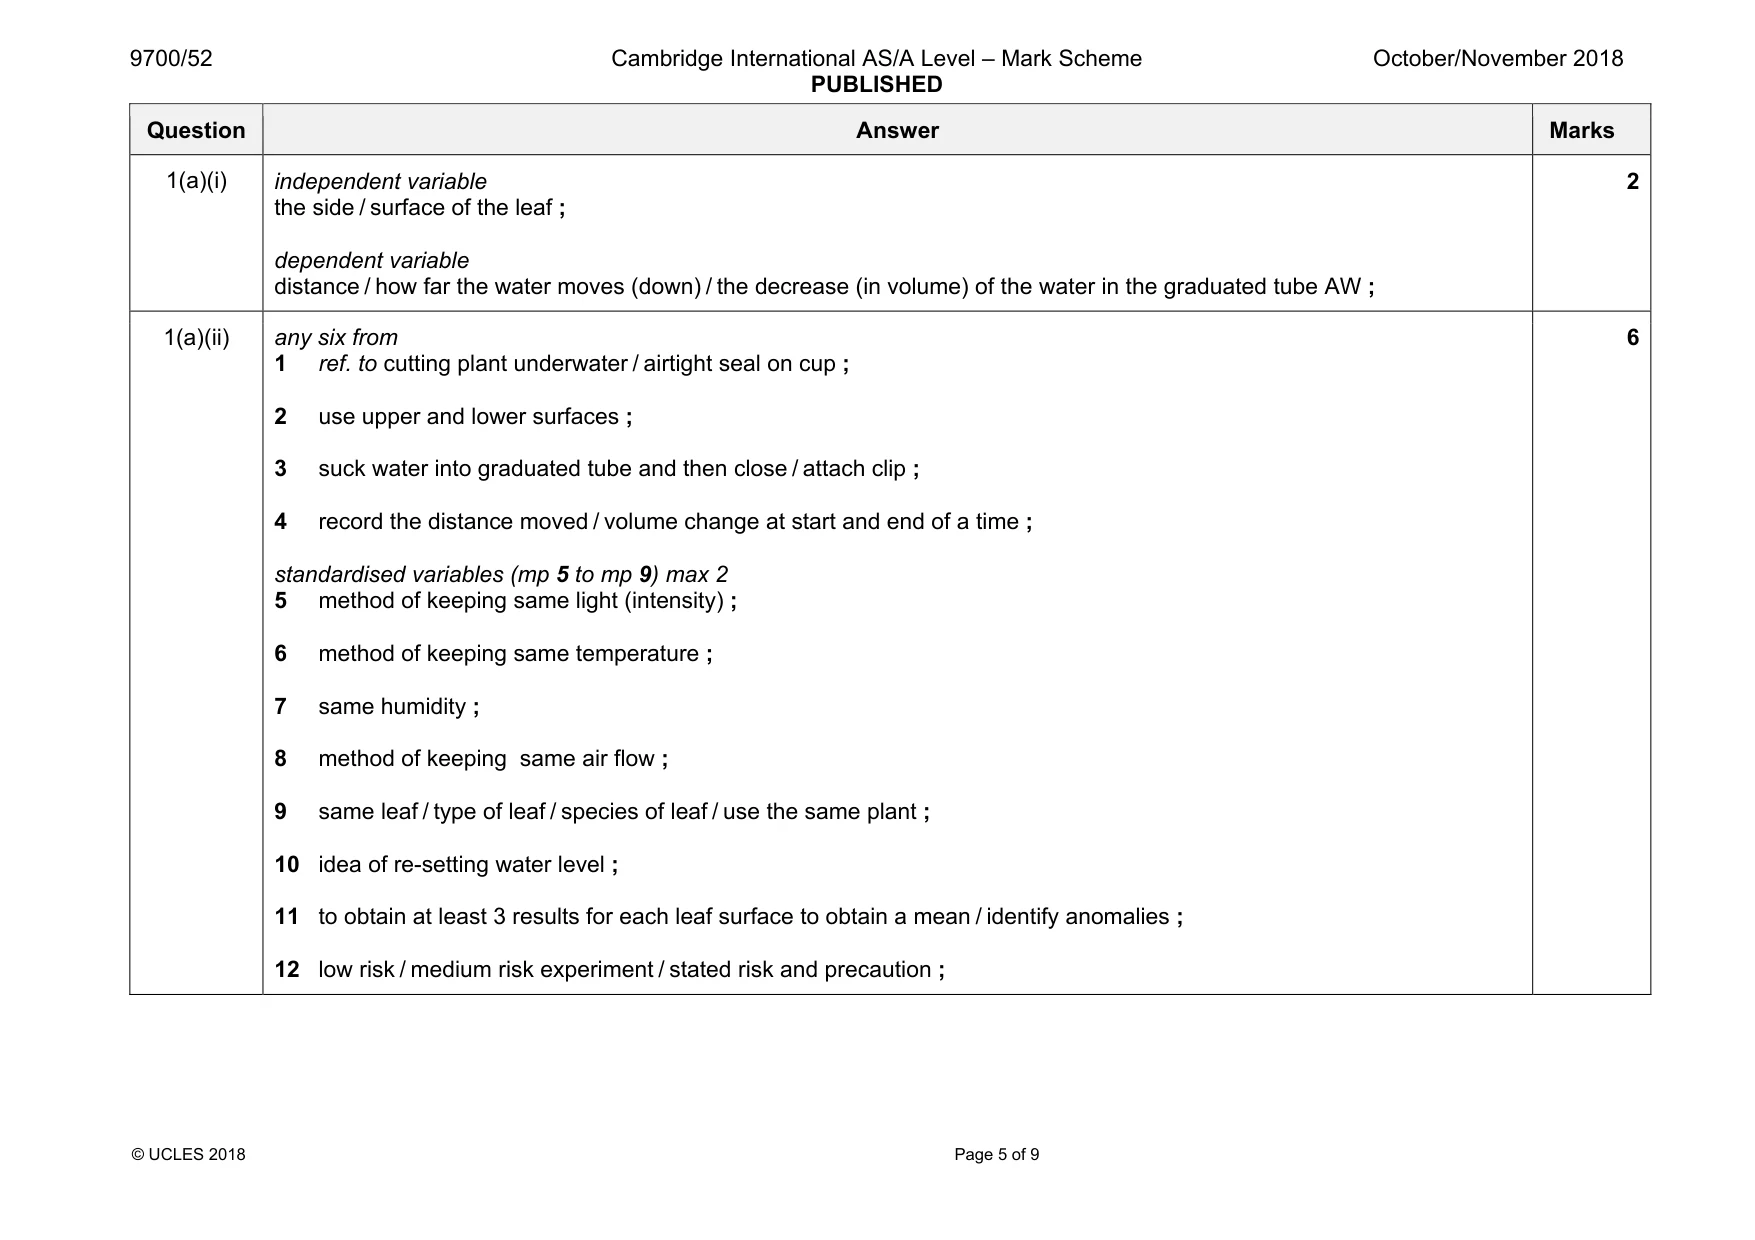
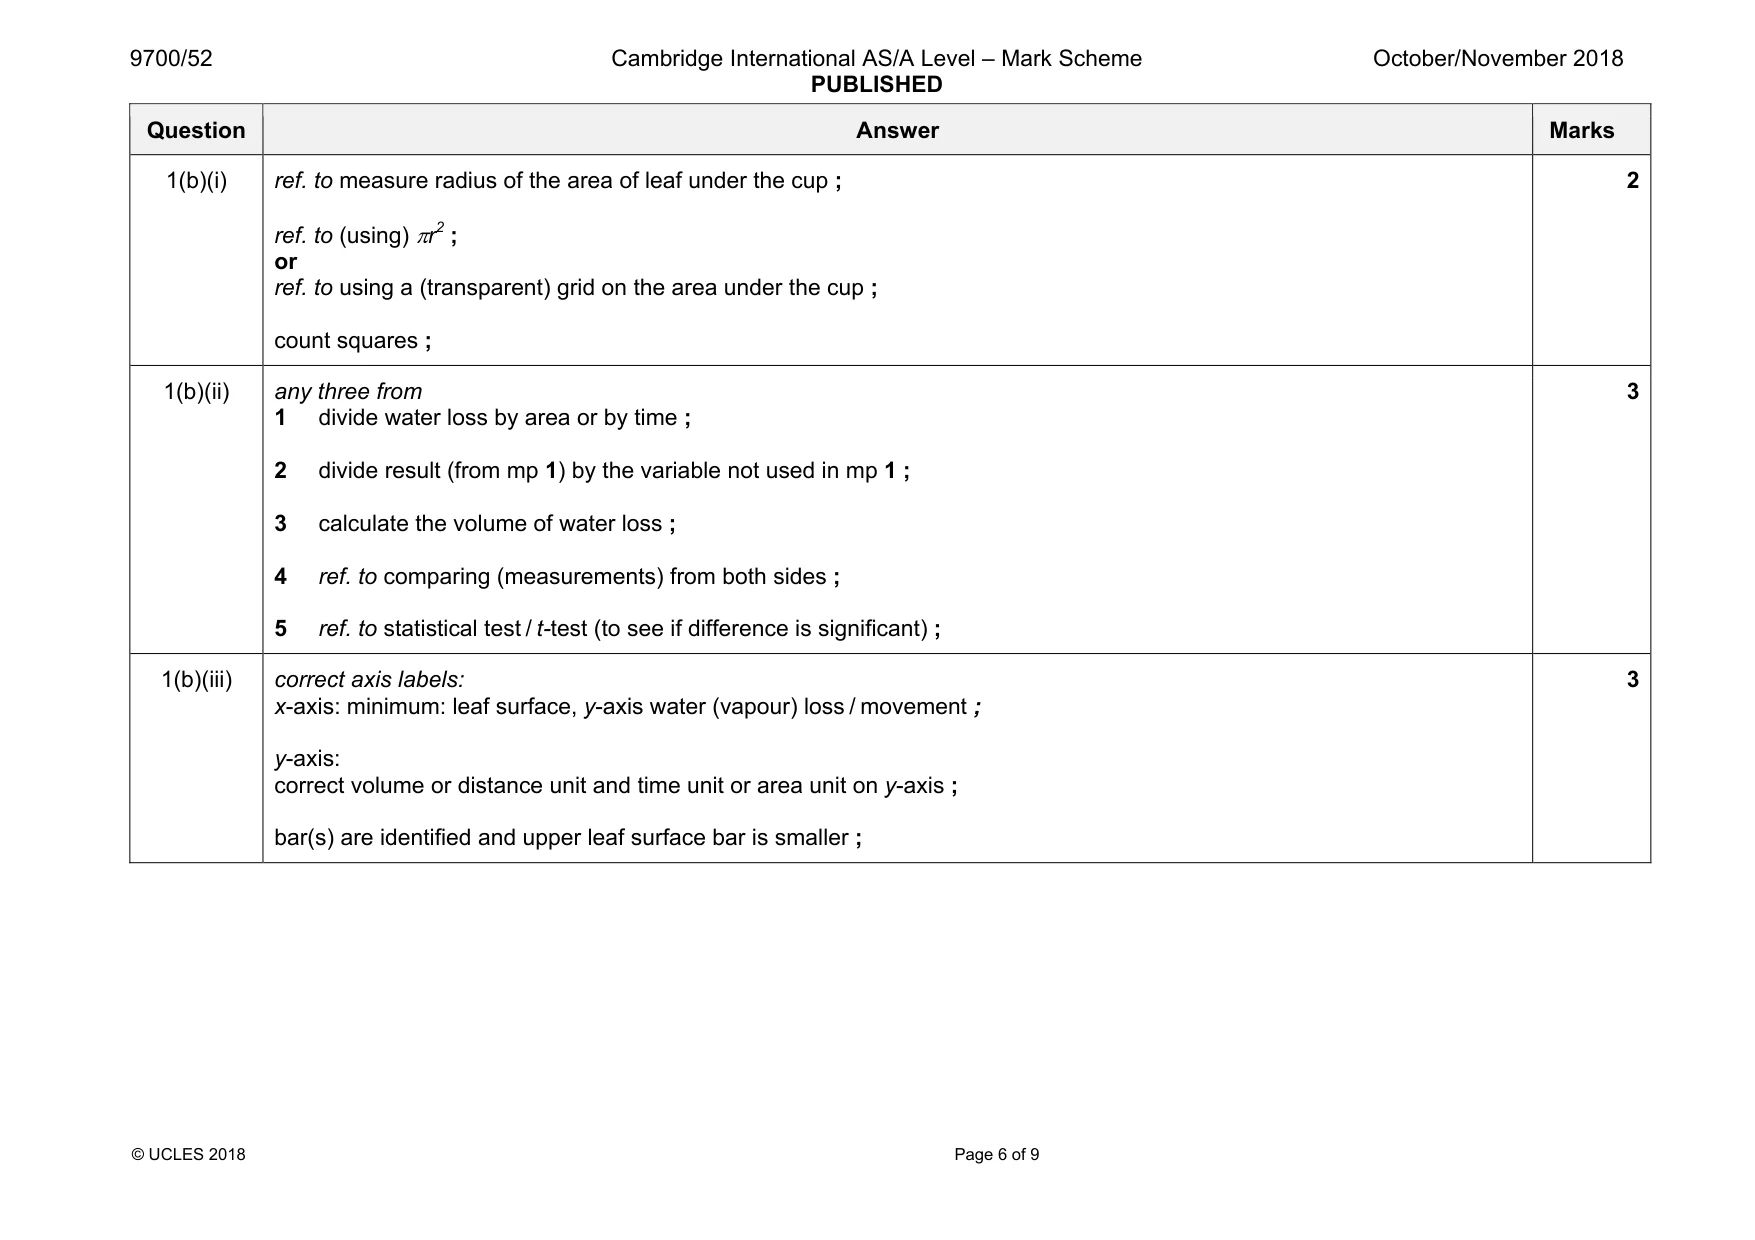
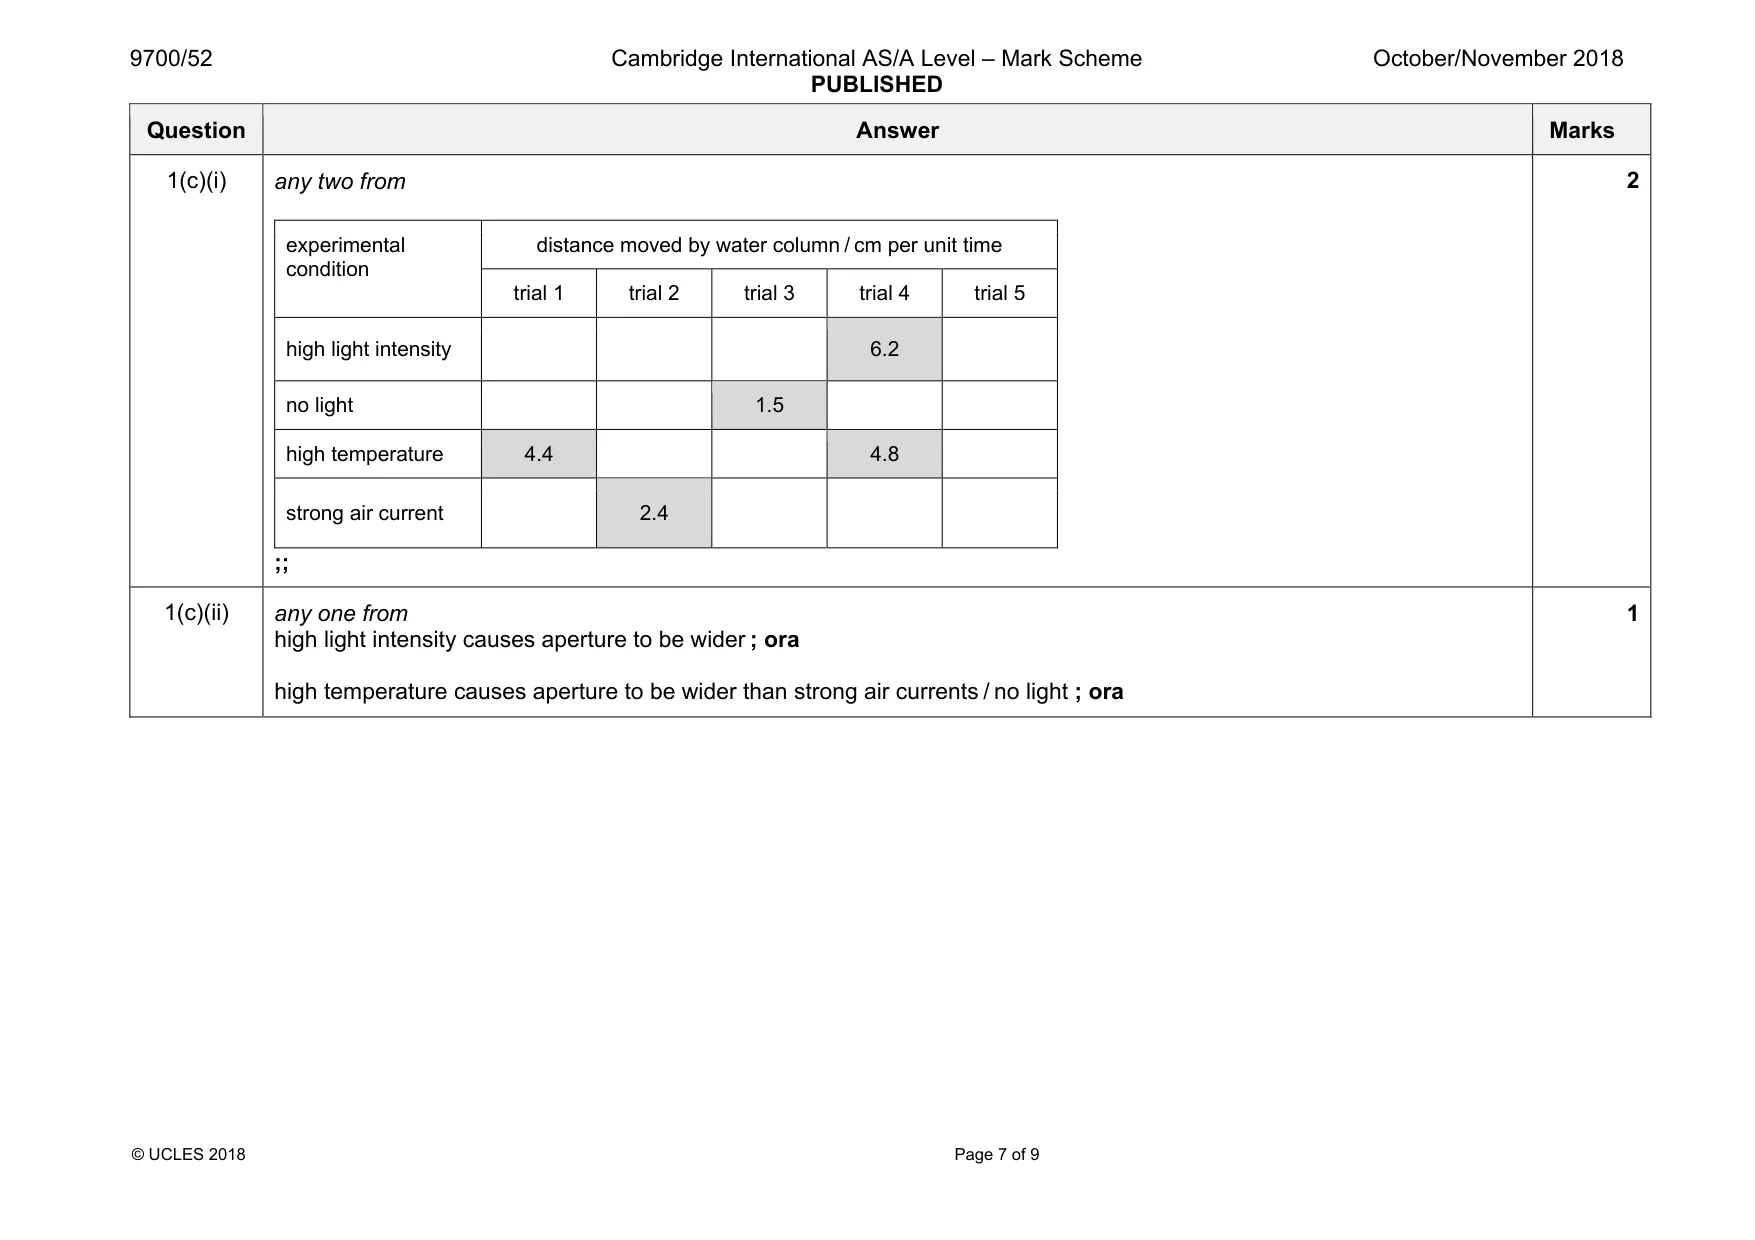
Mark scheme: 1(a)(i) independent variable the side / surface of the leaf ; dependent variable distance / how far the water moves (down) / the decrease (in volume) of the water in the graduated tube AW ; 2 1(a)(ii) any six from 1 ref. to cutting plant underwater / airtight seal on cup ; 2 use upper and lower surfaces ; 3 suck water into graduated tube and then close / attach clip ; 4 record the distance moved / volume change at start and end of a time ; standardised variables (mp 5 to mp 9) max 2 5 method of keeping same light (intensity) ; 6 method of keeping same temperature ; 7 same humidity ; 8 method of keeping same air flow ; 9 same leaf / type of leaf / species of leaf / use the same plant ; 10 idea of re-setting water level ; 11 to obtain at least 3 results for each leaf surface to obtain a mean / identify anomalies ; 12 low risk / medium risk experiment / stated risk and precaution ; 6 Question Answer Marks 1(b)(i) ref. to measure radius of the area of leaf under the cup ; ref. to (using) πr2 ; or ref. to using a (transparent) grid on the area under the cup ; count squares ; 2 1(b)(ii) any three from 1 divide water loss by area or by time ; 2 divide result (from mp 1) by the variable not used in mp 1 ; 3 calculate the volume of water loss ; 4 ref. to comparing (measurements) from both sides ; 5 ref. to statistical test / t-test (to see if difference is significant) ; 3 1(b)(iii) correct axis labels: x-axis: minimum: leaf surface, y-axis water (vapour) loss / movement ; y-axis: correct volume or distance unit and time unit or area unit on y-axis ; bar(s) are identified and upper leaf surface bar is smaller ; 3 Question Answer Marks 1(c)(i) any two from experimental condition distance moved by water column / cm per unit time trial 1 trial 2 trial 3 trial 4 trial 5 high light intensity 6.2 no light 1.5 high temperature 4.4 4.8 strong air current 2.4 ;; 2 1(c)(ii) any one from high light intensity causes aperture to be wider ; ora high temperature causes aperture to be wider than strong air currents / no light ; ora 1
Q2 · Antibiotic resistance of pathogenic bacteria is a worldwide cause for concern
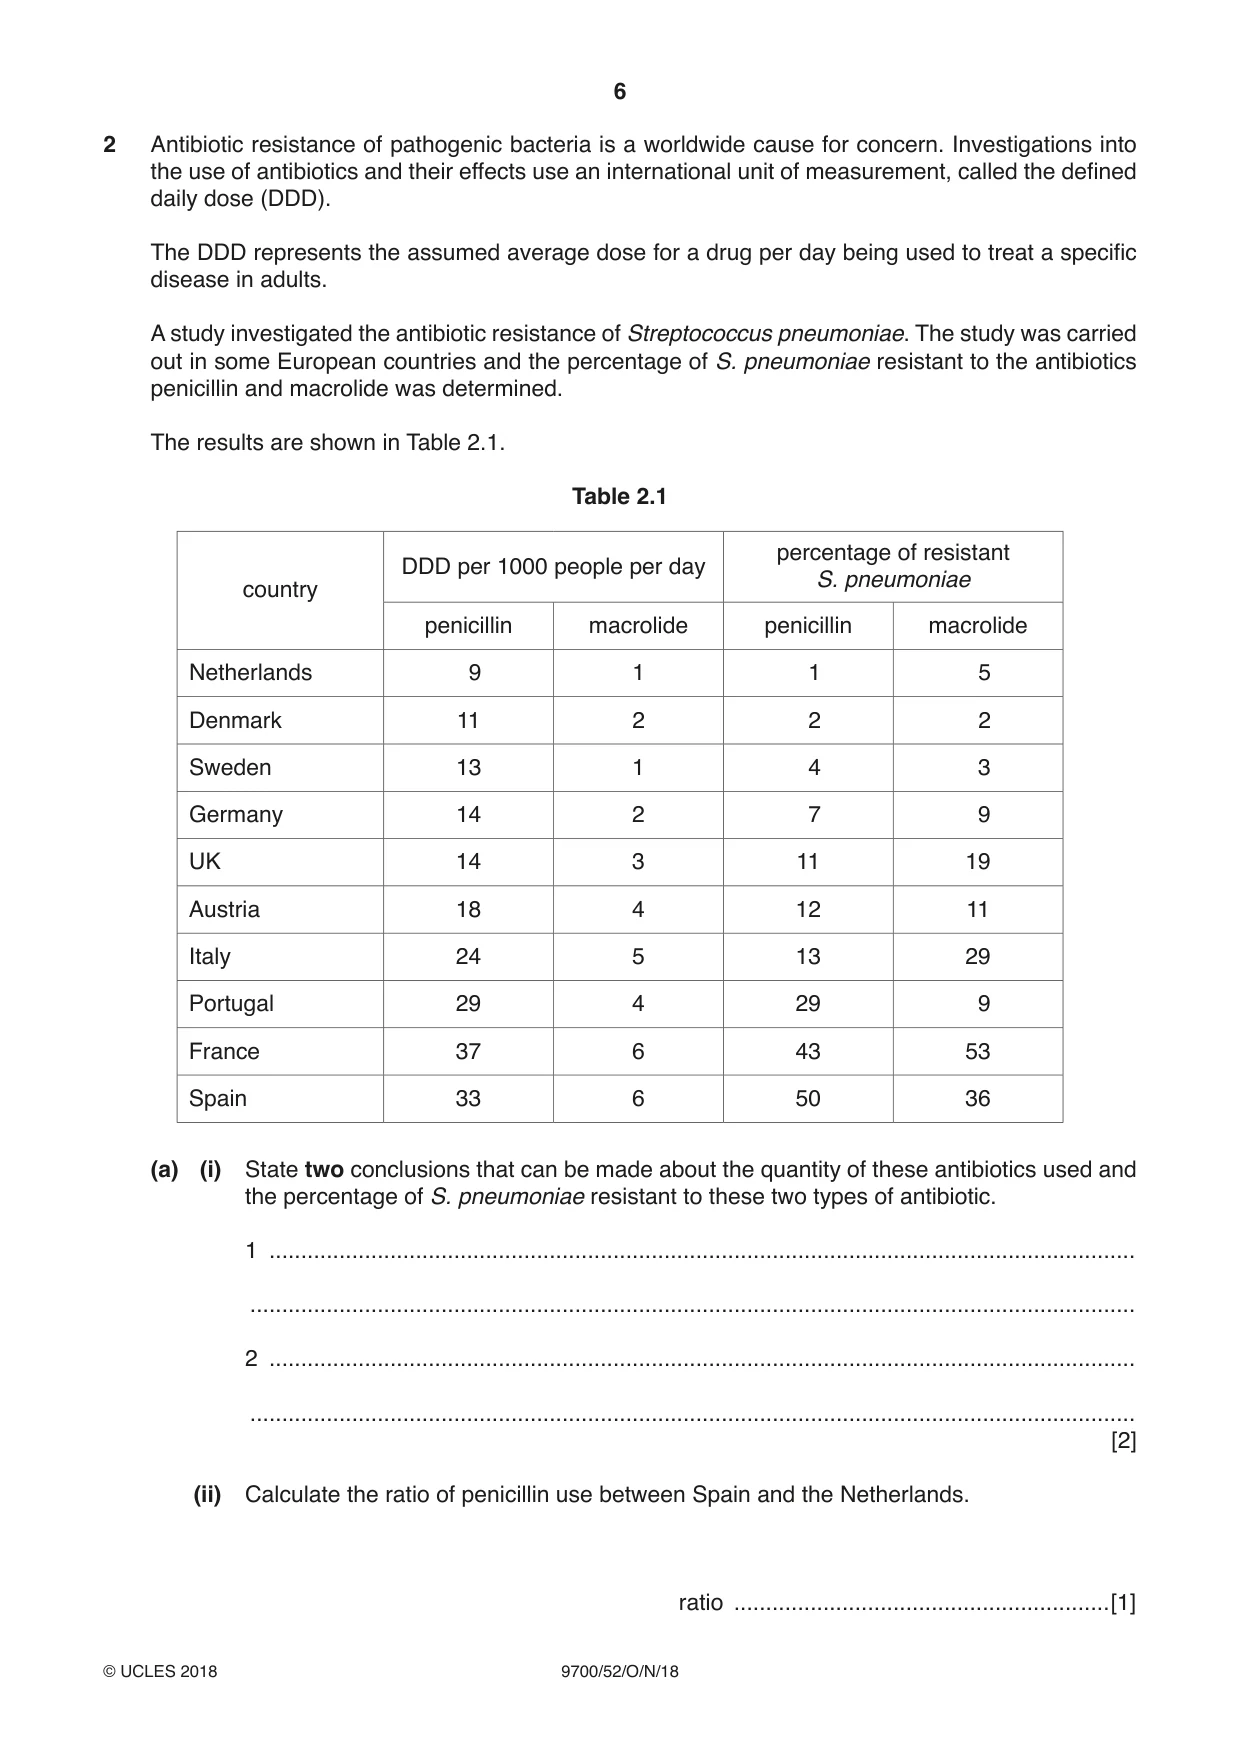
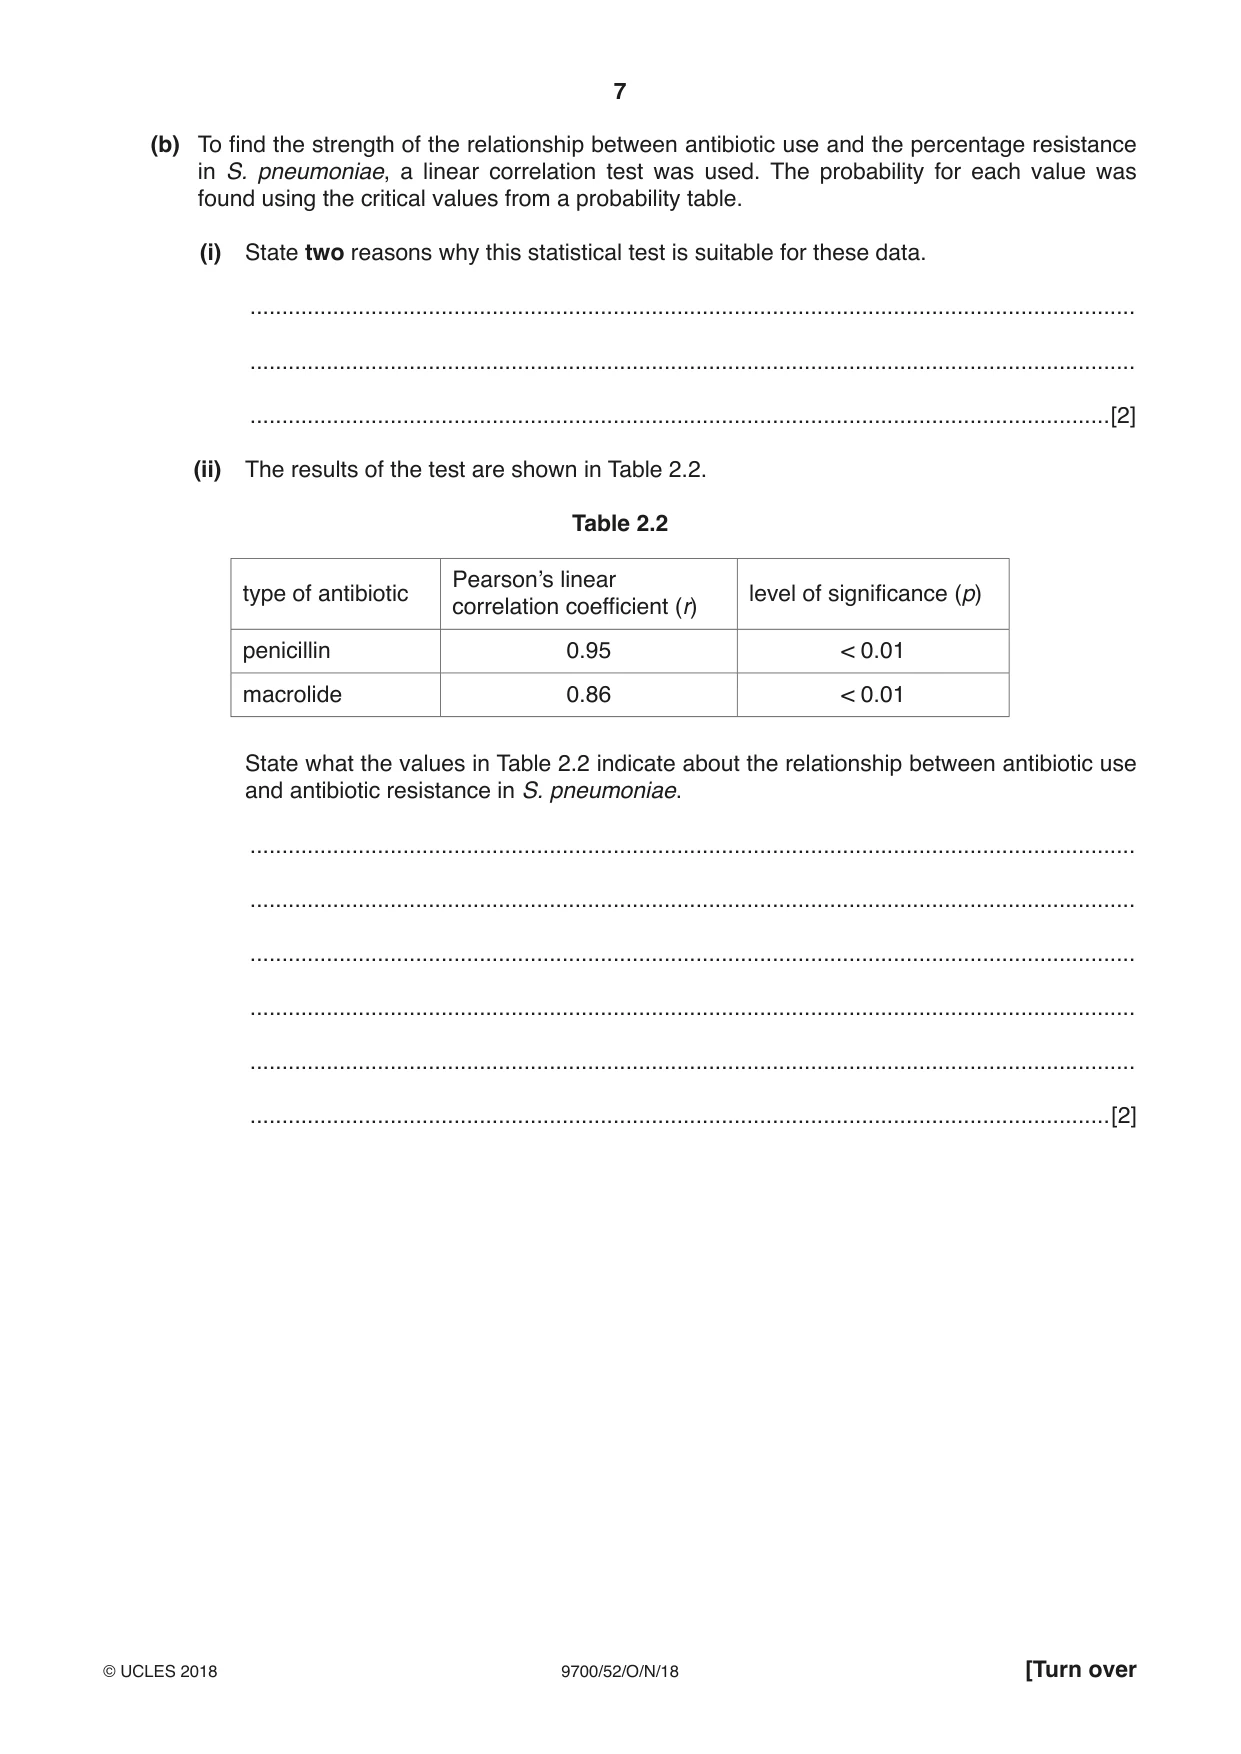
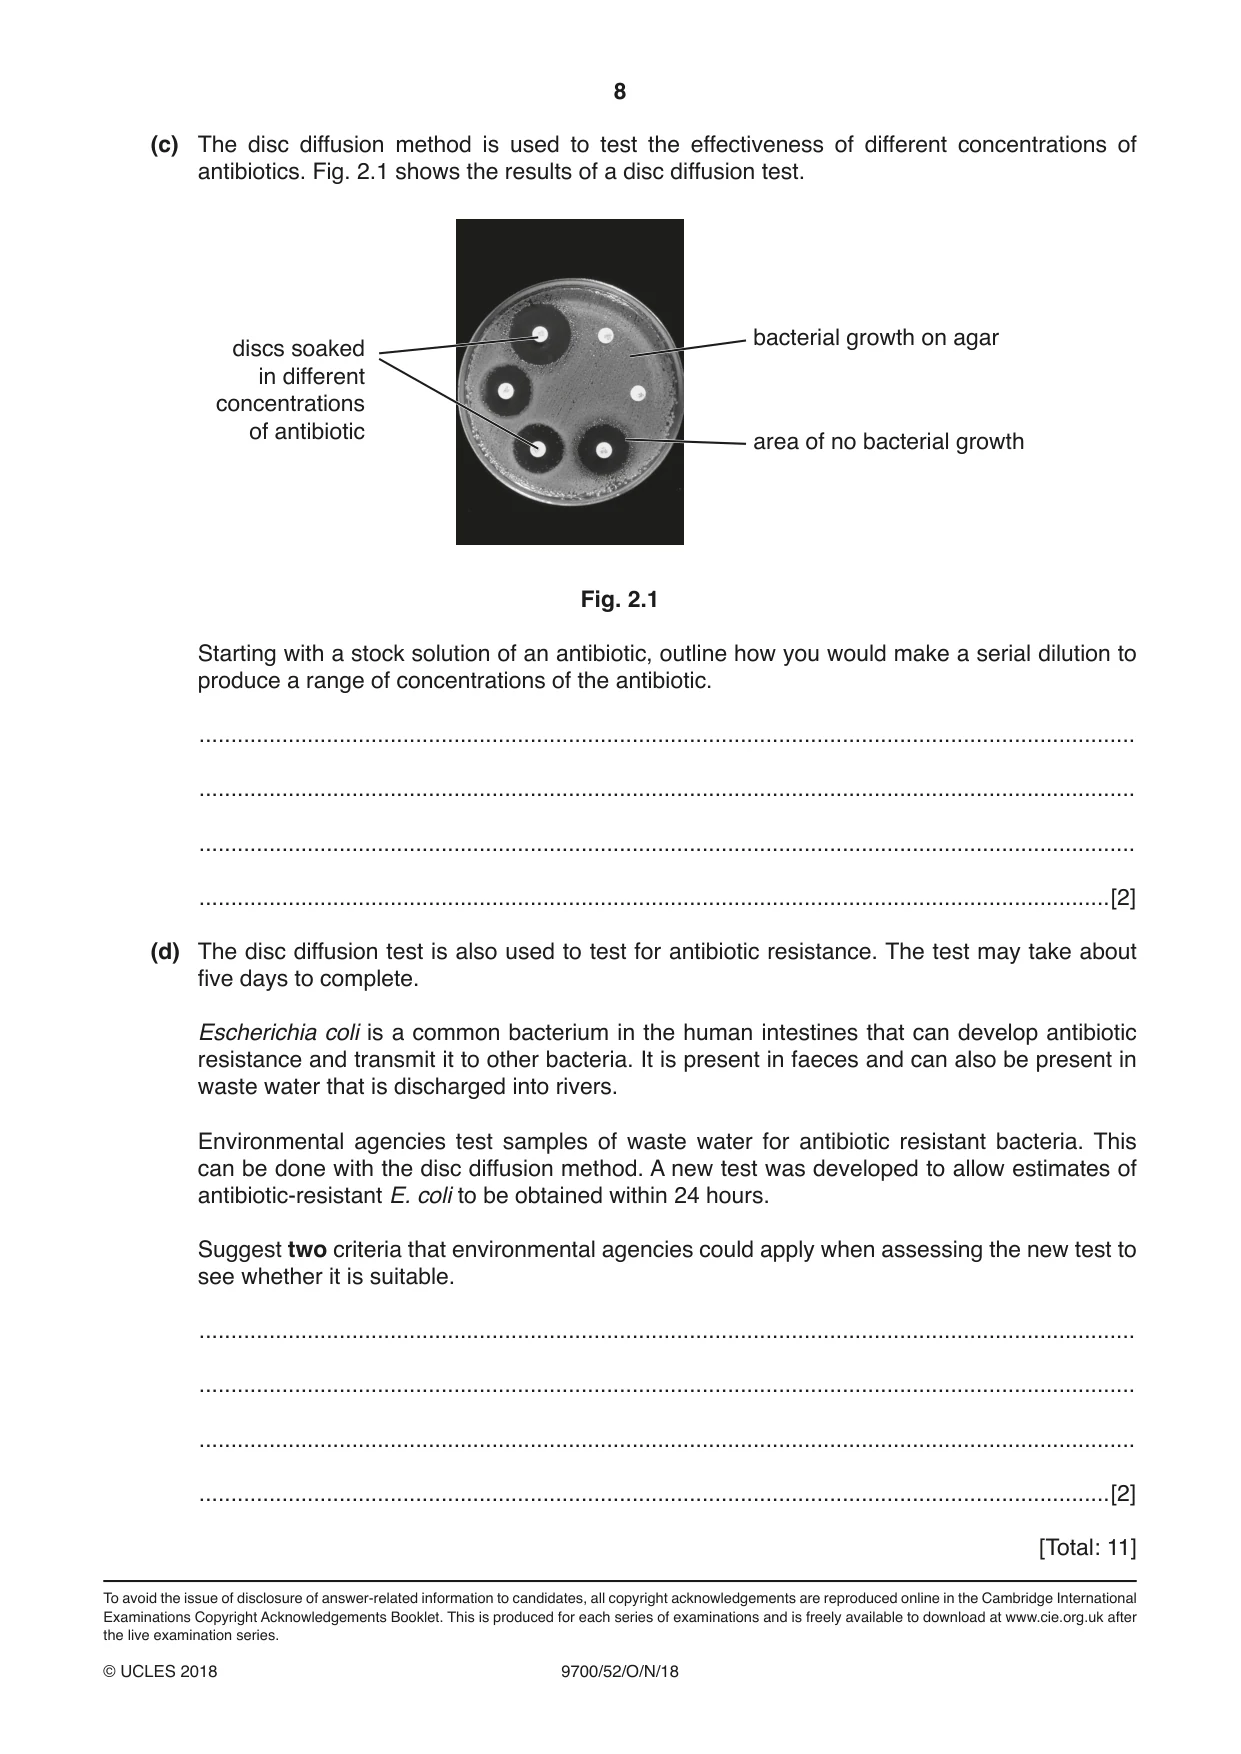
2 Antibiotic resistance of pathogenic bacteria is a worldwide cause for concern. Investigations into the use of antibiotics and their effects use an international unit of measurement, called the defined daily dose (DDD). The DDD represents the assumed average dose for a drug per day being used to treat a specific disease in adults. A study investigated the antibiotic resistance of Streptococcus pneumoniae. The study was carried out in some European countries and the percentage of S. pneumoniae resistant to the antibiotics penicillin and macrolide was determined. The results are shown in Table 2.1. Table 2.1 percentage of resistant DDD per 1000 people per day S. pneumoniae country penicillin macrolide penicillin macrolide Netherlands 9 1 1 5 Denmark 11 2 2 2 Sweden 13 1 4 3 Germany 14 2 7 9 UK 14 3 11 19 Austria 18 4 12 11 Italy 24 5 13 29 Portugal 29 4 29 9 France 37 6 43 53 Spain 33 6 50 36 (a) (i) State two conclusions that can be made about the quantity of these antibiotics used and the percentage of S. pneumoniae resistant to these two types of antibiotic. 1 ........................................................................................................................................ ........................................................................................................................................... 2 ........................................................................................................................................ ........................................................................................................................................... [2] (ii) Calculate the ratio of penicillin use between Spain and the Netherlands. ratio ...........................................................[1] (b) To find the strength of the relationship between antibiotic use and the percentage resistance in S. pneumoniae, a linear correlation test was used. The probability for each value was found using the critical values from a probability table. (i) State two reasons why this statistical test is suitable for these data. ........................................................................................................................................... ........................................................................................................................................... .......................................................................................................................................[2] (ii) The results of the test are shown in Table 2.2. Table 2.2 Pearson’s linear type of antibiotic level of significance (p) correlation coefficient (r) penicillin 0.95 < 0.01 macrolide 0.86 < 0.01 State what the values in Table 2.2 indicate about the relationship between antibiotic use and antibiotic resistance in S. pneumoniae. ........................................................................................................................................... ........................................................................................................................................... ........................................................................................................................................... ........................................................................................................................................... ........................................................................................................................................... .......................................................................................................................................[2] (c) The disc diffusion method is used to test the effectiveness of different concentrations of antibiotics. Fig. 2.1 shows the results of a disc diffusion test. bacterial growth on agar discs soaked in different concentrations of antibiotic area of no bacterial growth Fig. 2.1 Starting with a stock solution of an antibiotic, outline how you would make a serial dilution to produce a range of concentrations of the antibiotic. ................................................................................................................................................... ................................................................................................................................................... ................................................................................................................................................... ...............................................................................................................................................[2] (d) The disc diffusion test is also used to test for antibiotic resistance. The test may take about five days to complete. Escherichia coli is a common bacterium in the human intestines that can develop antibiotic resistance and transmit it to other bacteria. It is present in faeces and can also be present in waste water that is discharged into rivers. Environmental agencies test samples of waste water for antibiotic resistant bacteria. This can be done with the disc diffusion method. A new test was developed to allow estimates of antibiotic-resistant E. coli to be obtained within 24 hours. Suggest two criteria that environmental agencies could apply when assessing the new test to see whether it is suitable. ................................................................................................................................................... ................................................................................................................................................... ................................................................................................................................................... ...............................................................................................................................................[2] [Total: 11]
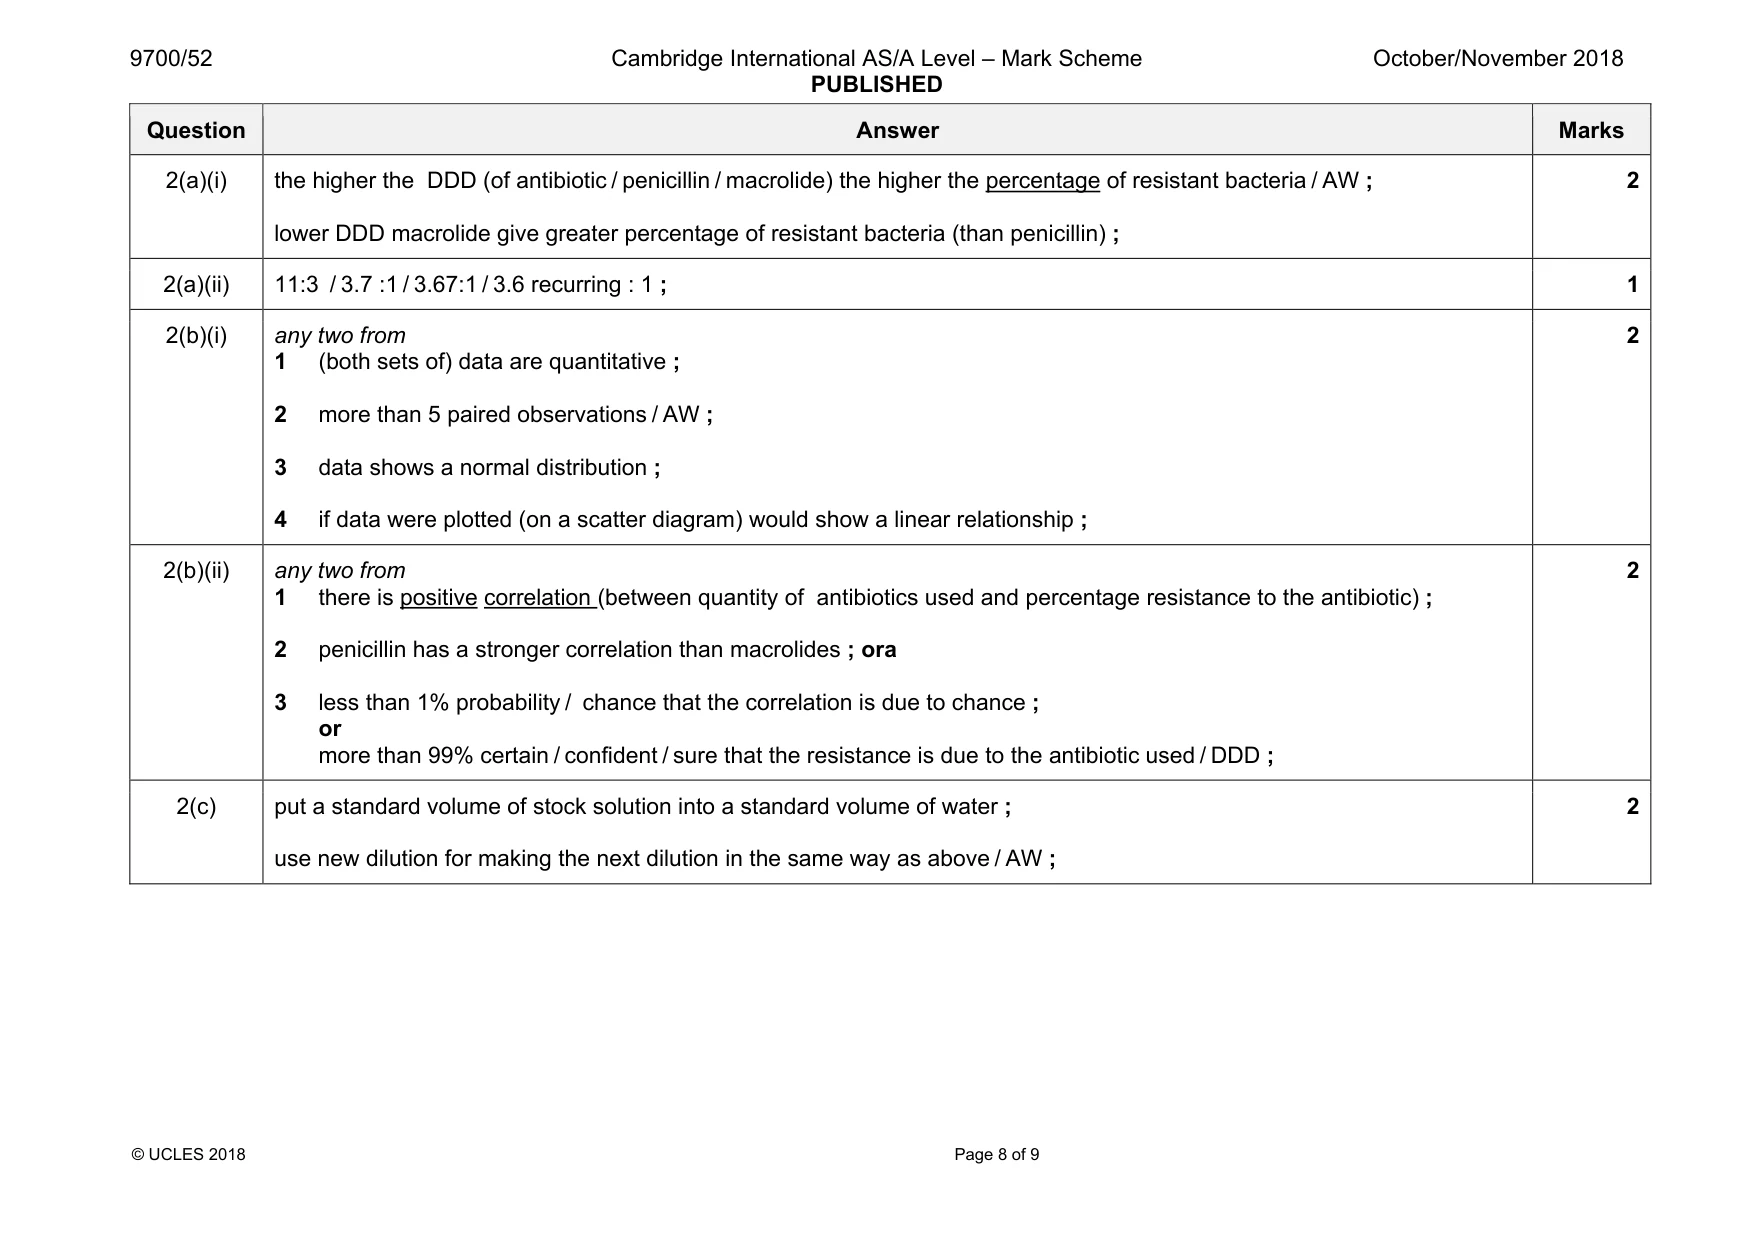
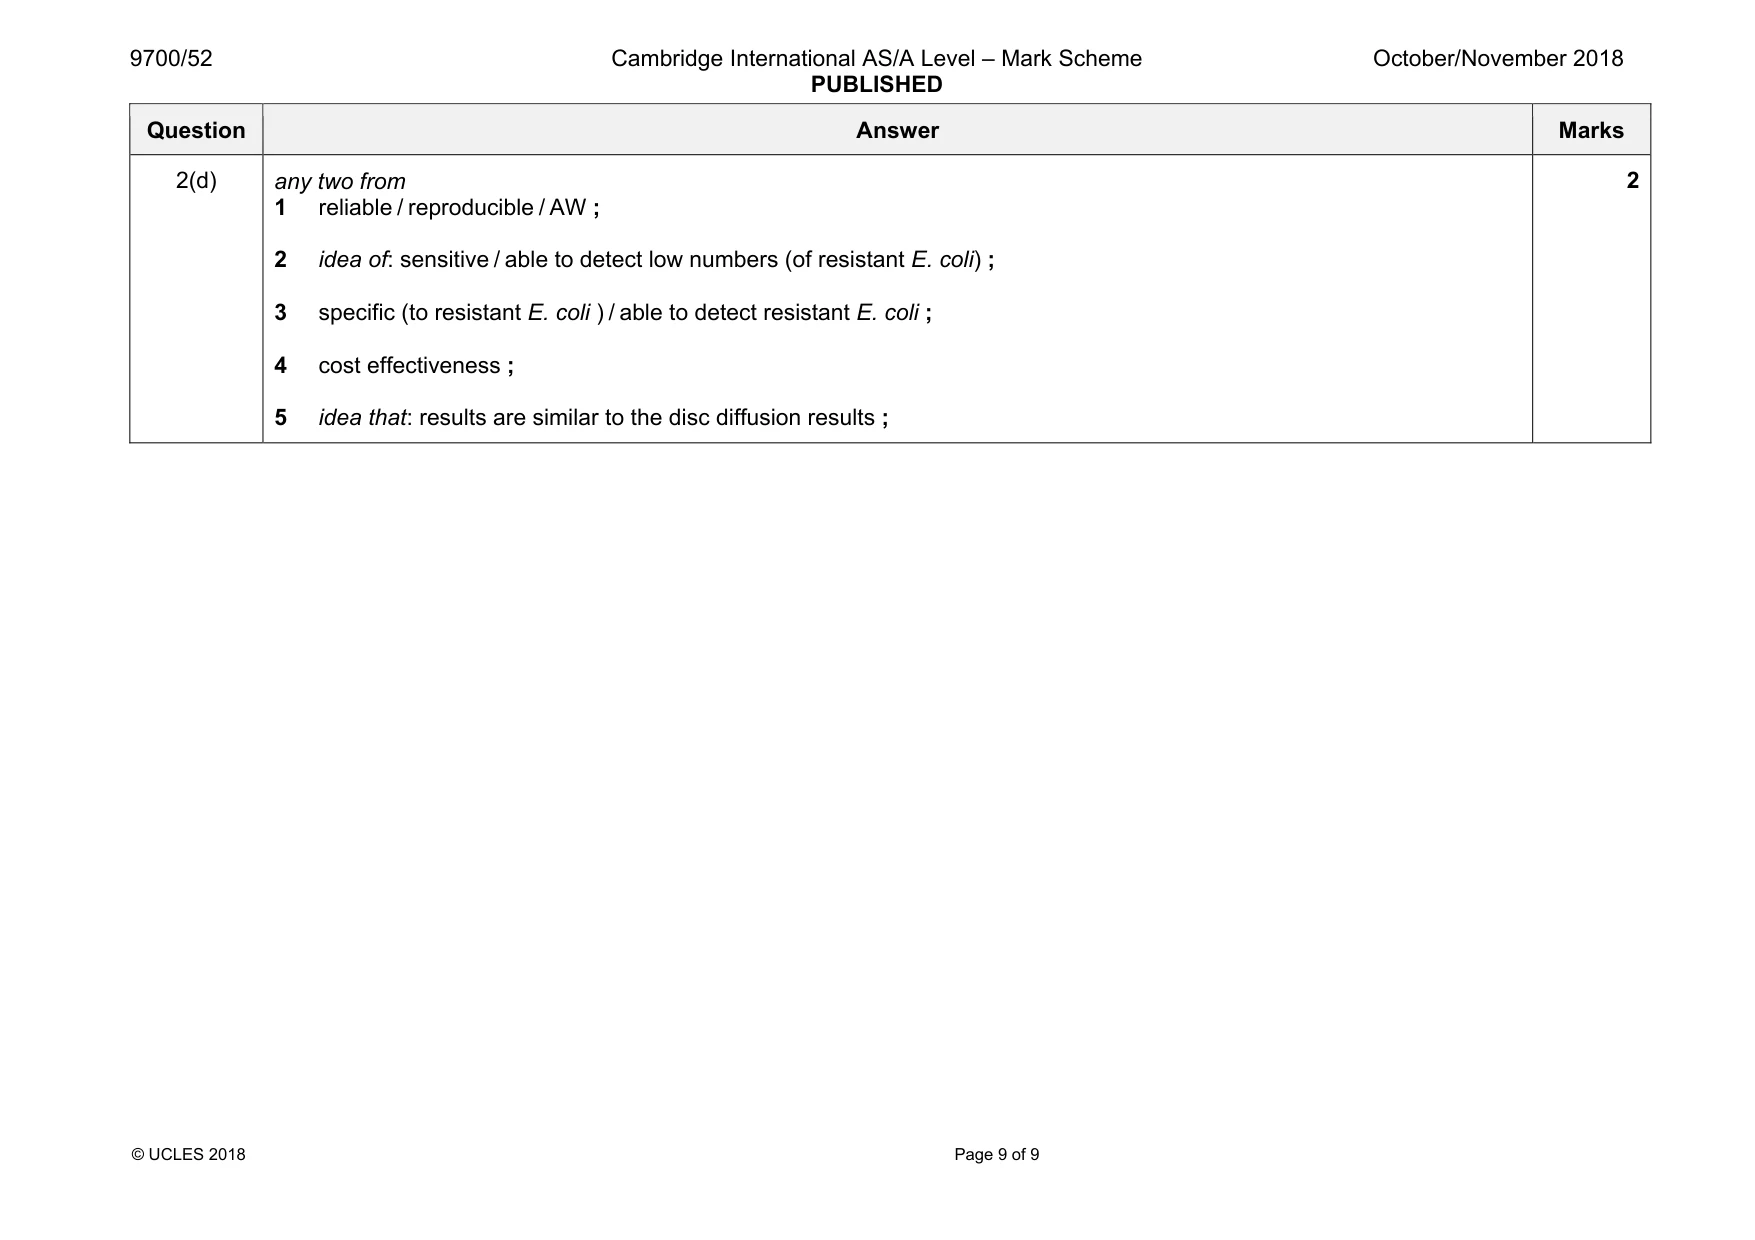
Mark scheme: 2(a)(i) the higher the DDD (of antibiotic / penicillin / macrolide) the higher the percentage of resistant bacteria / AW ; lower DDD macrolide give greater percentage of resistant bacteria (than penicillin) ; 2 2(a)(ii) 11:3 / 3.7 :1 / 3.67:1 / 3.6 recurring : 1 ; 1 2(b)(i) any two from 1 (both sets of) data are quantitative ; 2 more than 5 paired observations / AW ; 3 data shows a normal distribution ; 4 if data were plotted (on a scatter diagram) would show a linear relationship ; 2 2(b)(ii) any two from 1 there is positive correlation (between quantity of antibiotics used and percentage resistance to the antibiotic) ; 2 penicillin has a stronger correlation than macrolides ; ora 3 less than 1% probability / chance that the correlation is due to chance ; or more than 99% certain / confident / sure that the resistance is due to the antibiotic used / DDD ; 2 2(c) put a standard volume of stock solution into a standard volume of water ; use new dilution for making the next dilution in the same way as above / AW ; 2 Question Answer Marks 2(d) any two from 1 reliable / reproducible / AW ; 2 idea of: sensitive / able to detect low numbers (of resistant E. coli) ; 3 specific (to resistant E. coli ) / able to detect resistant E. coli ; 4 cost effectiveness ; 5 idea that: results are similar to the disc diffusion results ; 2
What was in this paper
The subtopics covered by these 2 questions, and how many questions each got. Open one in a new tab to see every Cambridge question on it.
What you needed in this session
Cambridge’s own grade thresholds for 2018 Oct/Nov, Paper 5 · Variant 2. A higher threshold means an easier paper — the bar moves with how the cohort did.