Cambridge A Level Biology 9700 — 2018 Oct/Nov Paper 5 · Variant 3
9700/53/O/N/18 · 2 questions · 30 marks · ≈34 min
The question paper and its mark scheme, free to read here and free to download. This is Cambridge’s own paper, exactly as it was sat.
Question paper12 pages



Mark scheme9 pages
Answers below. Sit the paper first if you are practising.

Questions as text
Q1 · Transpiration in plants can be investigated using a potometer, which measures water…
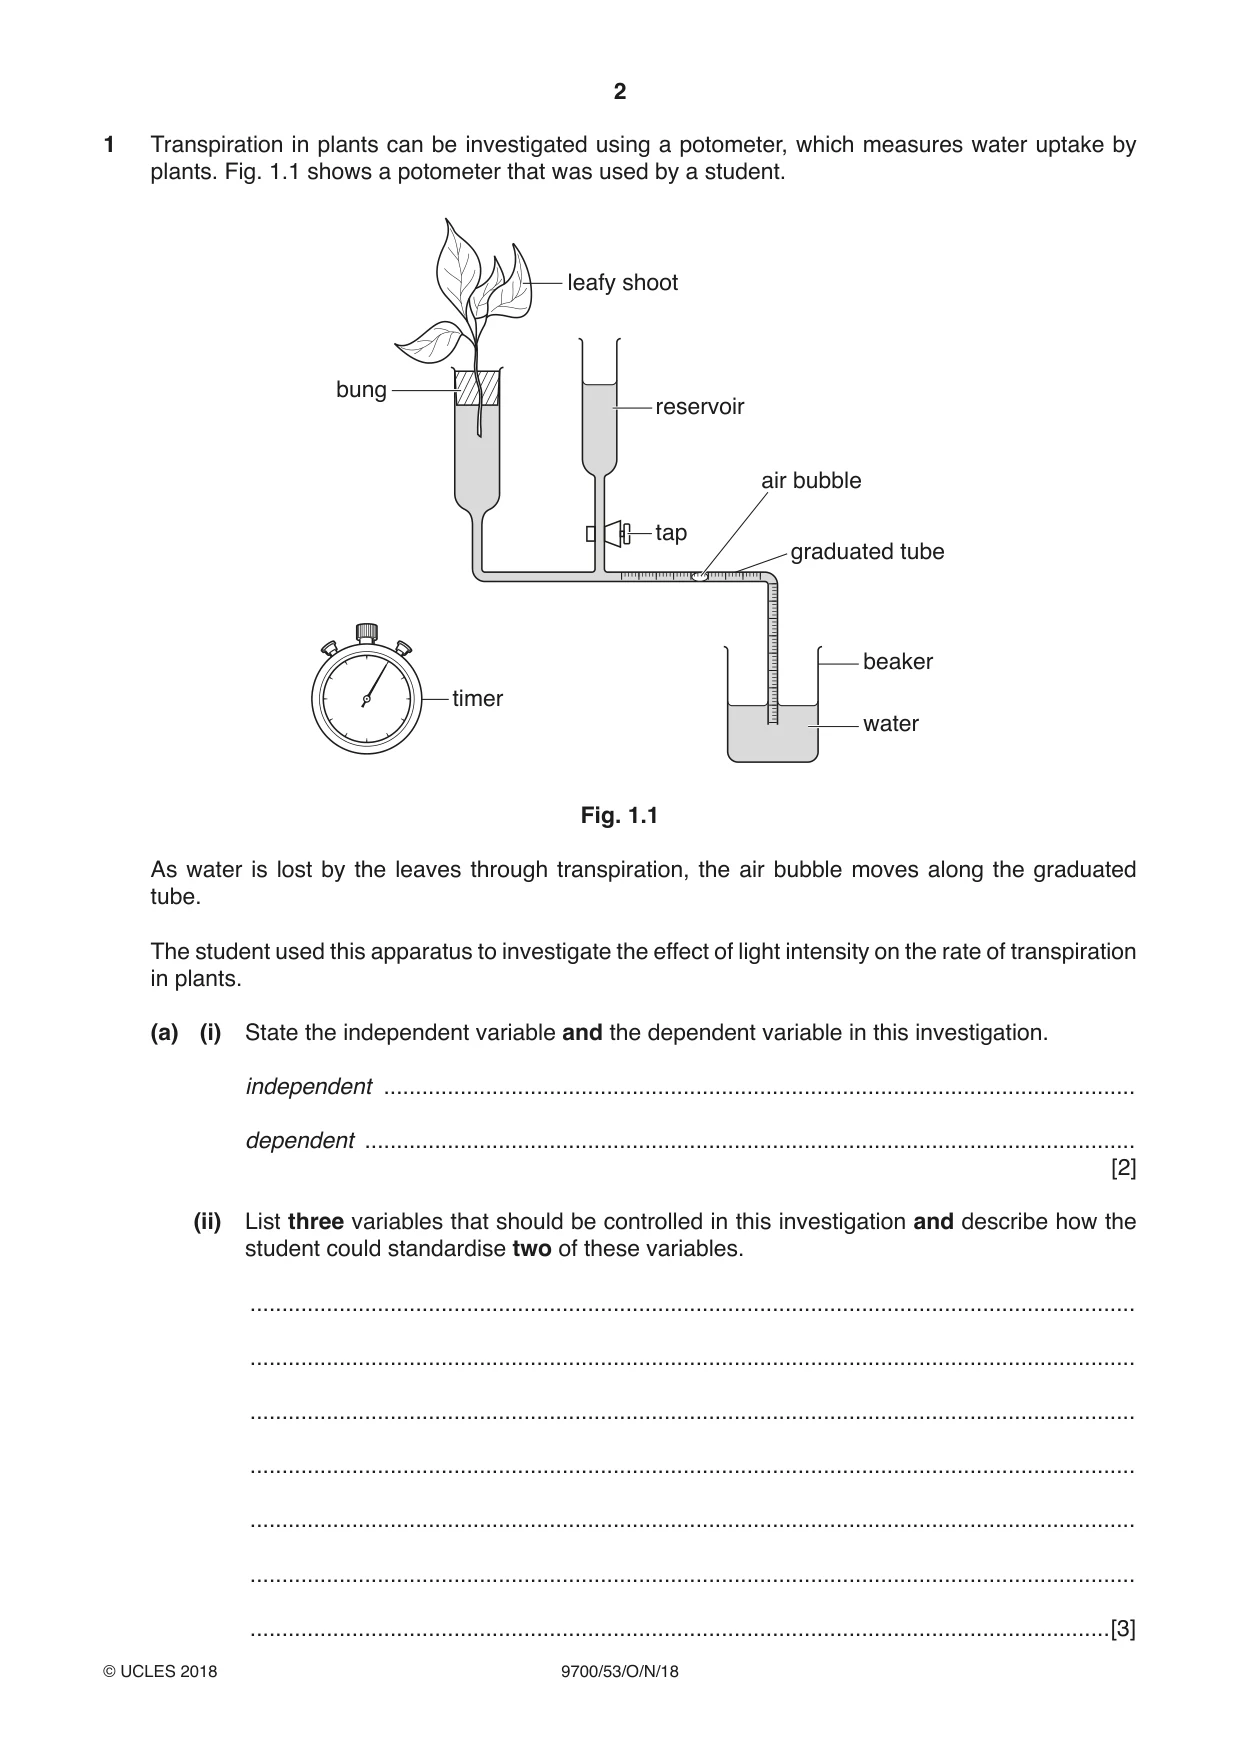
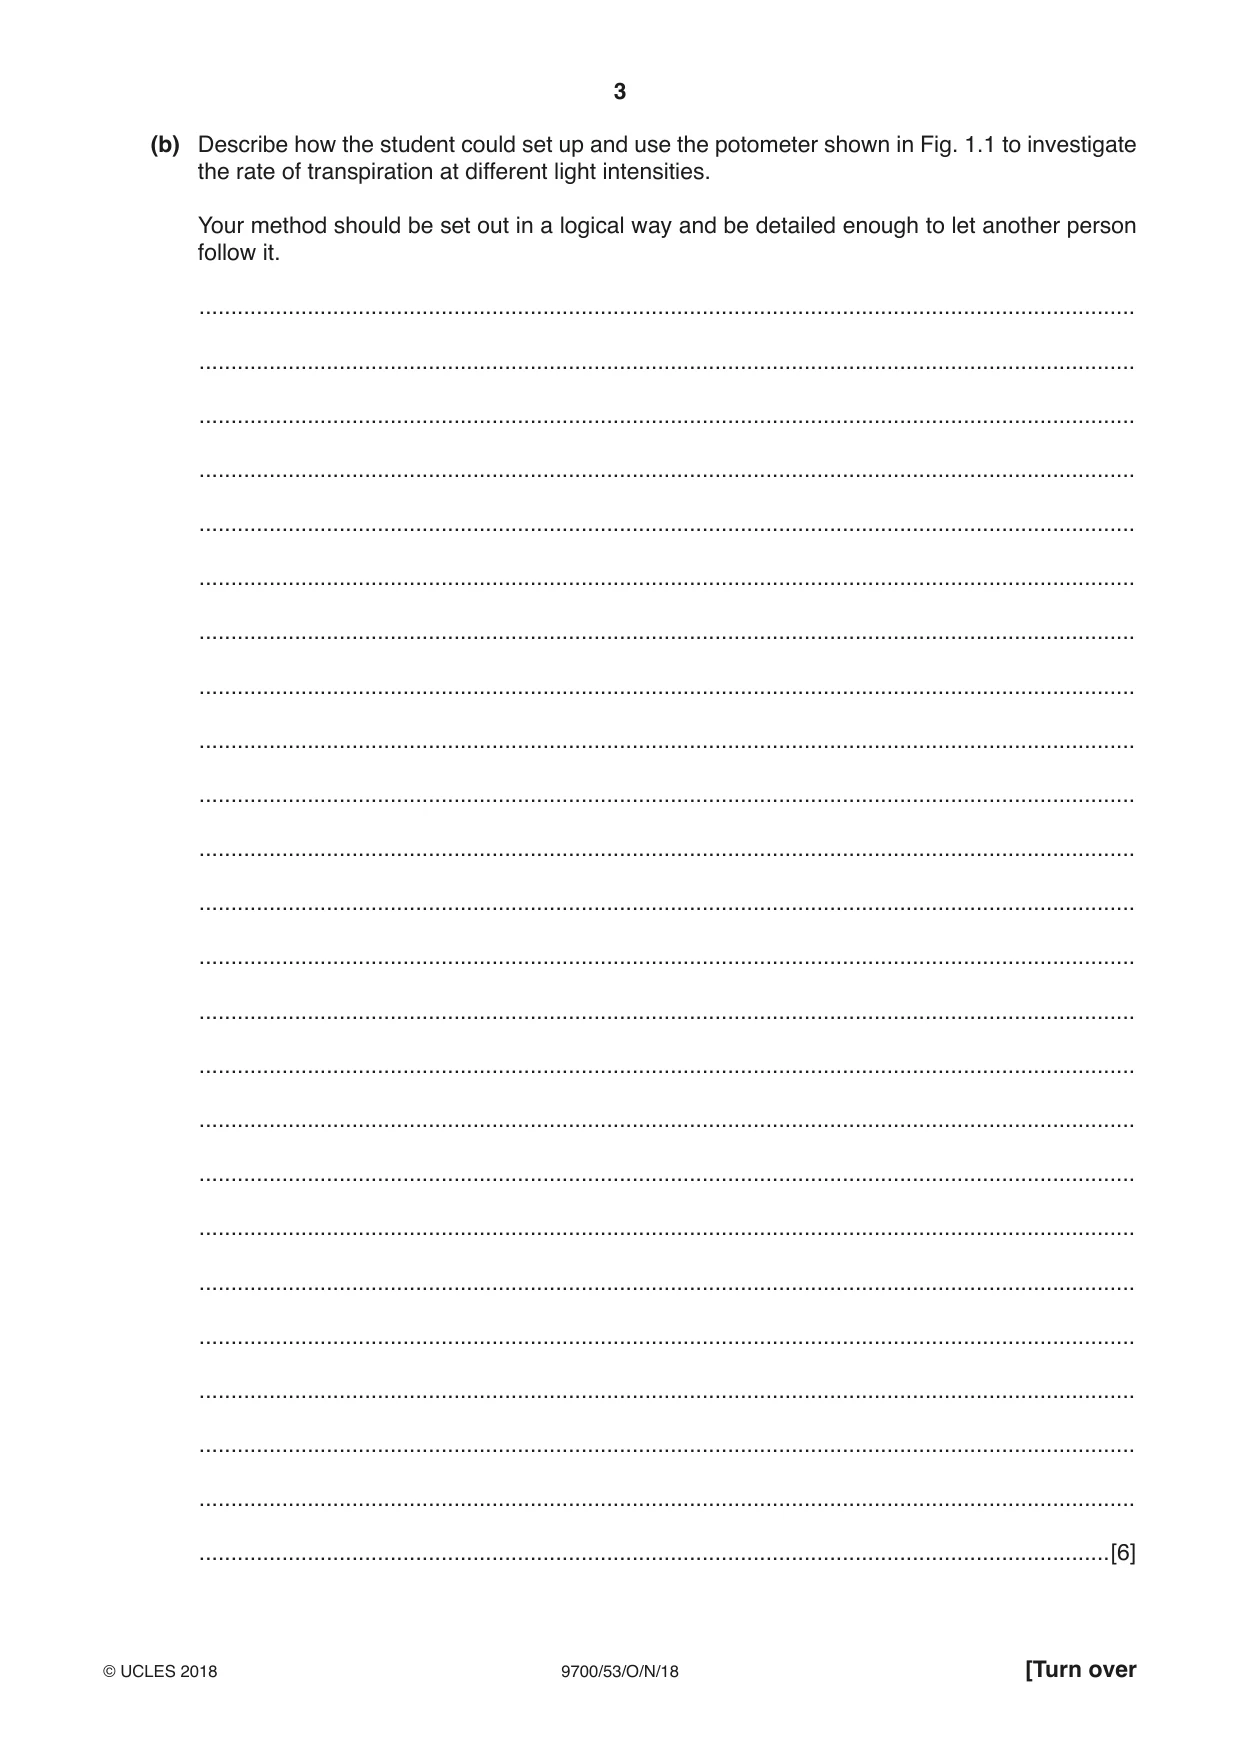
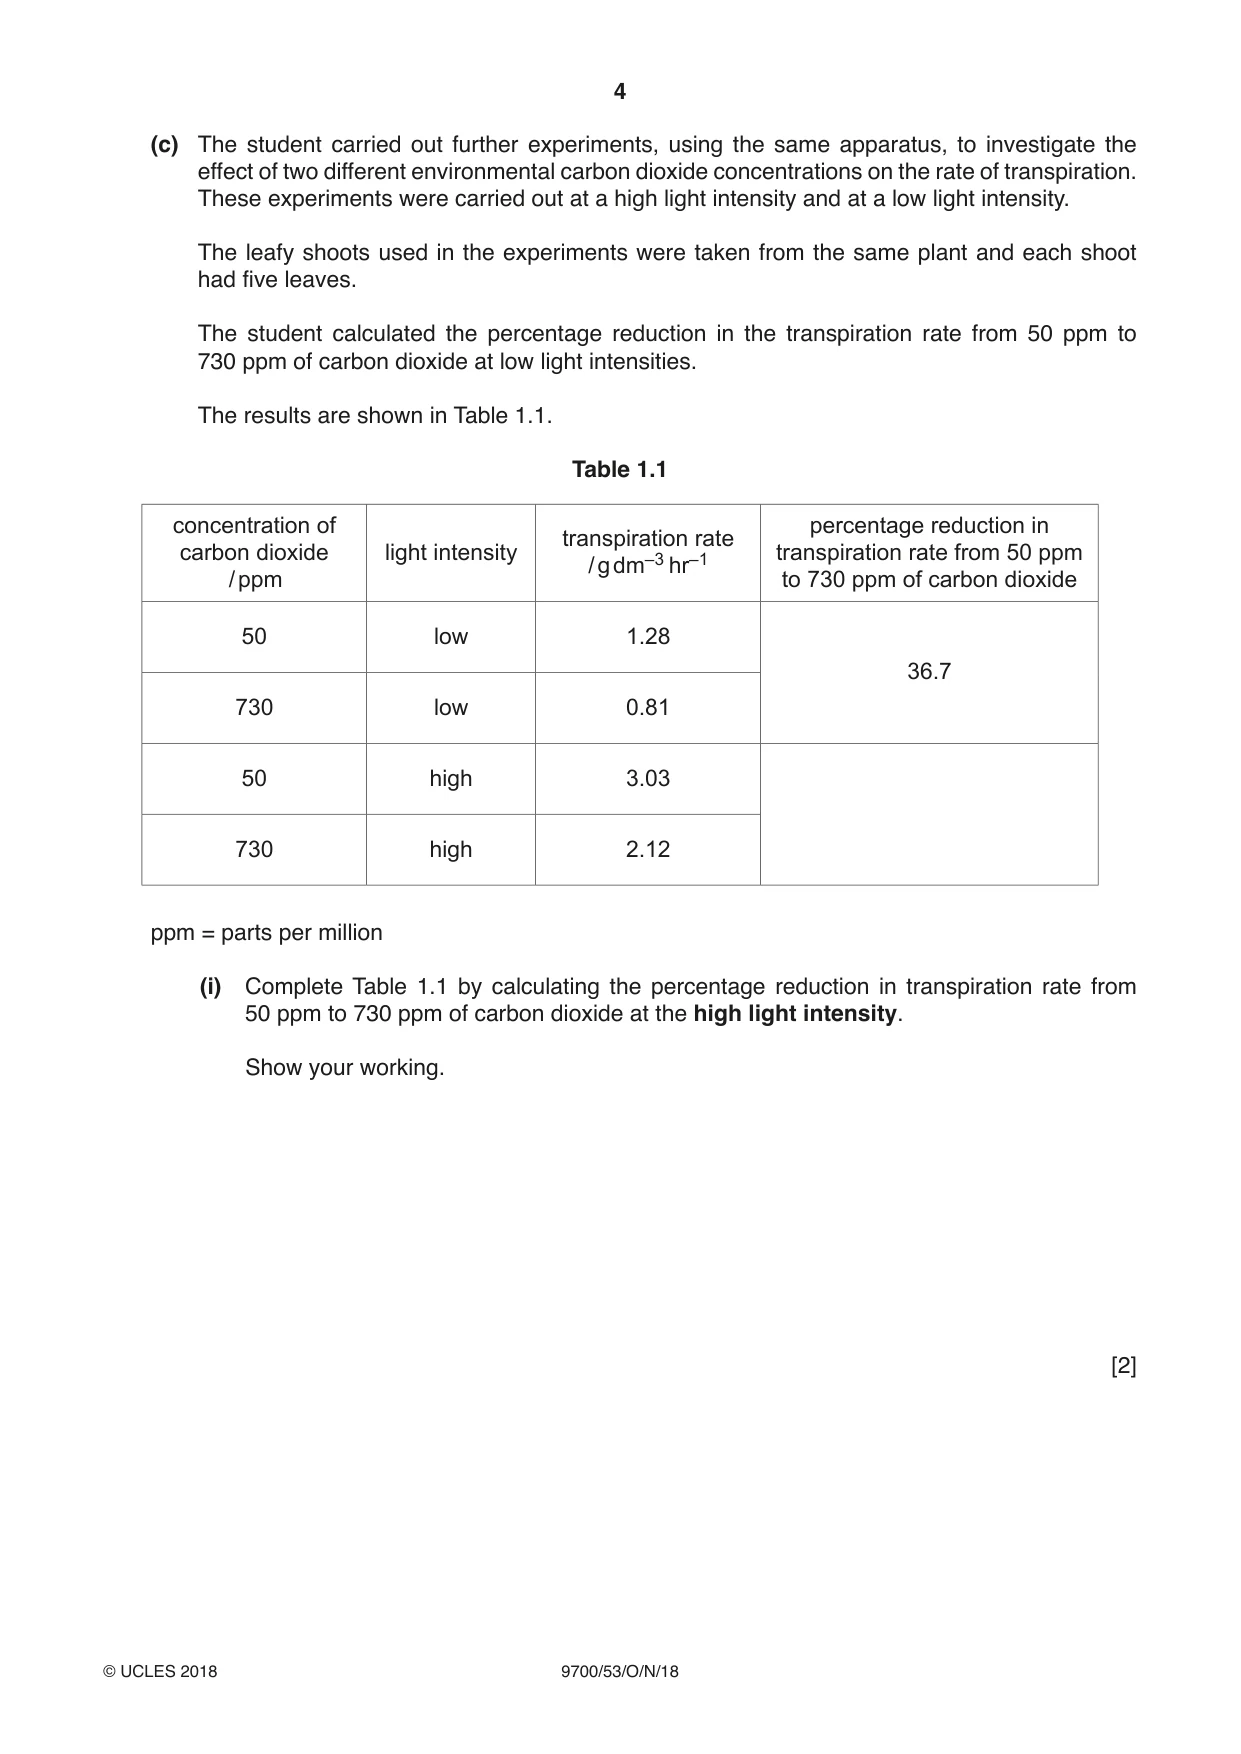
1 Transpiration in plants can be investigated using a potometer, which measures water uptake by plants. Fig. 1.1 shows a potometer that was used by a student. leafy shoot bung reservoir air bubble tap graduated tube beaker timer water Fig. 1.1 As water is lost by the leaves through transpiration, the air bubble moves along the graduated tube. The student used this apparatus to investigate the effect of light intensity on the rate of transpiration in plants. (a) (i) State the independent variable and the dependent variable in this investigation. independent ...................................................................................................................... dependent ......................................................................................................................... [2] (ii) List three variables that should be controlled in this investigation and describe how the student could standardise two of these variables. ........................................................................................................................................... ........................................................................................................................................... ........................................................................................................................................... ........................................................................................................................................... ........................................................................................................................................... ........................................................................................................................................... .......................................................................................................................................[3] (b) Describe how the student could set up and use the potometer shown in Fig. 1.1 to investigate the rate of transpiration at different light intensities. Your method should be set out in a logical way and be detailed enough to let another person follow it. ................................................................................................................................................... ................................................................................................................................................... ................................................................................................................................................... ................................................................................................................................................... ................................................................................................................................................... ................................................................................................................................................... ................................................................................................................................................... ................................................................................................................................................... ................................................................................................................................................... ................................................................................................................................................... ................................................................................................................................................... ................................................................................................................................................... ................................................................................................................................................... ................................................................................................................................................... ................................................................................................................................................... ................................................................................................................................................... ................................................................................................................................................... ................................................................................................................................................... ................................................................................................................................................... ................................................................................................................................................... ................................................................................................................................................... ................................................................................................................................................... ................................................................................................................................................... ...............................................................................................................................................[6] (c) The student carried out further experiments, using the same apparatus, to investigate the effect of two different environmental carbon dioxide concentrations on the rate of transpiration. These experiments were carried out at a high light intensity and at a low light intensity. The leafy shoots used in the experiments were taken from the same plant and each shoot had five leaves. The student calculated the percentage reduction in the transpiration rate from 50 ppm to 730 ppm of carbon dioxide at low light intensities. The results are shown in Table 1.1. Table 1.1 concentration of percentage reduction in transpiration rate carbon dioxide light intensity transpiration rate from 50 ppm / g dm–3 hr–1 / ppm to 730 ppm of carbon dioxide 50 low 1.28 36.7 730 low 0.81 50 high 3.03 730 high 2.12 ppm = parts per million (i) Complete Table 1.1 by calculating the percentage reduction in transpiration rate from 50 ppm to 730 ppm of carbon dioxide at the high light intensity. Show your working. [2] (ii) The student concluded that, as carbon dioxide concentration increased, the transpiration rate in plants decreased at all light intensities. Explain why this conclusion may not be valid. ........................................................................................................................................... ........................................................................................................................................... ........................................................................................................................................... ........................................................................................................................................... .......................................................................................................................................[2] [Total: 15]
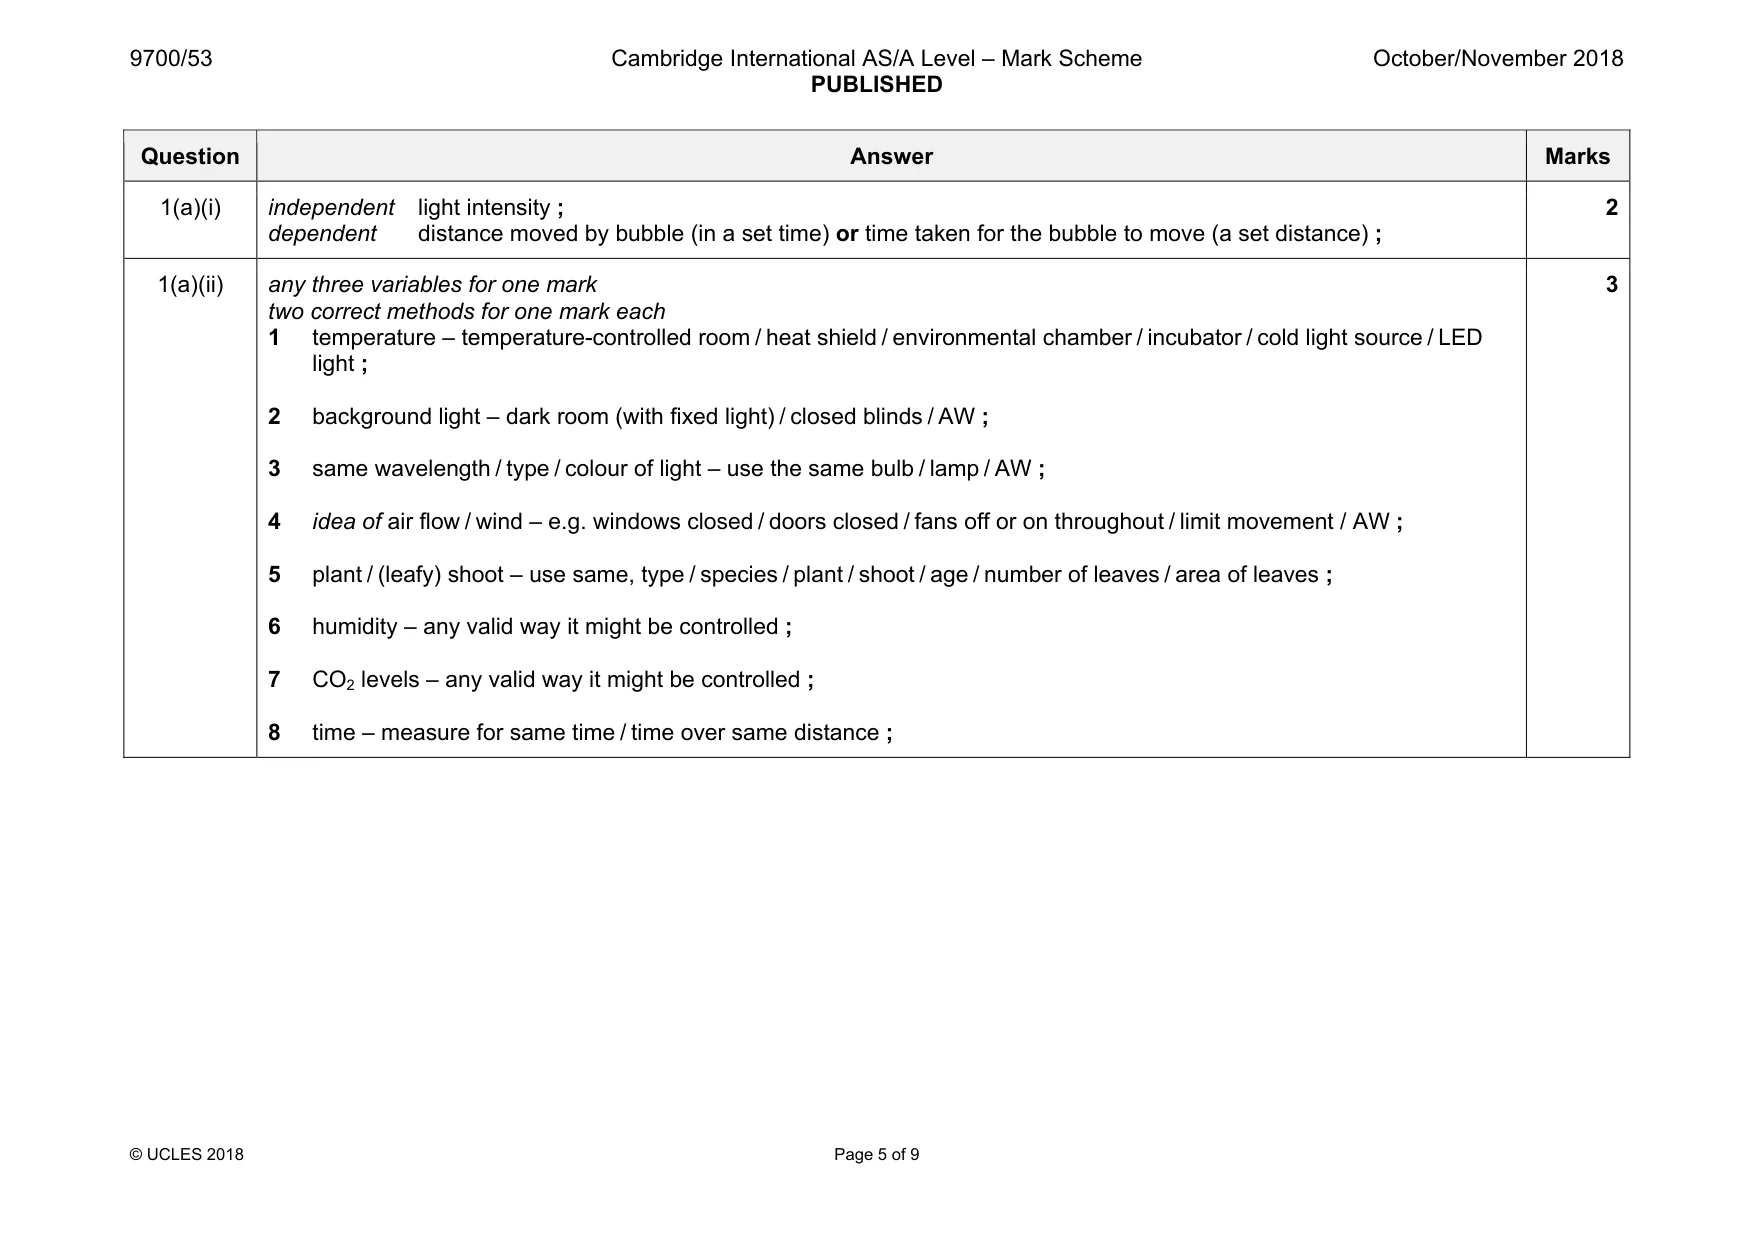
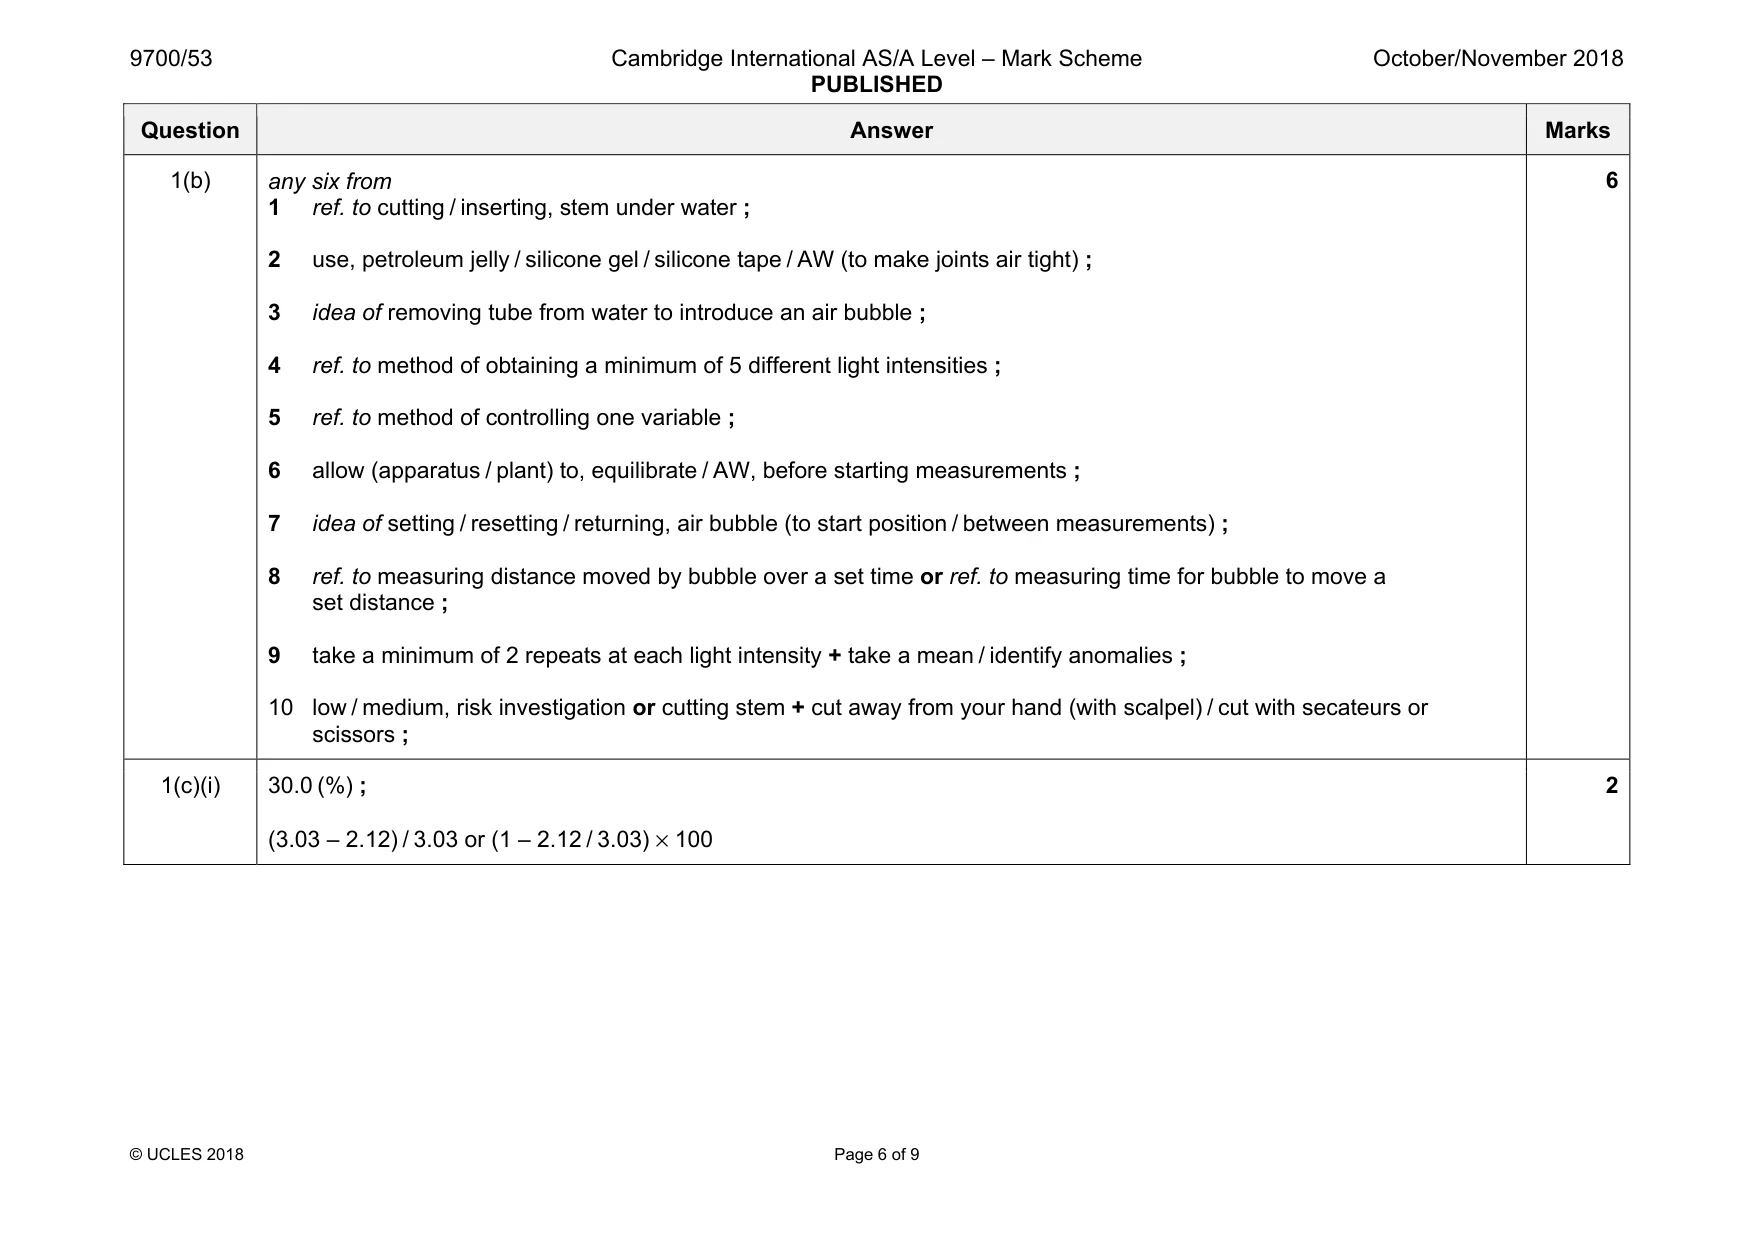
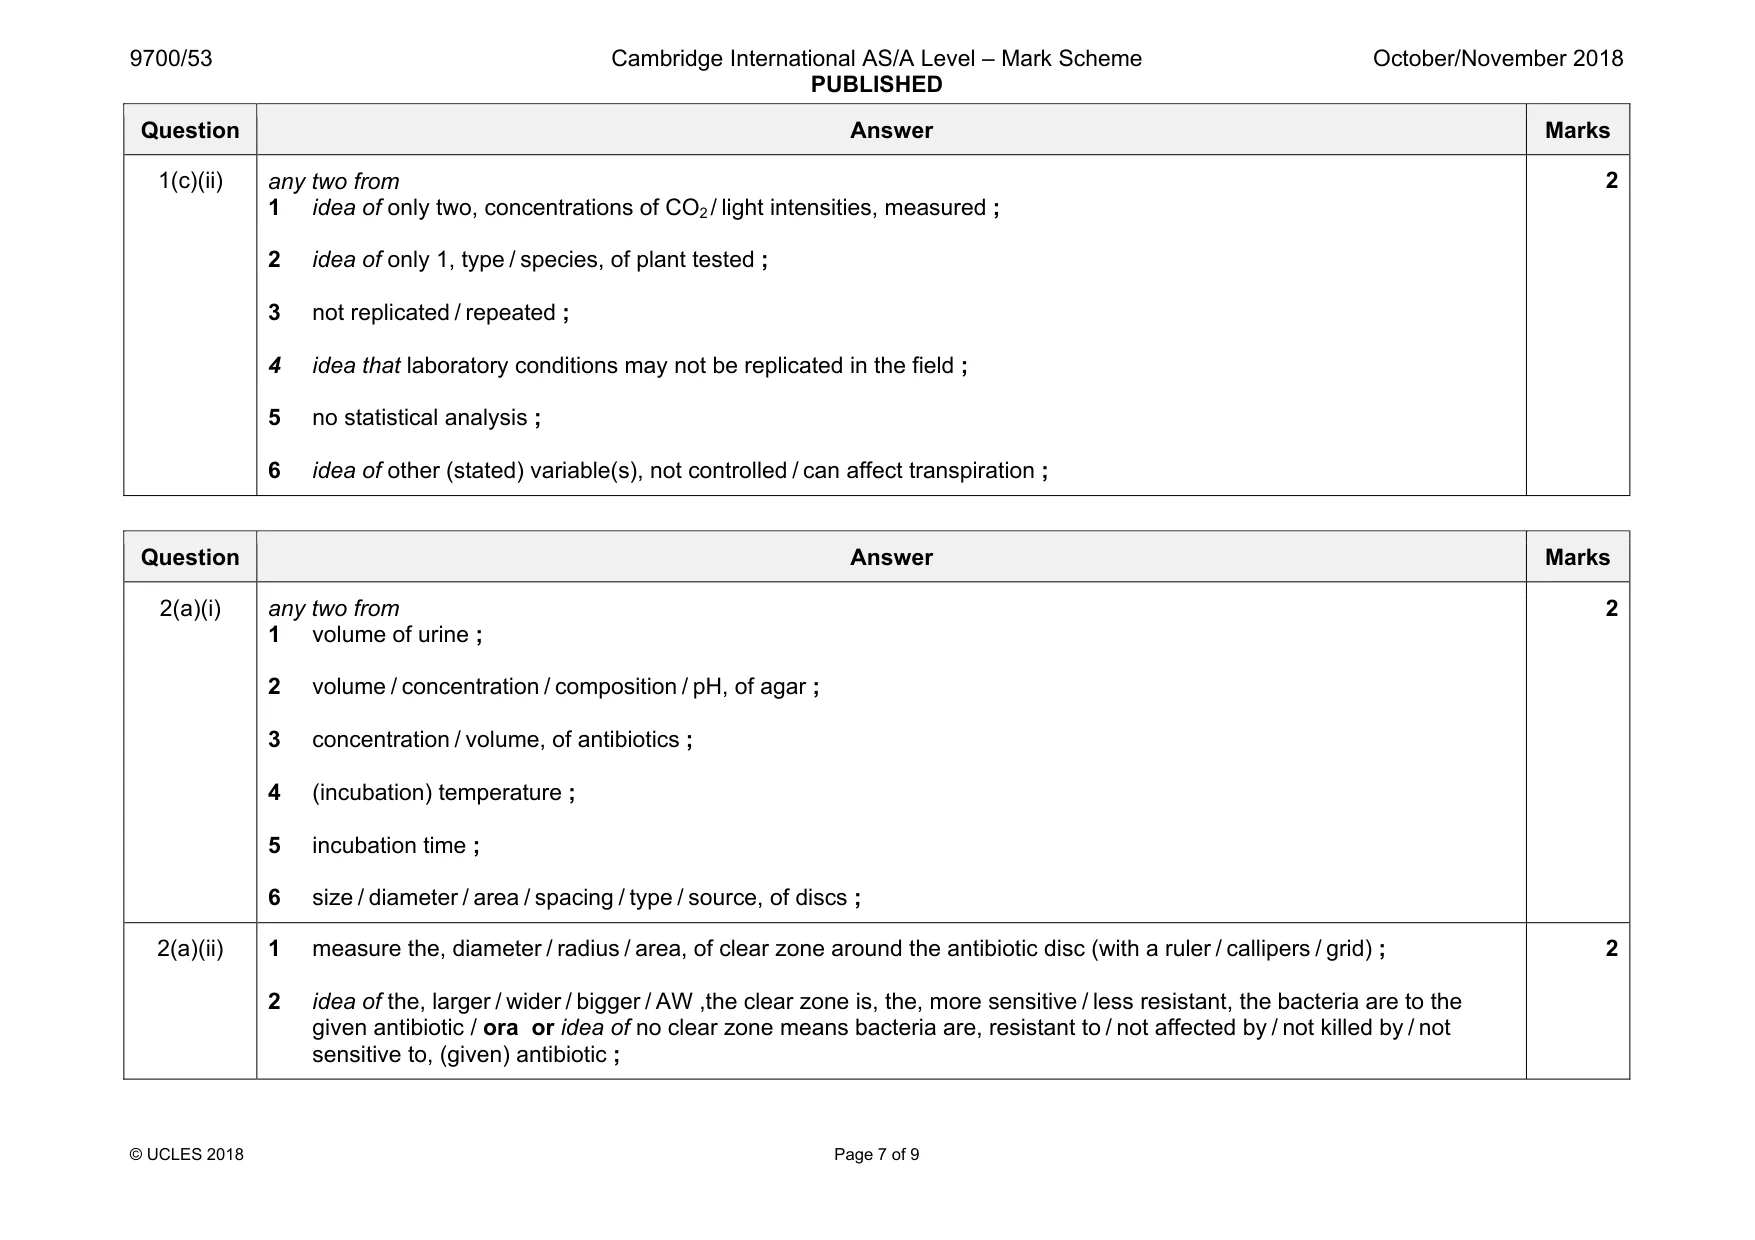
Mark scheme: 1(a)(i) independent light intensity ; dependent distance moved by bubble (in a set time) or time taken for the bubble to move (a set distance) ; 2 1(a)(ii) any three variables for one mark two correct methods for one mark each 1 temperature – temperature-controlled room / heat shield / environmental chamber / incubator / cold light source / LED light ; 2 background light – dark room (with fixed light) / closed blinds / AW ; 3 same wavelength / type / colour of light – use the same bulb / lamp / AW ; 4 idea of air flow / wind – e.g. windows closed / doors closed / fans off or on throughout / limit movement / AW ; 5 plant / (leafy) shoot – use same, type / species / plant / shoot / age / number of leaves / area of leaves ; 6 humidity – any valid way it might be controlled ; 7 CO2 levels – any valid way it might be controlled ; 8 time – measure for same time / time over same distance ; 3 Question Answer Marks 1(b) any six from 1 ref. to cutting / inserting, stem under water ; 2 use, petroleum jelly / silicone gel / silicone tape / AW (to make joints air tight) ; 3 idea of removing tube from water to introduce an air bubble ; 4 ref. to method of obtaining a minimum of 5 different light intensities ; 5 ref. to method of controlling one variable ; 6 allow (apparatus / plant) to, equilibrate / AW, before starting measurements ; 7 idea of setting / resetting / returning, air bubble (to start position / between measurements) ; 8 ref. to measuring distance moved by bubble over a set time or ref. to measuring time for bubble to move a set distance ; 9 take a minimum of 2 repeats at each light intensity + take a mean / identify anomalies ; 10 low / medium, risk investigation or cutting stem + cut away from your hand (with scalpel) / cut with secateurs or scissors ; 6 1(c)(i) 30.0 (%) ; (3.03 – 2.12) / 3.03 or (1 – 2.12 / 3.03) × 100 2 Question Answer Marks 1(c)(ii) any two from 1 idea of only two, concentrations of CO2 / light intensities, measured ; 2 idea of only 1, type / species, of plant tested ; 3 not replicated / repeated ; 4 idea that laboratory conditions may not be replicated in the field ; 5 no statistical analysis ; 6 idea of other (stated) variable(s), not controlled / can affect transpiration ; 2
Q2 · Resistance to antibiotics within a population of bacteria is due to selection pressure
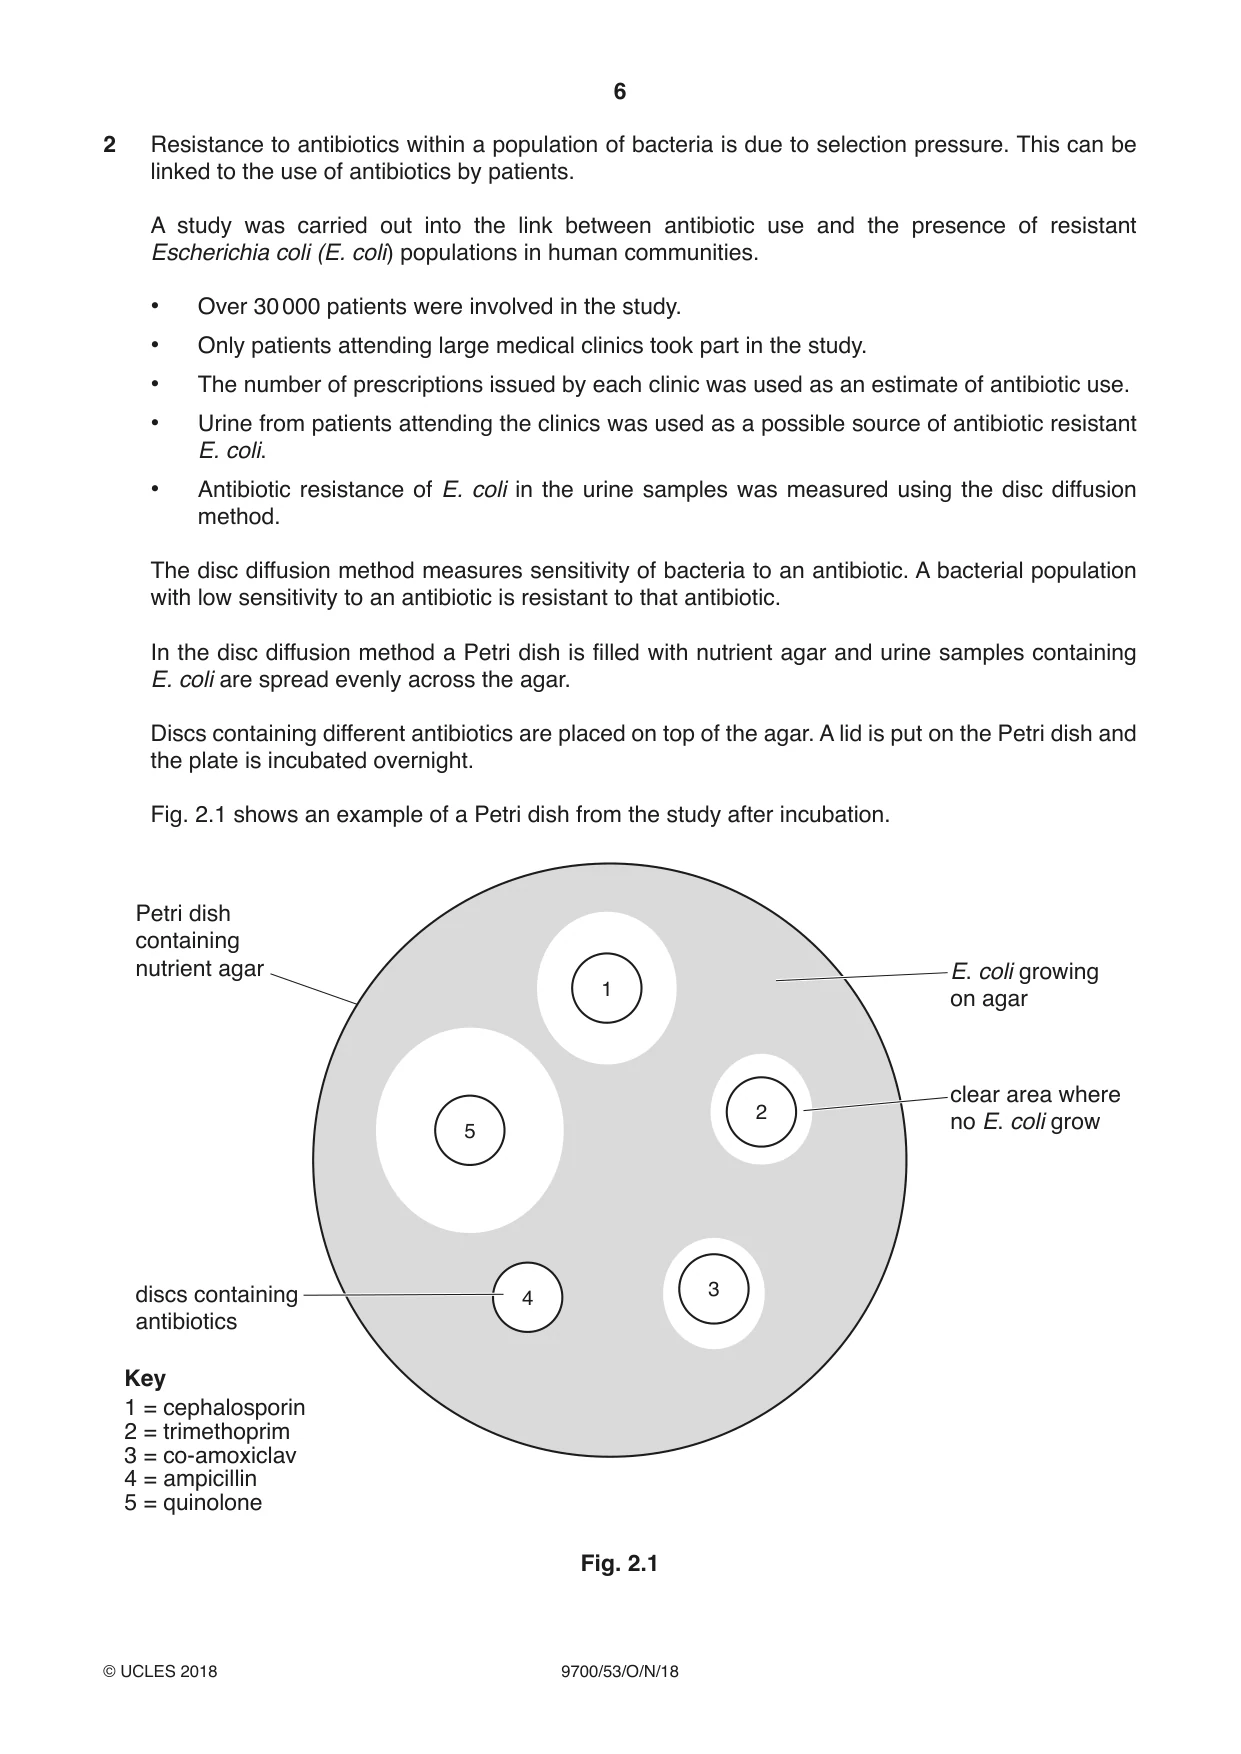
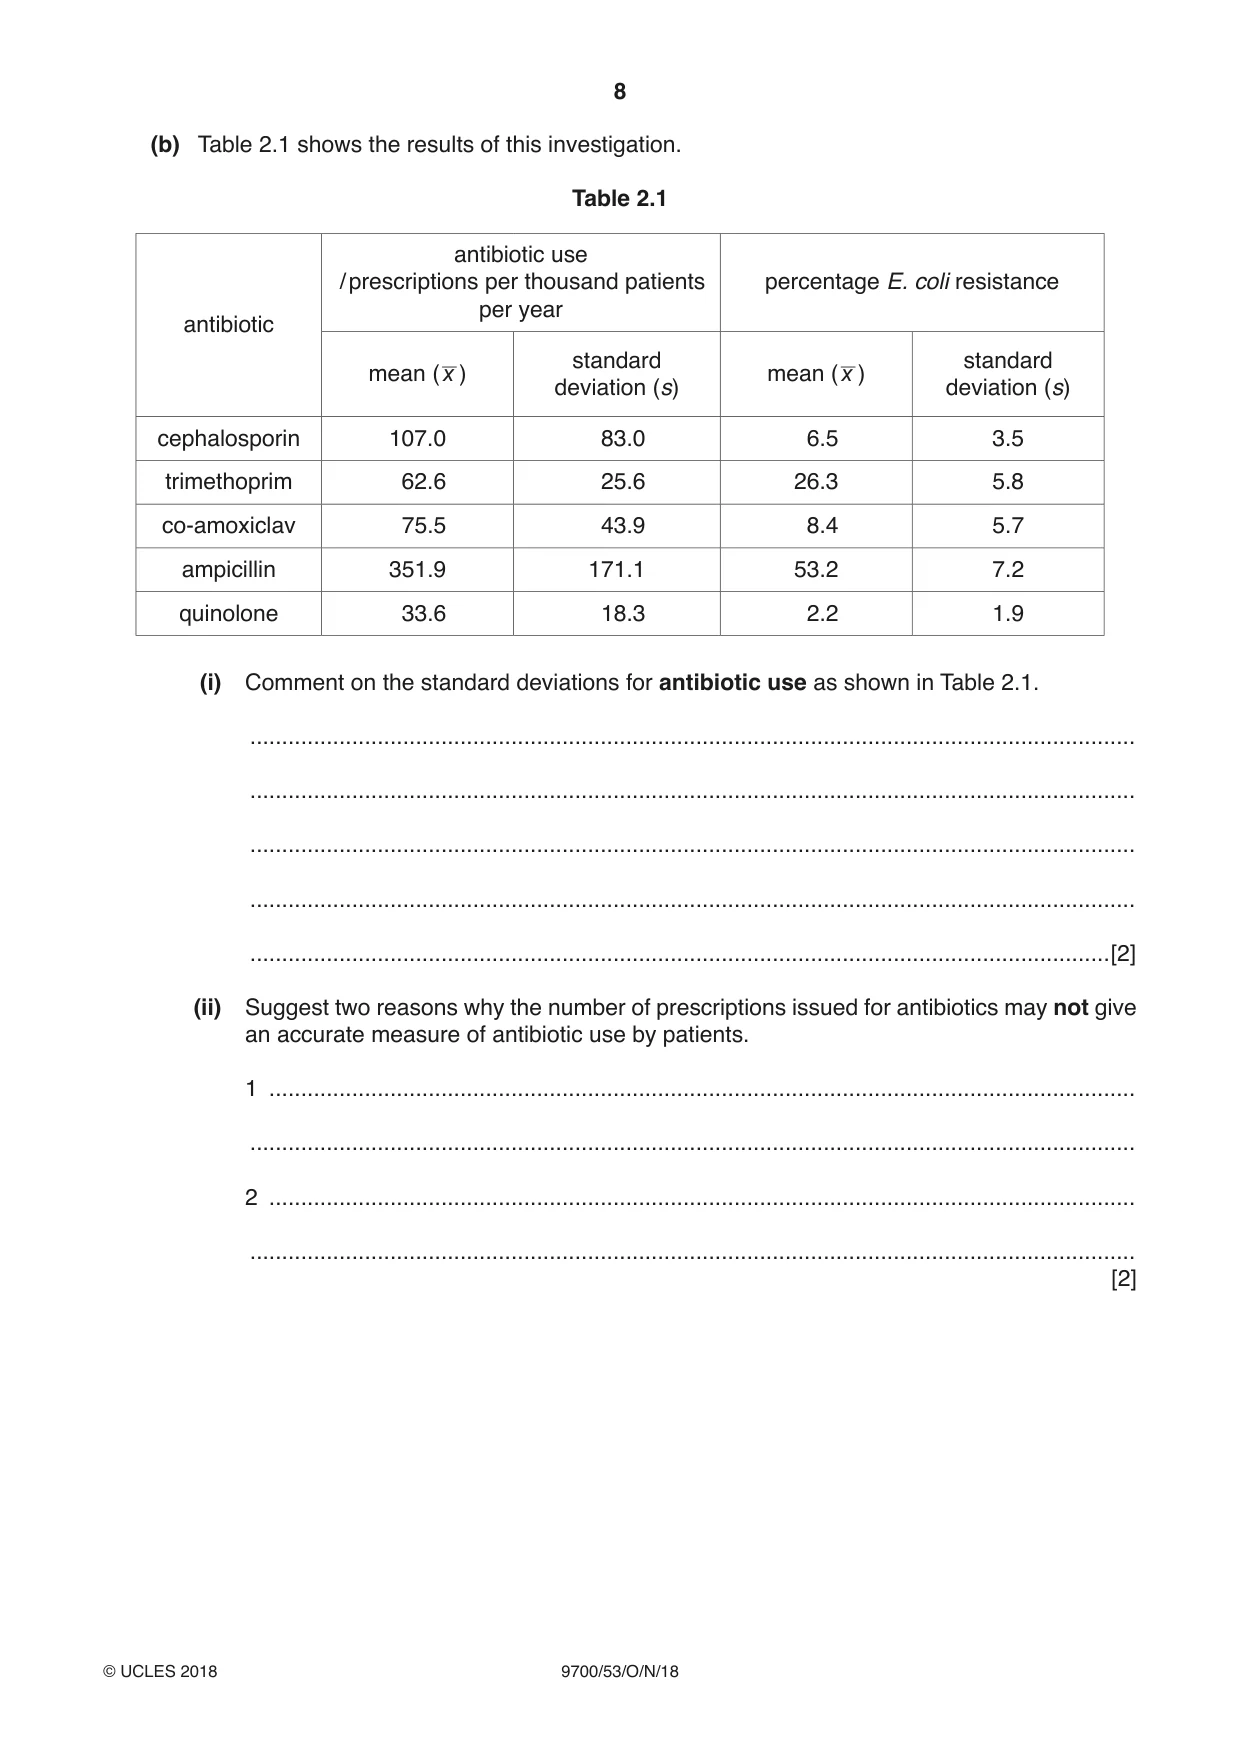
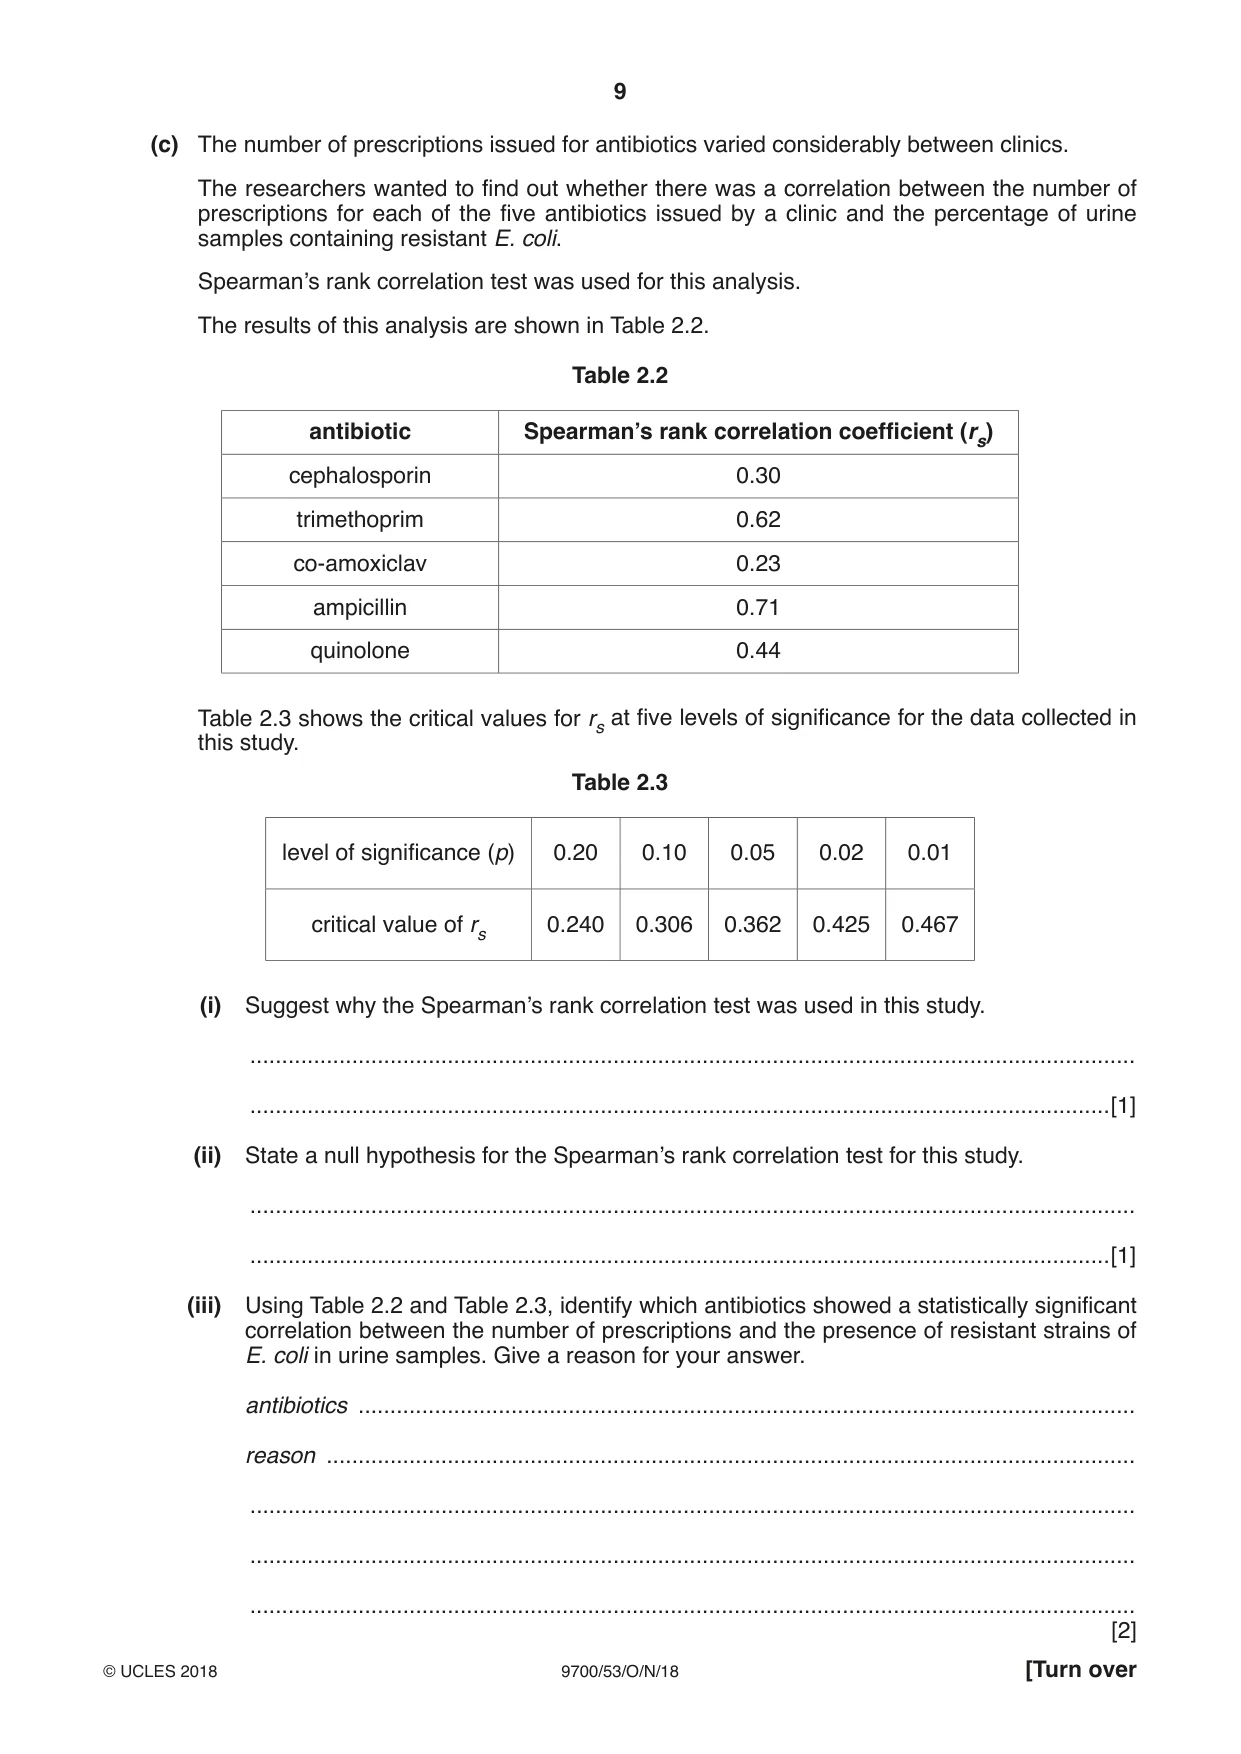
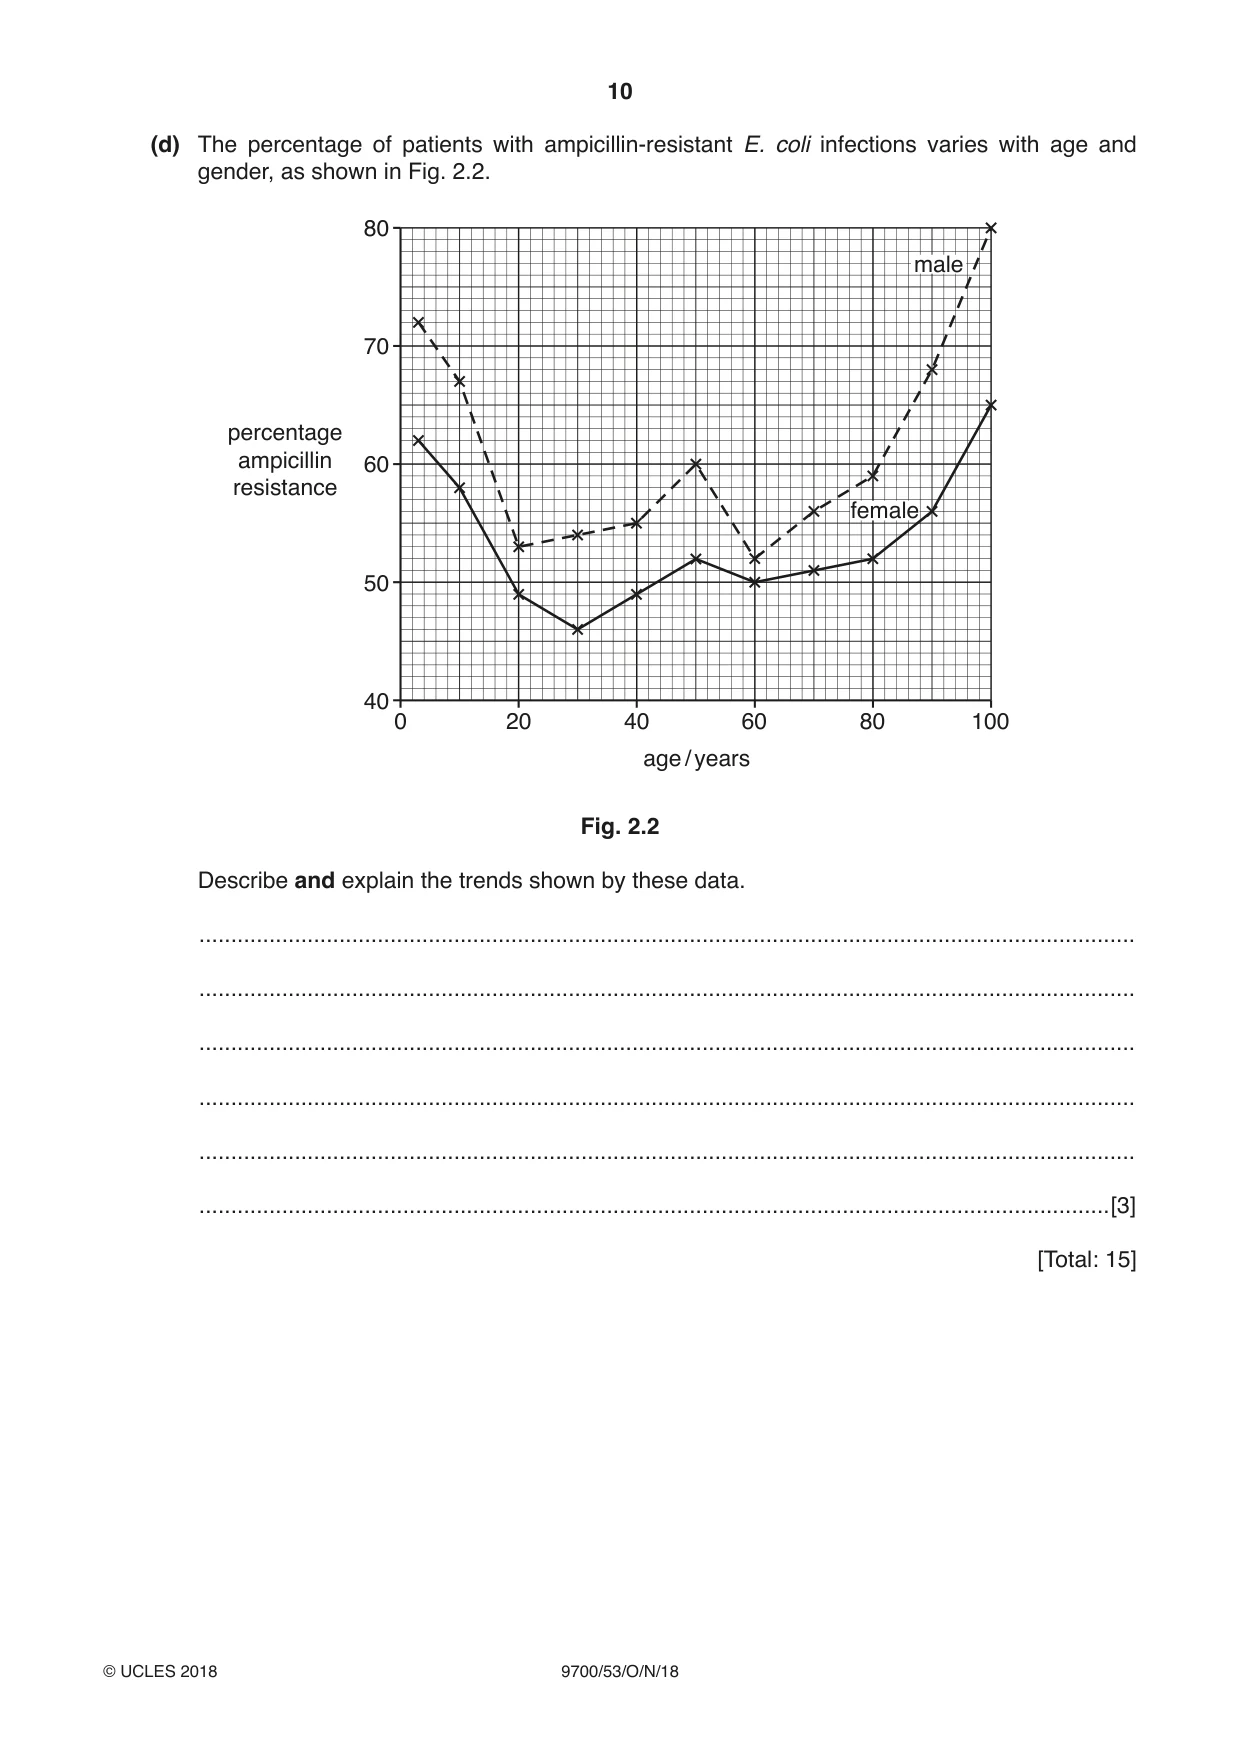
2 Resistance to antibiotics within a population of bacteria is due to selection pressure. This can be linked to the use of antibiotics by patients. A study was carried out into the link between antibiotic use and the presence of resistant Escherichia coli (E. coli) populations in human communities. • Over 30 000 patients were involved in the study. • Only patients attending large medical clinics took part in the study. • The number of prescriptions issued by each clinic was used as an estimate of antibiotic use. • Urine from patients attending the clinics was used as a possible source of antibiotic resistant E. coli. • Antibiotic resistance of E. coli in the urine samples was measured using the disc diffusion method. The disc diffusion method measures sensitivity of bacteria to an antibiotic. A bacterial population with low sensitivity to an antibiotic is resistant to that antibiotic. In the disc diffusion method a Petri dish is filled with nutrient agar and urine samples containing E. coli are spread evenly across the agar. Discs containing different antibiotics are placed on top of the agar. A lid is put on the Petri dish and the plate is incubated overnight. Fig. 2.1 shows an example of a Petri dish from the study after incubation. Petri dish containing nutrient agar E. coli growing 1 on agar clear area where 2 no E. coli grow 5 discs containing 4 3 antibiotics Key 1 = cephalosporin 2 = trimethoprim 3 = co-amoxiclav 4 = ampicillin 5 = quinolone Fig. 2.1 (a) (i) Suggest two variables that need to be standardised when using the disc diffusion method in this study. 1 ........................................................................................................................................ ........................................................................................................................................... 2 ........................................................................................................................................ ........................................................................................................................................... [2] (ii) Describe how you would determine the sensitivity of E. coli to each antibiotic. ........................................................................................................................................... ........................................................................................................................................... ........................................................................................................................................... ........................................................................................................................................... ........................................................................................................................................... ........................................................................................................................................... .......................................................................................................................................[2] (b) Table 2.1 shows the results of this investigation. Table 2.1 antibiotic use / prescriptions per thousand patients percentage E. coli resistance per year antibiotic standard standard mean (x ) mean (x ) deviation (s) deviation (s) cephalosporin 107.0 83.0 6.5 3.5 trimethoprim 62.6 25.6 26.3 5.8 co-amoxiclav 75.5 43.9 8.4 5.7 ampicillin 351.9 171.1 53.2 7.2 quinolone 33.6 18.3 2.2 1.9 (i) Comment on the standard deviations for antibiotic use as shown in Table 2.1. ........................................................................................................................................... ........................................................................................................................................... ........................................................................................................................................... ........................................................................................................................................... .......................................................................................................................................[2] (ii) Suggest two reasons why the number of prescriptions issued for antibiotics may not give an accurate measure of antibiotic use by patients. 1 ........................................................................................................................................ ........................................................................................................................................... 2 ........................................................................................................................................ ........................................................................................................................................... [2]
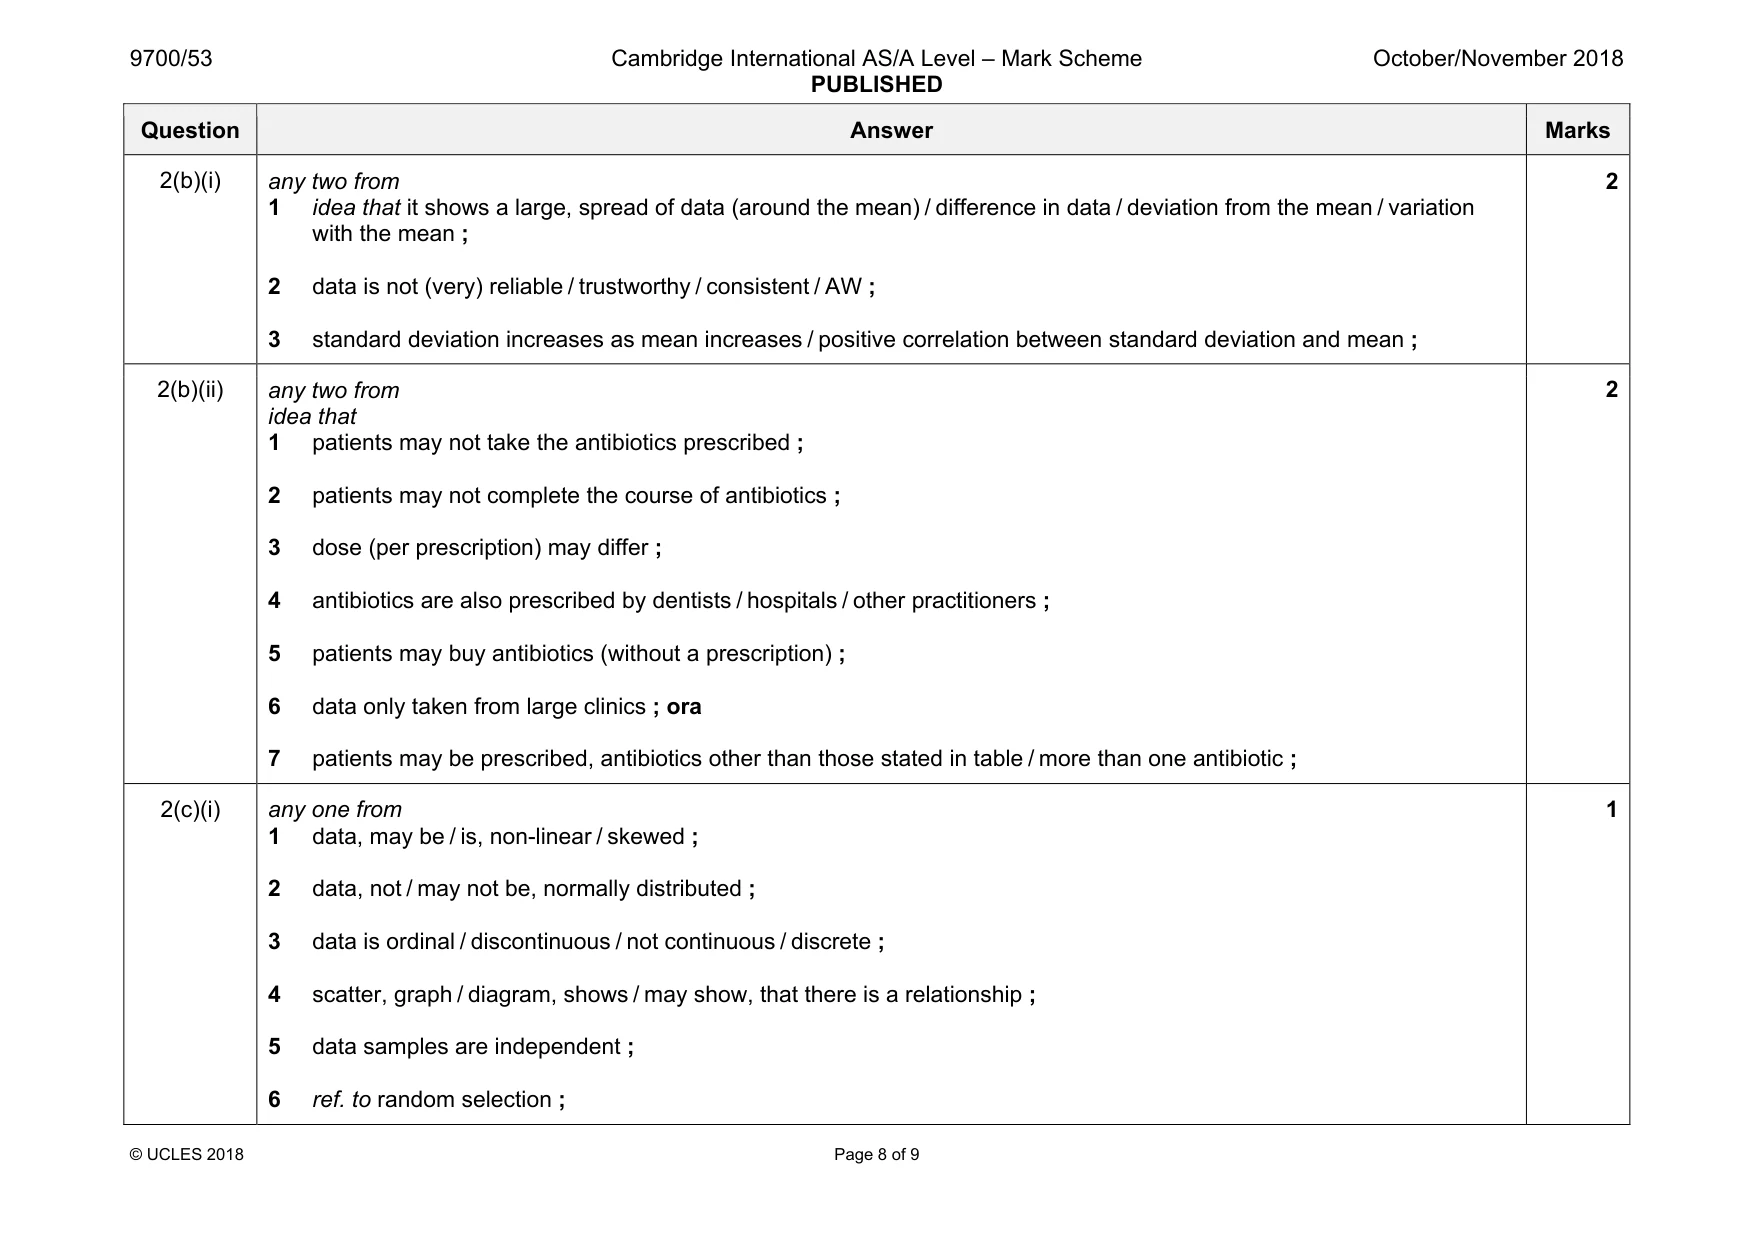
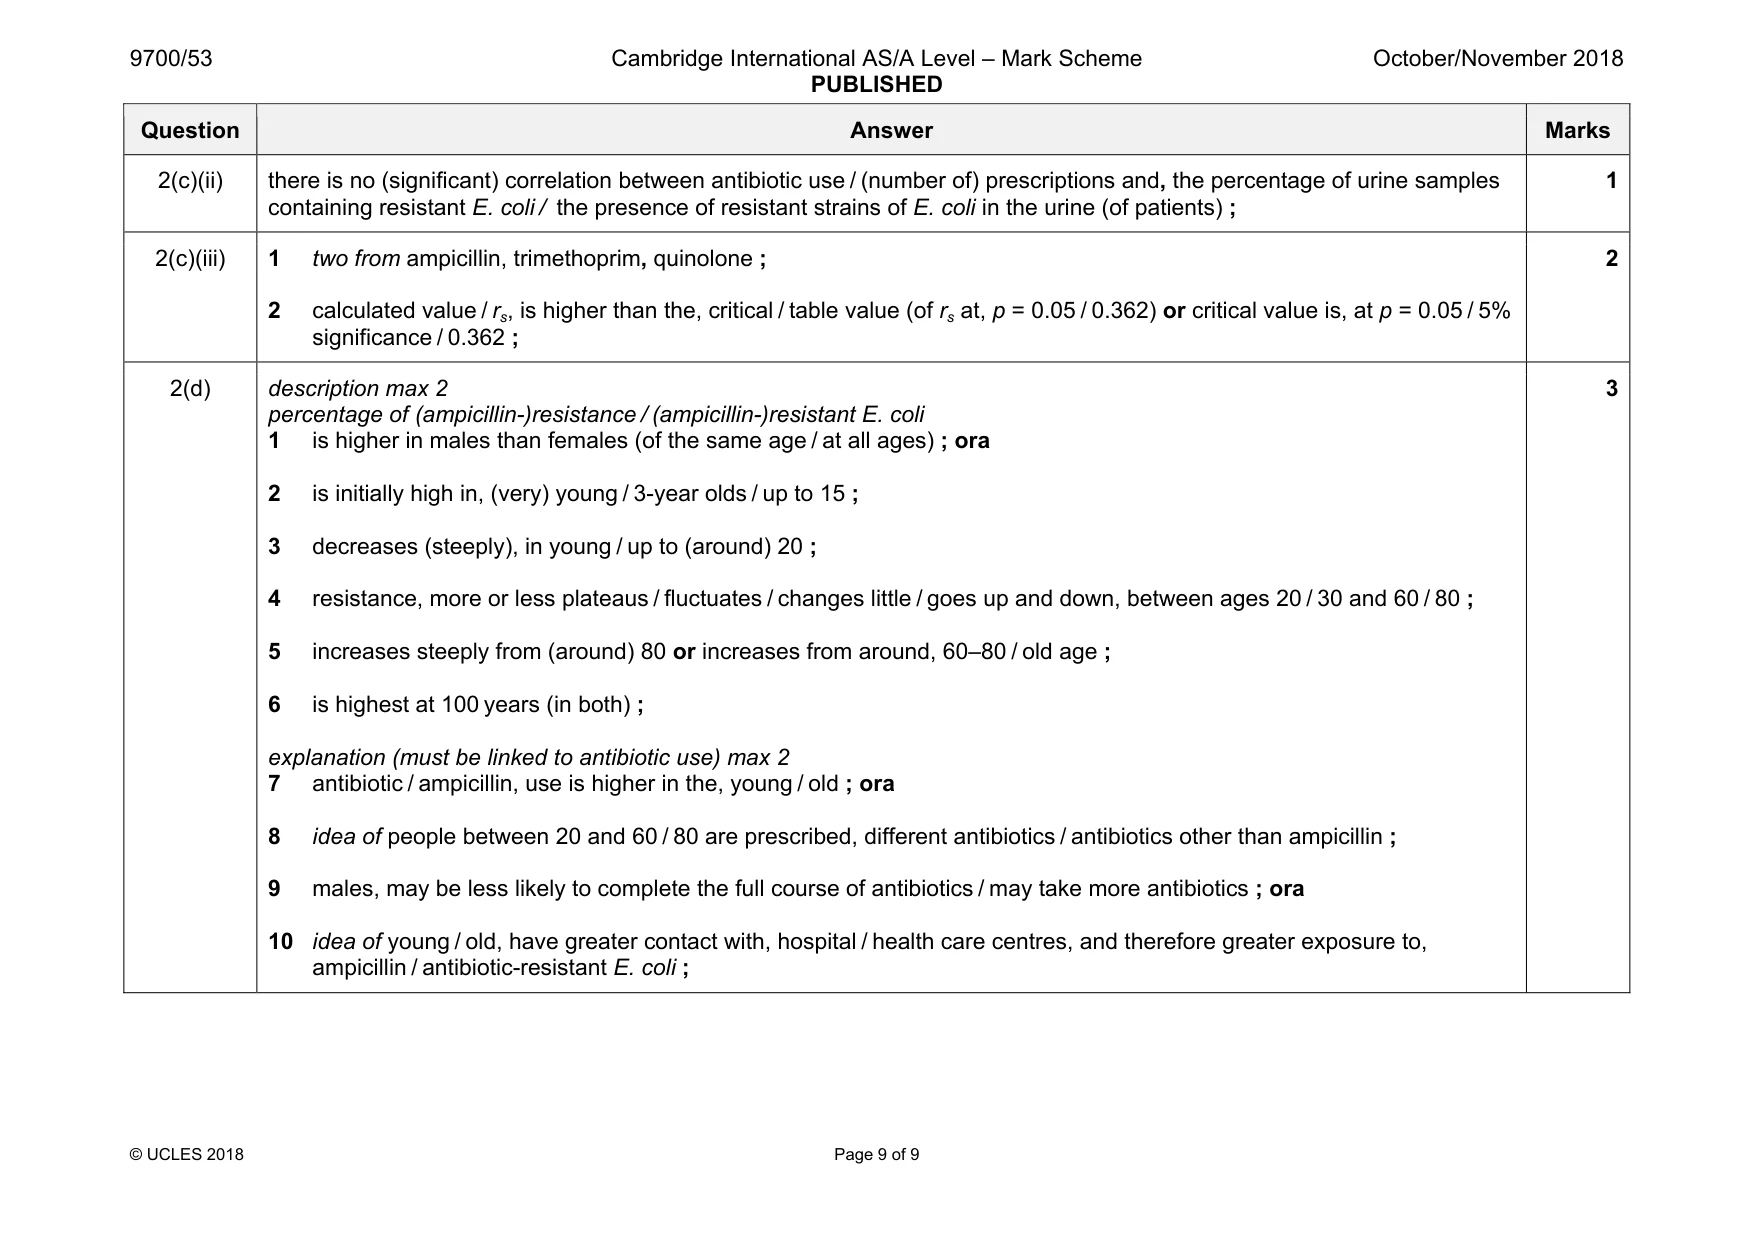
Mark scheme: 2(a)(i) any two from 1 volume of urine ; 2 volume / concentration / composition / pH, of agar ; 3 concentration / volume, of antibiotics ; 4 (incubation) temperature ; 5 incubation time ; 6 size / diameter / area / spacing / type / source, of discs ; 2 2(a)(ii) 1 measure the, diameter / radius / area, of clear zone around the antibiotic disc (with a ruler / callipers / grid) ; 2 idea of the, larger / wider / bigger / AW ,the clear zone is, the, more sensitive / less resistant, the bacteria are to the given antibiotic / ora or idea of no clear zone means bacteria are, resistant to / not affected by / not killed by / not sensitive to, (given) antibiotic ; 2 Question Answer Marks 2(b)(i) any two from 1 idea that it shows a large, spread of data (around the mean) / difference in data / deviation from the mean / variation with the mean ; 2 data is not (very) reliable / trustworthy / consistent / AW ; 3 standard deviation increases as mean increases / positive correlation between standard deviation and mean ; 2 2(b)(ii) any two from idea that 1 patients may not take the antibiotics prescribed ; 2 patients may not complete the course of antibiotics ; 3 dose (per prescription) may differ ; 4 antibiotics are also prescribed by dentists / hospitals / other practitioners ; 5 patients may buy antibiotics (without a prescription) ; 6 data only taken from large clinics ; ora 7 patients may be prescribed, antibiotics other than those stated in table / more than one antibiotic ; 2 2(c)(i) any one from 1 data, may be / is, non-linear / skewed ; 2 data, not / may not be, normally distributed ; 3 data is ordinal / discontinuous / not continuous / discrete ; 4 scatter, graph / diagram, shows / may show, that there is a relationship ; 5 data samples are independent ; 6 ref. to random selection ; 1 Question Answer Marks 2(c)(ii) there is no (significant) correlation between antibiotic use / (number of) prescriptions and, the percentage of urine samples containing resistant E. coli / the presence of resistant strains of E. coli in the urine (of patients) ; 1 2(c)(iii) 1 two from ampicillin, trimethoprim, quinolone ; 2 calculated value / rs, is higher than the, critical / table value (of rs at, p = 0.05 / 0.362) or critical value is, at p = 0.05 / 5% significance / 0.362 ; 2 2(d) description max 2 percentage of (ampicillin-)resistance / (ampicillin-)resistant E. coli 1 is higher in males than females (of the same age / at all ages) ; ora 2 is initially high in, (very) young / 3-year olds / up to 15 ; 3 decreases (steeply), in young / up to (around) 20 ; 4 resistance, more or less plateaus / fluctuates / changes little / goes up and down, between ages 20 / 30 and 60 / 80 ; 5 increases steeply from (around) 80 or increases from around, 60–80 / old age ; 6 is highest at 100 years (in both) ; explanation (must be linked to antibiotic use) max 2 7 antibiotic / ampicillin, use is higher in the, young / old ; ora 8 idea of people between 20 and 60 / 80 are prescribed, different antibiotics / antibiotics other than ampicillin ; 9 males, may be less likely to complete the full course of antibiotics / may take more antibiotics ; ora 10 idea of young / old, have greater contact with, hospital / health care centres, and therefore greater exposure to, ampicillin / antibiotic-resistant E. coli ; 3
What was in this paper
The subtopics covered by these 2 questions, and how many questions each got. Open one in a new tab to see every Cambridge question on it.
What you needed in this session
Cambridge’s own grade thresholds for 2018 Oct/Nov, Paper 5 · Variant 3. A higher threshold means an easier paper — the bar moves with how the cohort did.