Cambridge A Level Biology 9700 — 2018 Oct/Nov Paper 3 · Variant 4
9700/34/O/N/18 · 2 questions · 40 marks · ≈45 min
The question paper and its mark scheme, free to read here and free to download. This is Cambridge’s own paper, exactly as it was sat.
Question paper16 pages







Mark scheme8 pages
Answers below. Sit the paper first if you are practising.
Questions as text
Q1 · Manufacturers of fruit juice need to know the concentration of ascorbic acid (vitamin C)…
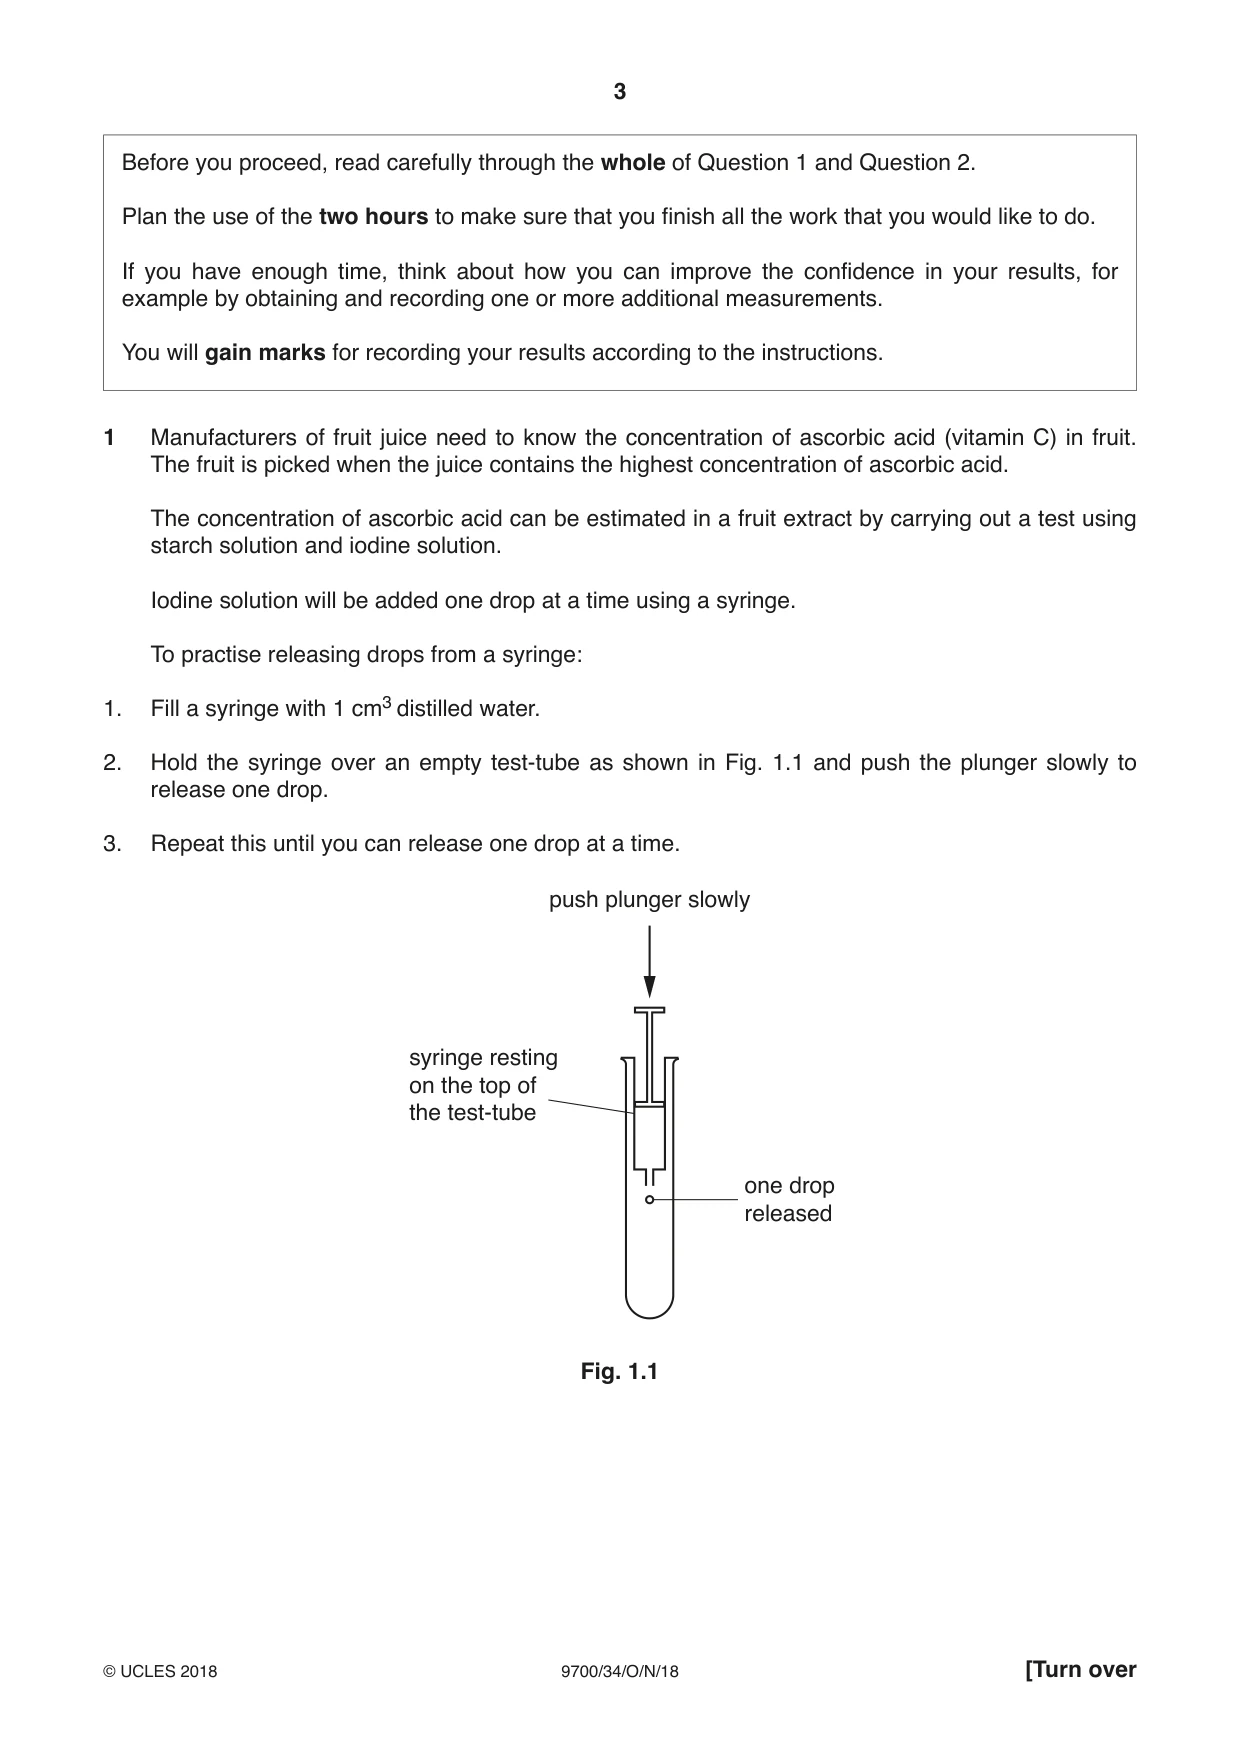
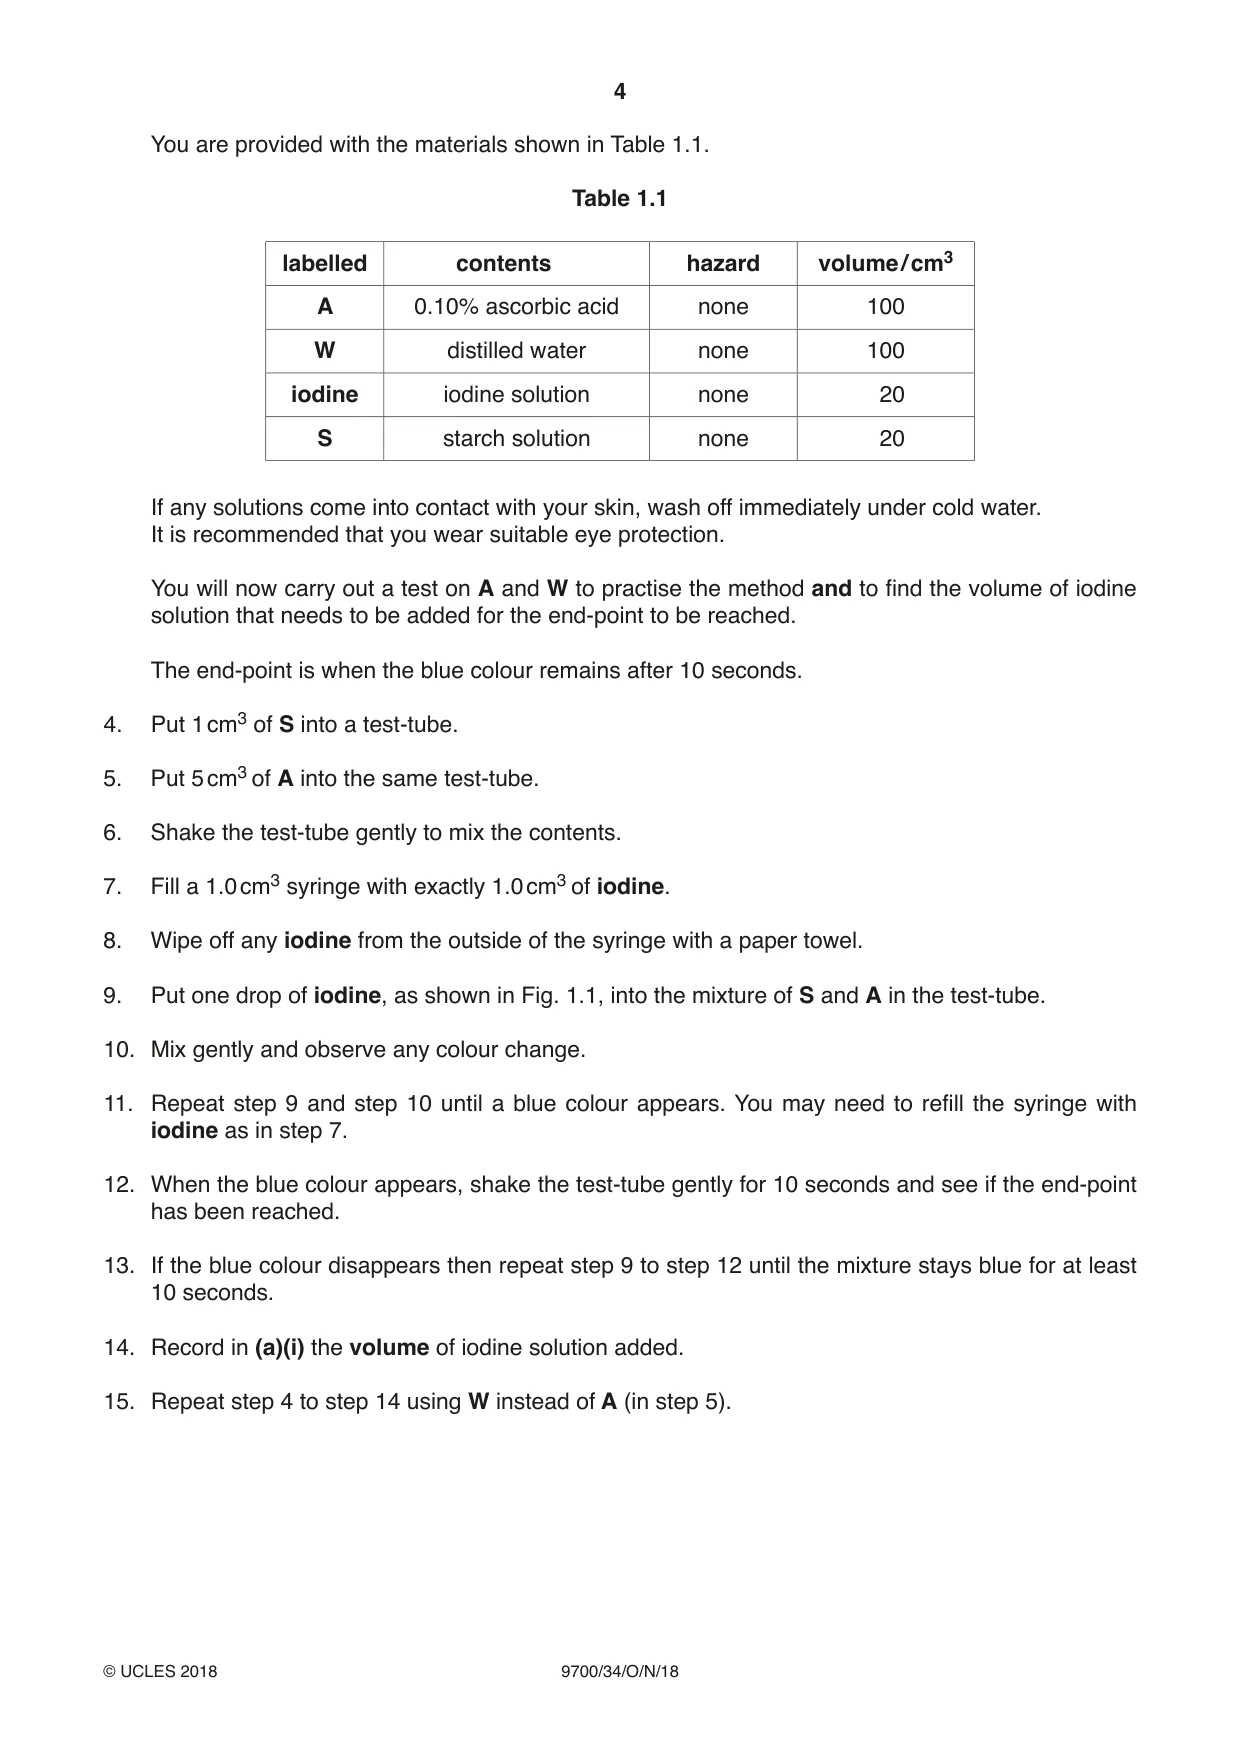
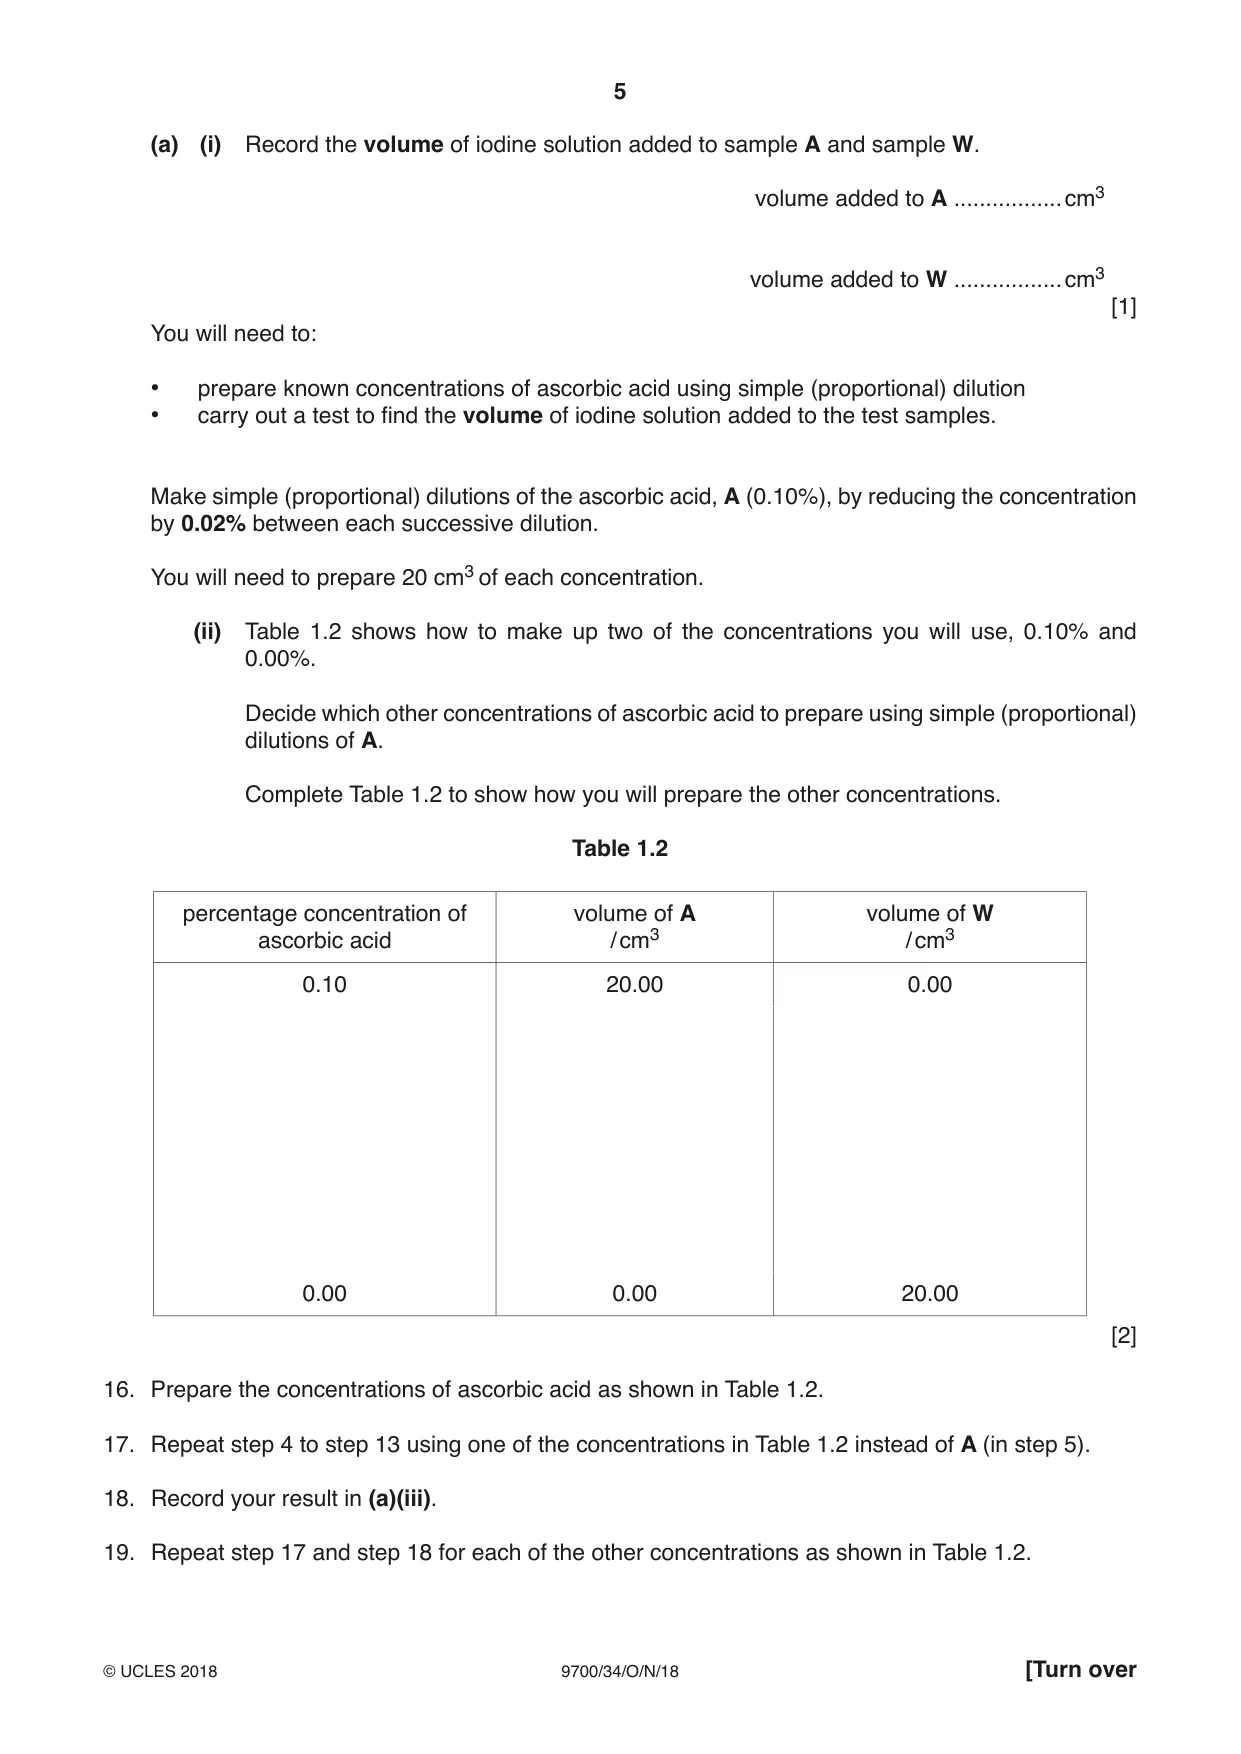
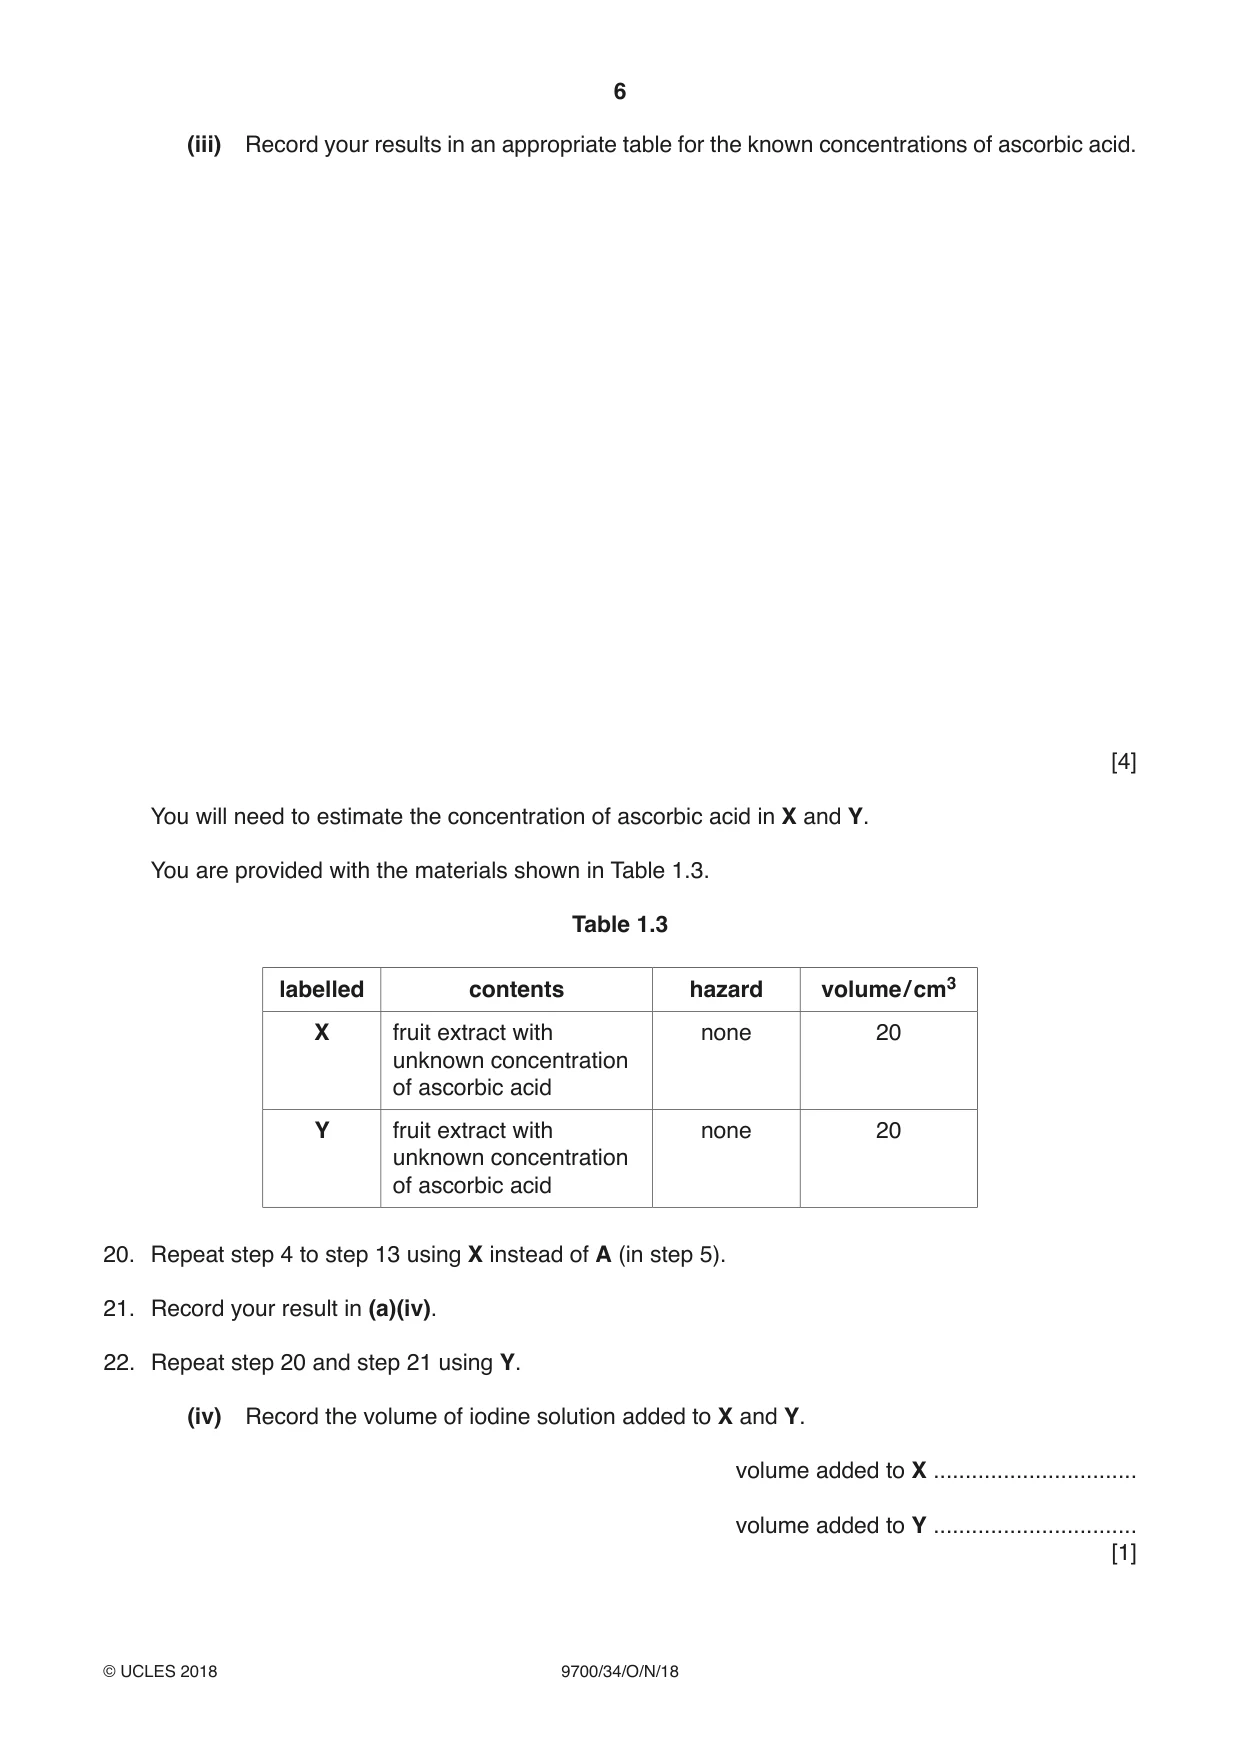
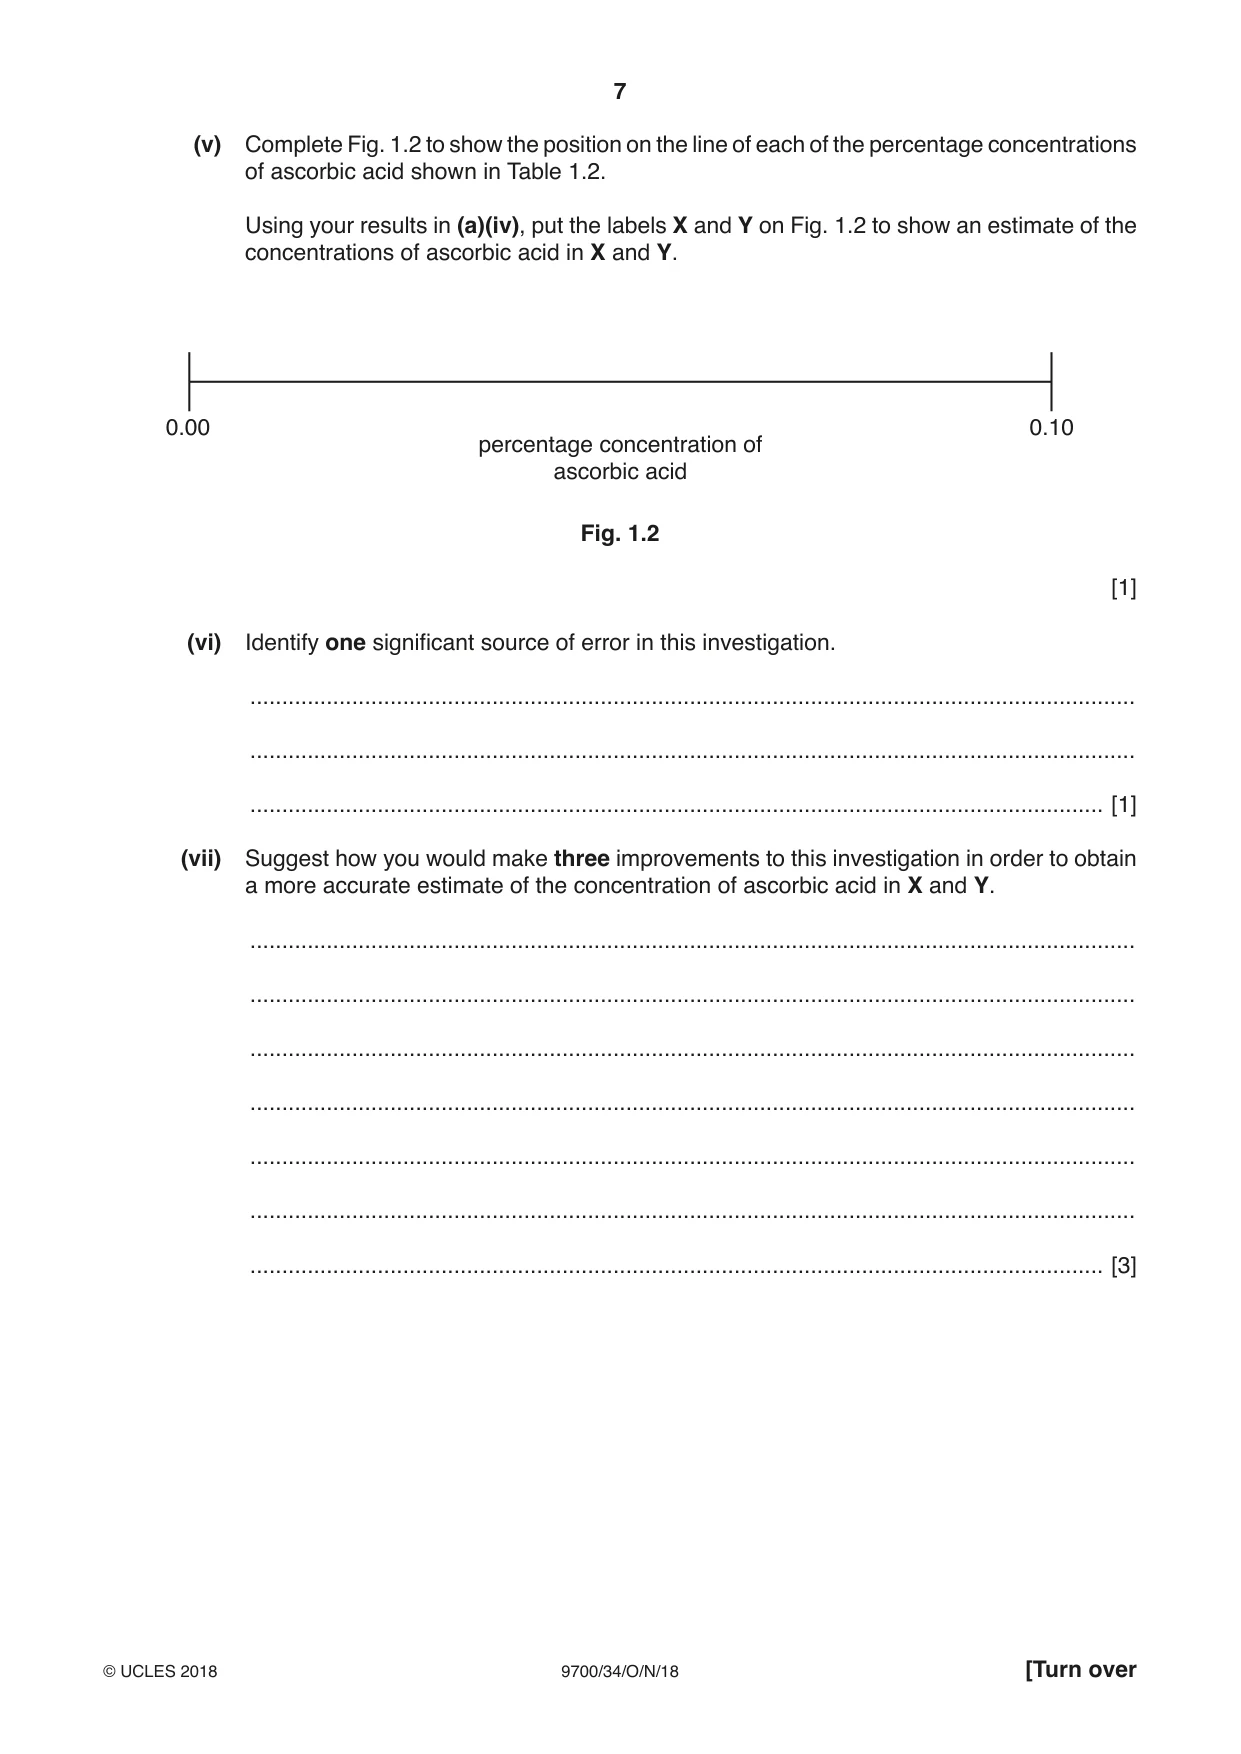
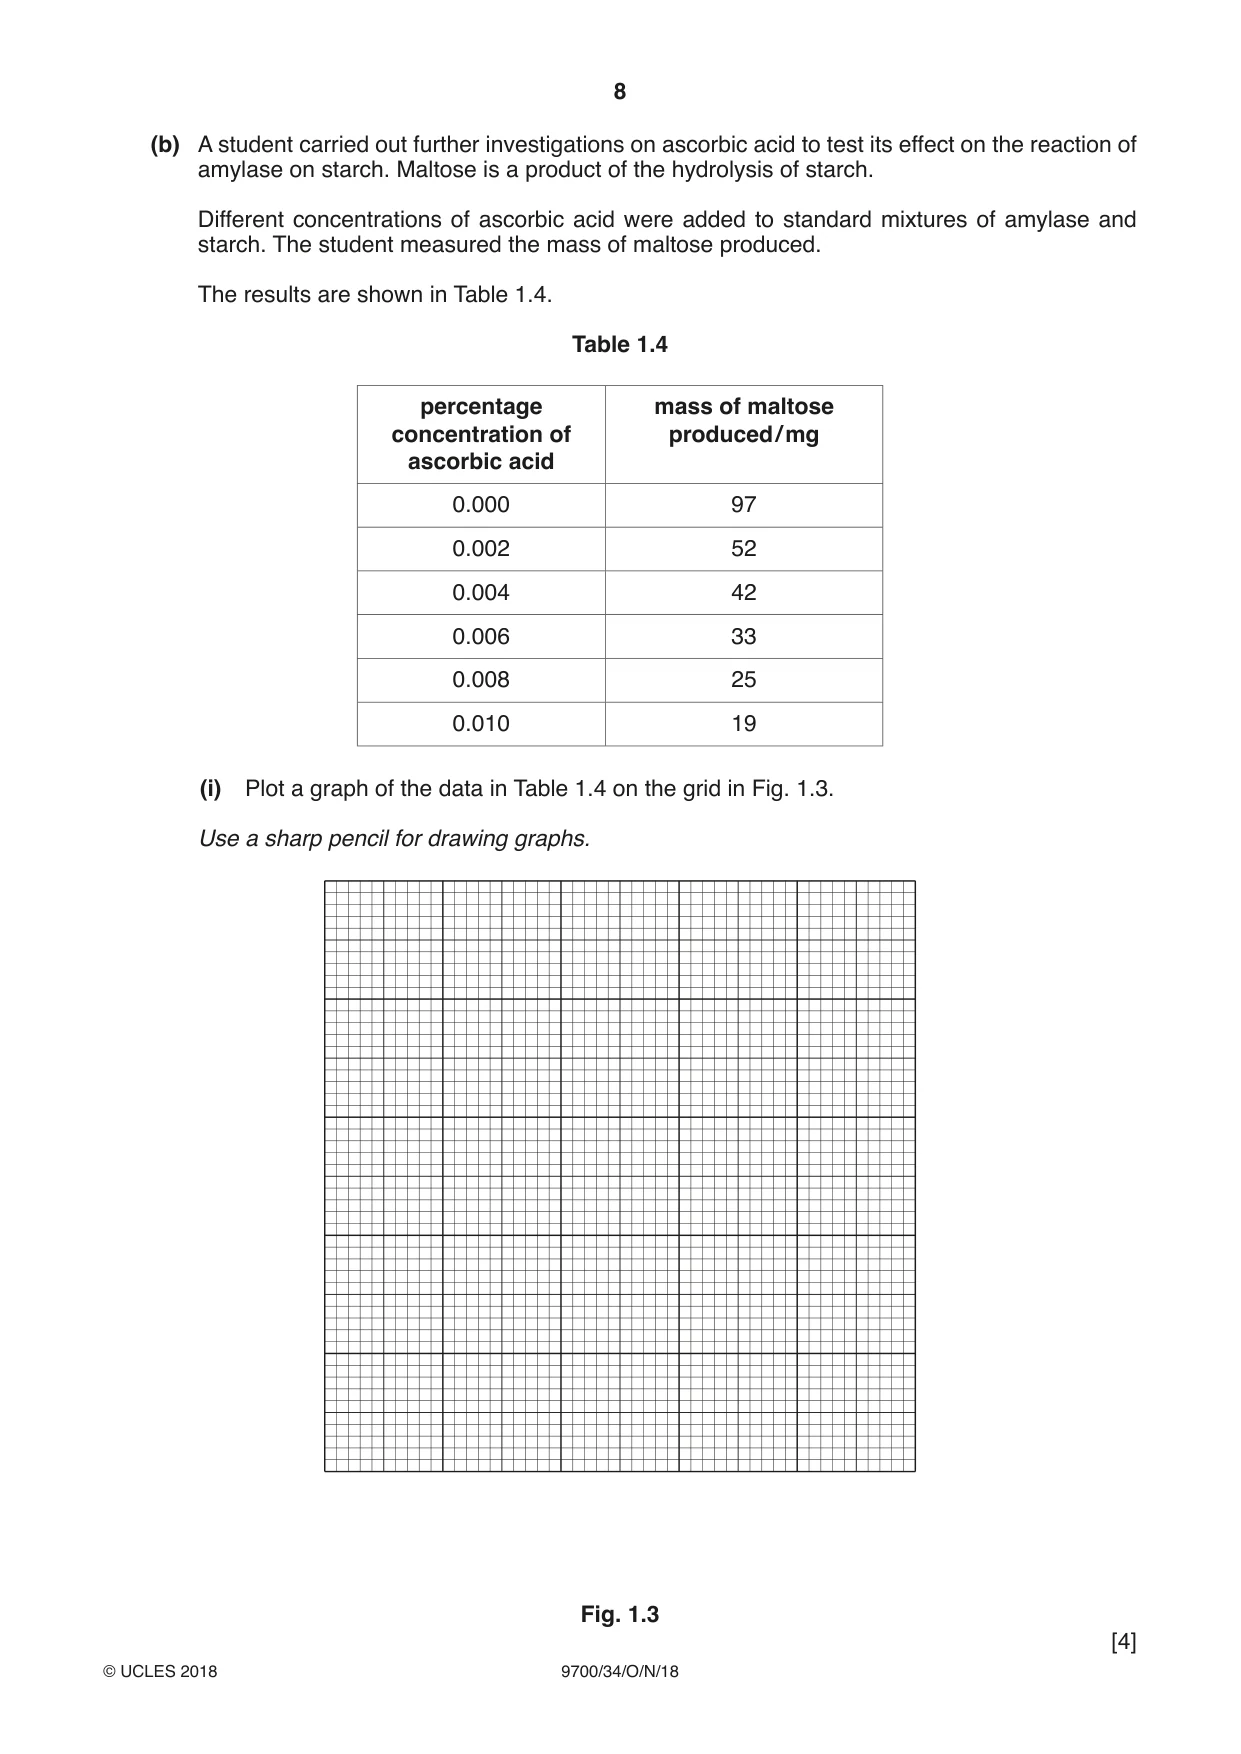
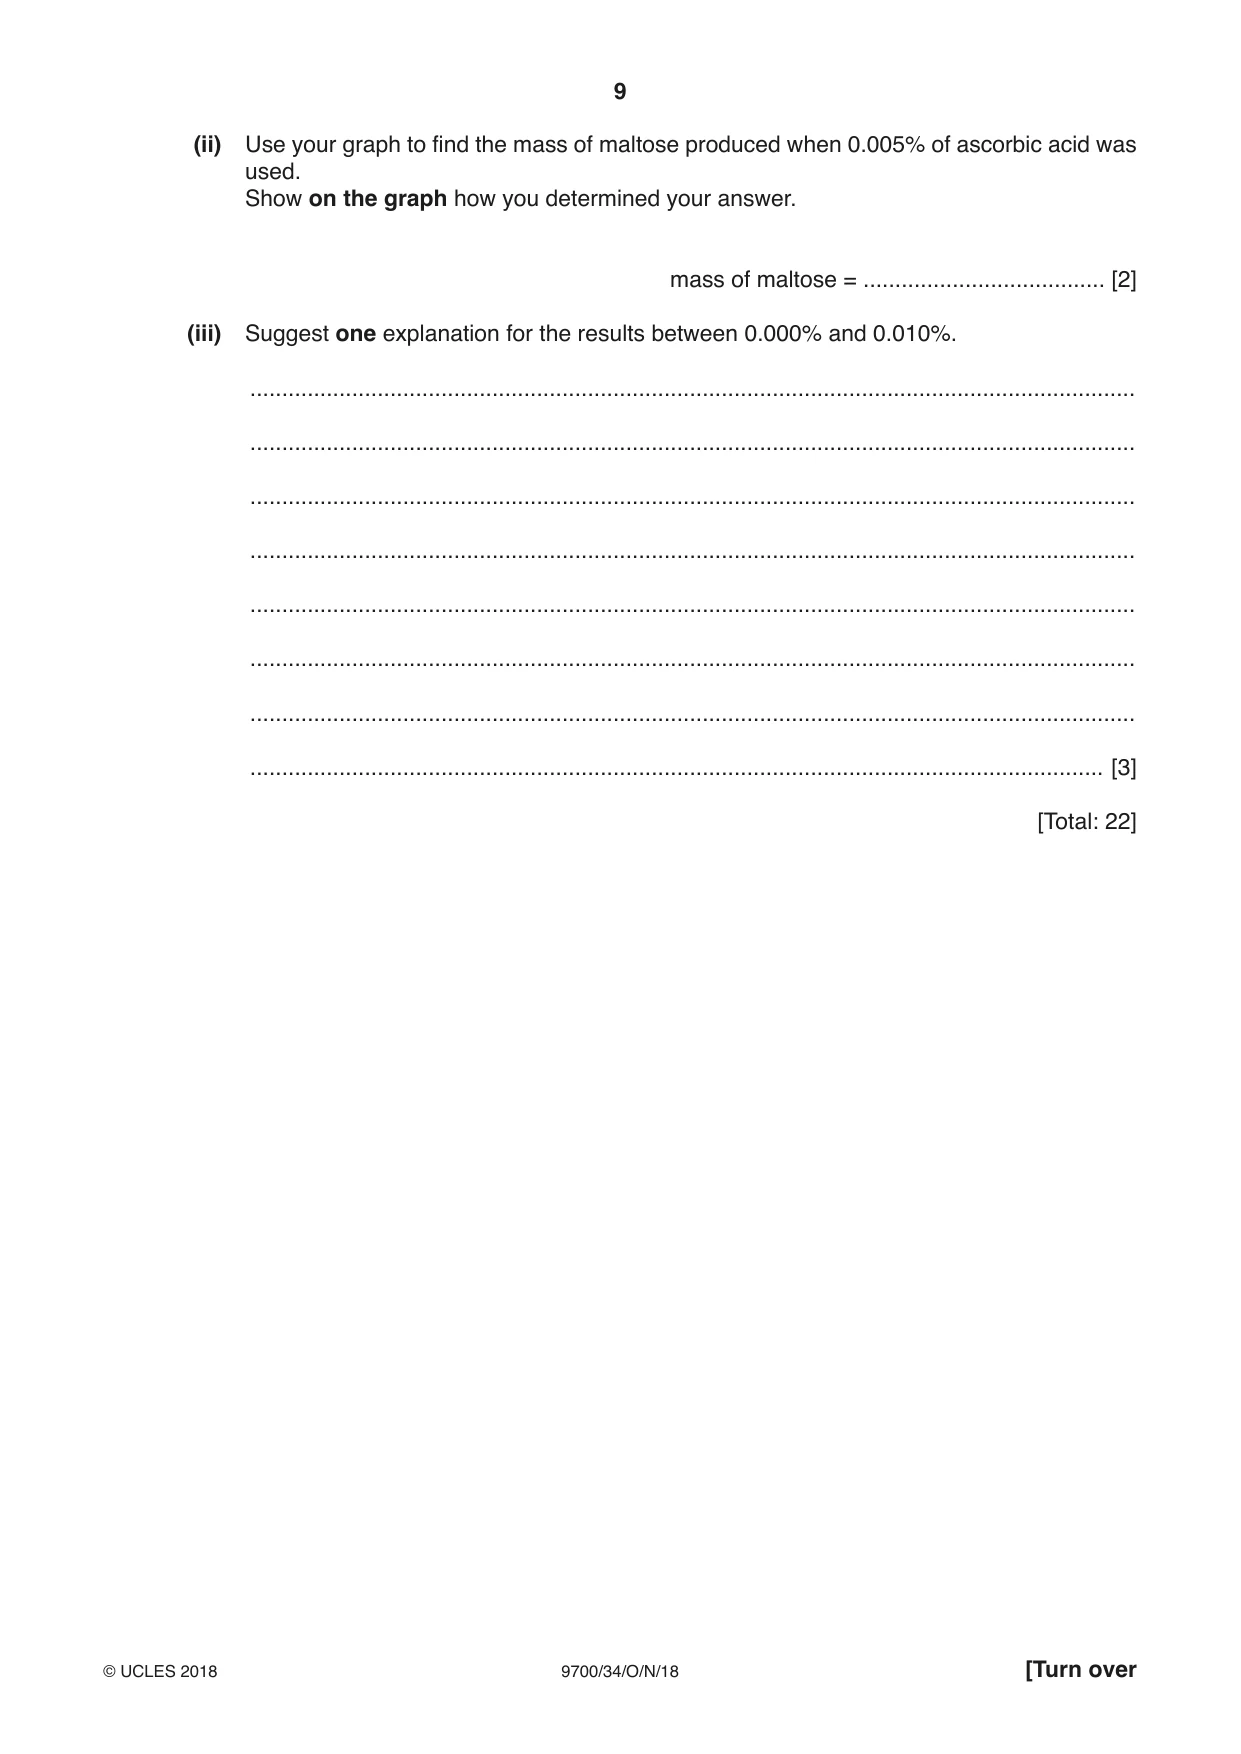
1 Manufacturers of fruit juice need to know the concentration of ascorbic acid (vitamin C) in fruit. The fruit is picked when the juice contains the highest concentration of ascorbic acid. The concentration of ascorbic acid can be estimated in a fruit extract by carrying out a test using starch solution and iodine solution. Iodine solution will be added one drop at a time using a syringe. To practise releasing drops from a syringe: 1. Fill a syringe with 1 cm3 distilled water. 2. Hold the syringe over an empty test-tube as shown in Fig. 1.1 and push the plunger slowly to release one drop. 3. Repeat this until you can release one drop at a time. push plunger slowly syringe resting on the top of the test-tube one drop released Fig. 1.1 You are provided with the materials shown in Table 1.1. Table 1.1 labelled contents hazard volume / cm3 A 0.10% ascorbic acid none 100 W distilled water none 100 iodine iodine solution none 20 S starch solution none 20 If any solutions come into contact with your skin, wash off immediately under cold water. It is recommended that you wear suitable eye protection. You will now carry out a test on A and W to practise the method and to find the volume of iodine solution that needs to be added for the end-point to be reached. The end-point is when the blue colour remains after 10 seconds. 4. Put 1 cm3 of S into a test-tube. 5. Put 5 cm3 of A into the same test-tube. 6. Shake the test-tube gently to mix the contents. 7. Fill a 1.0 cm3 syringe with exactly 1.0 cm3 of iodine. 8. Wipe off any iodine from the outside of the syringe with a paper towel. 9. Put one drop of iodine, as shown in Fig. 1.1, into the mixture of S and A in the test-tube. 10. Mix gently and observe any colour change. 11. Repeat step 9 and step 10 until a blue colour appears. You may need to refill the syringe with iodine as in step 7. 12. When the blue colour appears, shake the test-tube gently for 10 seconds and see if the end-point has been reached. 13. If the blue colour disappears then repeat step 9 to step 12 until the mixture stays blue for at least 10 seconds. 14. Record in (a)(i) the volume of iodine solution added. 15. Repeat step 4 to step 14 using W instead of A (in step 5). (a) (i) Record the volume of iodine solution added to sample A and sample W. volume added to A ................. cm3 volume added to W ................. cm3 [1] You will need to: • prepare known concentrations of ascorbic acid using simple (proportional) dilution • carry out a test to find the volume of iodine solution added to the test samples. Make simple (proportional) dilutions of the ascorbic acid, A (0.10%), by reducing the concentration by 0.02% between each successive dilution. You will need to prepare 20 cm3 of each concentration. (ii) Table 1.2 shows how to make up two of the concentrations you will use, 0.10% and 0.00%. Decide which other concentrations of ascorbic acid to prepare using simple (proportional) dilutions of A. Complete Table 1.2 to show how you will prepare the other concentrations. Table 1.2 percentage concentration of volume of A volume of W ascorbic acid / cm3 / cm3 0.10 20.00 0.00 0.00 0.00 20.00 [2] 16. Prepare the concentrations of ascorbic acid as shown in Table 1.2. 17. Repeat step 4 to step 13 using one of the concentrations in Table 1.2 instead of A (in step 5). 18. Record your result in (a)(iii). 19. Repeat step 17 and step 18 for each of the other concentrations as shown in Table 1.2. (iii) Record your results in an appropriate table for the known concentrations of ascorbic acid. [4] You will need to estimate the concentration of ascorbic acid in X and Y. You are provided with the materials shown in Table 1.3. Table 1.3 labelled contents hazard volume / cm3 X fruit extract with none 20 unknown concentration of ascorbic acid Y fruit extract with none 20 unknown concentration of ascorbic acid 20. Repeat step 4 to step 13 using X instead of A (in step 5). 21. Record your result in (a)(iv). 22. Repeat step 20 and step 21 using Y. (iv) Record the volume of iodine solution added to X and Y. volume added to X ................................ volume added to Y ................................ [1] (v) Complete Fig. 1.2 to show the position on the line of each of the percentage concentrations of ascorbic acid shown in Table 1.2. Using your results in (a)(iv), put the labels X and Y on Fig. 1.2 to show an estimate of the concentrations of ascorbic acid in X and Y. 0.00 0.10 percentage concentration of ascorbic acid Fig. 1.2 [1] (vi) Identify one significant source of error in this investigation. ........................................................................................................................................... ........................................................................................................................................... ...................................................................................................................................... [1] (vii) Suggest how you would make three improvements to this investigation in order to obtain a more accurate estimate of the concentration of ascorbic acid in X and Y. ........................................................................................................................................... ........................................................................................................................................... ........................................................................................................................................... ........................................................................................................................................... ........................................................................................................................................... ........................................................................................................................................... ...................................................................................................................................... [3] (b) A student carried out further investigations on ascorbic acid to test its effect on the reaction of amylase on starch. Maltose is a product of the hydrolysis of starch. Different concentrations of ascorbic acid were added to standard mixtures of amylase and starch. The student measured the mass of maltose produced. The results are shown in Table 1.4. Table 1.4 percentage mass of maltose concentration of produced / mg ascorbic acid 0.000 97 0.002 52 0.004 42 0.006 33 0.008 25 0.010 19 (i) Plot a graph of the data in Table 1.4 on the grid in Fig. 1.3. Use a sharp pencil for drawing graphs. Fig. 1.3 [4] (ii) Use your graph to find the mass of maltose produced when 0.005% of ascorbic acid was used. Show on the graph how you determined your answer. mass of maltose = ...................................... [2] (iii) Suggest one explanation for the results between 0.000% and 0.010%. ........................................................................................................................................... ........................................................................................................................................... ........................................................................................................................................... ........................................................................................................................................... ........................................................................................................................................... ........................................................................................................................................... ........................................................................................................................................... ...................................................................................................................................... [3] [Total: 22]
Mark scheme: 1(a)(i) mp 1 records a higher volume of iodine for sample A than W ; 1 1(a)(ii) mp 1 0.08, 0.06, 0.04, 0.02 ; mp 2 correct volumes of A and W, that add up to 20 cm3 ; 2 1(a)(iii) mp 1 heading for ‘percentage concentration of ascorbic acid / A’, to left of data and separated by a line from data ; mp 2 heading for ‘volume of iodine / cm3 ‘ ; mp 3 volumes for at least 5 concentrations + correct trend ; mp 4 records volumes to 1 or 2 decimal places ; 4 1(a)(iv) mp 1 records volume of X being larger than the volume of Y + units ; 1 1(a)(v) mp 1 concentrations from Table 1.2 written on the line + correct estimation of concentration of X and Y on scale bar from candidates results ; 1 1(a)(vi) any one from mp 1 drops stick to the side of the tube so the volume is not accurate ; mp 2 difficulty of judgement / identification of appearance of first colour change ; mp 3 drop size / different pressure on syringe / syringe sticking / mixing ; mp 4 iodine evaporating / exposed to light ; mp 5 (ascorbic acid) evaporates or mixes with air so the concentration changes ; mp 6 to narrow a range of ascorbic acid concentrations ; mp 7 iodine came out faster than water ; 1 Question Answer Marks 1(a)(vii) any three from mp 1 more concentrations or narrower range of concentrations (ascorbic acid) ; mp 2 use graduated pipette / syringe / burette, with smaller divisions ; mp 3 use colorimeter or have a standard colour to compare ; mp 4 put drops in nearer to mixture or use a smaller, test-tube / container ; mp 5 replicate / repeat / take more readings (each concentration) ; mp 6 plot a graph and read off from the graph ; mp 7 use a, wider / larger test-tube / boiling tube / beaker ; mp 8 idea of keeping iodine away from light ; 3 1(b)(i) mp 1 label on x-axis, ‘percentage concentration of ascorbic acid’ + label on y-axis, ‘mass of maltose produced / mg’ ; mp 2 scale on x-axis is 0.002 to 2 cm + y-axis is 20 to 2 cm + labelled at least each 2 cm ; mp 3 correct plotting of six points with a small cross or dot in circle ; mp 4 line sharp and joined point to point ; 4 1(b)(ii) mp 1 shows on graph how to read off from 0.005% ; mp 2 correctly reads from graph the mass of maltose + mg ; 2 Question Answer Marks 1(b)(iii) any three from idea of inhibitor mp 1 idea of ascorbic acid acts as an inhibitor ; mp 2 binds to the enzyme / active site ; mp 3 changes the shape of the active site (if non-competitive inhibitor) / or competes with substrate for active site (if competitive inhibitor) ; mp 4 prevents the substrate from binding ; mp 5 less enzyme substrate complexes formed ; or Idea of ascorbic acid changing the pH mp 1 more ascorbic acid present lowers the pH ; mp 2 enzyme becomes inactive / denatured as pH is lowered ; mp 3 changes the shape of the active site ; mp 4 prevents the substrate from binding ; mp 5 less enzyme substrate complexes formed ; 3
Q2 · M1 is a slide of a stained transverse section through a plant root
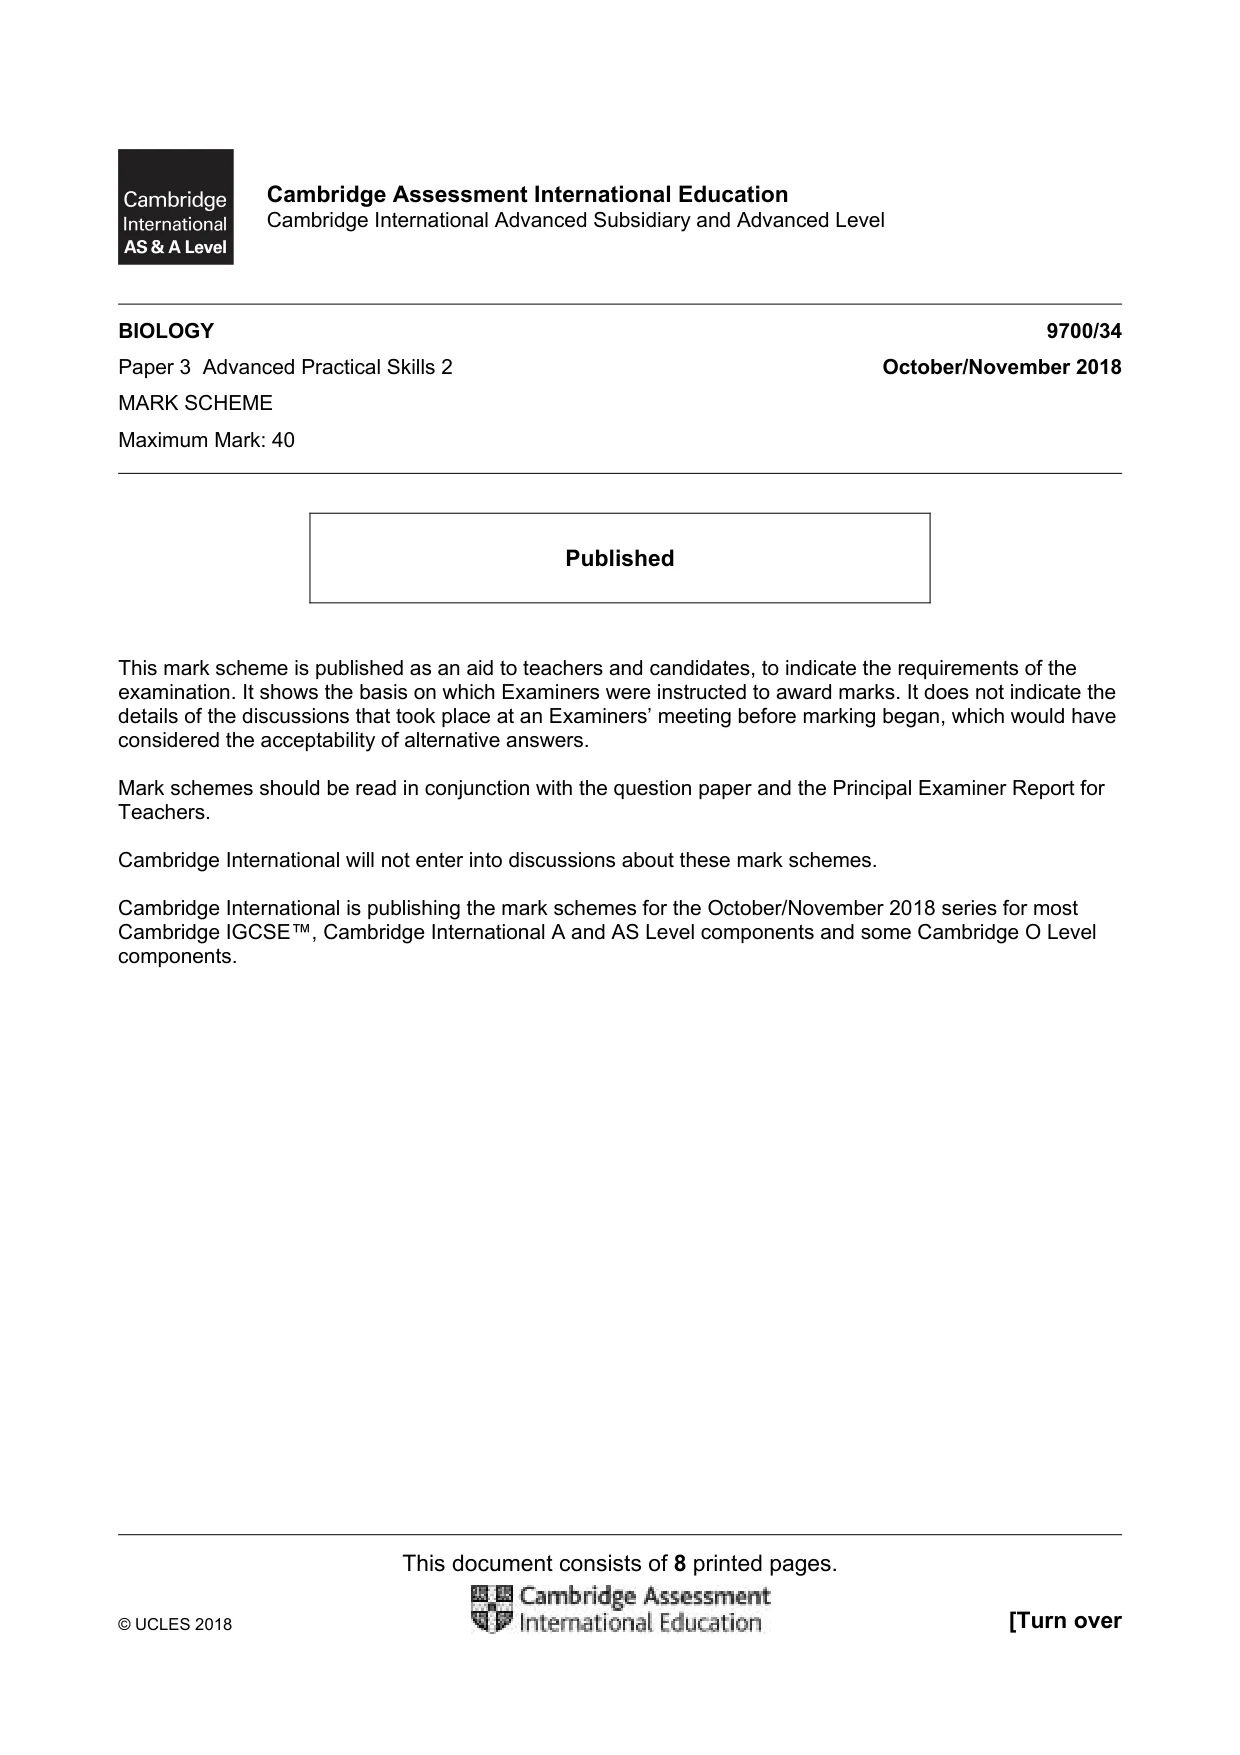
2 M1 is a slide of a stained transverse section through a plant root. You are not expected to be familiar with this specimen. Use a sharp pencil for drawing. (a) (i) Draw a large plan diagram of the transverse section through the root. Use one ruled label line and label to identify the cortex. You are expected to draw the correct shape and proportions of the different tissues. [4] (ii) Observe the cells in the epidermis and the cells directly beneath the epidermis. Select a group of four touching cells. These four cells must include: • two epidermal cells that are touching each other • two cells directly beneath the epidermis that are touching each other and are also touching at least one of the epidermal cells. Make a large drawing of this group of four touching cells. Use one ruled label line and label to identify the cell wall of one cell. You are expected to draw the correct shape and proportions of the different cells. [5] (b) Fig. 2.1 is a photomicrograph of a stained transverse section through a root of a different type of plant. You are not expected to be familiar with this specimen. E F Fig. 2.1 Use the line E–F to determine the simplest whole number ratio of the total diameter of the root to the diameter of the central vascular tissue. Show your working. ratio .................................... [5]
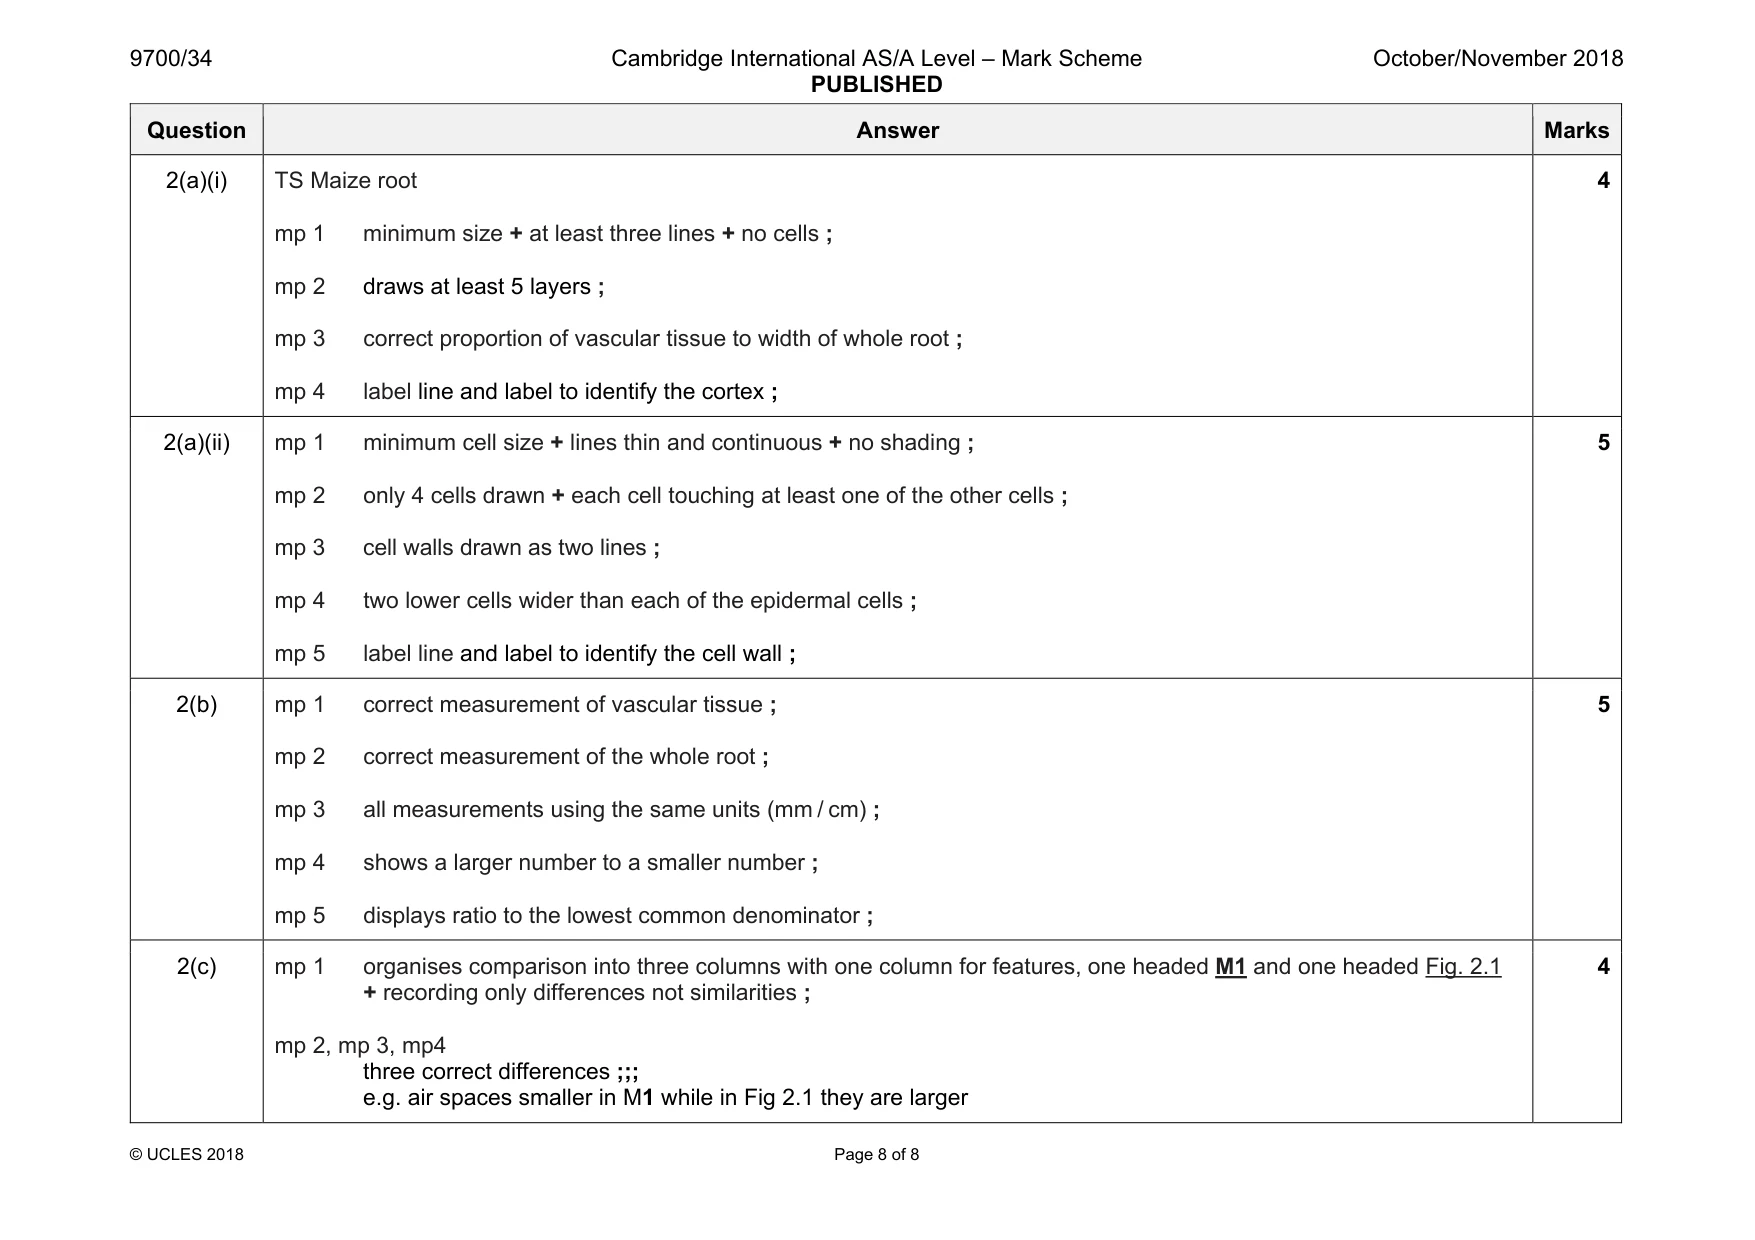
Mark scheme: 2(a)(i) TS Maize root mp 1 minimum size + at least three lines + no cells ; mp 2 draws at least 5 layers ; mp 3 correct proportion of vascular tissue to width of whole root ; mp 4 label line and label to identify the cortex ; 4 2(a)(ii) mp 1 minimum cell size + lines thin and continuous + no shading ; mp 2 only 4 cells drawn + each cell touching at least one of the other cells ; mp 3 cell walls drawn as two lines ; mp 4 two lower cells wider than each of the epidermal cells ; mp 5 label line and label to identify the cell wall ; 5 2(b) mp 1 correct measurement of vascular tissue ; mp 2 correct measurement of the whole root ; mp 3 all measurements using the same units (mm / cm) ; mp 4 shows a larger number to a smaller number ; mp 5 displays ratio to the lowest common denominator ; 5 2(c) mp 1 organises comparison into three columns with one column for features, one headed M1 and one headed Fig. 2.1 + recording only differences not similarities ; mp 2, mp 3, mp4 three correct differences ;;; e.g. air spaces smaller in M1 while in Fig 2.1 they are larger 4
More questions on Cells as the basic units of living organisms
What was in this paper
The subtopics covered by these 2 questions, and how many questions each got. Open one in a new tab to see every Cambridge question on it.
What you needed in this session
Cambridge’s own grade thresholds for 2018 Oct/Nov, Paper 3 · Variant 4. A higher threshold means an easier paper — the bar moves with how the cohort did.