Cambridge A Level Biology 9700 — 2018 Oct/Nov Paper 3 · Variant 5
9700/35/O/N/18 · 2 questions · 40 marks · ≈45 min
The question paper and its mark scheme, free to read here and free to download. This is Cambridge’s own paper, exactly as it was sat.
Question paper12 pages


Mark scheme7 pages
Answers below. Sit the paper first if you are practising.
Questions as text
Q1 · The enzyme, E, hydrolyses (breaks down) the protein in milk
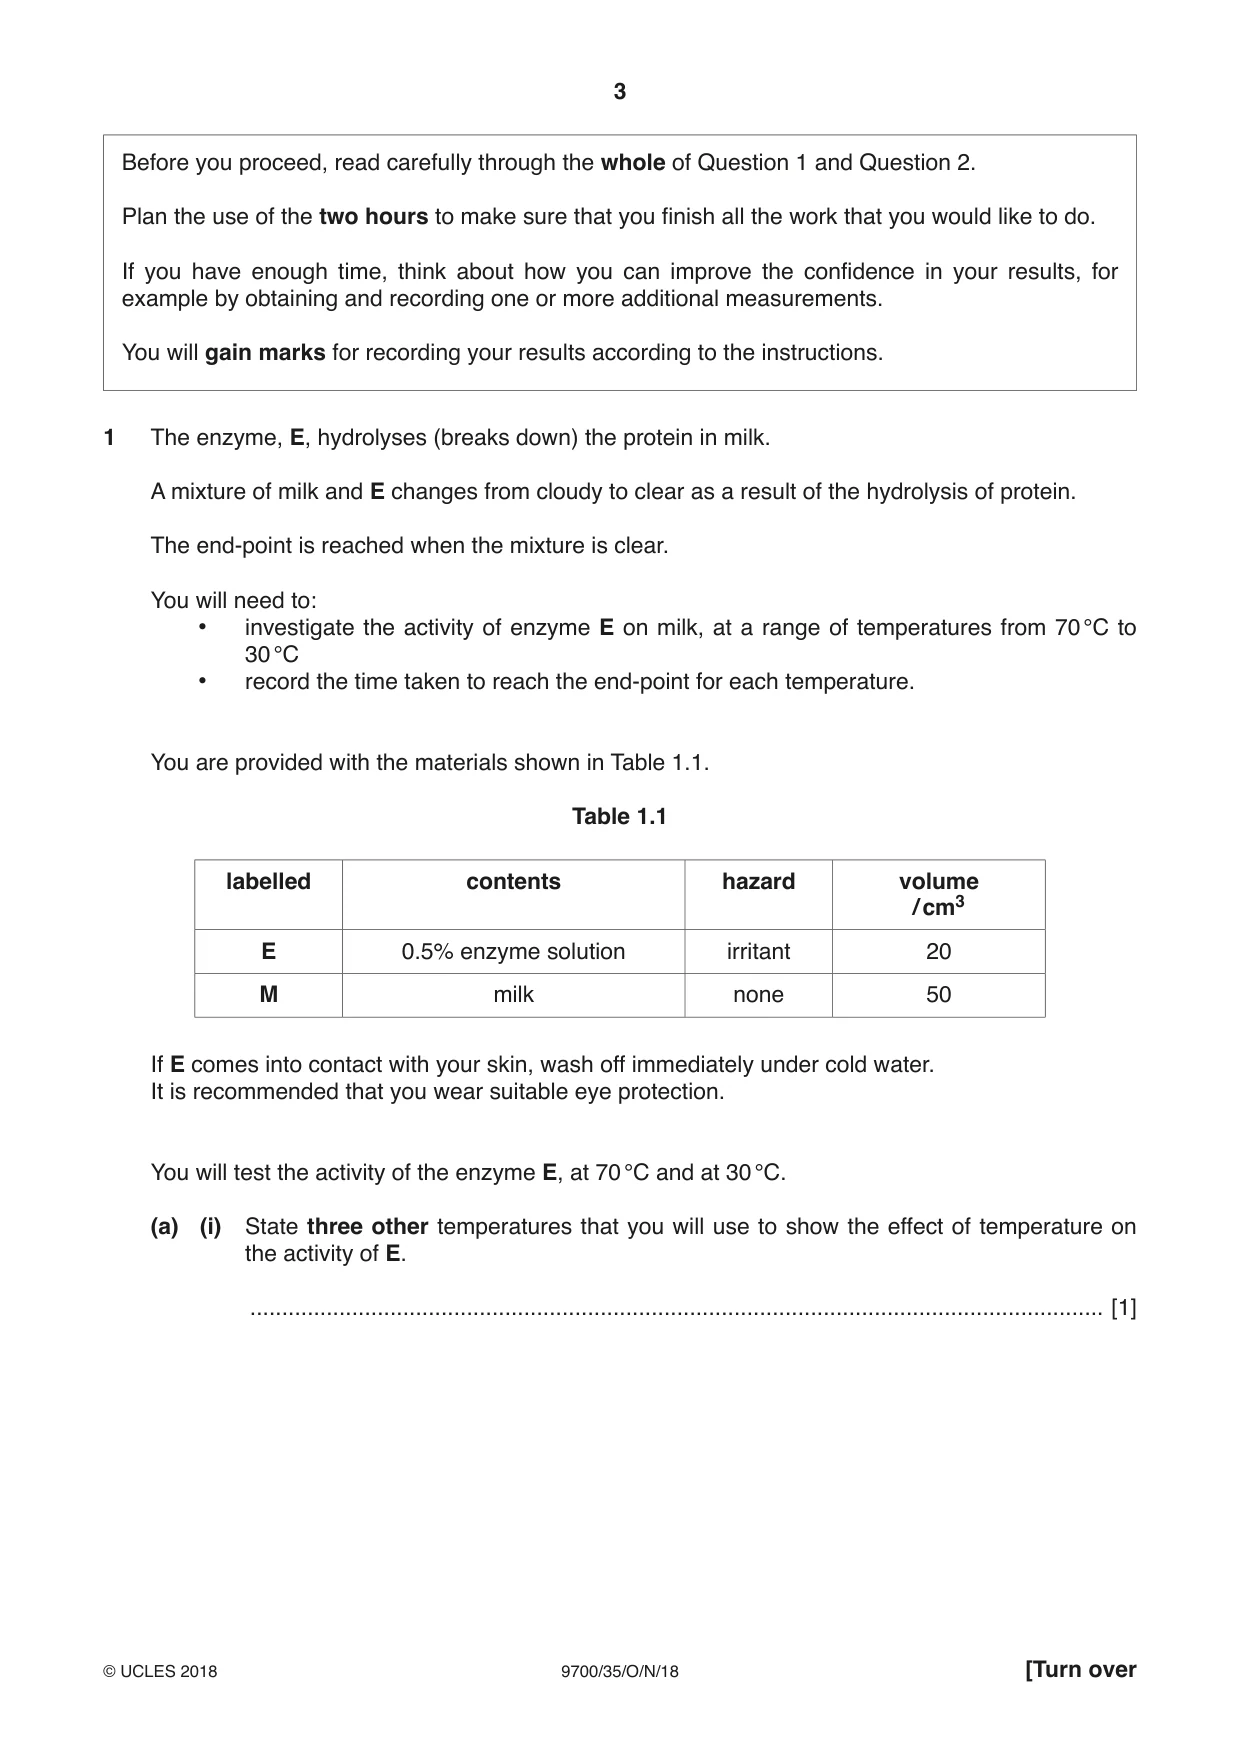
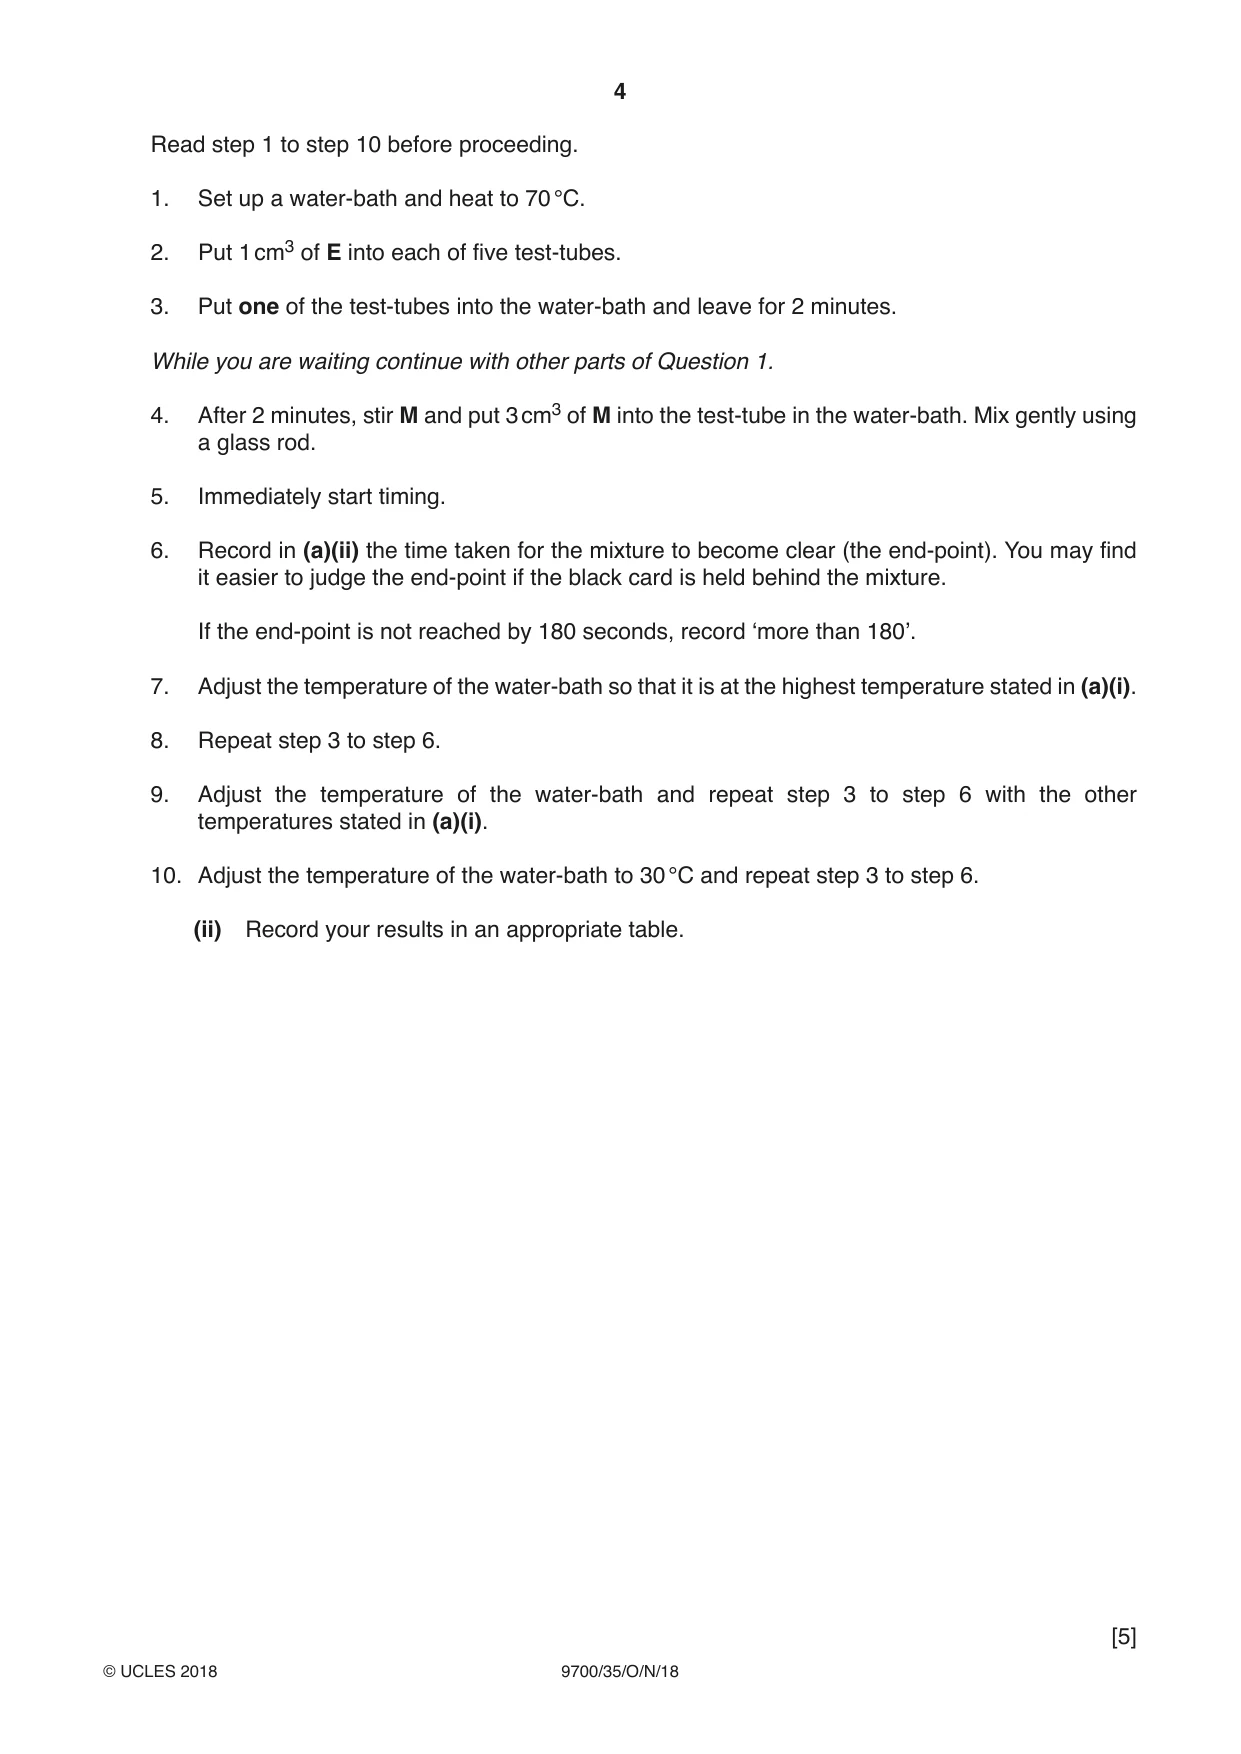
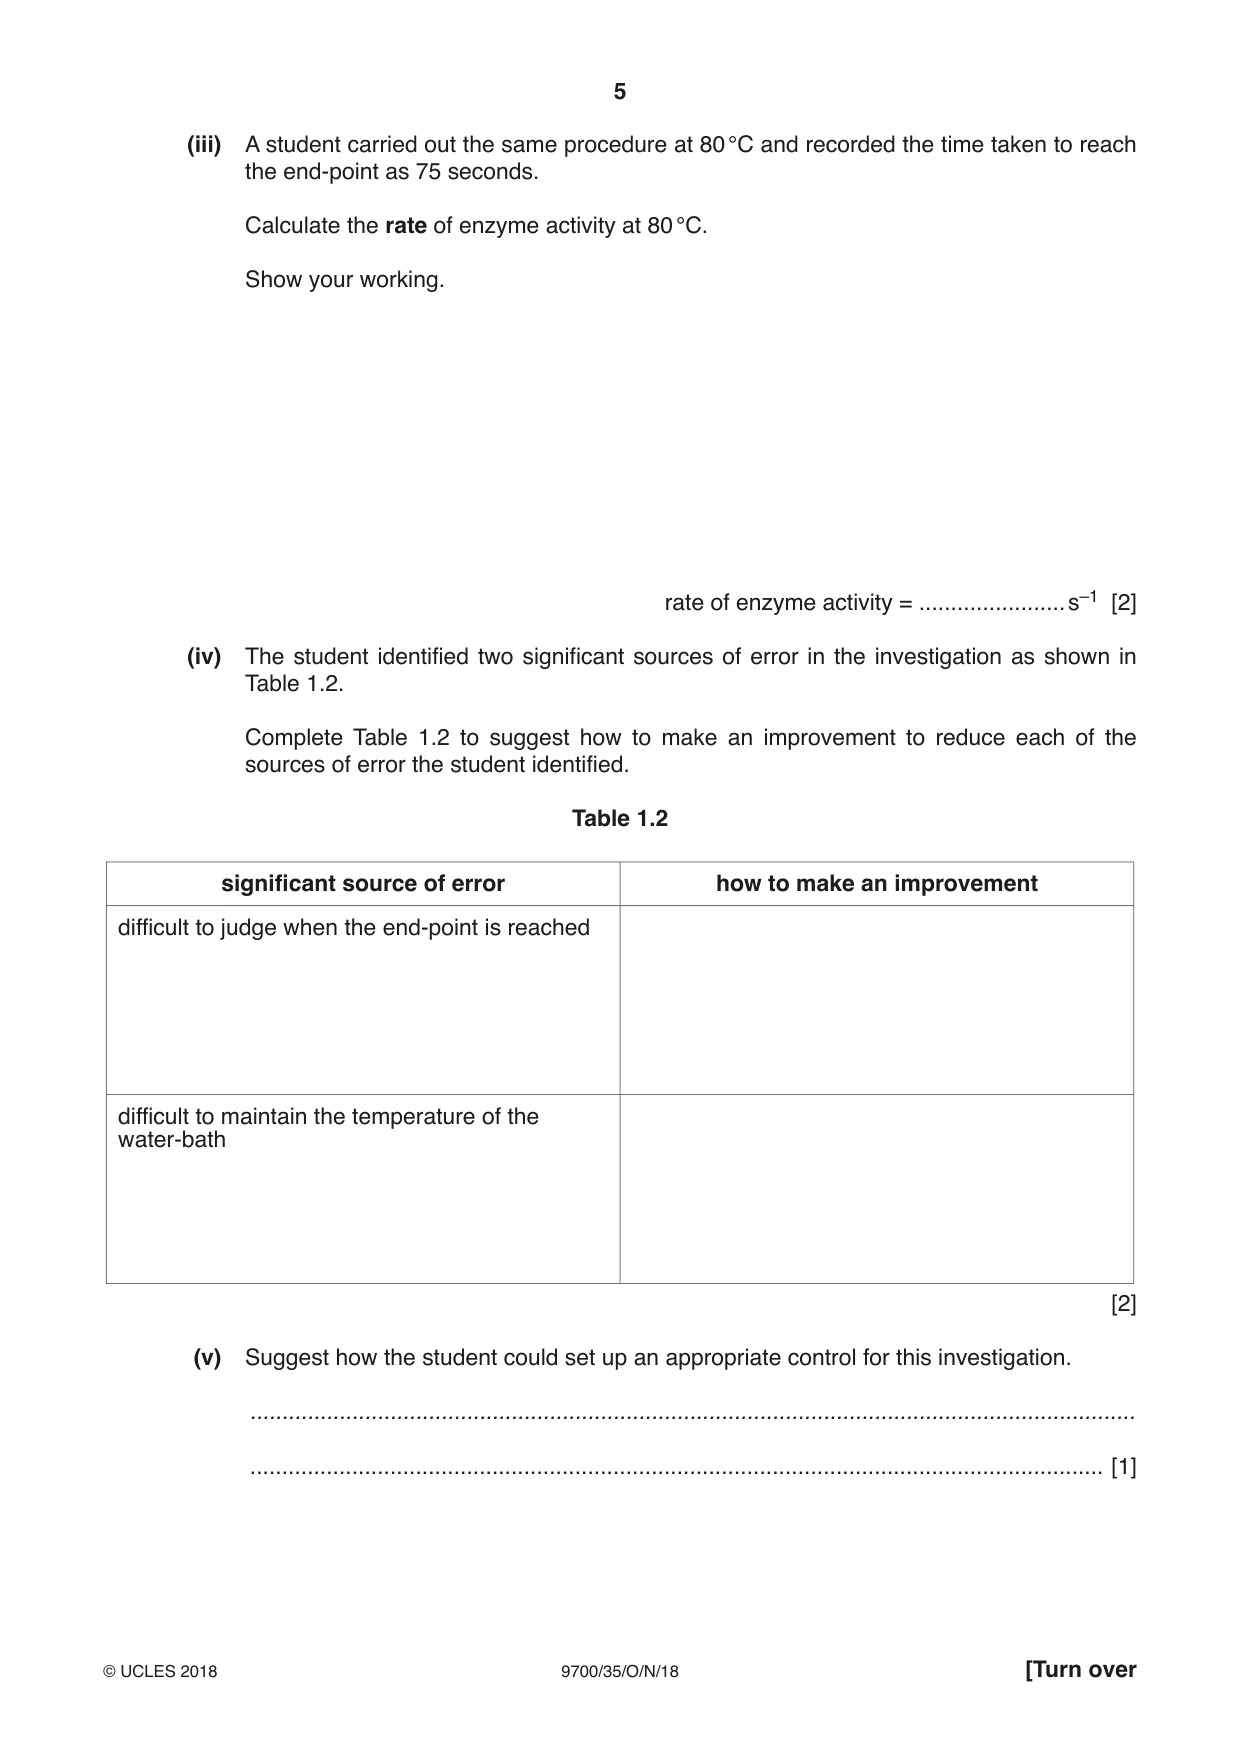
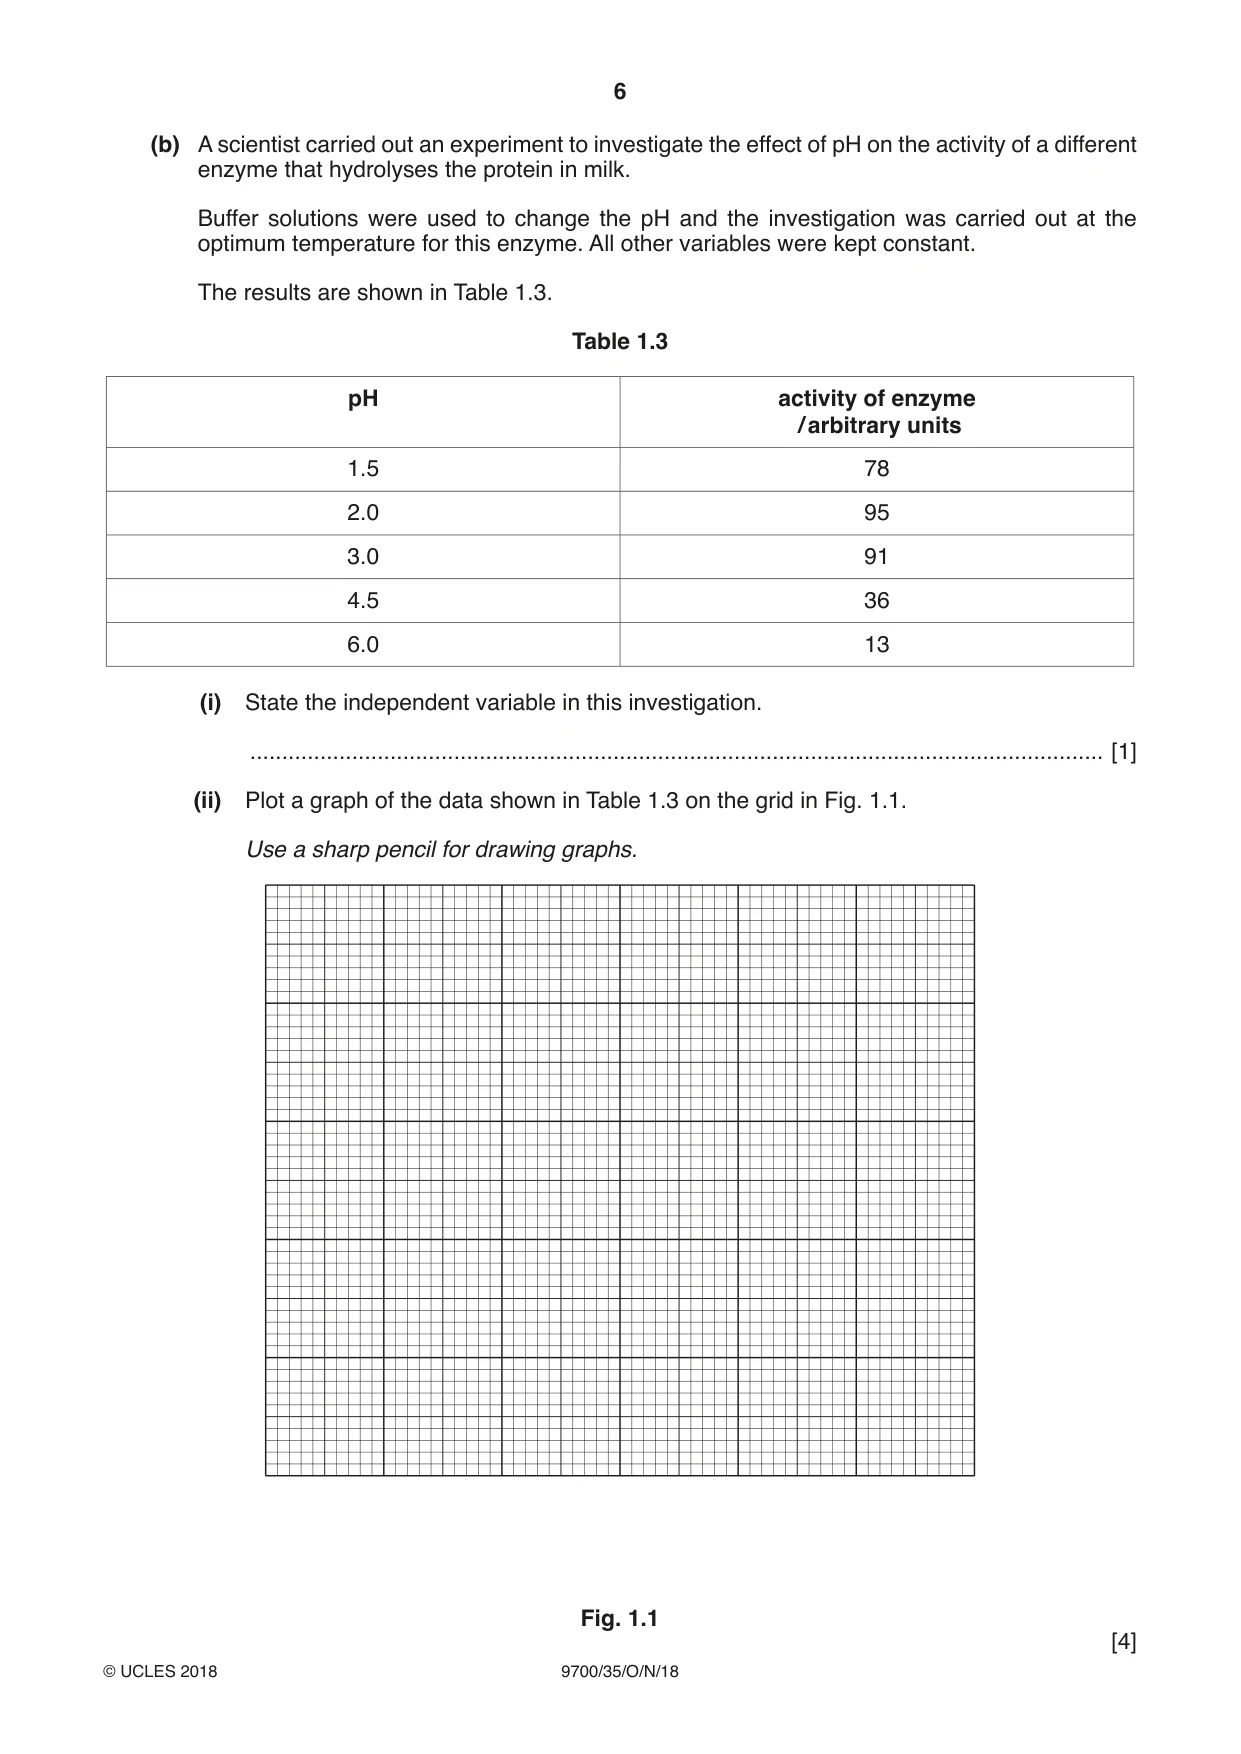
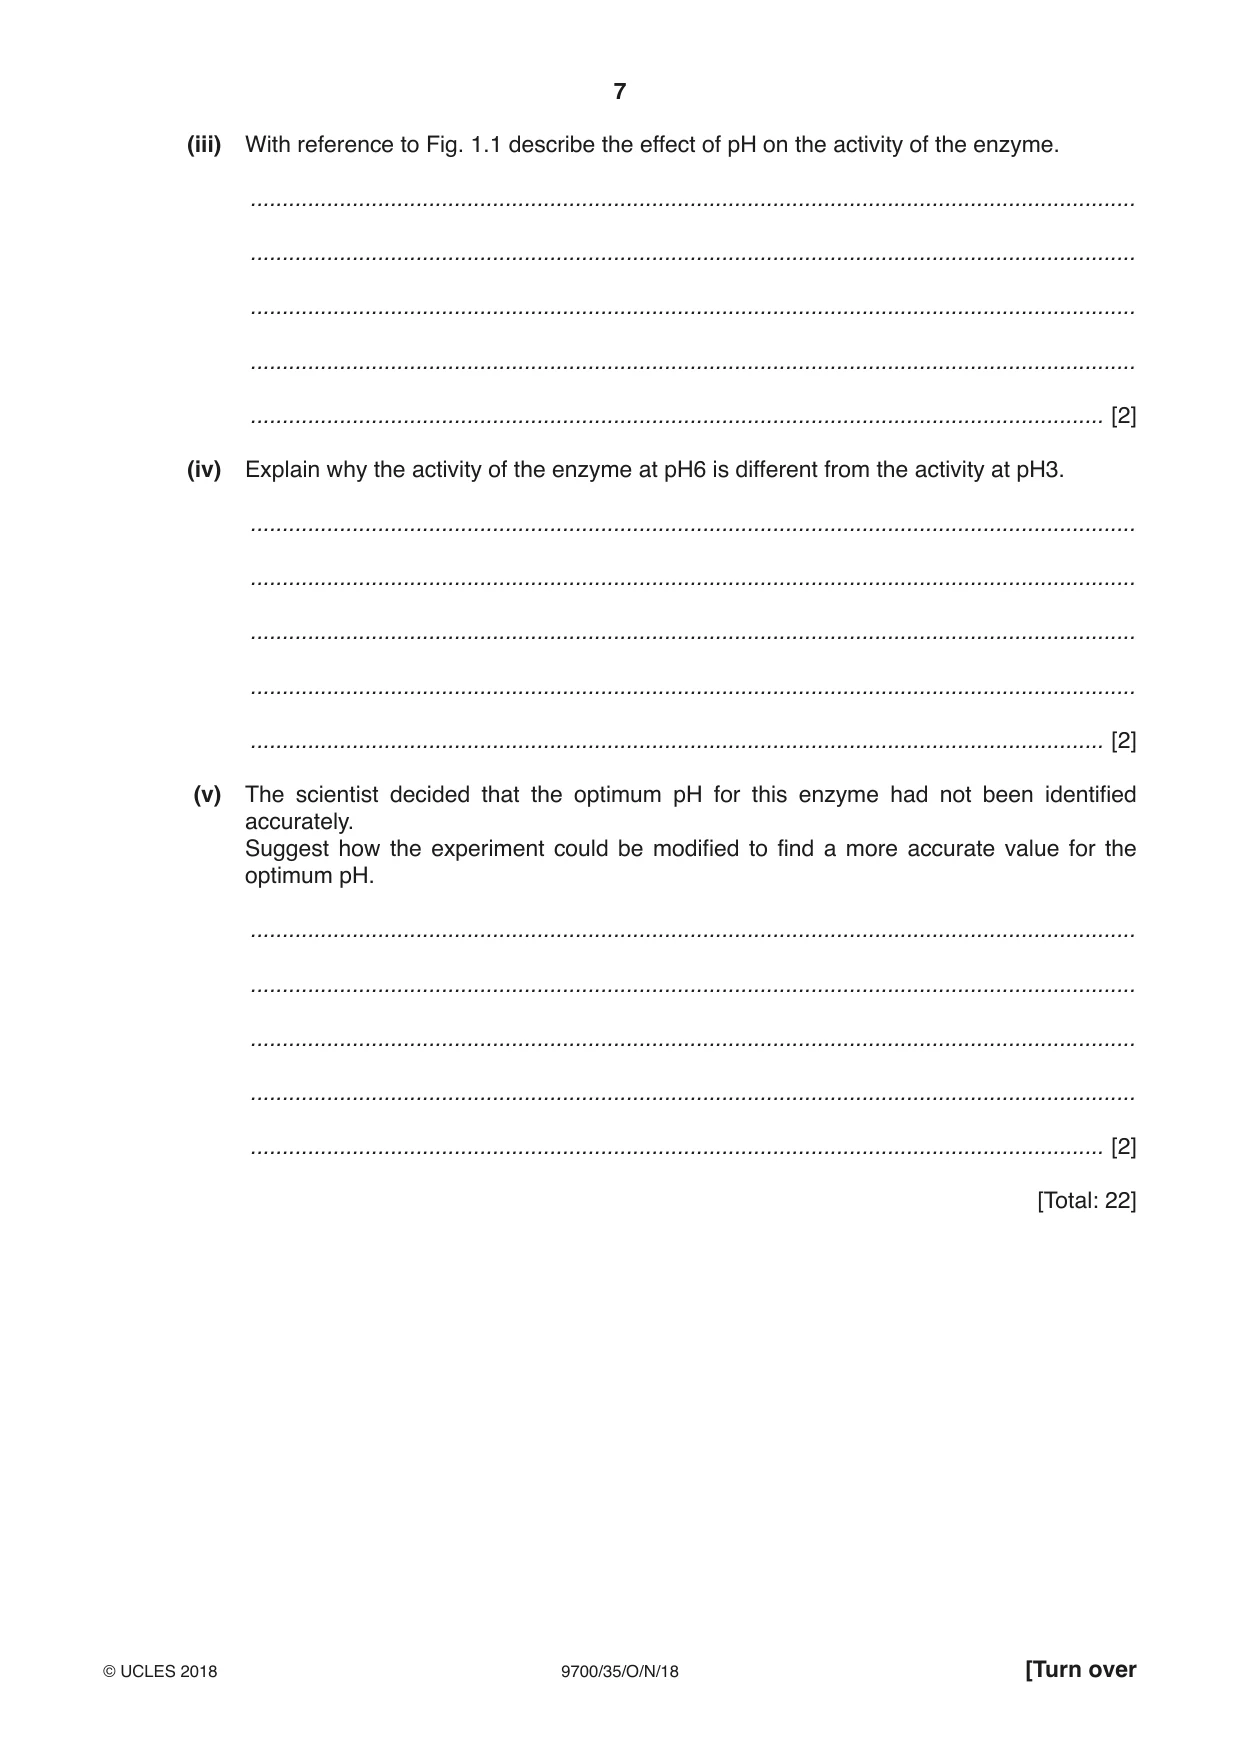
1 The enzyme, E, hydrolyses (breaks down) the protein in milk. A mixture of milk and E changes from cloudy to clear as a result of the hydrolysis of protein. The end-point is reached when the mixture is clear. You will need to: • investigate the activity of enzyme E on milk, at a range of temperatures from 70 °C to 30 °C • record the time taken to reach the end-point for each temperature. You are provided with the materials shown in Table 1.1. Table 1.1 labelled contents hazard volume / cm3 E 0.5% enzyme solution irritant 20 M milk none 50 If E comes into contact with your skin, wash off immediately under cold water. It is recommended that you wear suitable eye protection. You will test the activity of the enzyme E, at 70 °C and at 30 °C. (a) (i) State three other temperatures that you will use to show the effect of temperature on the activity of E. ...................................................................................................................................... [1] Read step 1 to step 10 before proceeding. 1. Set up a water-bath and heat to 70 °C. 2. Put 1 cm3 of E into each of five test-tubes. 3. Put one of the test-tubes into the water-bath and leave for 2 minutes. While you are waiting continue with other parts of Question 1. 4. After 2 minutes, stir M and put 3 cm3 of M into the test-tube in the water-bath. Mix gently using a glass rod. 5. Immediately start timing. 6. Record in (a)(ii) the time taken for the mixture to become clear (the end-point). You may find it easier to judge the end-point if the black card is held behind the mixture. If the end-point is not reached by 180 seconds, record ‘more than 180’. 7. Adjust the temperature of the water-bath so that it is at the highest temperature stated in (a)(i). 8. Repeat step 3 to step 6. 9. Adjust the temperature of the water-bath and repeat step 3 to step 6 with the other temperatures stated in (a)(i). 10. Adjust the temperature of the water-bath to 30 °C and repeat step 3 to step 6. (ii) Record your results in an appropriate table. [5] (iii) A student carried out the same procedure at 80 °C and recorded the time taken to reach the end-point as 75 seconds. Calculate the rate of enzyme activity at 80 °C. Show your working. rate of enzyme activity = ....................... s–1 [2] (iv) The student identified two significant sources of error in the investigation as shown in Table 1.2. Complete Table 1.2 to suggest how to make an improvement to reduce each of the sources of error the student identified. Table 1.2 significant source of error how to make an improvement difficult to judge when the end-point is reached difficult to maintain the temperature of the water-bath [2] (v) Suggest how the student could set up an appropriate control for this investigation. ........................................................................................................................................... ...................................................................................................................................... [1] (b) A scientist carried out an experiment to investigate the effect of pH on the activity of a different enzyme that hydrolyses the protein in milk. Buffer solutions were used to change the pH and the investigation was carried out at the optimum temperature for this enzyme. All other variables were kept constant. The results are shown in Table 1.3. Table 1.3 pH activity of enzyme / arbitrary units 1.5 78 2.0 95 3.0 91 4.5 36 6.0 13 (i) State the independent variable in this investigation. ...................................................................................................................................... [1] (ii) Plot a graph of the data shown in Table 1.3 on the grid in Fig. 1.1. Use a sharp pencil for drawing graphs. Fig. 1.1 [4] (iii) With reference to Fig. 1.1 describe the effect of pH on the activity of the enzyme. ........................................................................................................................................... ........................................................................................................................................... ........................................................................................................................................... ........................................................................................................................................... ...................................................................................................................................... [2] (iv) Explain why the activity of the enzyme at pH6 is different from the activity at pH3. ........................................................................................................................................... ........................................................................................................................................... ........................................................................................................................................... ........................................................................................................................................... ...................................................................................................................................... [2] (v) The scientist decided that the optimum pH for this enzyme had not been identified accurately. Suggest how the experiment could be modified to find a more accurate value for the optimum pH. ........................................................................................................................................... ........................................................................................................................................... ........................................................................................................................................... ........................................................................................................................................... ...................................................................................................................................... [2] [Total: 22]
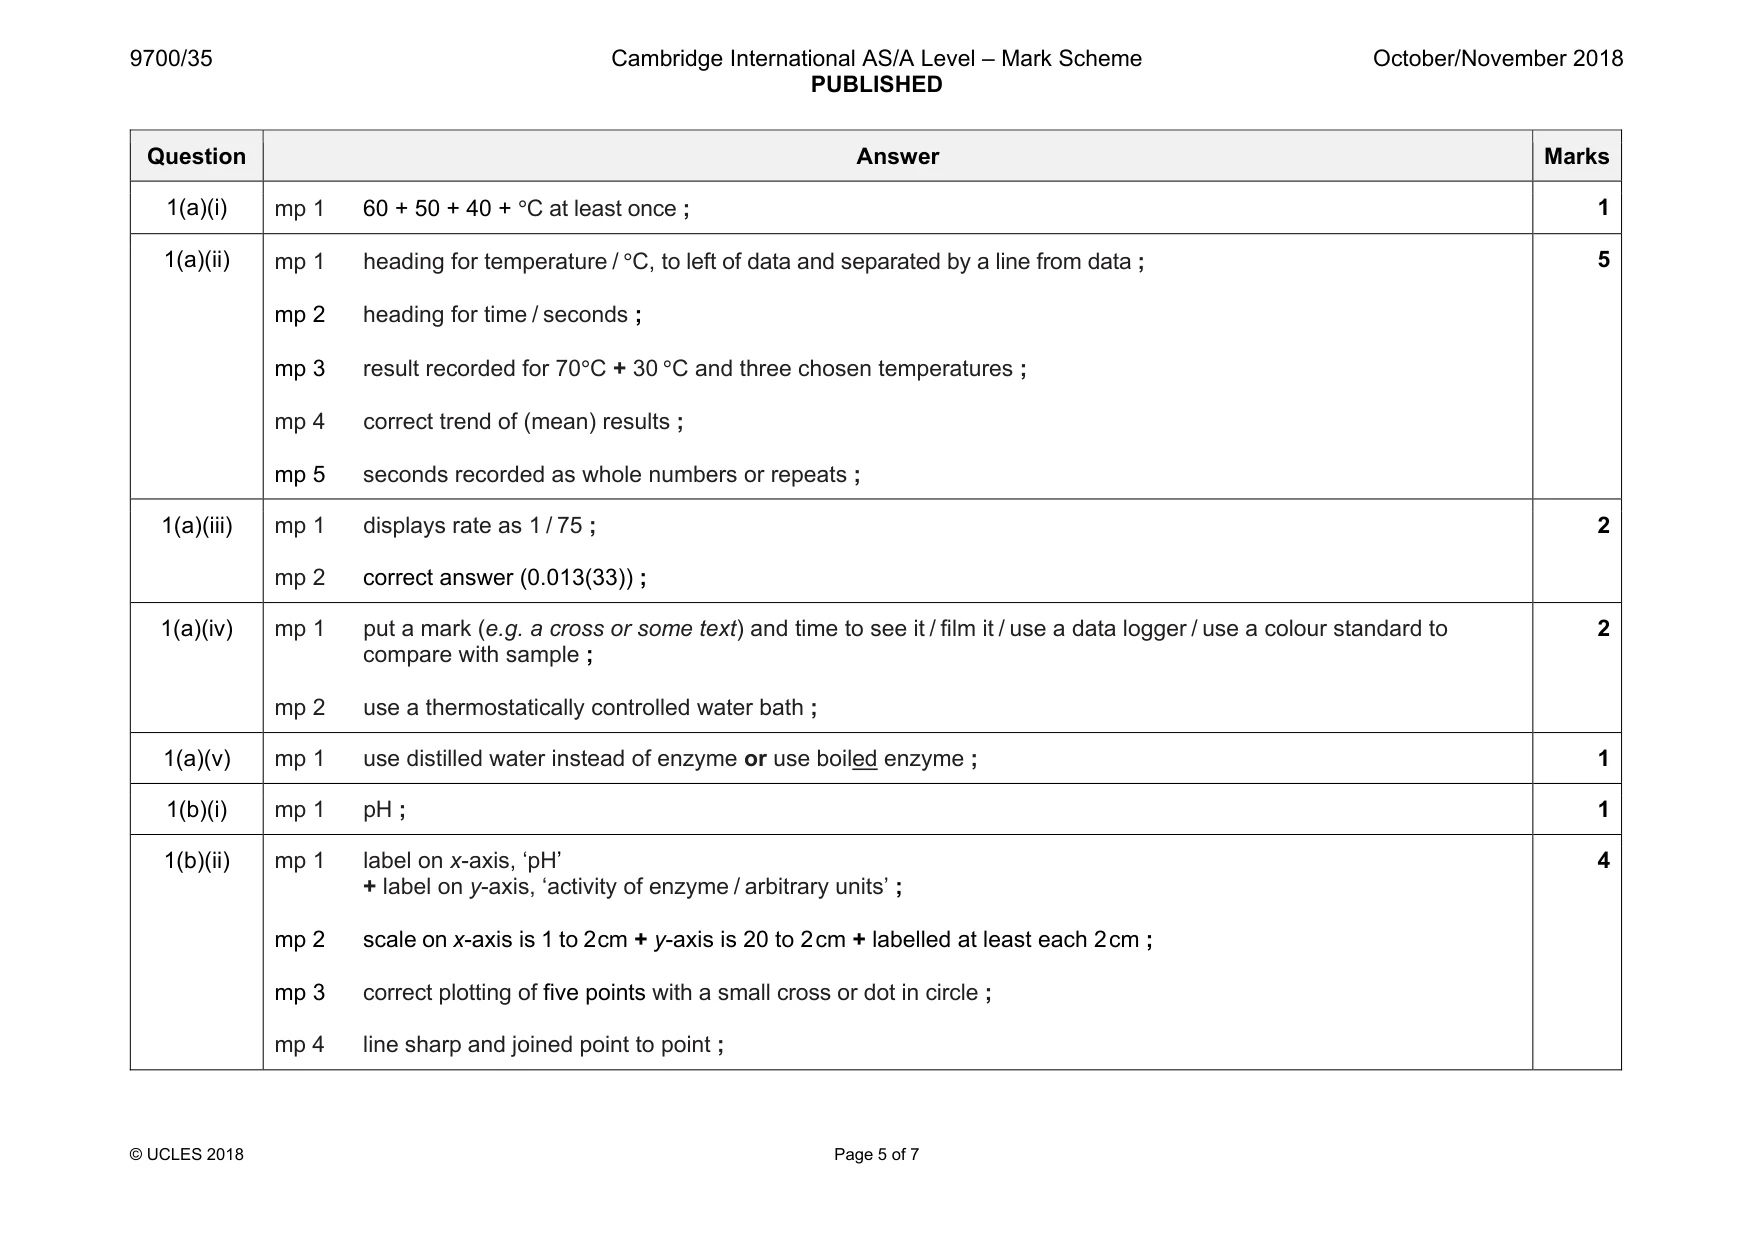
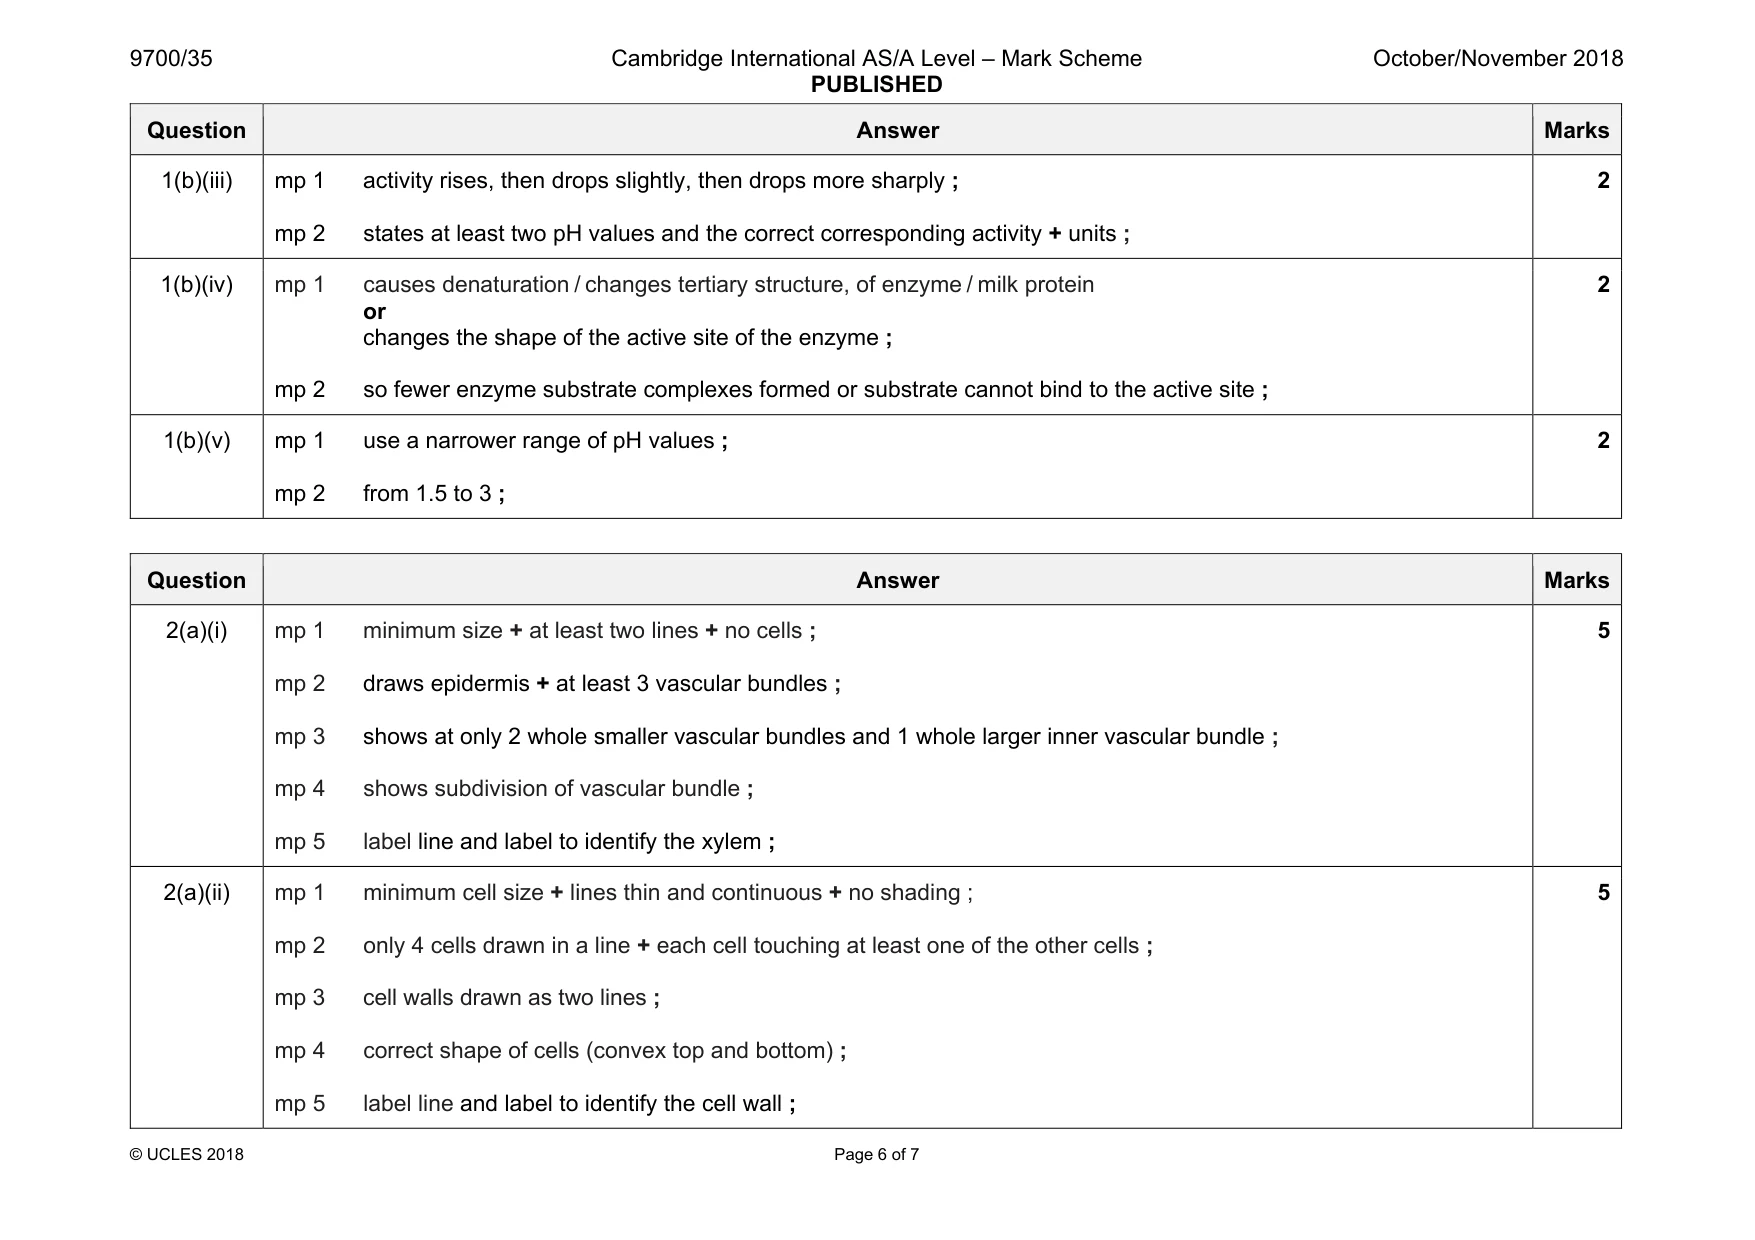
Mark scheme: 1(a)(i) mp 1 1 1(a)(ii) mp 1 heading for temperature / °C, to left of data and separated by a line from data ; mp 2 heading for time / seconds ; mp 3 result recorded for 70°C + 30 °C and three chosen temperatures ; mp 4 correct trend of (mean) results ; mp 5 seconds recorded as whole numbers or repeats ; 5 1(a)(iii) mp 1 displays rate as 1 / 75 ; mp 2 correct answer (0.013(33)) ; 2 1(a)(iv) mp 1 put a mark (e.g. a cross or some text) and time to see it / film it / use a data logger / use a colour standard to compare with sample ; mp 2 use a thermostatically controlled water bath ; 2 1(a)(v) mp 1 use distilled water instead of enzyme or use boiled enzyme ; 1 1(b)(i) mp 1 pH ; 1 1(b)(ii) mp 1 label on x-axis, ‘pH’ + label on y-axis, ‘activity of enzyme / arbitrary units’ ; mp 2 scale on x-axis is 1 to 2 cm + y-axis is 20 to 2 cm + labelled at least each 2 cm ; mp 3 correct plotting of five points with a small cross or dot in circle ; mp 4 line sharp and joined point to point ; 4 Question Answer Marks 1(b)(iii) mp 1 activity rises, then drops slightly, then drops more sharply ; mp 2 states at least two pH values and the correct corresponding activity + units ; 2 1(b)(iv) mp 1 causes denaturation / changes tertiary structure, of enzyme / milk protein or changes the shape of the active site of the enzyme ; mp 2 so fewer enzyme substrate complexes formed or substrate cannot bind to the active site ; 2 1(b)(v) mp 1 use a narrower range of pH values ; mp 2 from 1.5 to 3 ; 2
Q2 · L1 is a slide of a stained transverse section through a plant stem
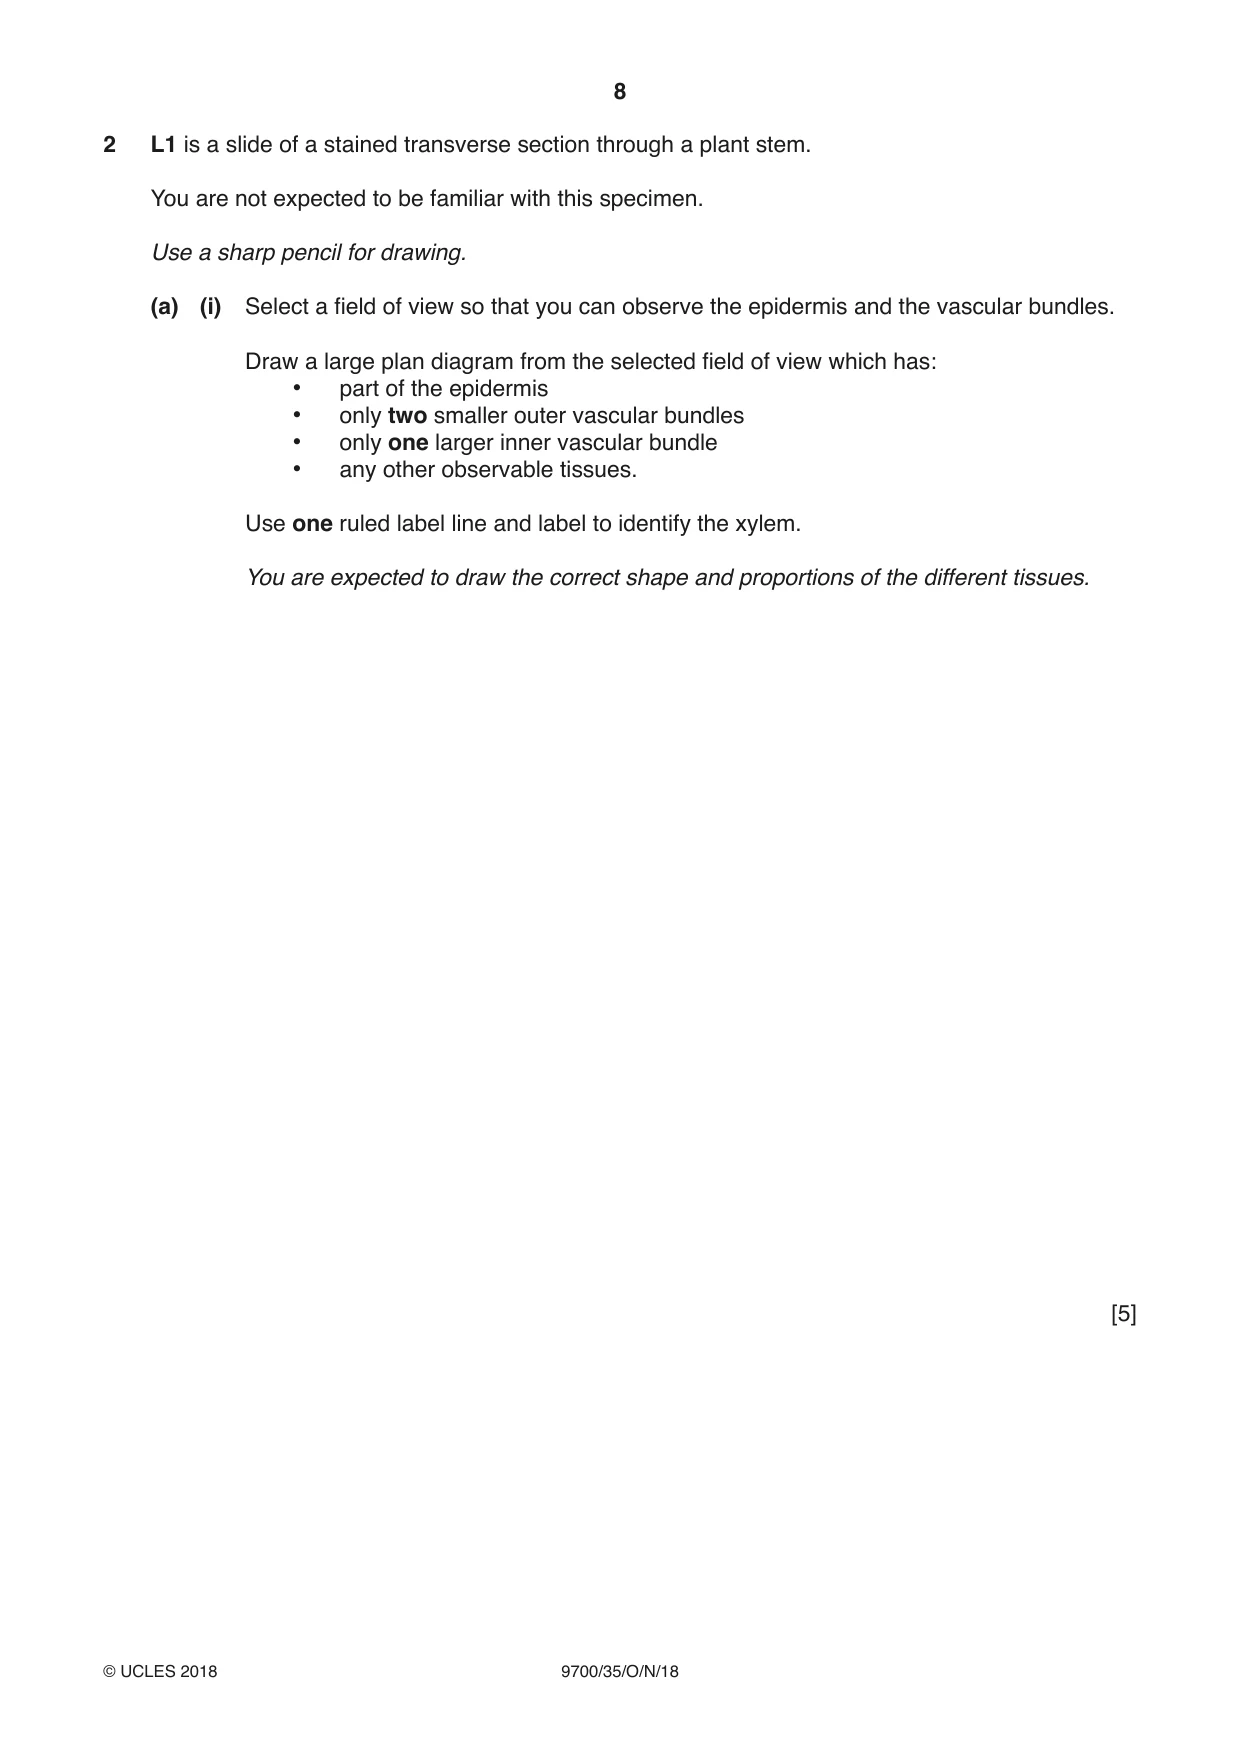
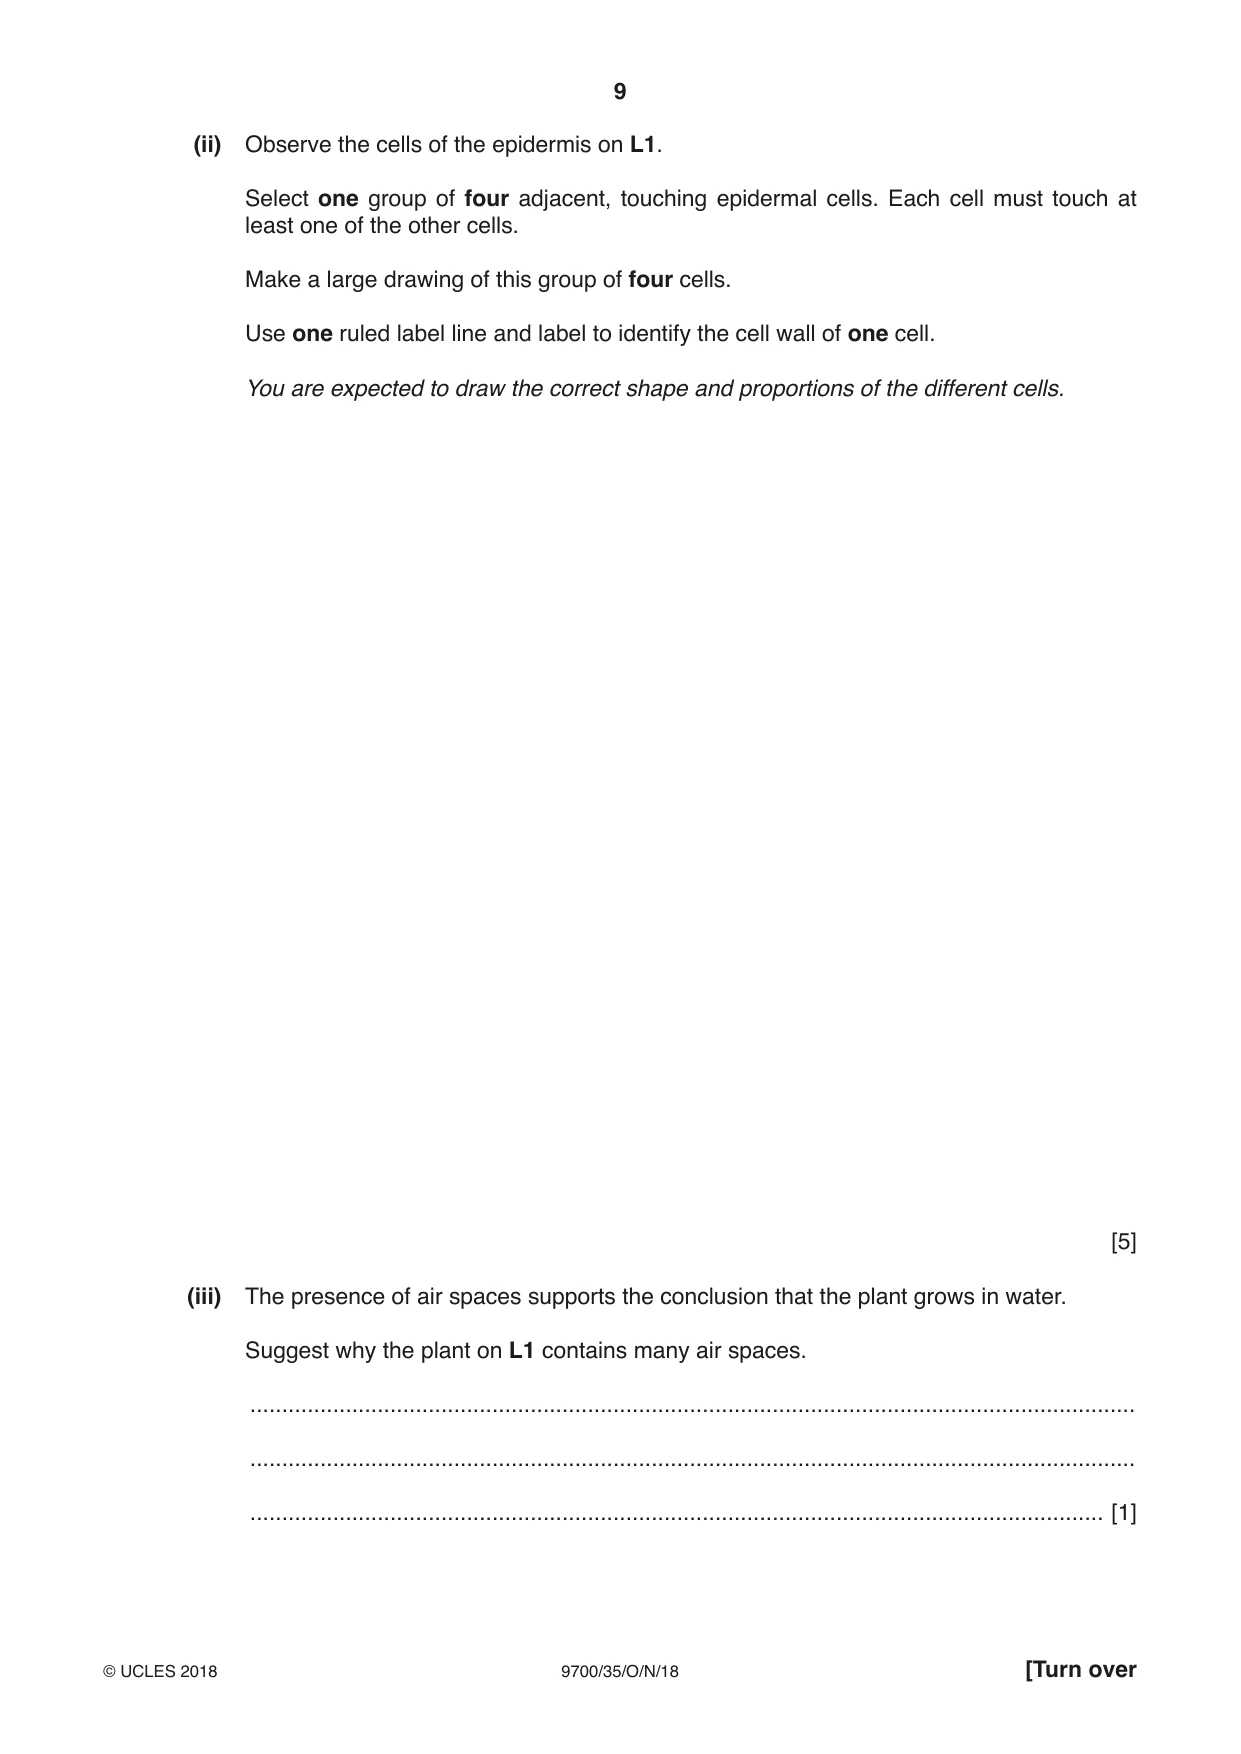
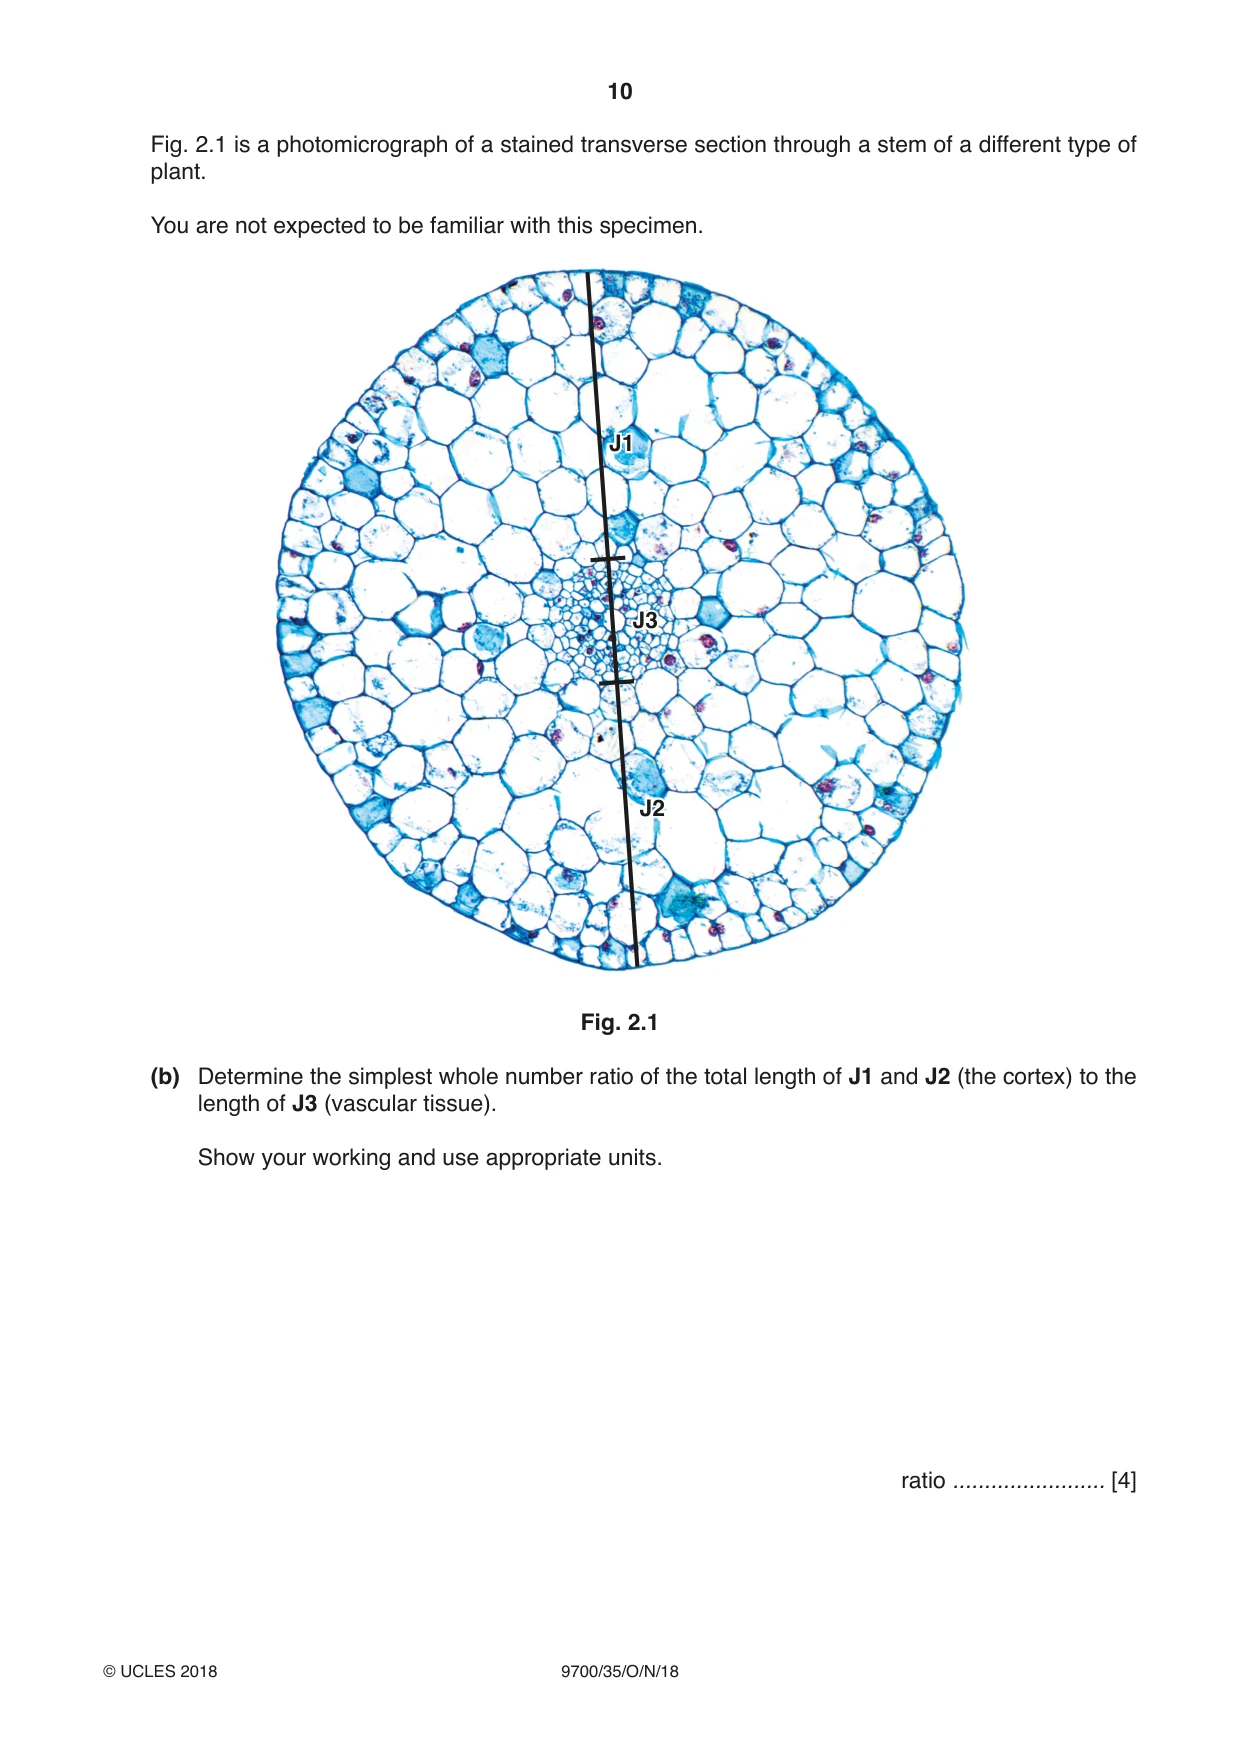
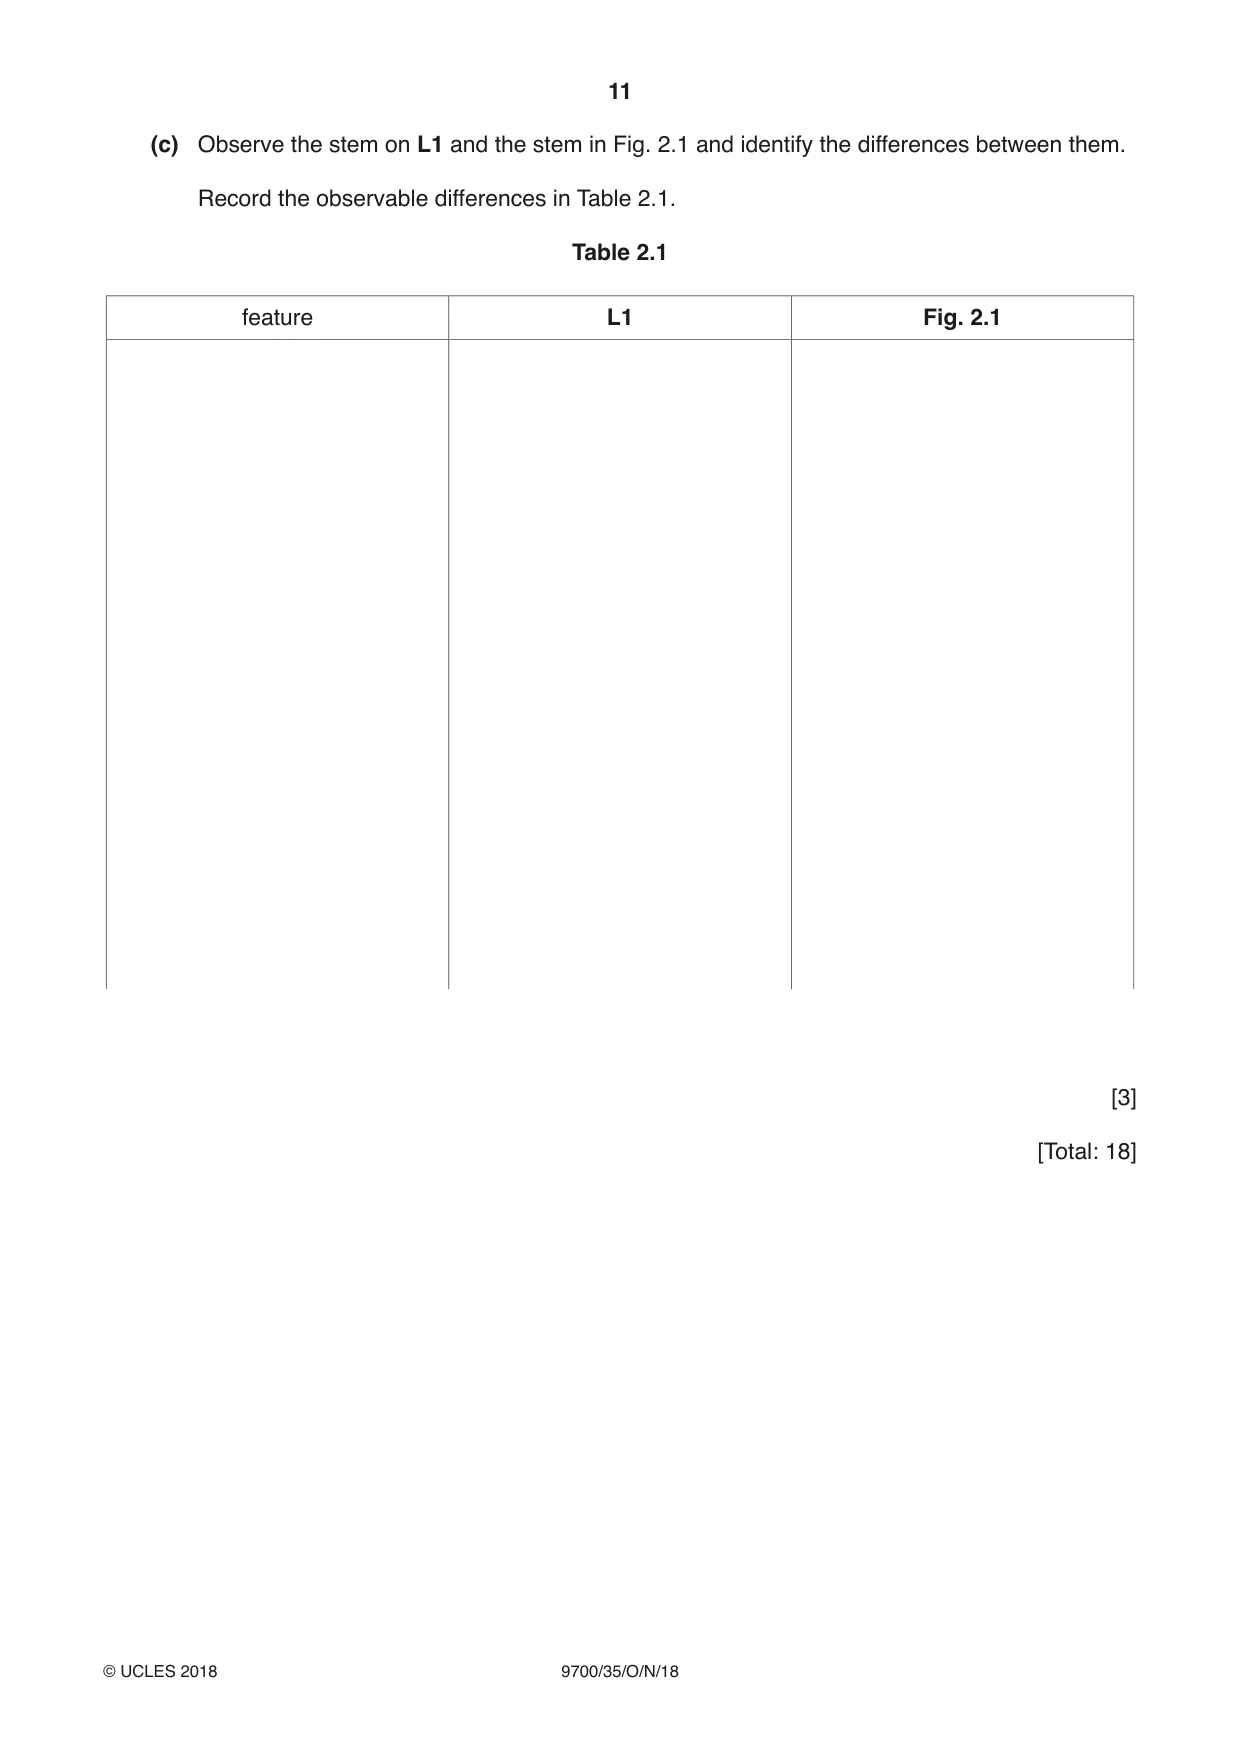
2 L1 is a slide of a stained transverse section through a plant stem. You are not expected to be familiar with this specimen. Use a sharp pencil for drawing. (a) (i) Select a field of view so that you can observe the epidermis and the vascular bundles. Draw a large plan diagram from the selected field of view which has: • part of the epidermis • only two smaller outer vascular bundles • only one larger inner vascular bundle • any other observable tissues. Use one ruled label line and label to identify the xylem. You are expected to draw the correct shape and proportions of the different tissues. [5] (ii) Observe the cells of the epidermis on L1. Select one group of four adjacent, touching epidermal cells. Each cell must touch at least one of the other cells. Make a large drawing of this group of four cells. Use one ruled label line and label to identify the cell wall of one cell. You are expected to draw the correct shape and proportions of the different cells. [5] (iii) The presence of air spaces supports the conclusion that the plant grows in water. Suggest why the plant on L1 contains many air spaces. ........................................................................................................................................... ........................................................................................................................................... ...................................................................................................................................... [1] Fig. 2.1 is a photomicrograph of a stained transverse section through a stem of a different type of plant. You are not expected to be familiar with this specimen. J1 J3 J2 Fig. 2.1 (b) Determine the simplest whole number ratio of the total length of J1 and J2 (the cortex) to the length of J3 (vascular tissue). Show your working and use appropriate units. ratio ........................ [4]
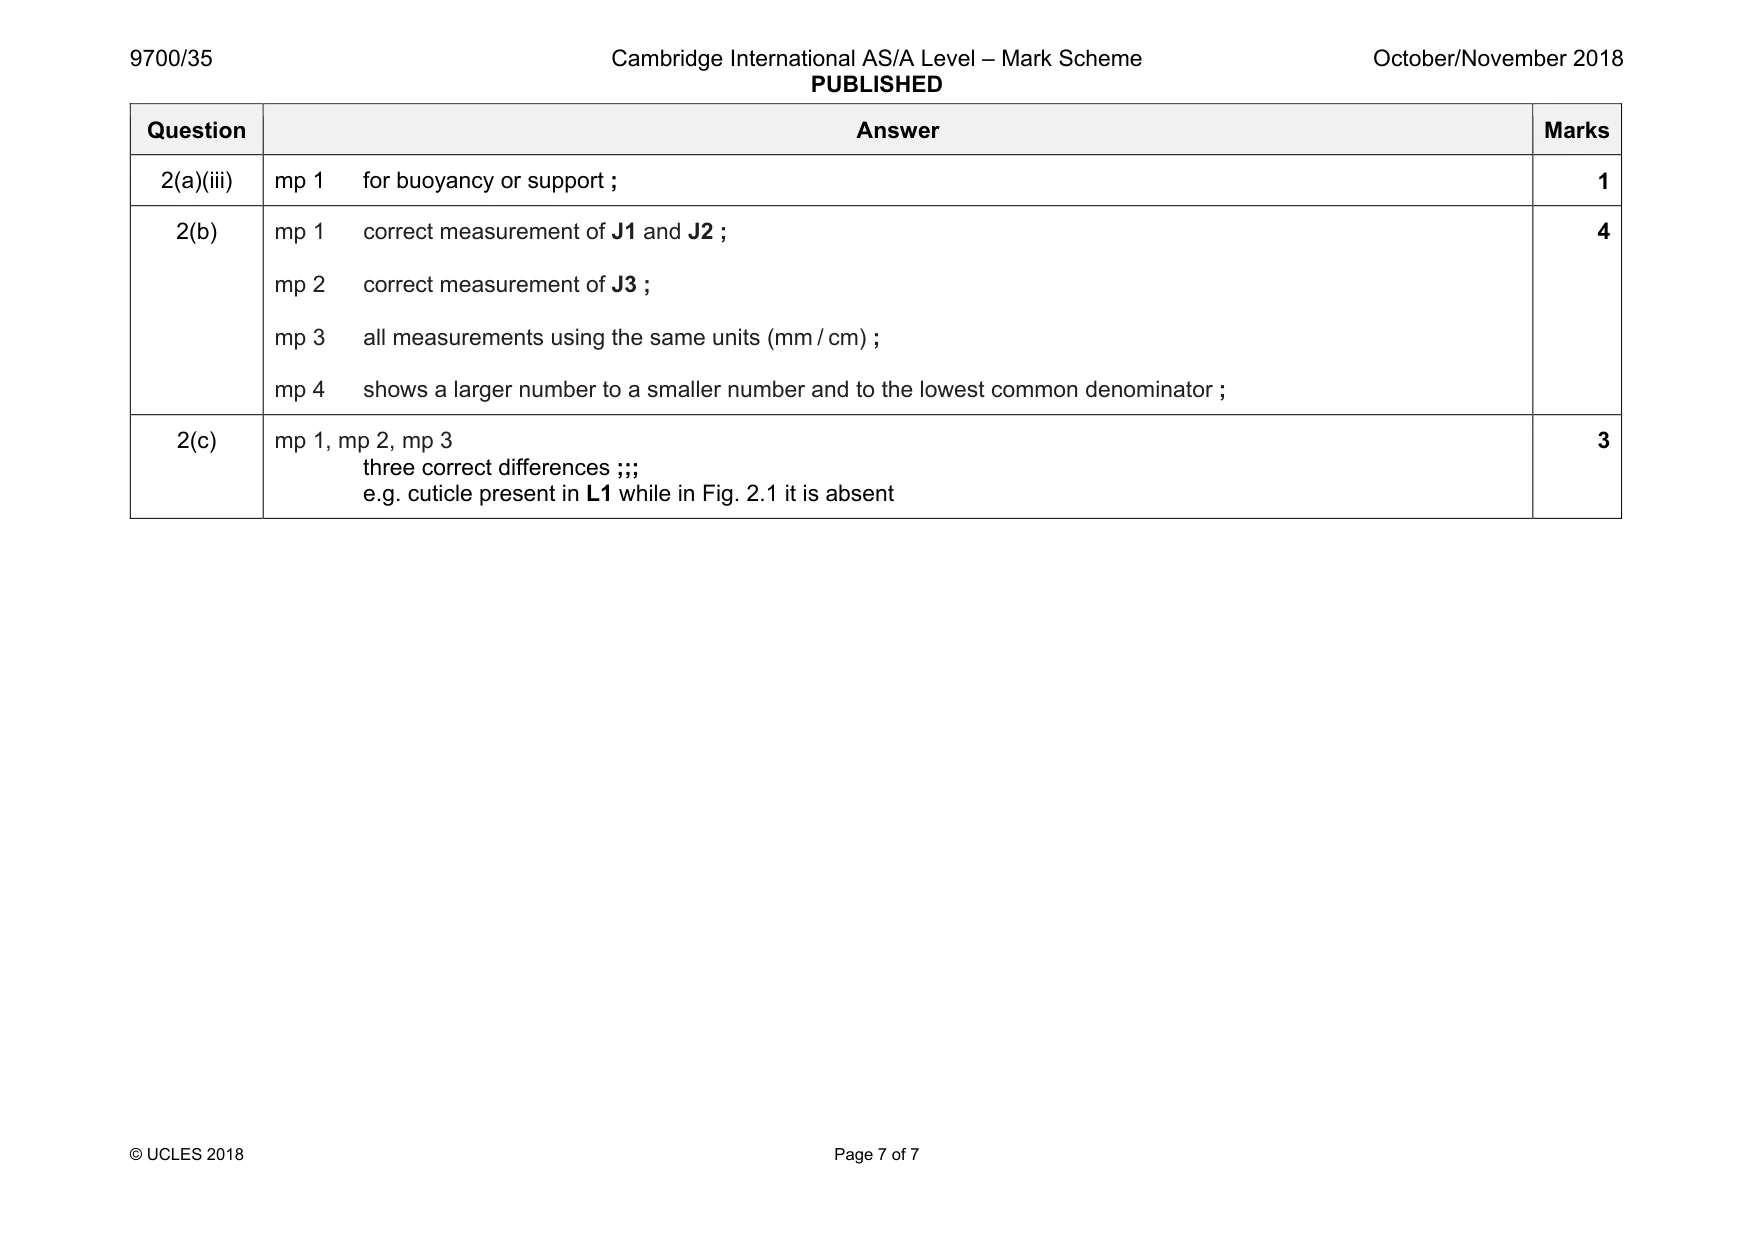
Mark scheme: 2(a)(i) mp 1 minimum size + at least two lines + no cells ; mp 2 draws epidermis + at least 3 vascular bundles ; mp 3 shows at only 2 whole smaller vascular bundles and 1 whole larger inner vascular bundle ; mp 4 shows subdivision of vascular bundle ; mp 5 label line and label to identify the xylem ; 5 2(a)(ii) mp 1 minimum cell size + lines thin and continuous + no shading ; mp 2 only 4 cells drawn in a line + each cell touching at least one of the other cells ; mp 3 cell walls drawn as two lines ; mp 4 correct shape of cells (convex top and bottom) ; mp 5 label line and label to identify the cell wall ; 5 Question Answer Marks 2(a)(iii) mp 1 for buoyancy or support ; 1 2(b) mp 1 correct measurement of J1 and J2 ; mp 2 correct measurement of J3 ; mp 3 all measurements using the same units (mm / cm) ; mp 4 shows a larger number to a smaller number and to the lowest common denominator ; 4 2(c) mp 1, mp 2, mp 3 three correct differences ;;; e.g. cuticle present in L1 while in Fig. 2.1 it is absent 3
What was in this paper
The subtopics covered by these 2 questions, and how many questions each got. Open one in a new tab to see every Cambridge question on it.
What you needed in this session
Cambridge’s own grade thresholds for 2018 Oct/Nov, Paper 3 · Variant 5. A higher threshold means an easier paper — the bar moves with how the cohort did.