Cambridge A Level Biology 9700 — 2018 Oct/Nov Paper 3 · Variant 3
9700/33/O/N/18 · 2 questions · 40 marks · ≈45 min
The question paper and its mark scheme, free to read here and free to download. This is Cambridge’s own paper, exactly as it was sat.
Question paper16 pages
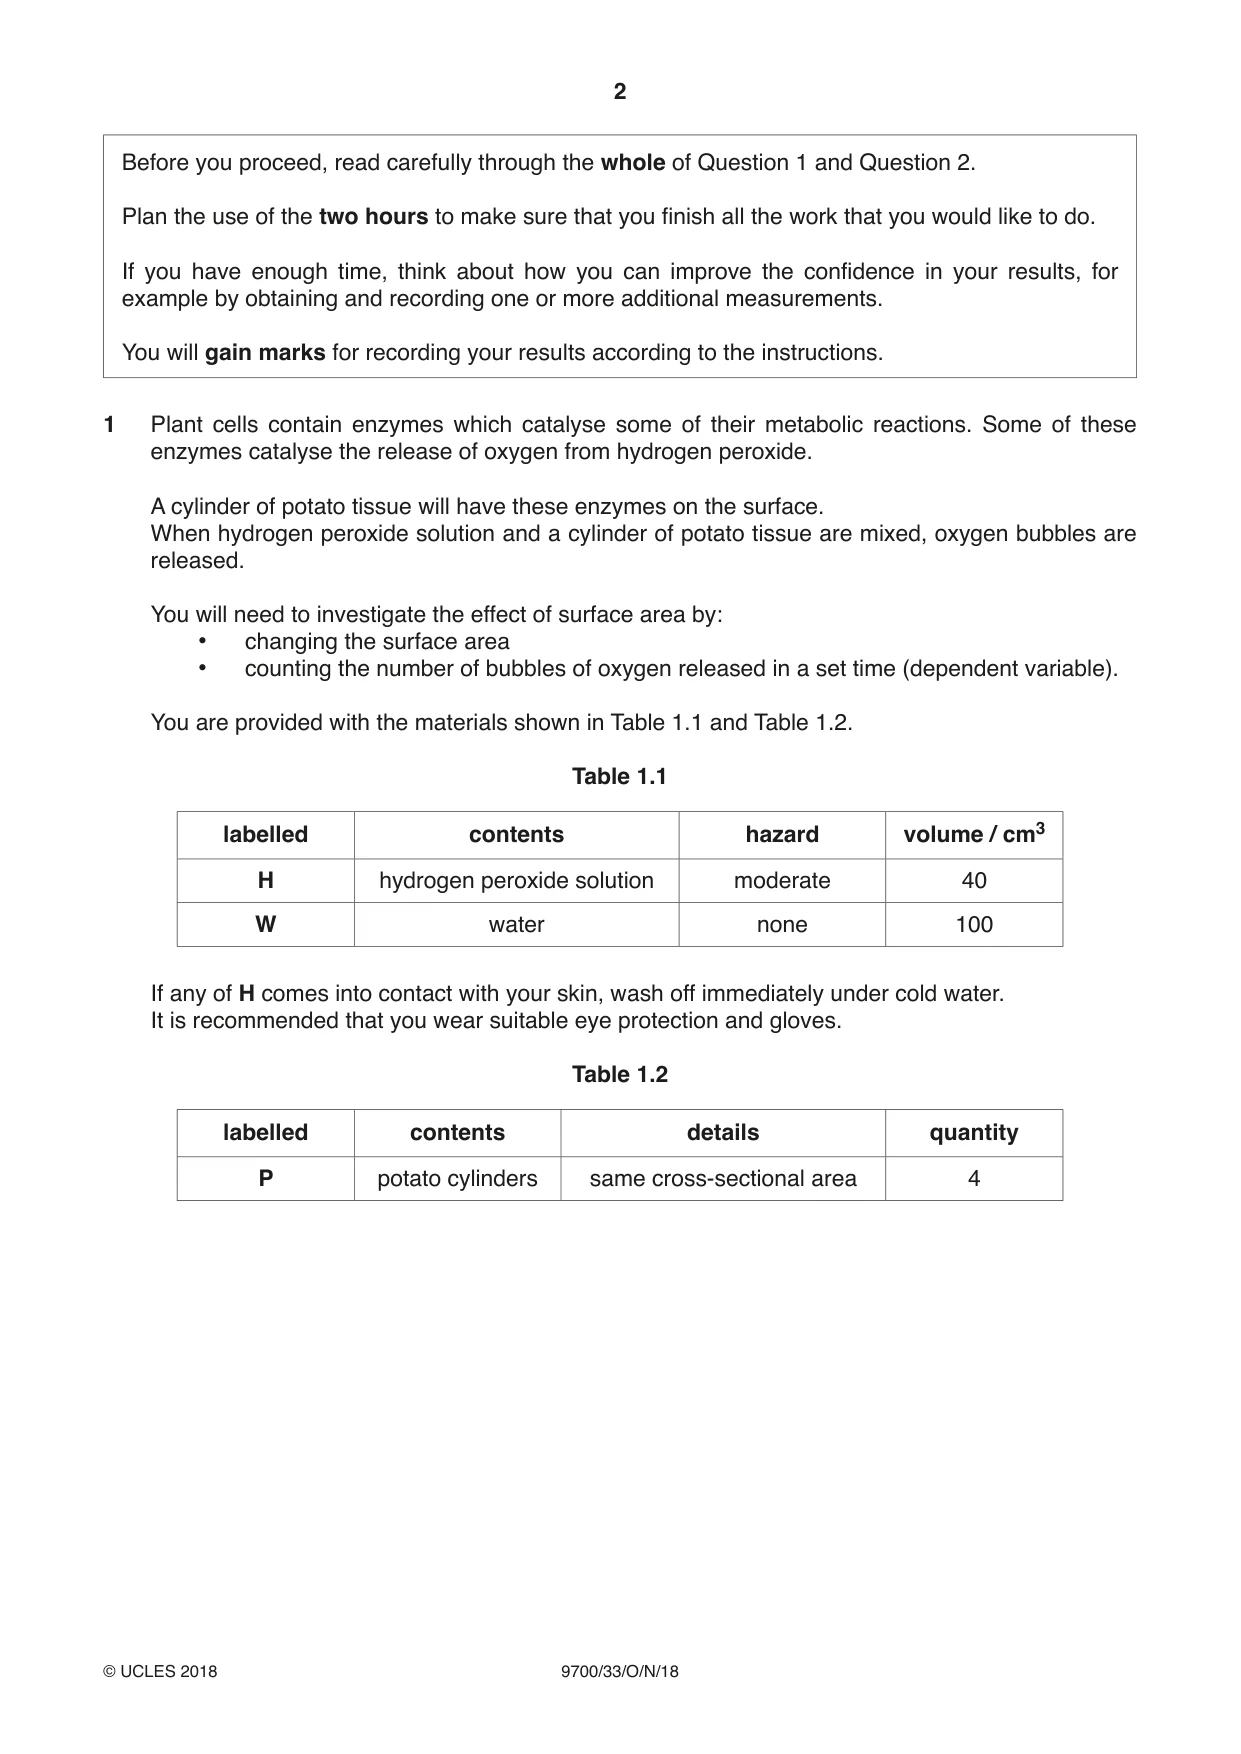

Mark scheme7 pages
Answers below. Sit the paper first if you are practising.
Questions as text
Q1 · Plant cells contain enzymes which catalyse some of their metabolic reactions
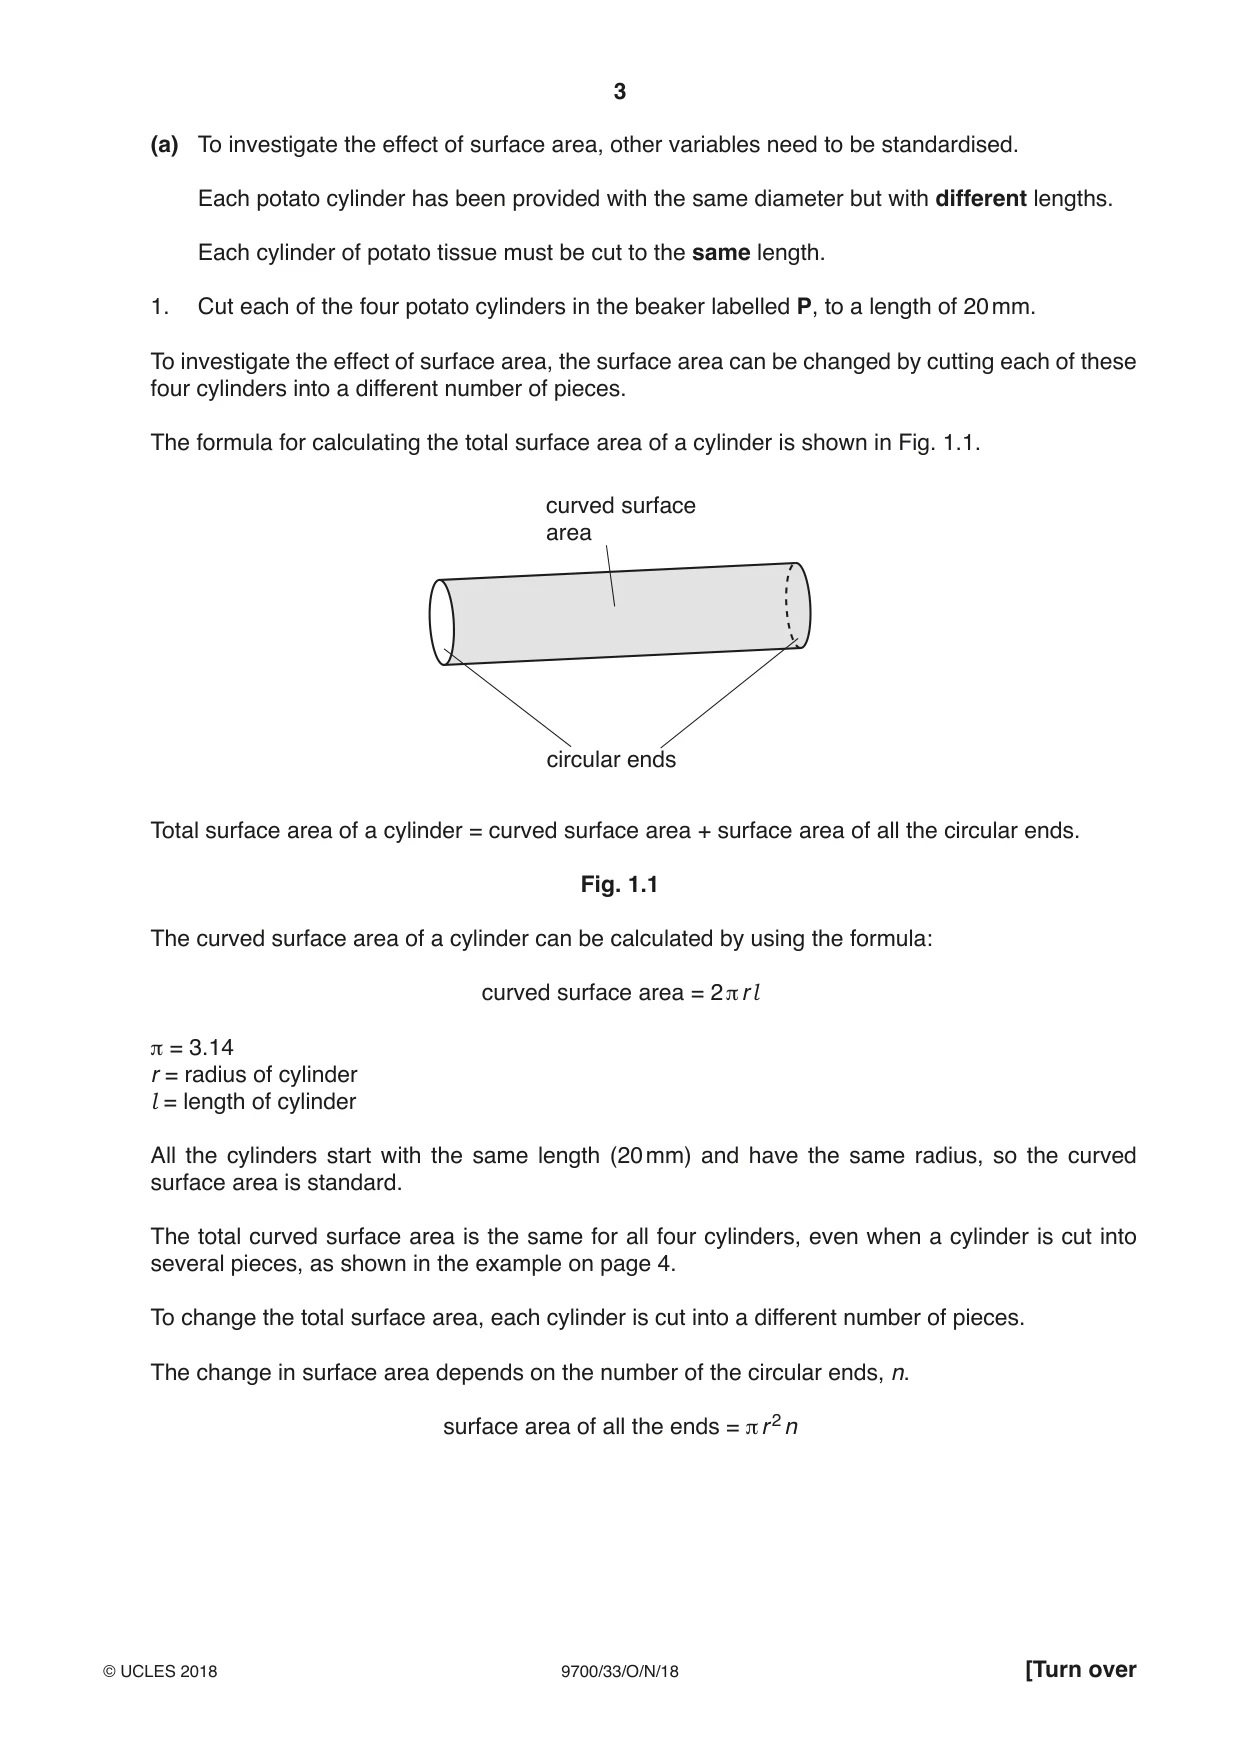
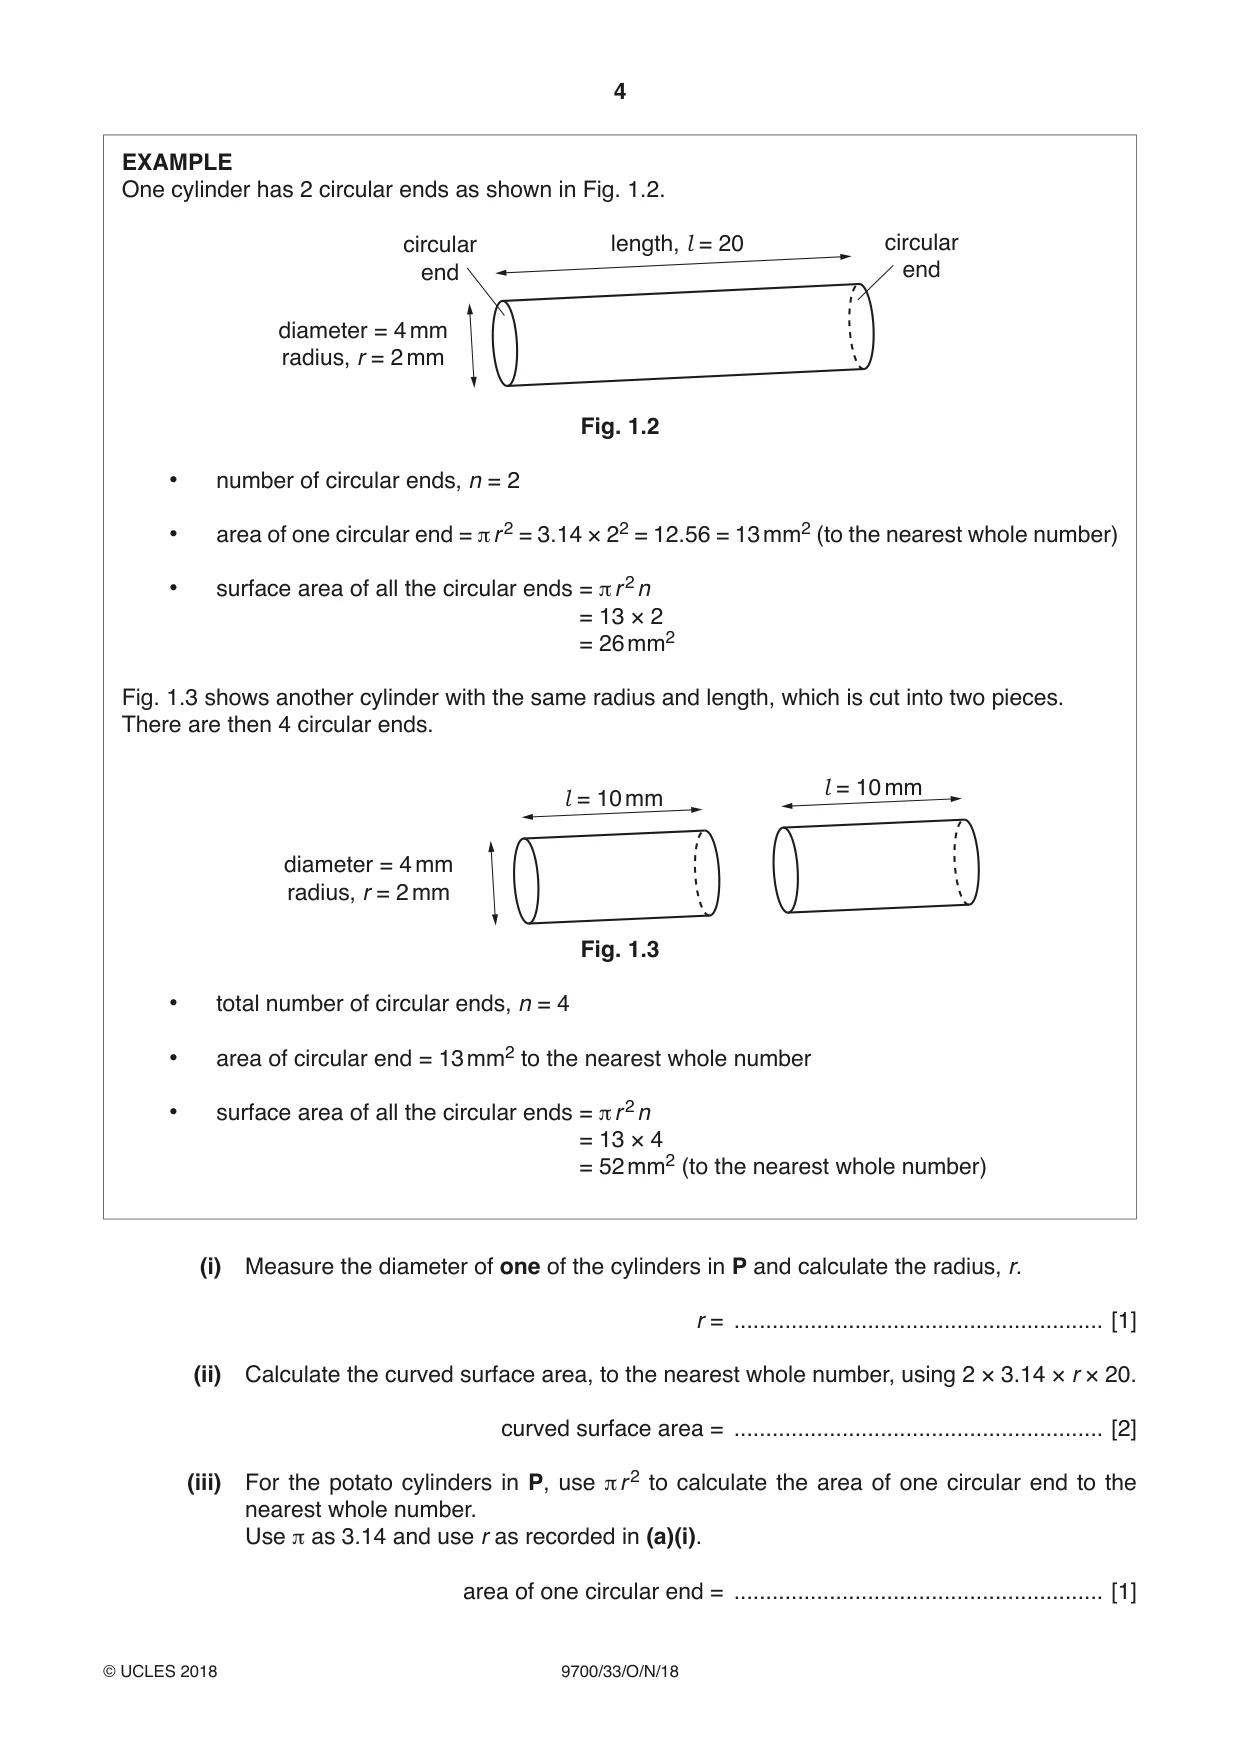
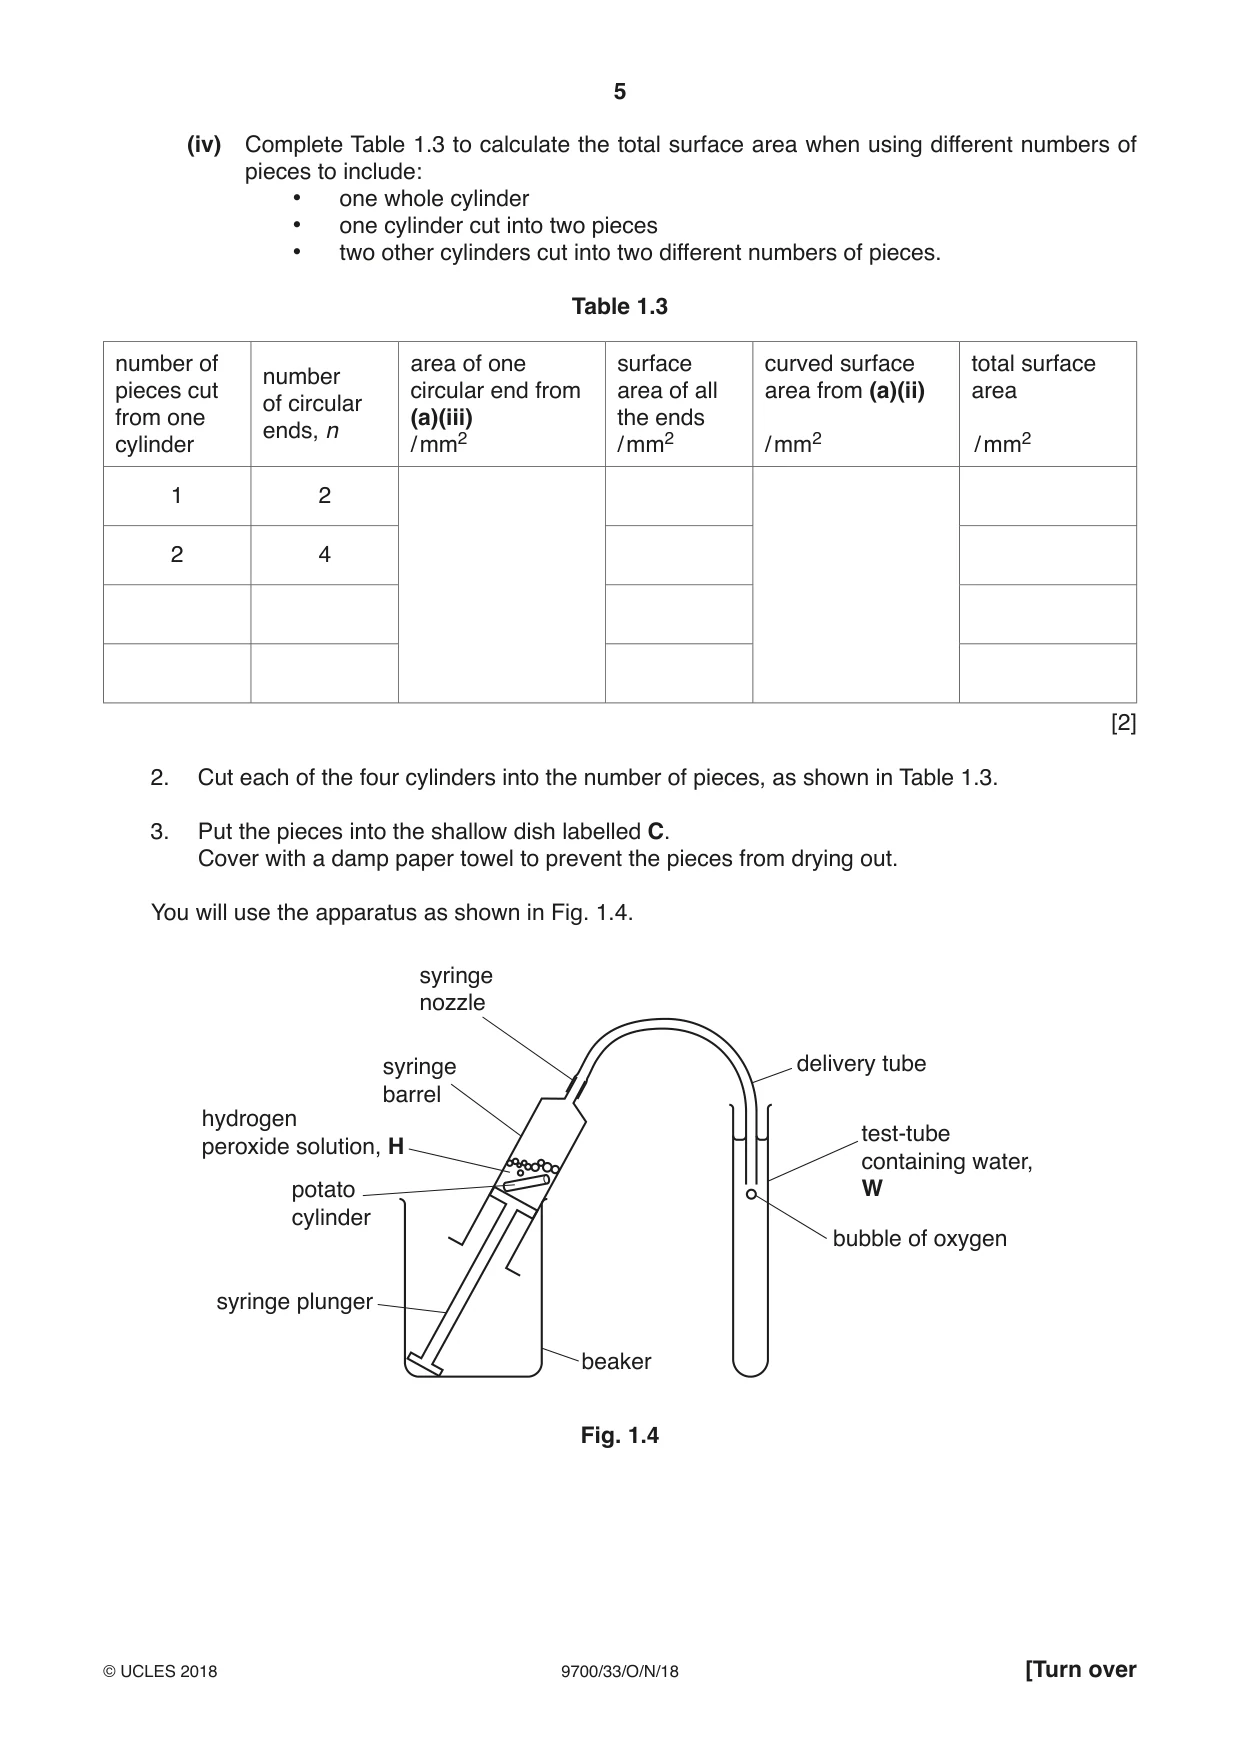
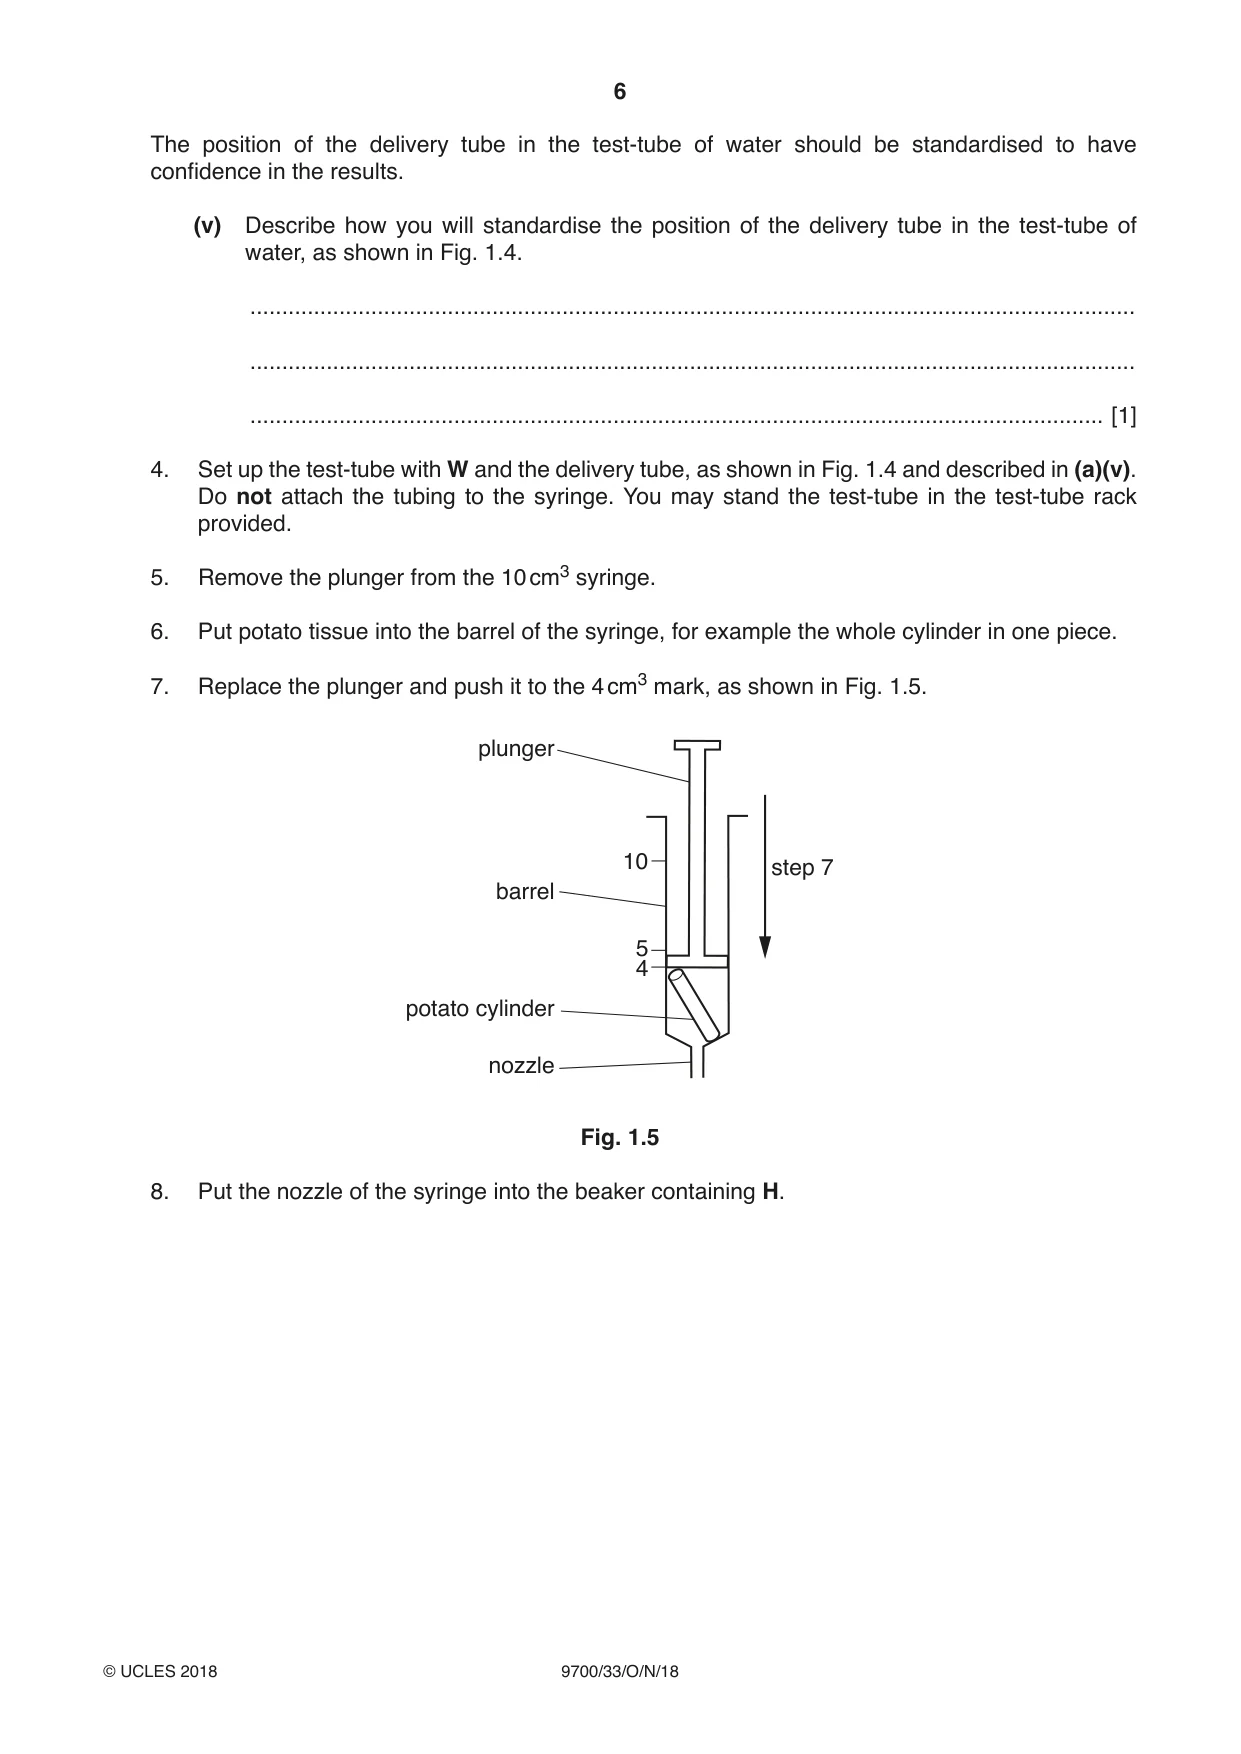
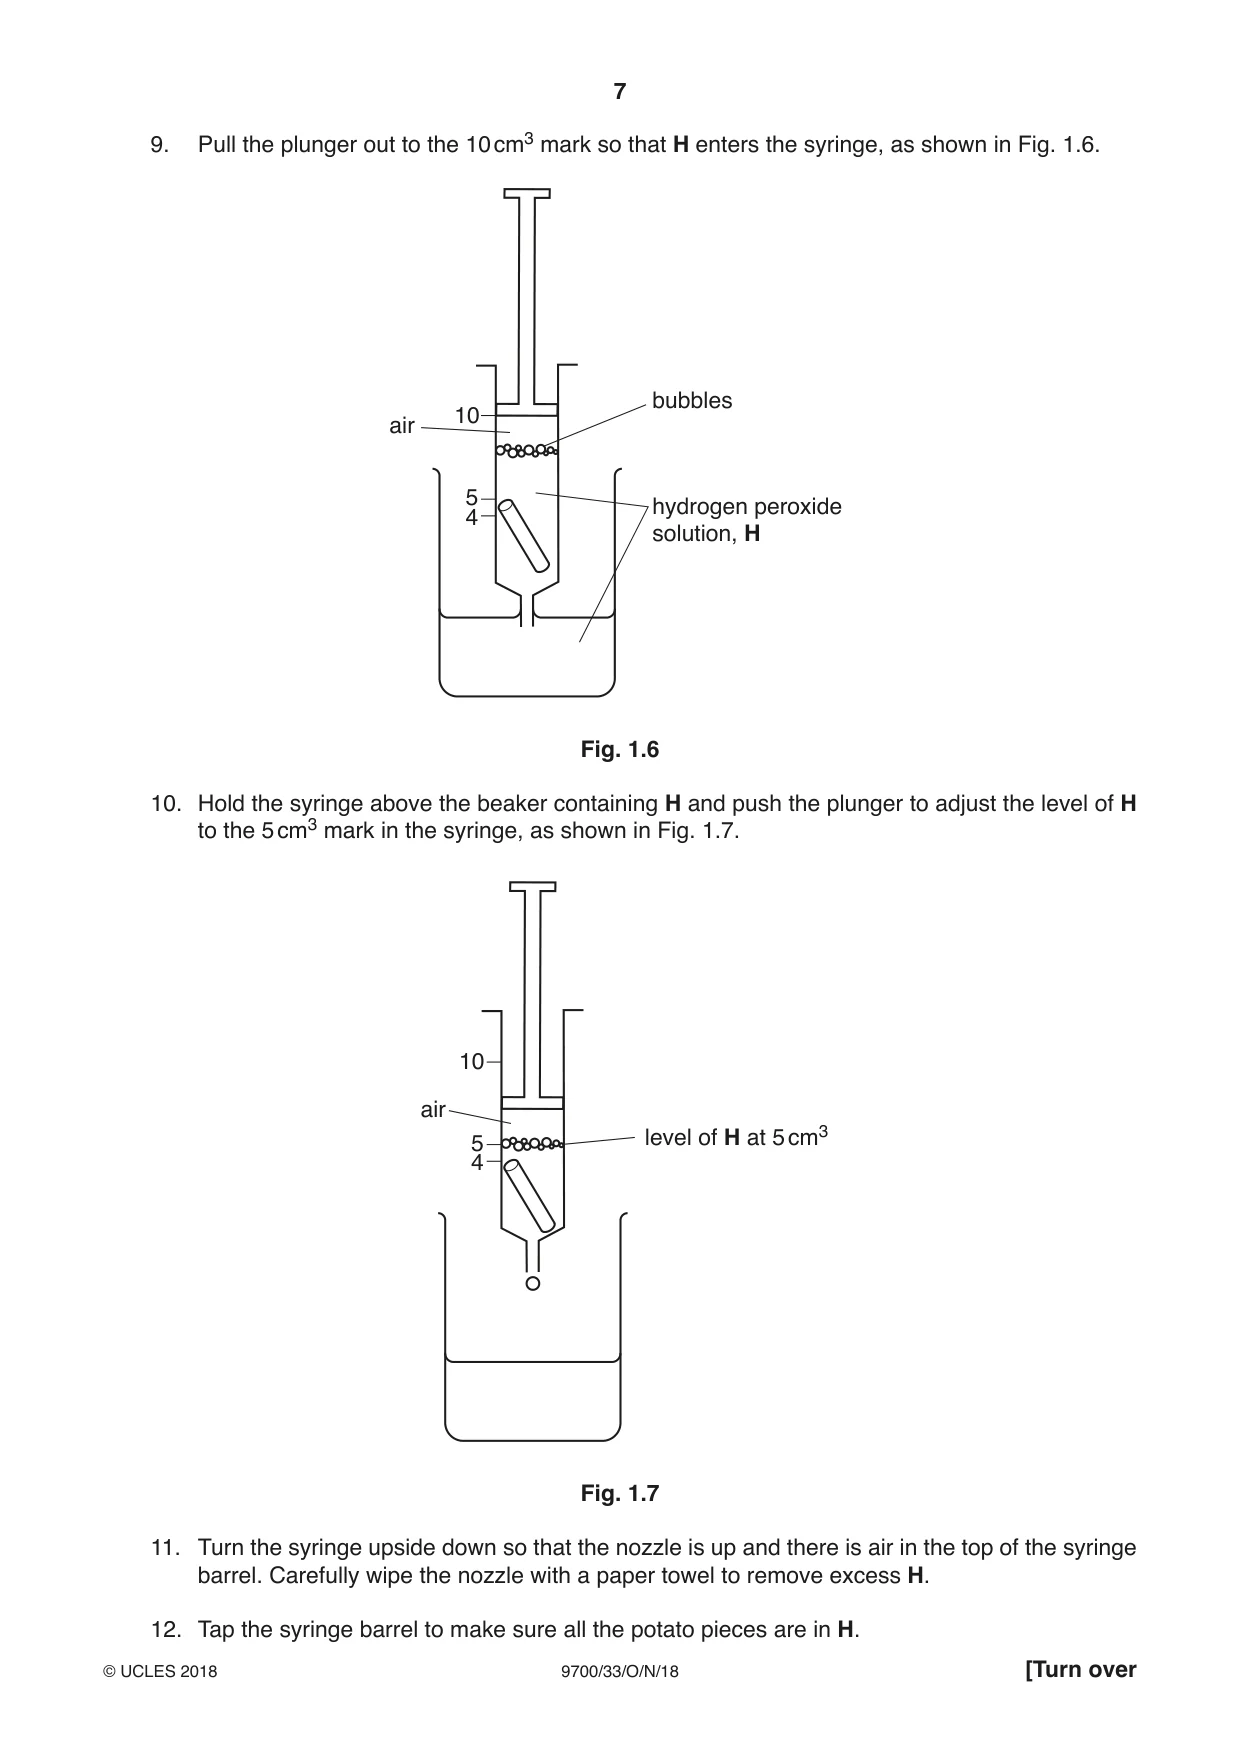
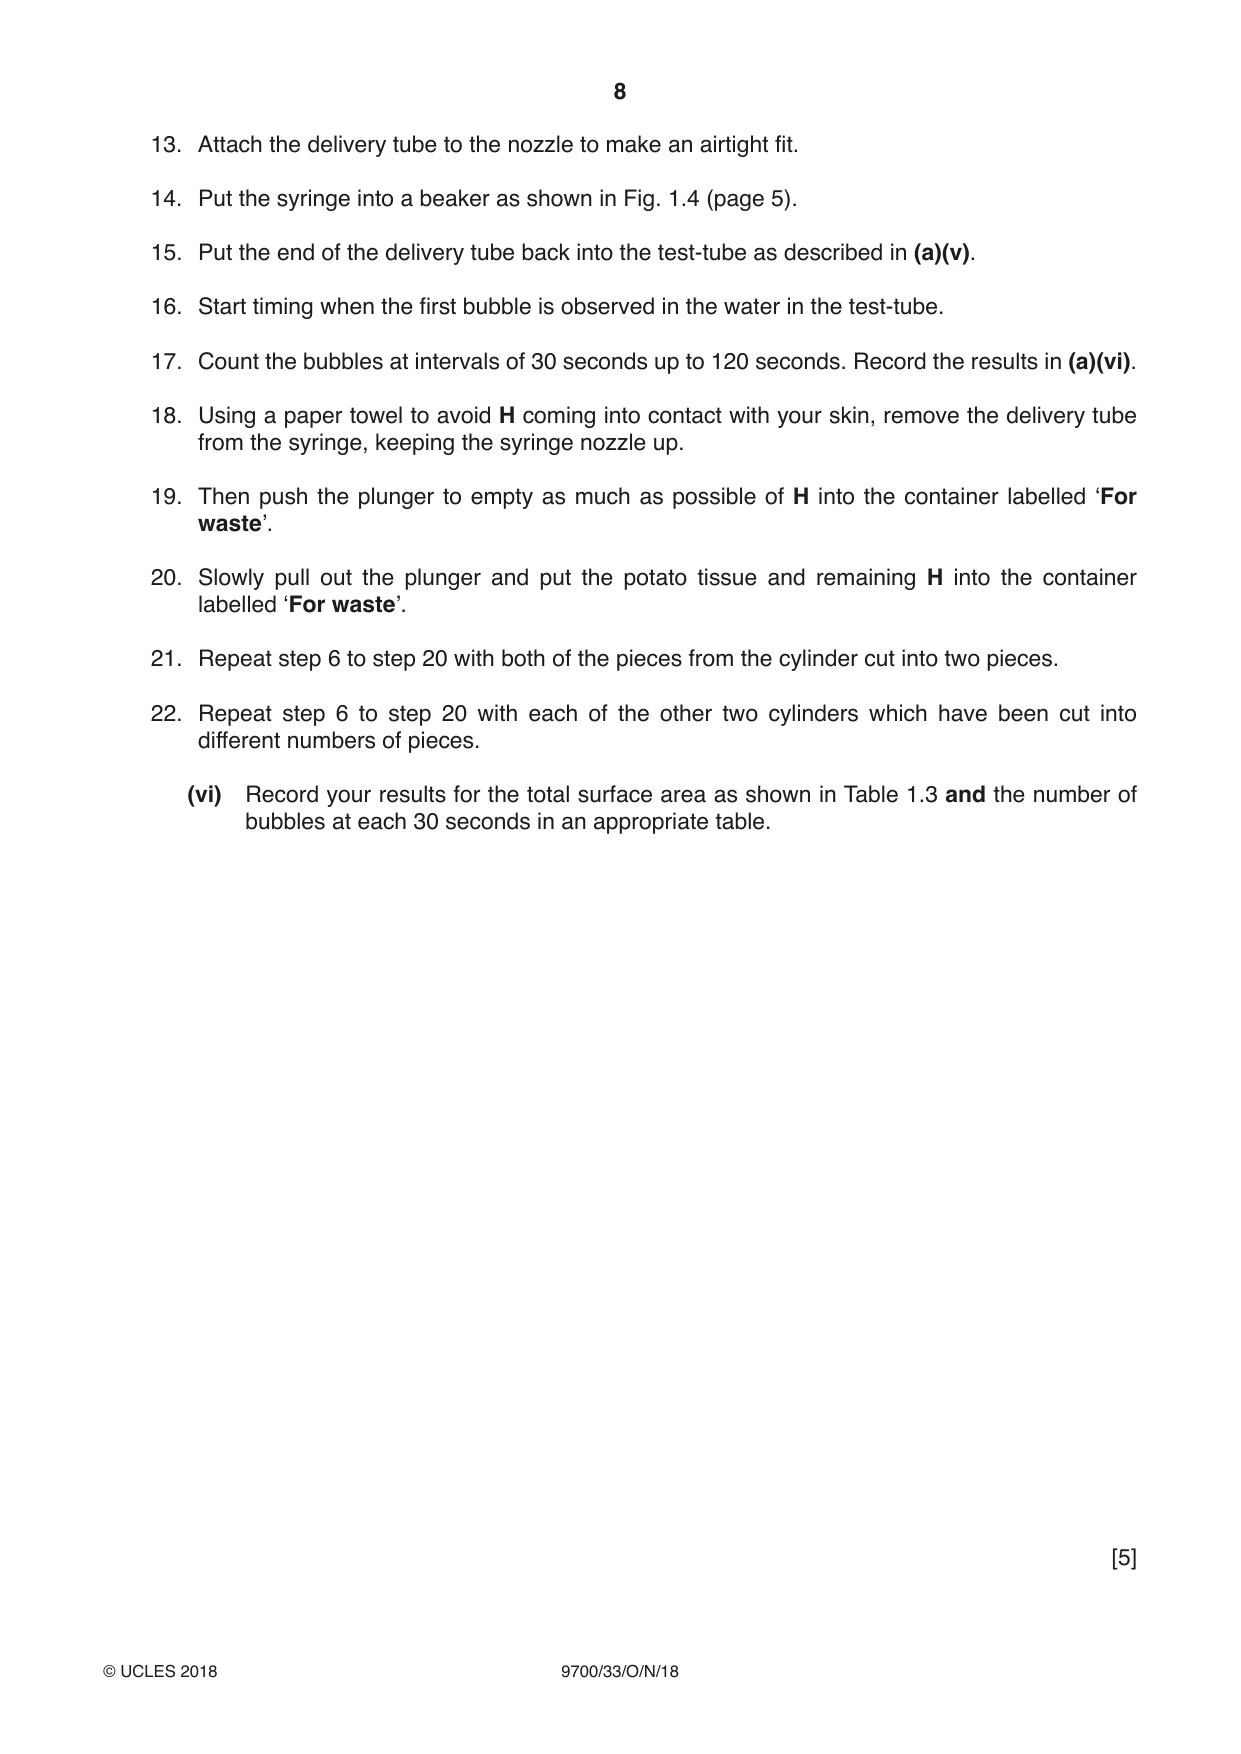
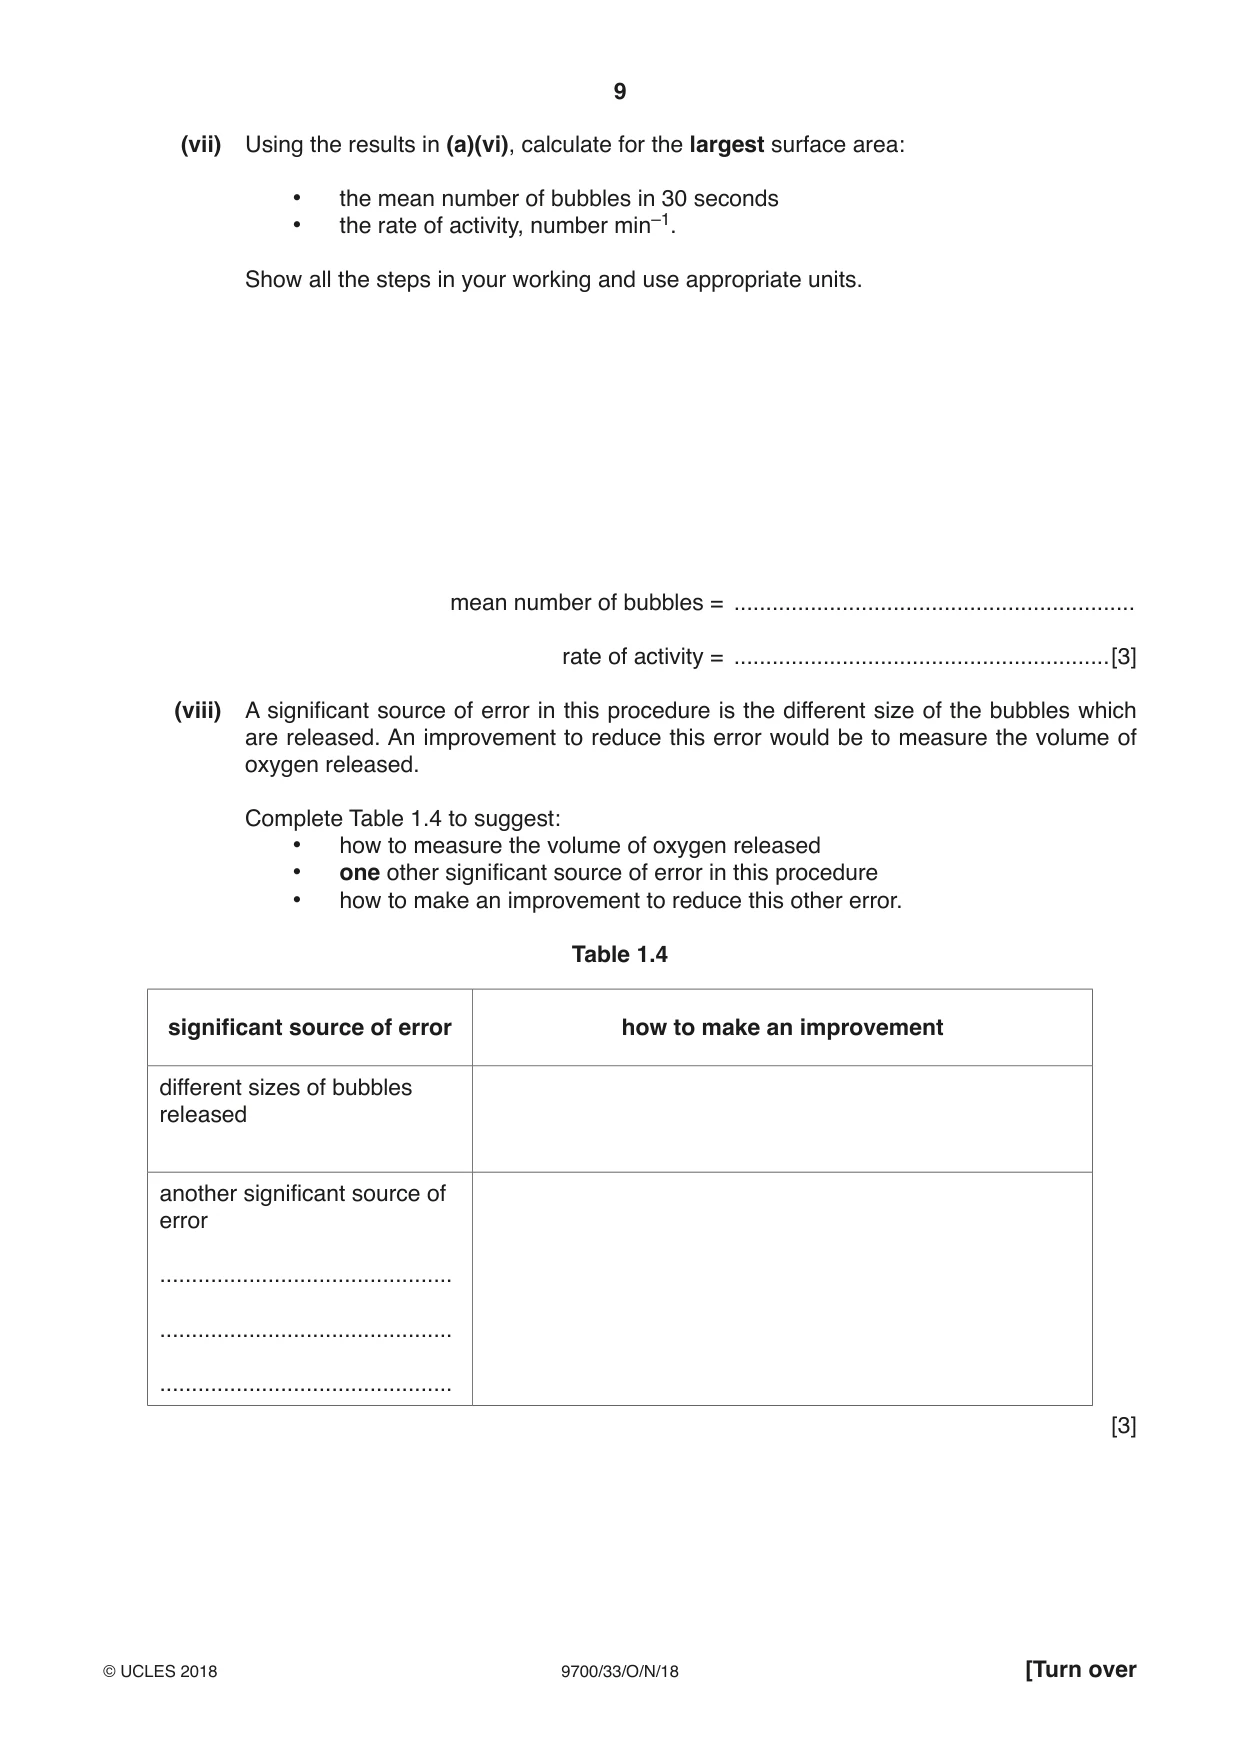
1 Plant cells contain enzymes which catalyse some of their metabolic reactions. Some of these enzymes catalyse the release of oxygen from hydrogen peroxide. A cylinder of potato tissue will have these enzymes on the surface. When hydrogen peroxide solution and a cylinder of potato tissue are mixed, oxygen bubbles are released. You will need to investigate the effect of surface area by: • changing the surface area • counting the number of bubbles of oxygen released in a set time (dependent variable). You are provided with the materials shown in Table 1.1 and Table 1.2. Table 1.1 labelled contents hazard volume / cm3 H hydrogen peroxide solution moderate 40 W water none 100 If any of H comes into contact with your skin, wash off immediately under cold water. It is recommended that you wear suitable eye protection and gloves. Table 1.2 labelled contents details quantity P potato cylinders same cross-sectional area 4 (a) To investigate the effect of surface area, other variables need to be standardised. Each potato cylinder has been provided with the same diameter but with different lengths. Each cylinder of potato tissue must be cut to the same length. 1. Cut each of the four potato cylinders in the beaker labelled P, to a length of 20 mm. To investigate the effect of surface area, the surface area can be changed by cutting each of these four cylinders into a different number of pieces. The formula for calculating the total surface area of a cylinder is shown in Fig. 1.1. curved surface area circular ends Total surface area of a cylinder = curved surface area + surface area of all the circular ends. Fig. 1.1 The curved surface area of a cylinder can be calculated by using the formula: curved surface area = 2 π r l π = 3.14 r = radius of cylinder l = length of cylinder All the cylinders start with the same length (20 mm) and have the same radius, so the curved surface area is standard. The total curved surface area is the same for all four cylinders, even when a cylinder is cut into several pieces, as shown in the example on page 4. To change the total surface area, each cylinder is cut into a different number of pieces. The change in surface area depends on the number of the circular ends, n. surface area of all the ends = π r 2 n EXAMPLE One cylinder has 2 circular ends as shown in Fig. 1.2. circular length, l = 20 circular end end diameter = 4 mm radius, r = 2 mm Fig. 1.2 • number of circular ends, n = 2 • area of one circular end = π r 2 = 3.14 × 22 = 12.56 = 13 mm2 (to the nearest whole number) • surface area of all the circular ends = π r 2 n = 13 × 2 = 26 mm2 Fig. 1.3 shows another cylinder with the same radius and length, which is cut into two pieces. There are then 4 circular ends. l = 10 mm l = 10 mm diameter = 4 mm radius, r = 2 mm Fig. 1.3 • total number of circular ends, n = 4 • area of circular end = 13 mm2 to the nearest whole number • surface area of all the circular ends = π r 2 n = 13 × 4 = 52 mm2 (to the nearest whole number) (i) Measure the diameter of one of the cylinders in P and calculate the radius, r. r = .......................................................... [1] (ii) Calculate the curved surface area, to the nearest whole number, using 2 × 3.14 × r × 20. curved surface area = .......................................................... [2] (iii) For the potato cylinders in P, use π r 2 to calculate the area of one circular end to the nearest whole number. Use π as 3.14 and use r as recorded in (a)(i). area of one circular end = .......................................................... [1] (iv) Complete Table 1.3 to calculate the total surface area when using different numbers of pieces to include: • one whole cylinder • one cylinder cut into two pieces • two other cylinders cut into two different numbers of pieces. Table 1.3 number of area of one surface curved surface total surface numberpieces cut circular end from area of all area from (a)(ii) area of circularfrom one (a)(iii) the ends ends, ncylinder / mm2 / mm2 / mm2 / mm2 1 2 2 4 [2] 2. Cut each of the four cylinders into the number of pieces, as shown in Table 1.3. 3. Put the pieces into the shallow dish labelled C. Cover with a damp paper towel to prevent the pieces from drying out. You will use the apparatus as shown in Fig. 1.4. syringe nozzle syringe delivery tube barrel hydrogen test-tube peroxide solution, H containing water, potato W cylinder bubble of oxygen syringe plunger beaker Fig. 1.4 The position of the delivery tube in the test-tube of water should be standardised to have confidence in the results. (v) Describe how you will standardise the position of the delivery tube in the test-tube of water, as shown in Fig. 1.4. ........................................................................................................................................... ........................................................................................................................................... ...................................................................................................................................... [1] 4. Set up the test-tube with W and the delivery tube, as shown in Fig. 1.4 and described in (a)(v). Do not attach the tubing to the syringe. You may stand the test-tube in the test-tube rack provided. 5. Remove the plunger from the 10 cm3 syringe. 6. Put potato tissue into the barrel of the syringe, for example the whole cylinder in one piece. 7. Replace the plunger and push it to the 4 cm3 mark, as shown in Fig. 1.5. plunger 10 step 7 barrel 5 4 potato cylinder nozzle Fig. 1.5 8. Put the nozzle of the syringe into the beaker containing H. 9. Pull the plunger out to the 10 cm3 mark so that H enters the syringe, as shown in Fig. 1.6. bubbles 10 air 5 hydrogen peroxide 4 solution, H Fig. 1.6 10. Hold the syringe above the beaker containing H and push the plunger to adjust the level of H to the 5 cm3 mark in the syringe, as shown in Fig. 1.7. 10 air 5 level of H at 5 cm3 4 Fig. 1.7 11. Turn the syringe upside down so that the nozzle is up and there is air in the top of the syringe barrel. Carefully wipe the nozzle with a paper towel to remove excess H. 12. Tap the syringe barrel to make sure all the potato pieces are in H. 13. Attach the delivery tube to the nozzle to make an airtight fit. 14. Put the syringe into a beaker as shown in Fig. 1.4 (page 5). 15. Put the end of the delivery tube back into the test-tube as described in (a)(v). 16. Start timing when the first bubble is observed in the water in the test-tube. 17. Count the bubbles at intervals of 30 seconds up to 120 seconds. Record the results in (a)(vi). 18. Using a paper towel to avoid H coming into contact with your skin, remove the delivery tube from the syringe, keeping the syringe nozzle up. 19. Then push the plunger to empty as much as possible of H into the container labelled ‘For waste’. 20. Slowly pull out the plunger and put the potato tissue and remaining H into the container labelled ‘For waste’. 21. Repeat step 6 to step 20 with both of the pieces from the cylinder cut into two pieces. 22. Repeat step 6 to step 20 with each of the other two cylinders which have been cut into different numbers of pieces. (vi) Record your results for the total surface area as shown in Table 1.3 and the number of bubbles at each 30 seconds in an appropriate table. [5] (vii) Using the results in (a)(vi), calculate for the largest surface area: • the mean number of bubbles in 30 seconds • the rate of activity, number min–1. Show all the steps in your working and use appropriate units. mean number of bubbles = ............................................................... rate of activity = ...........................................................[3] (viii) A significant source of error in this procedure is the different size of the bubbles which are released. An improvement to reduce this error would be to measure the volume of oxygen released. Complete Table 1.4 to suggest: • how to measure the volume of oxygen released • one other significant source of error in this procedure • how to make an improvement to reduce this other error. Table 1.4 significant source of error how to make an improvement different sizes of bubbles released another significant source of error .............................................. .............................................. .............................................. [3] (ix) Think about how you could modify this procedure to investigate the effect of concentration of substrate, starting with 6% hydrogen peroxide, on the activity of the enzyme (catalase) in the potato tissue. Describe how you could change the independent variable, concentration of substrate. ........................................................................................................................................... ........................................................................................................................................... ...................................................................................................................................... [1] [Total: 19] Question 2 starts on page 12
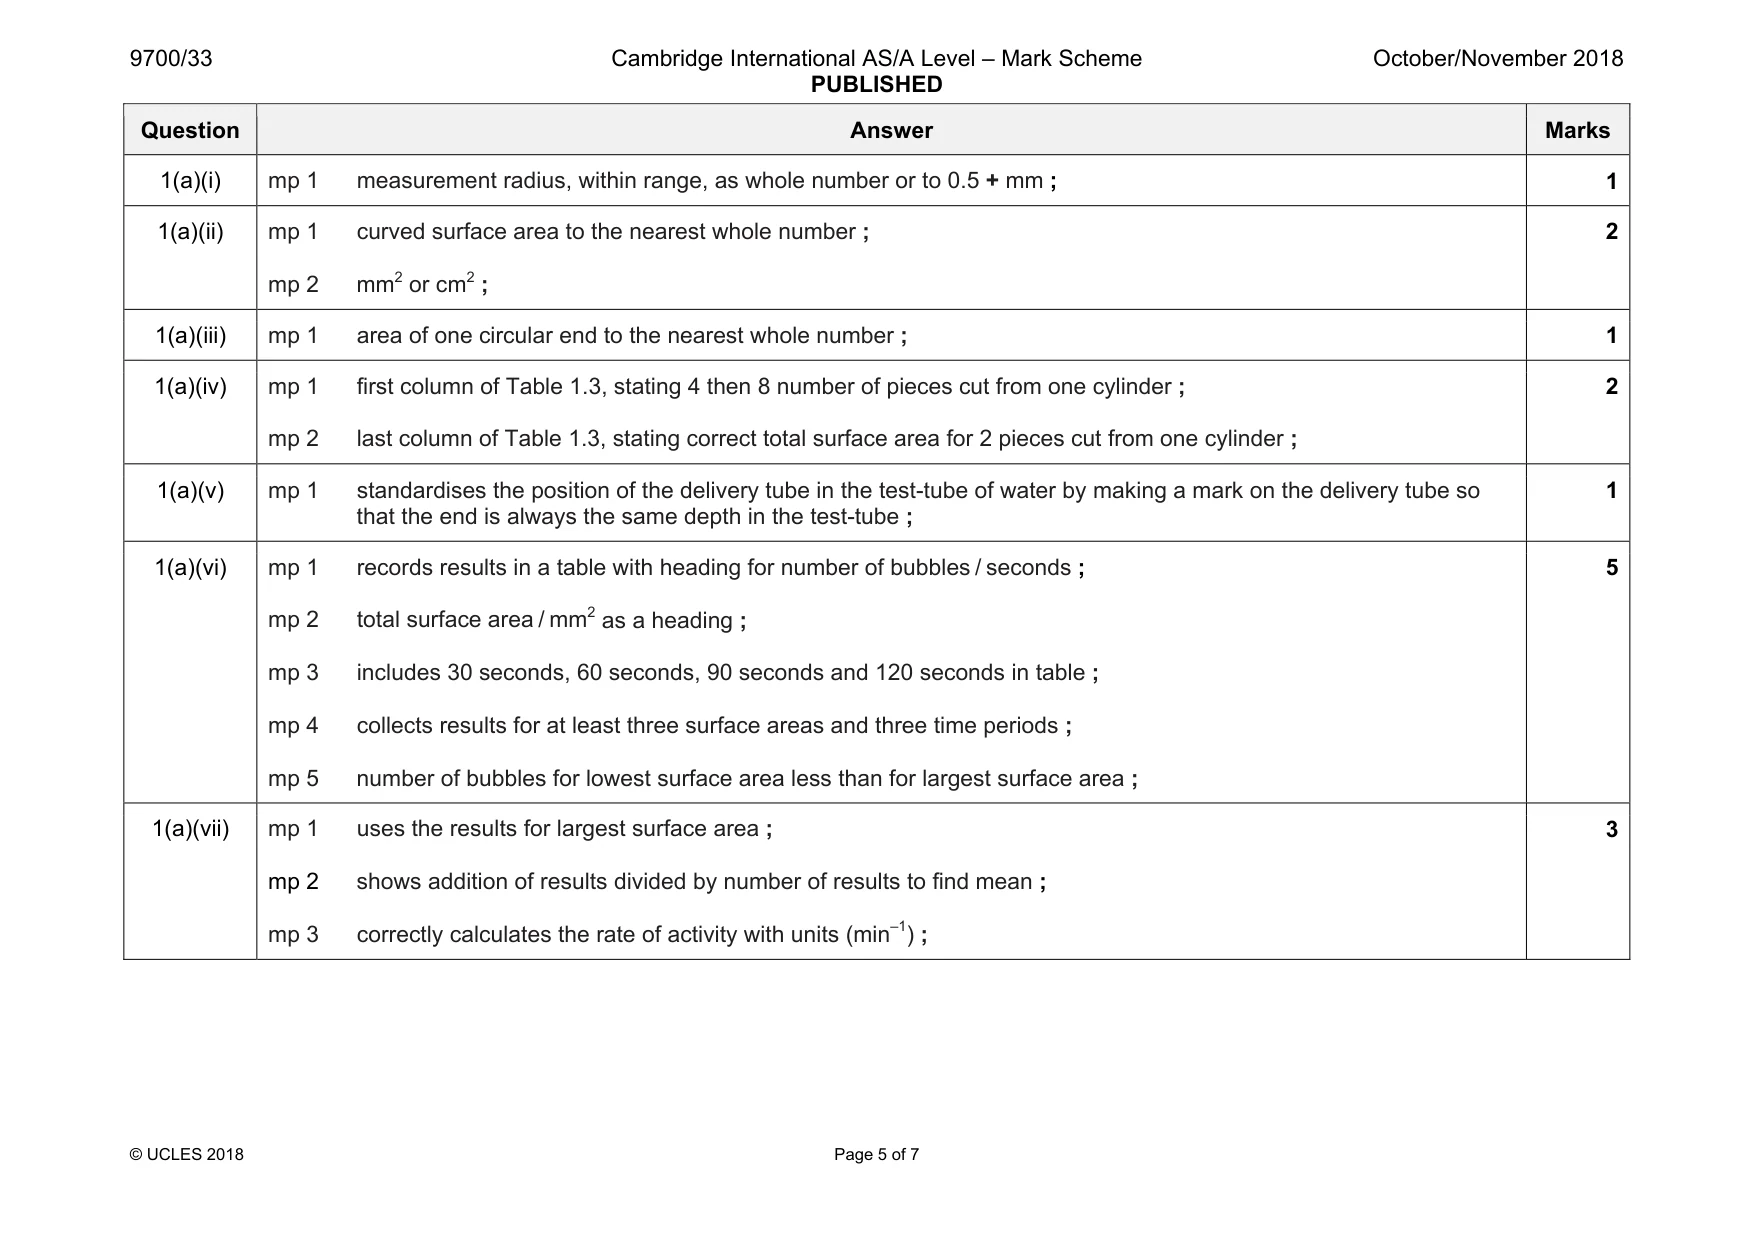
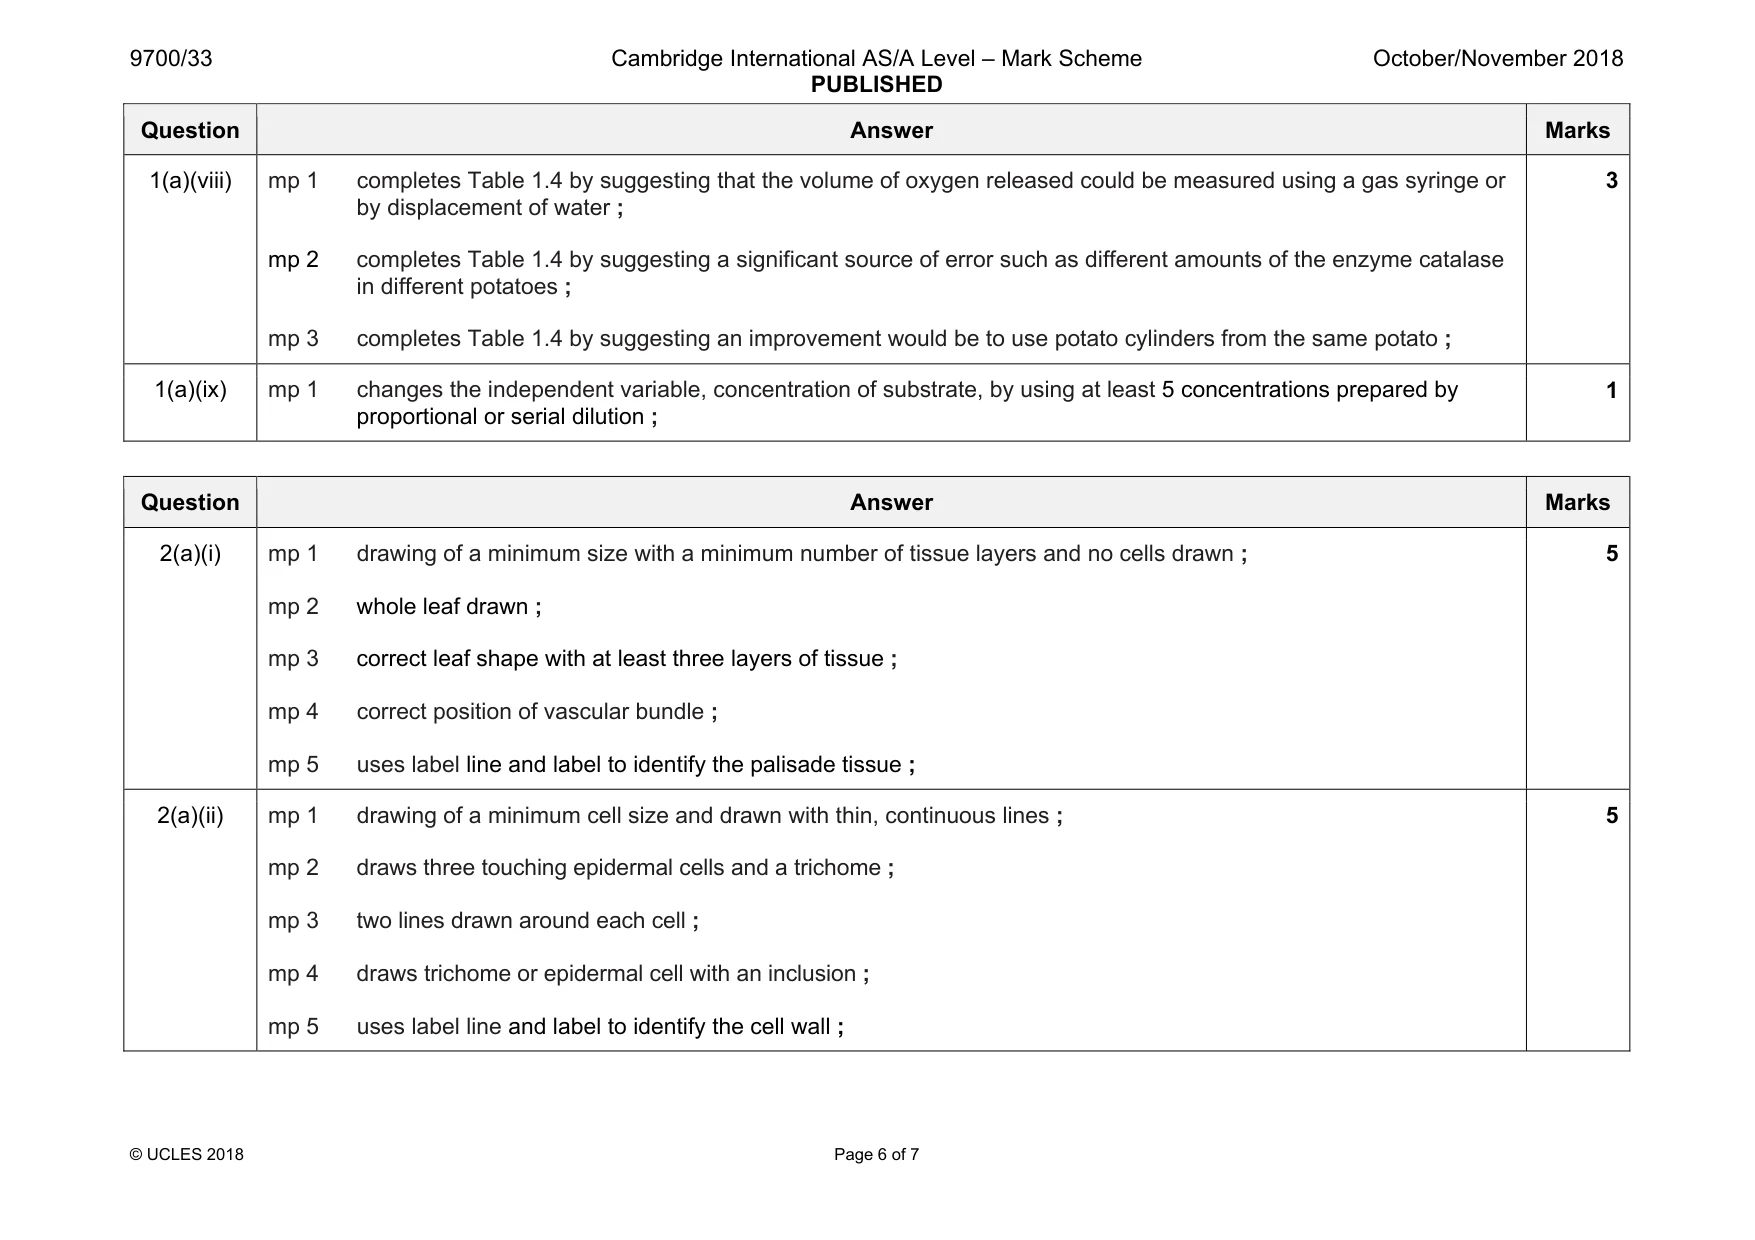
Mark scheme: 1(a)(i) mp 1 measurement radius, within range, as whole number or to 0.5 + mm ; 1 1(a)(ii) mp 1 curved surface area to the nearest whole number ; mp 2 mm2 or cm2 ; 2 1(a)(iii) mp 1 area of one circular end to the nearest whole number ; 1 1(a)(iv) mp 1 first column of Table 1.3, stating 4 then 8 number of pieces cut from one cylinder ; mp 2 last column of Table 1.3, stating correct total surface area for 2 pieces cut from one cylinder ; 2 1(a)(v) mp 1 standardises the position of the delivery tube in the test-tube of water by making a mark on the delivery tube so that the end is always the same depth in the test-tube ; 1 1(a)(vi) mp 1 records results in a table with heading for number of bubbles / seconds ; mp 2 total surface area / mm2 as a heading ; mp 3 includes 30 seconds, 60 seconds, 90 seconds and 120 seconds in table ; mp 4 collects results for at least three surface areas and three time periods ; mp 5 number of bubbles for lowest surface area less than for largest surface area ; 5 1(a)(vii) mp 1 uses the results for largest surface area ; mp 2 shows addition of results divided by number of results to find mean ; mp 3 correctly calculates the rate of activity with units (min–1) ; 3 Question Answer Marks 1(a)(viii) mp 1 completes Table 1.4 by suggesting that the volume of oxygen released could be measured using a gas syringe or by displacement of water ; mp 2 completes Table 1.4 by suggesting a significant source of error such as different amounts of the enzyme catalase in different potatoes ; mp 3 completes Table 1.4 by suggesting an improvement would be to use potato cylinders from the same potato ; 3 1(a)(ix) mp 1 changes the independent variable, concentration of substrate, by using at least 5 concentrations prepared by proportional or serial dilution ; 1
Q2 · K1 is a slide of a stained transverse section through a plant leaf
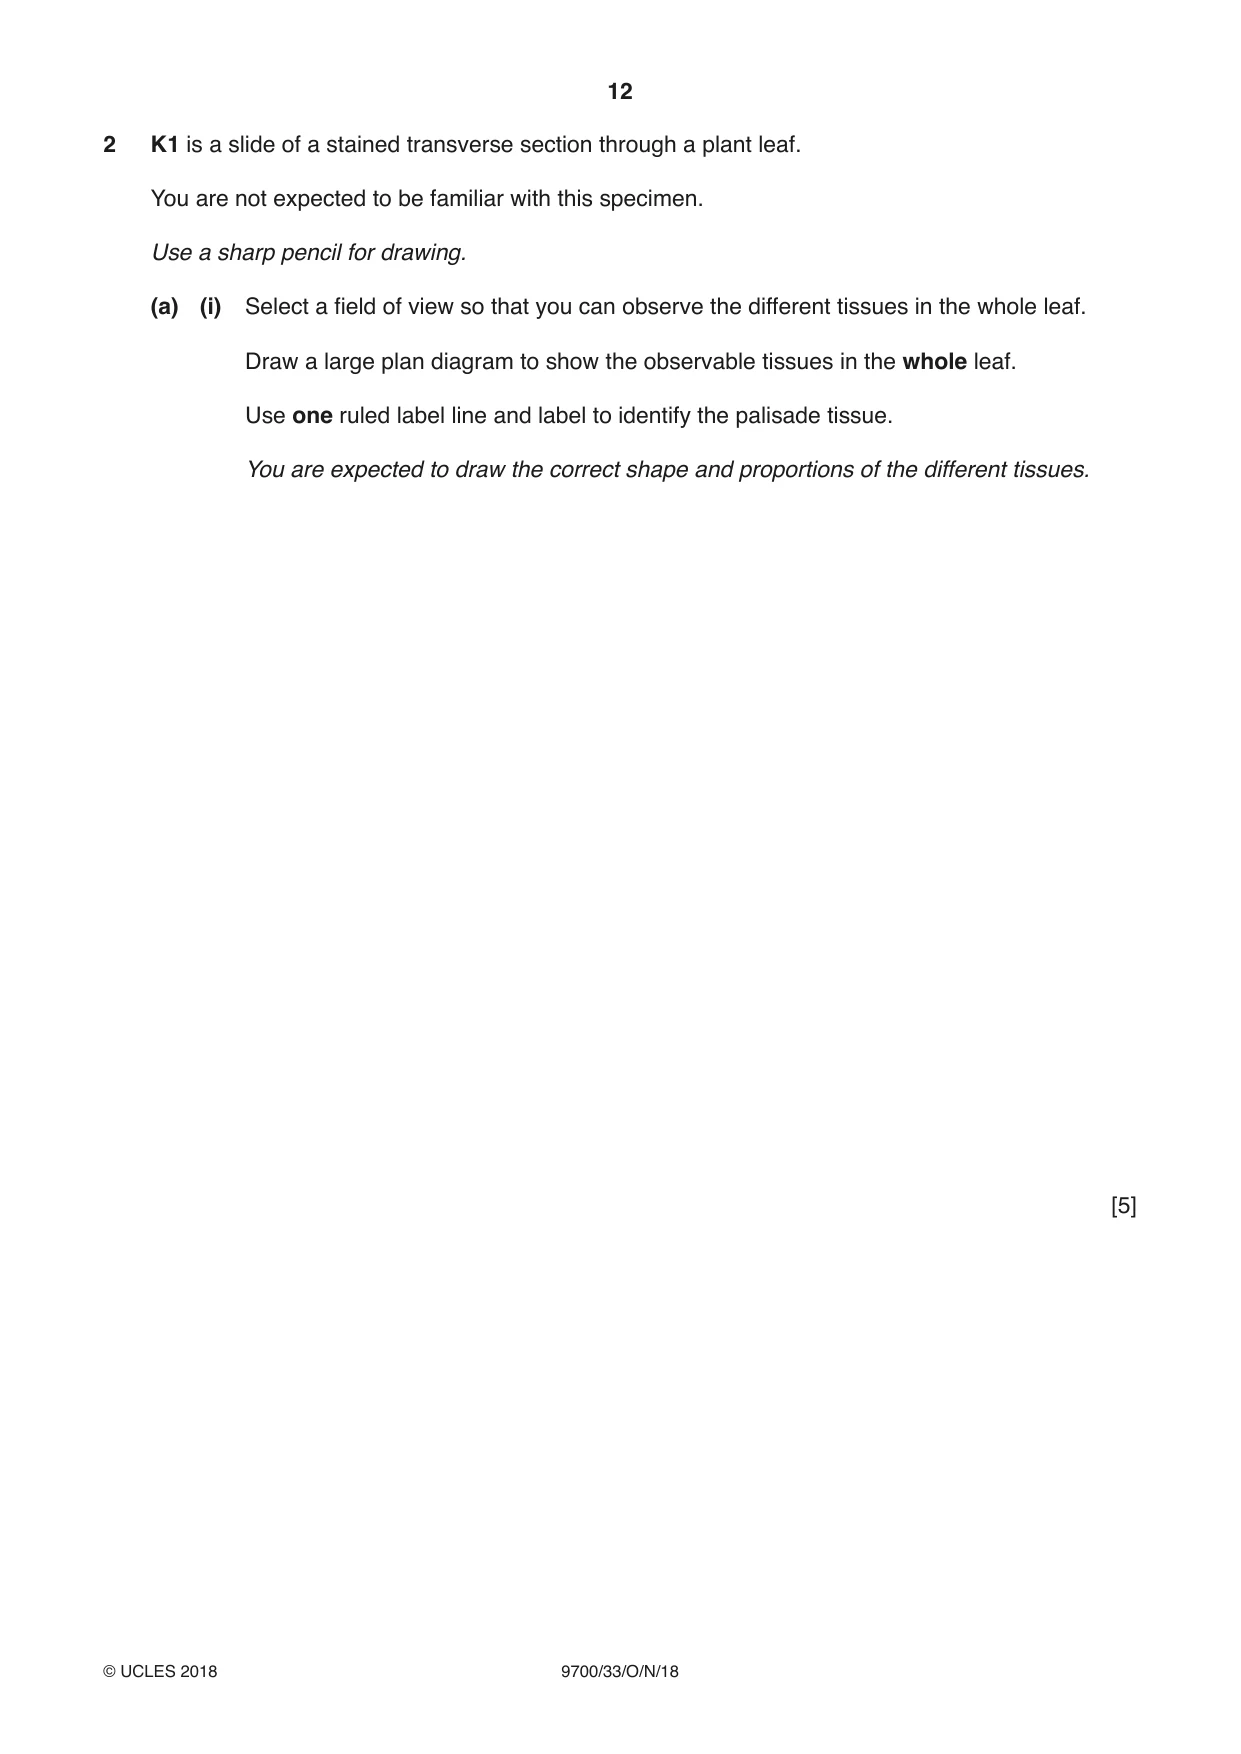
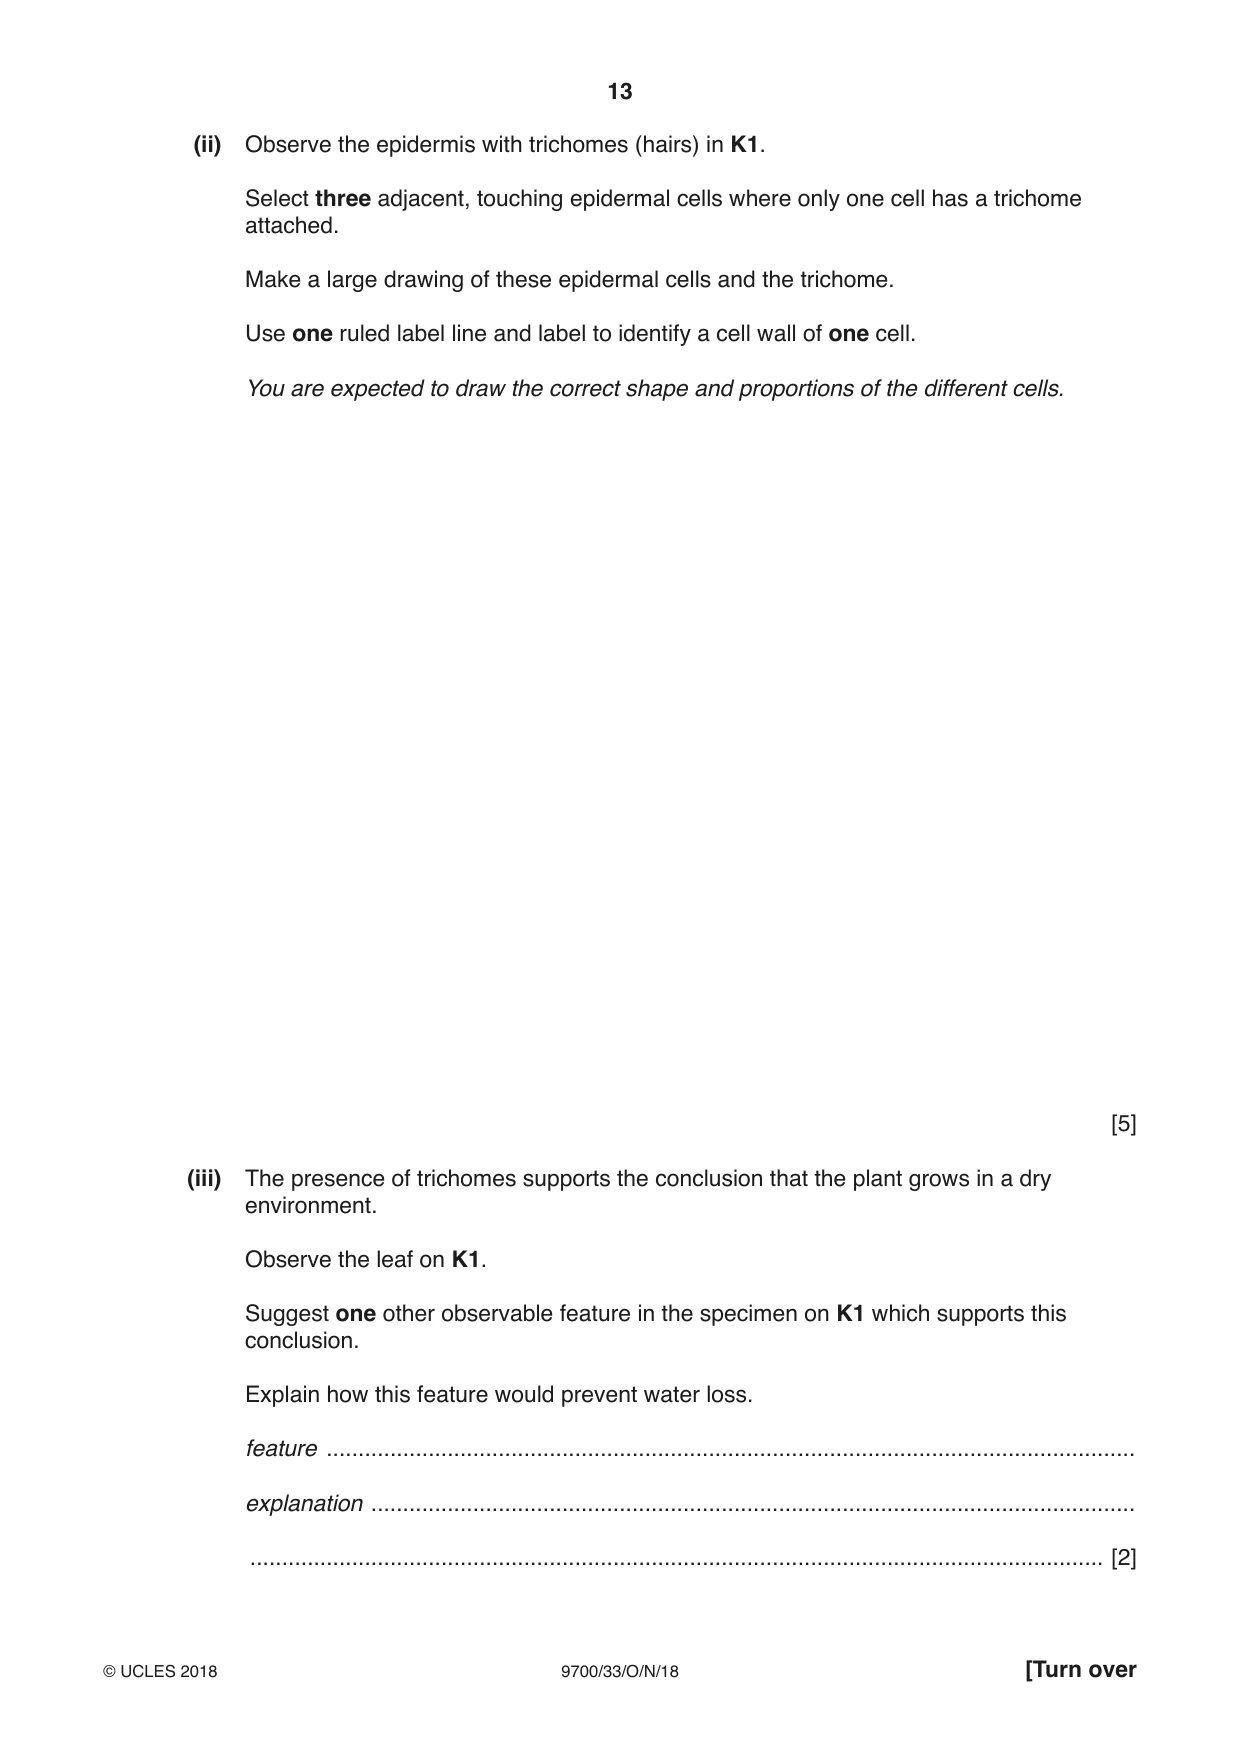
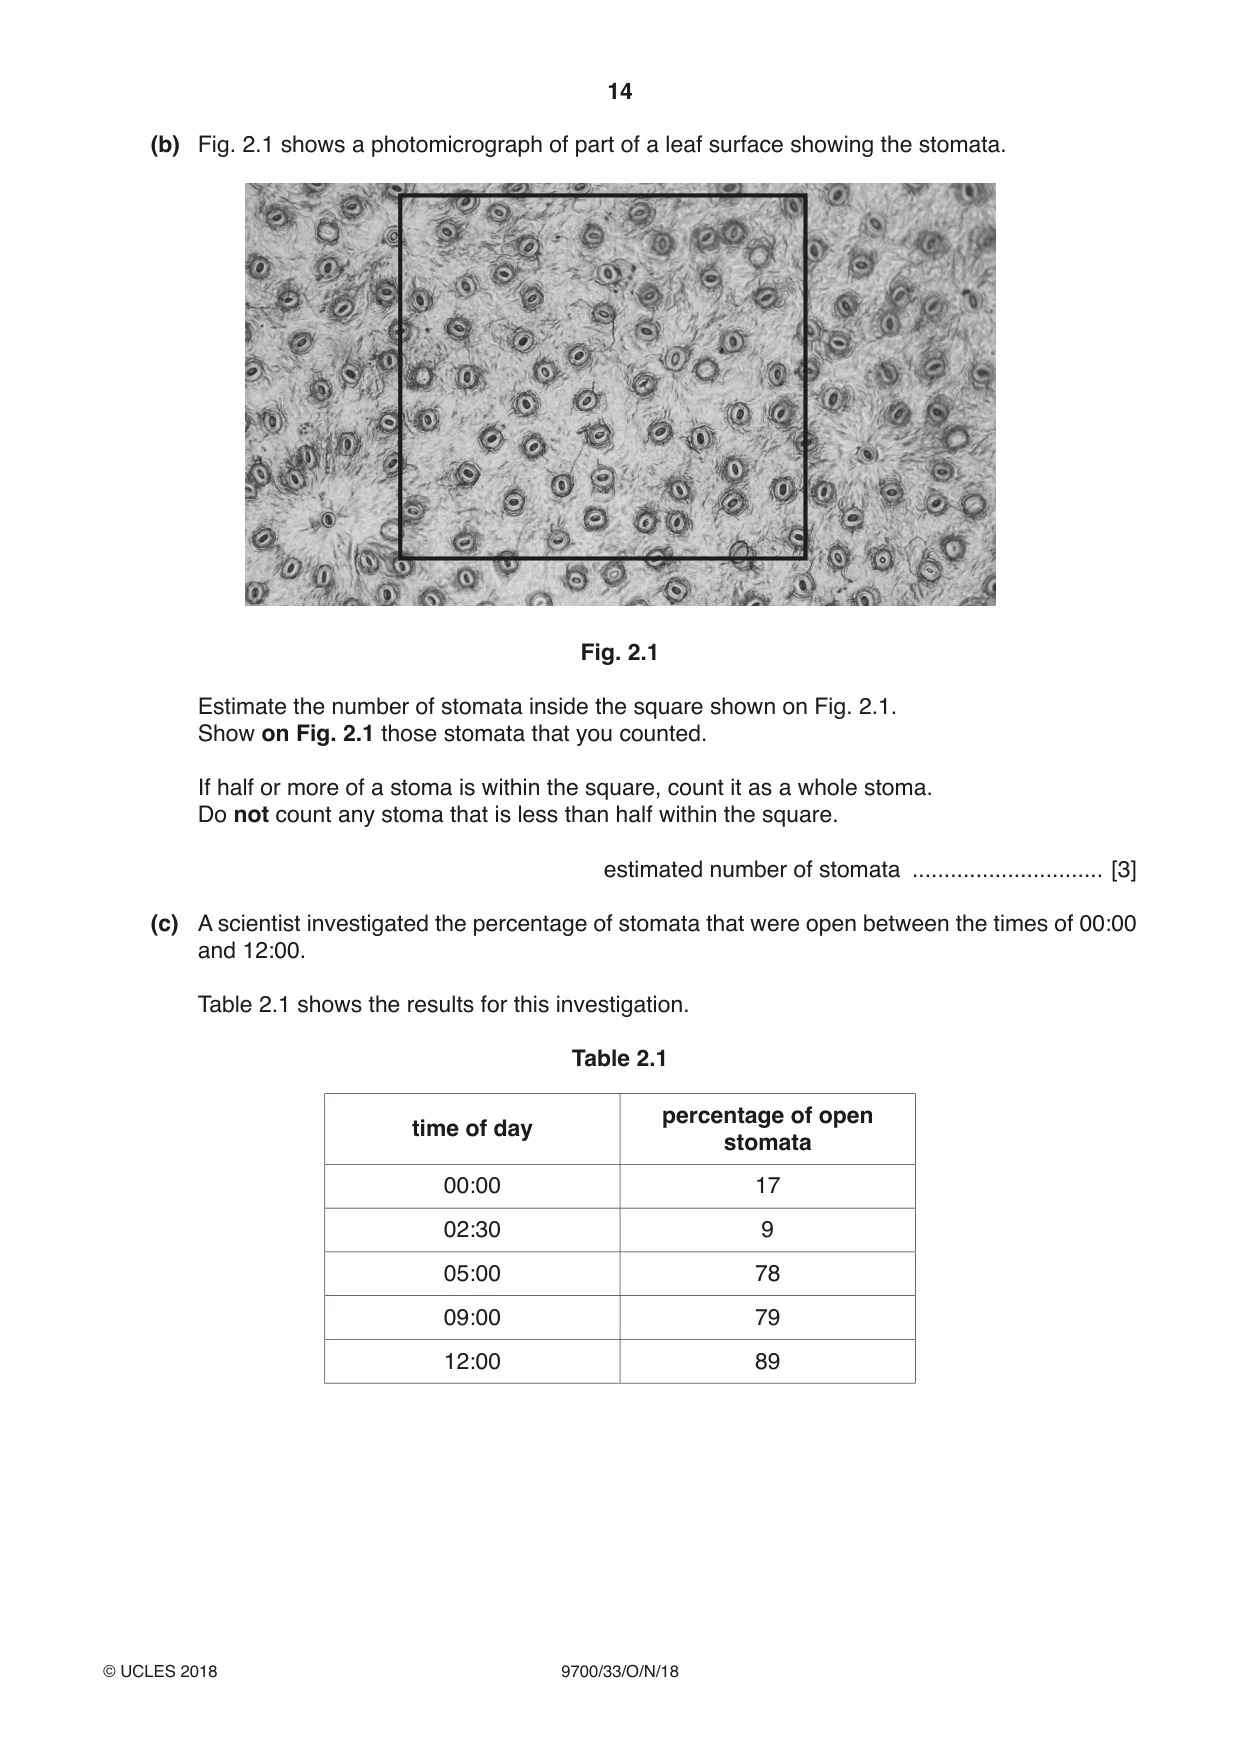
2 K1 is a slide of a stained transverse section through a plant leaf. You are not expected to be familiar with this specimen. Use a sharp pencil for drawing. (a) (i) Select a field of view so that you can observe the different tissues in the whole leaf. Draw a large plan diagram to show the observable tissues in the whole leaf. Use one ruled label line and label to identify the palisade tissue. You are expected to draw the correct shape and proportions of the different tissues. [5] (ii) Observe the epidermis with trichomes (hairs) in K1. Select three adjacent, touching epidermal cells where only one cell has a trichome attached. Make a large drawing of these epidermal cells and the trichome. Use one ruled label line and label to identify a cell wall of one cell. You are expected to draw the correct shape and proportions of the different cells. [5] (iii) The presence of trichomes supports the conclusion that the plant grows in a dry environment. Observe the leaf on K1. Suggest one other observable feature in the specimen on K1 which supports this conclusion. Explain how this feature would prevent water loss. feature ............................................................................................................................... explanation ........................................................................................................................ ...................................................................................................................................... [2] (b) Fig. 2.1 shows a photomicrograph of part of a leaf surface showing the stomata. Fig. 2.1 Estimate the number of stomata inside the square shown on Fig. 2.1. Show on Fig. 2.1 those stomata that you counted. If half or more of a stoma is within the square, count it as a whole stoma. Do not count any stoma that is less than half within the square. estimated number of stomata .............................. [3] (c) A scientist investigated the percentage of stomata that were open between the times of 00:00 and 12:00. Table 2.1 shows the results for this investigation. Table 2.1 percentage of open time of day stomata 00:00 17 02:30 9 05:00 78 09:00 79 12:00 89
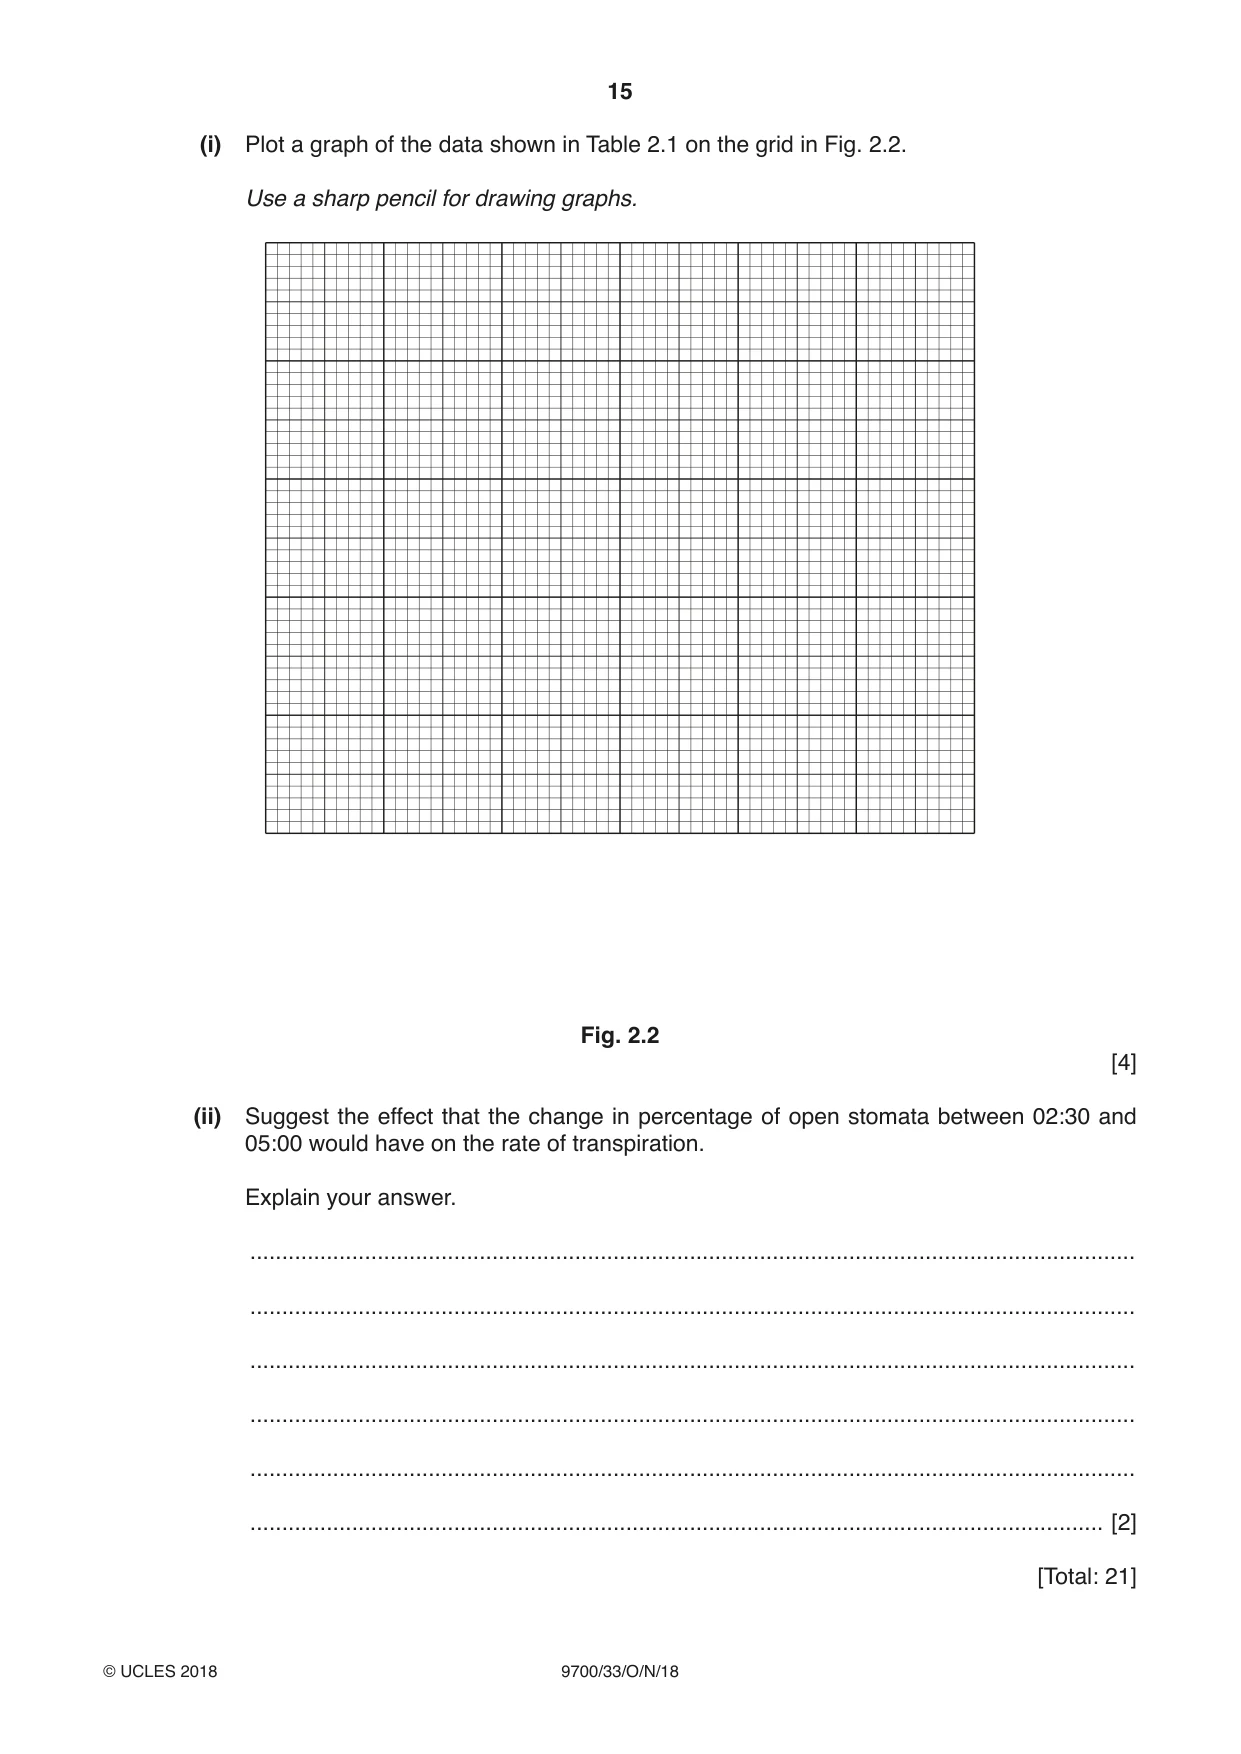
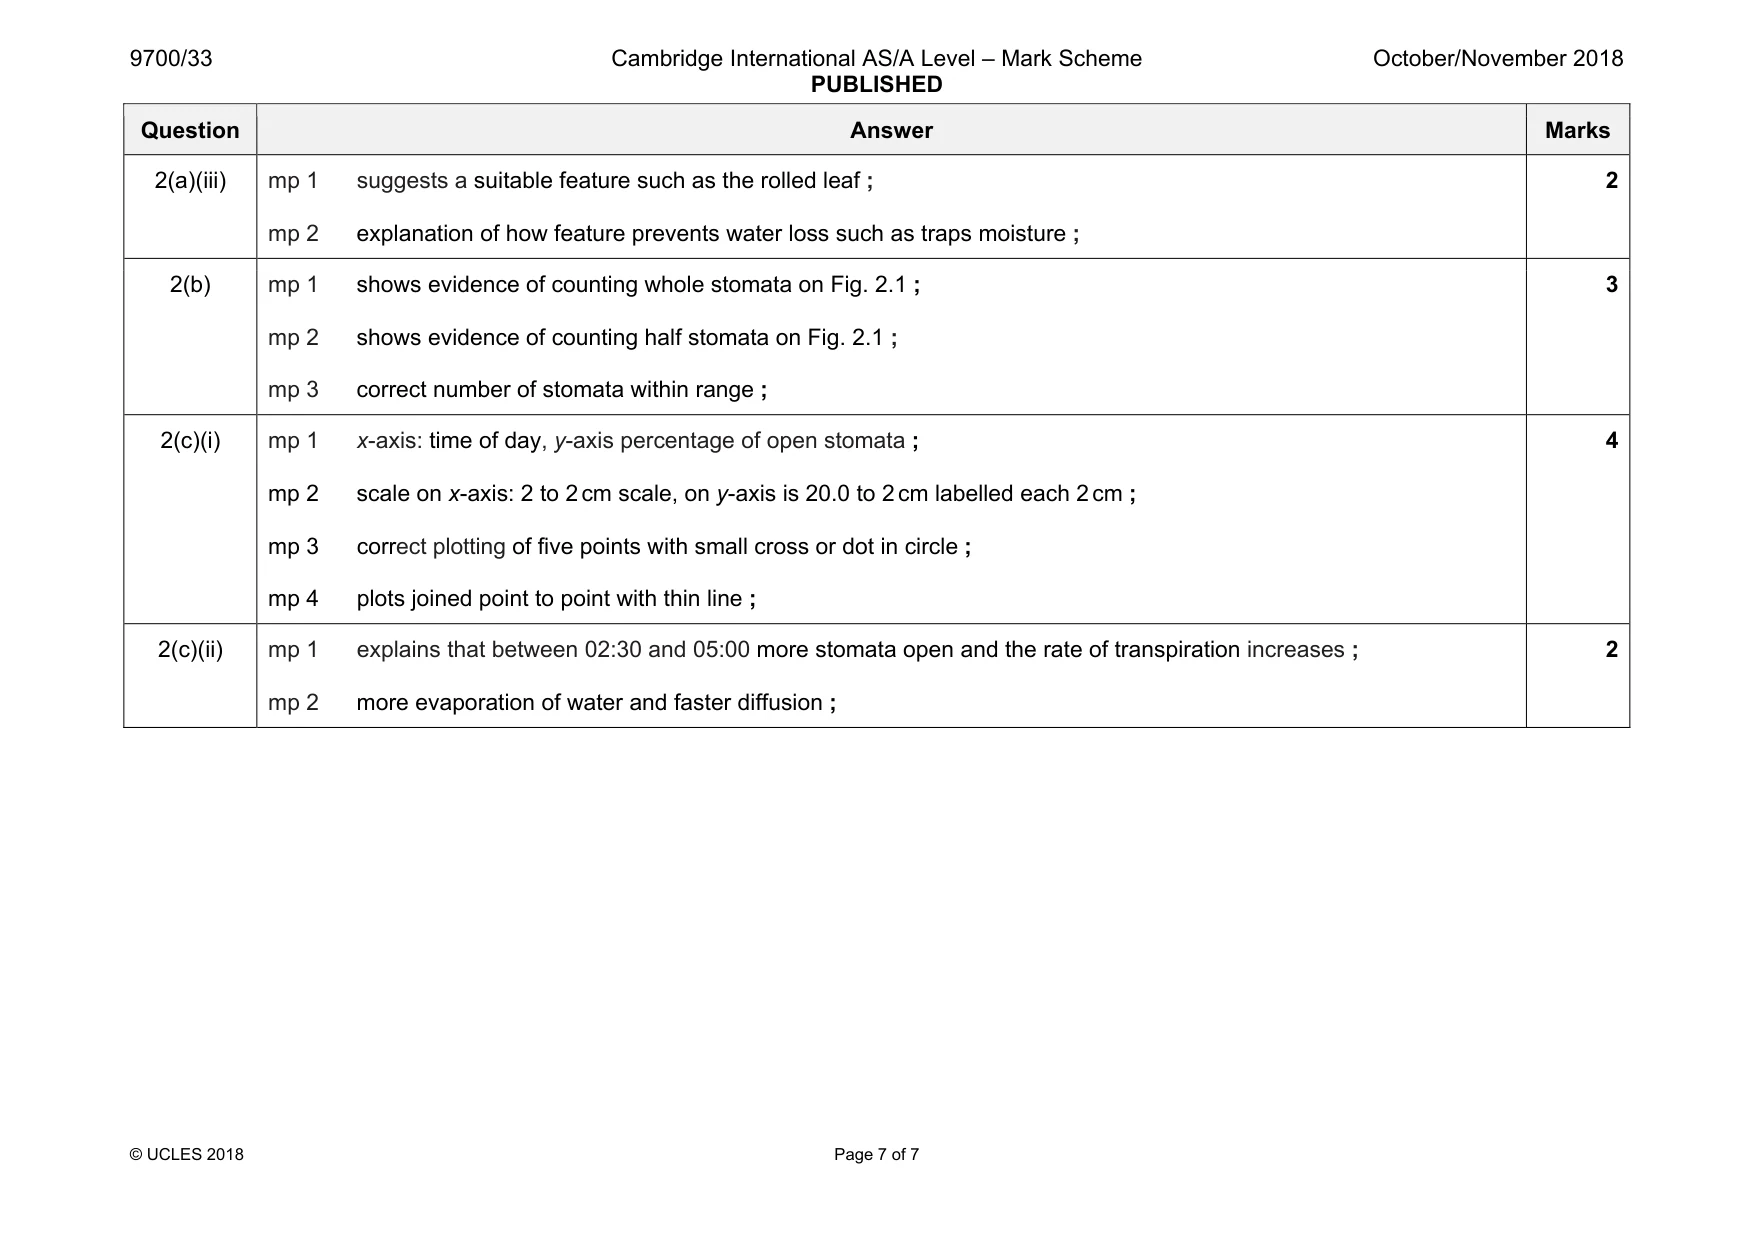
Mark scheme: 2(a)(i) mp 1 drawing of a minimum size with a minimum number of tissue layers and no cells drawn ; mp 2 whole leaf drawn ; mp 3 correct leaf shape with at least three layers of tissue ; mp 4 correct position of vascular bundle ; mp 5 uses label line and label to identify the palisade tissue ; 5 2(a)(ii) mp 1 drawing of a minimum cell size and drawn with thin, continuous lines ; mp 2 draws three touching epidermal cells and a trichome ; mp 3 two lines drawn around each cell ; mp 4 draws trichome or epidermal cell with an inclusion ; mp 5 uses label line and label to identify the cell wall ; 5 Question Answer Marks 2(a)(iii) mp 1 suggests a suitable feature such as the rolled leaf ; mp 2 explanation of how feature prevents water loss such as traps moisture ; 2 2(b) mp 1 shows evidence of counting whole stomata on Fig. 2.1 ; mp 2 shows evidence of counting half stomata on Fig. 2.1 ; mp 3 correct number of stomata within range ; 3 2(c)(i) mp 1 x-axis: time of day, y-axis percentage of open stomata ; mp 2 scale on x-axis: 2 to 2 cm scale, on y-axis is 20.0 to 2 cm labelled each 2 cm ; mp 3 correct plotting of five points with small cross or dot in circle ; mp 4 plots joined point to point with thin line ; 4 2(c)(ii) mp 1 explains that between 02:30 and 05:00 more stomata open and the rate of transpiration increases ; mp 2 more evaporation of water and faster diffusion ; 2
What was in this paper
The subtopics covered by these 2 questions, and how many questions each got. Open one in a new tab to see every Cambridge question on it.
What you needed in this session
Cambridge’s own grade thresholds for 2018 Oct/Nov, Paper 3 · Variant 3. A higher threshold means an easier paper — the bar moves with how the cohort did.