Cambridge A Level Biology 9700 — 2025 Feb/March Paper 3 · Variant 3
9700/33/F/M/25 · 2 questions · 40 marks · 120 min
The question paper and its mark scheme, free to read here and free to download. This is Cambridge’s own paper, exactly as it was sat.
Question paper12 pages
Mark scheme6 pages
Answers below. Sit the paper first if you are practising.
Questions as text
Q1 · Agar cubes that have been stained with a blue indicator called DCPIP can be used to…
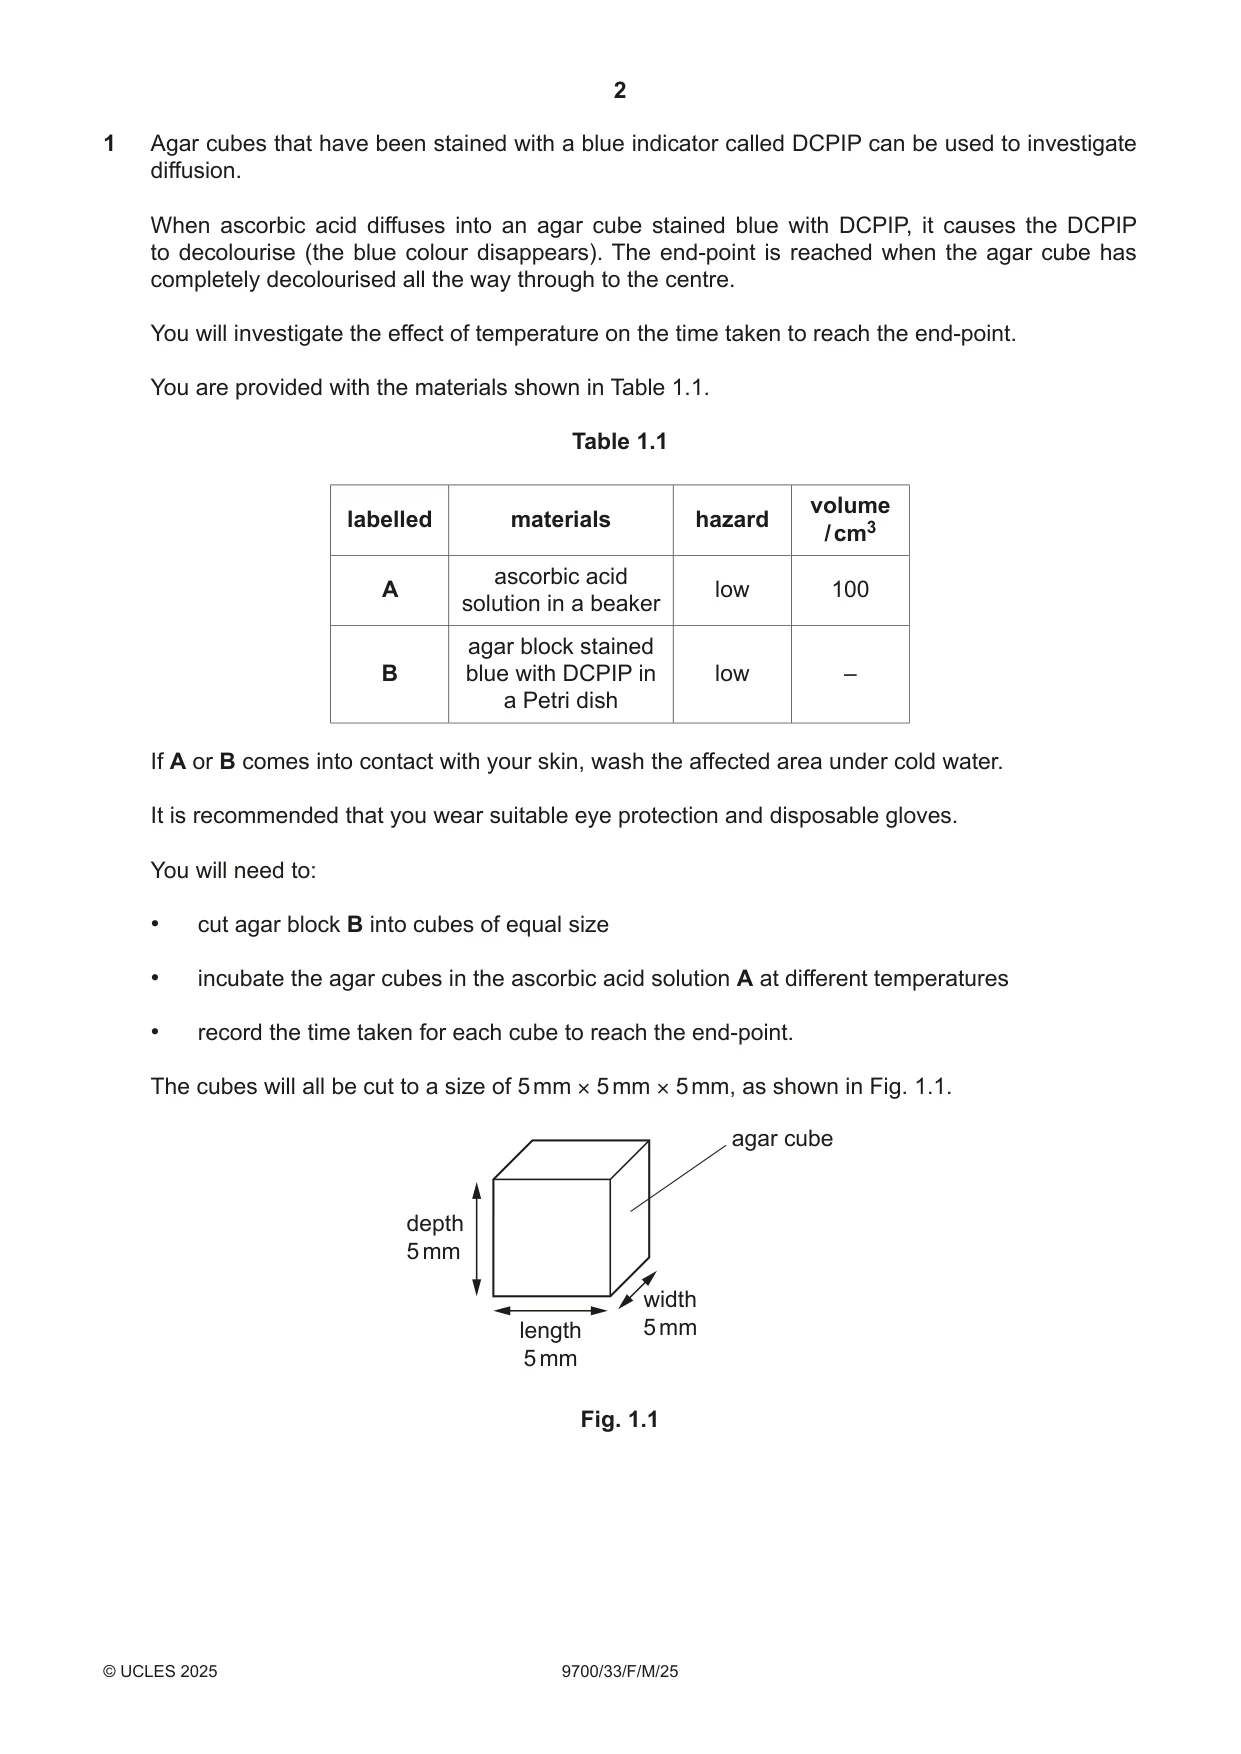
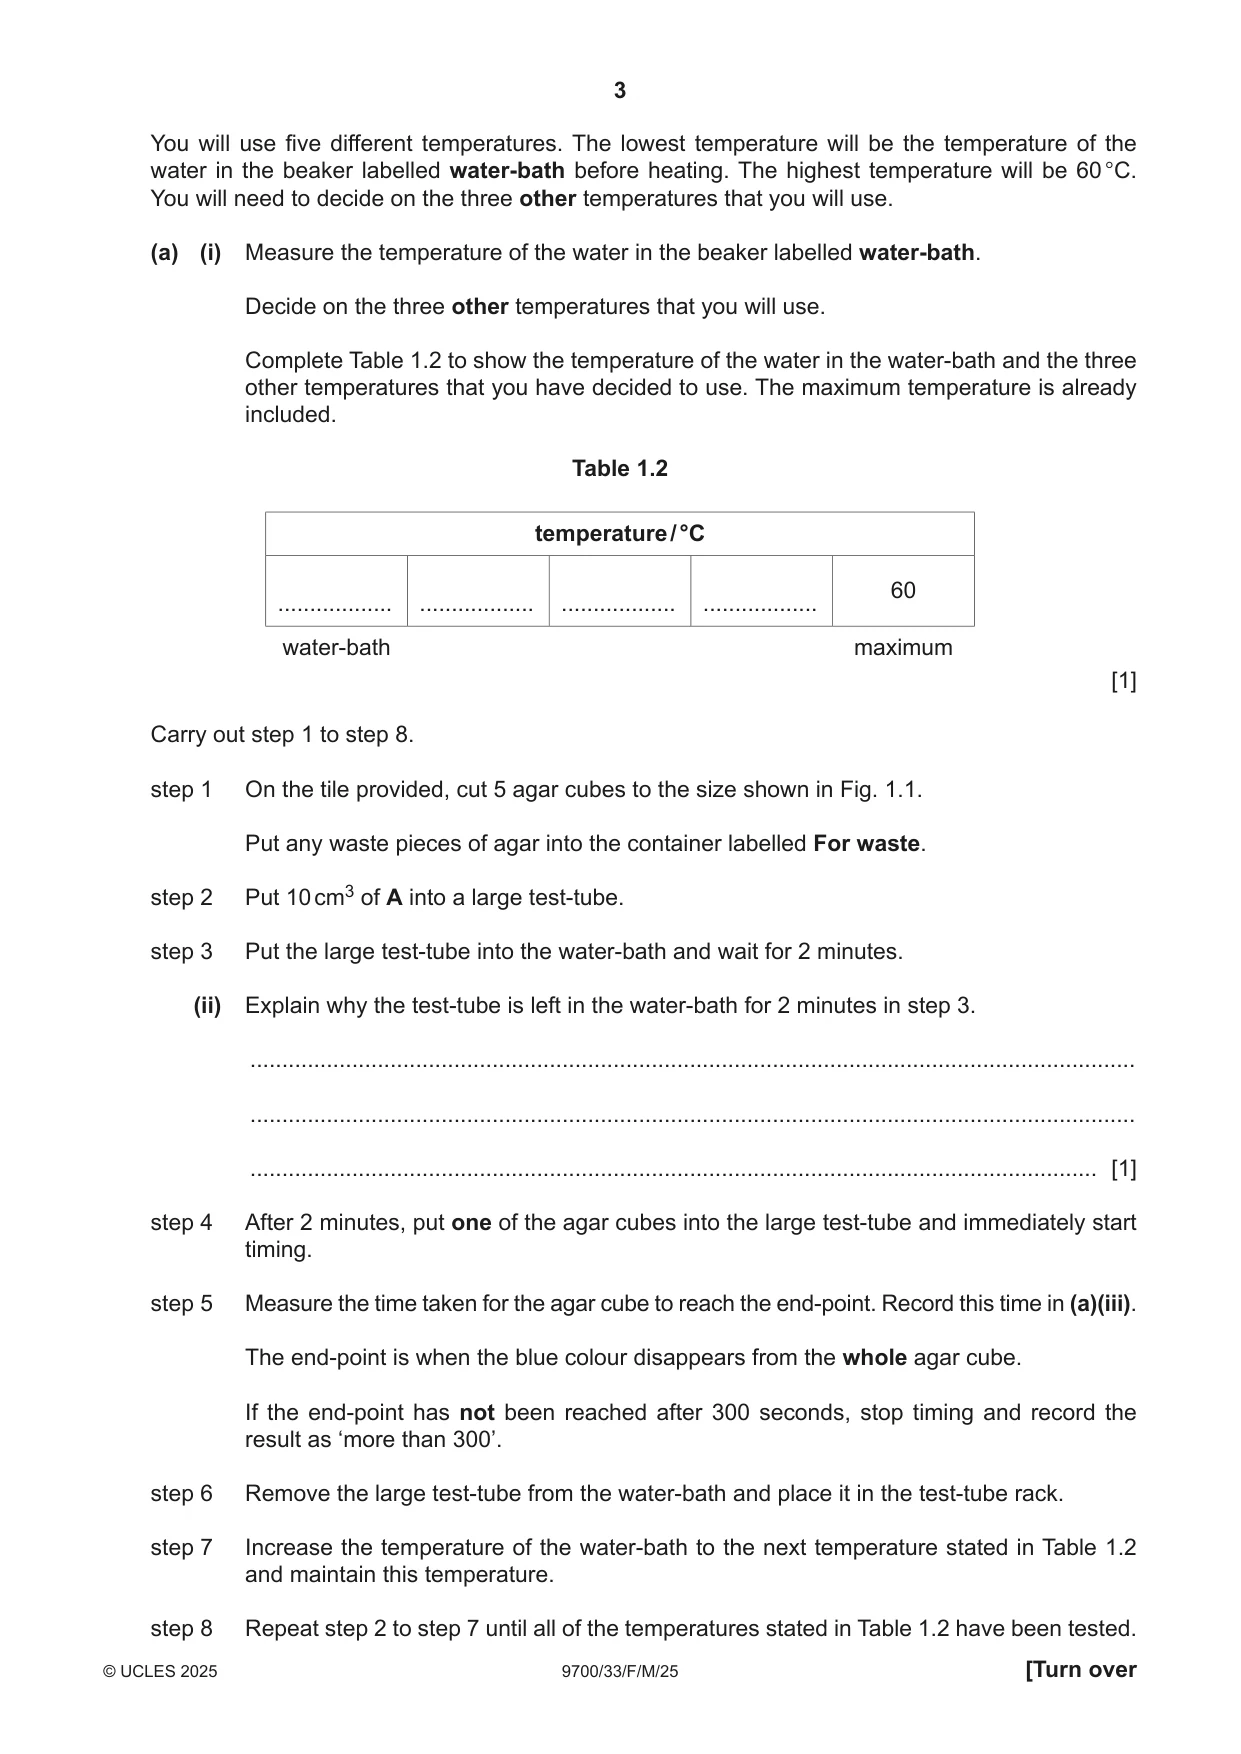
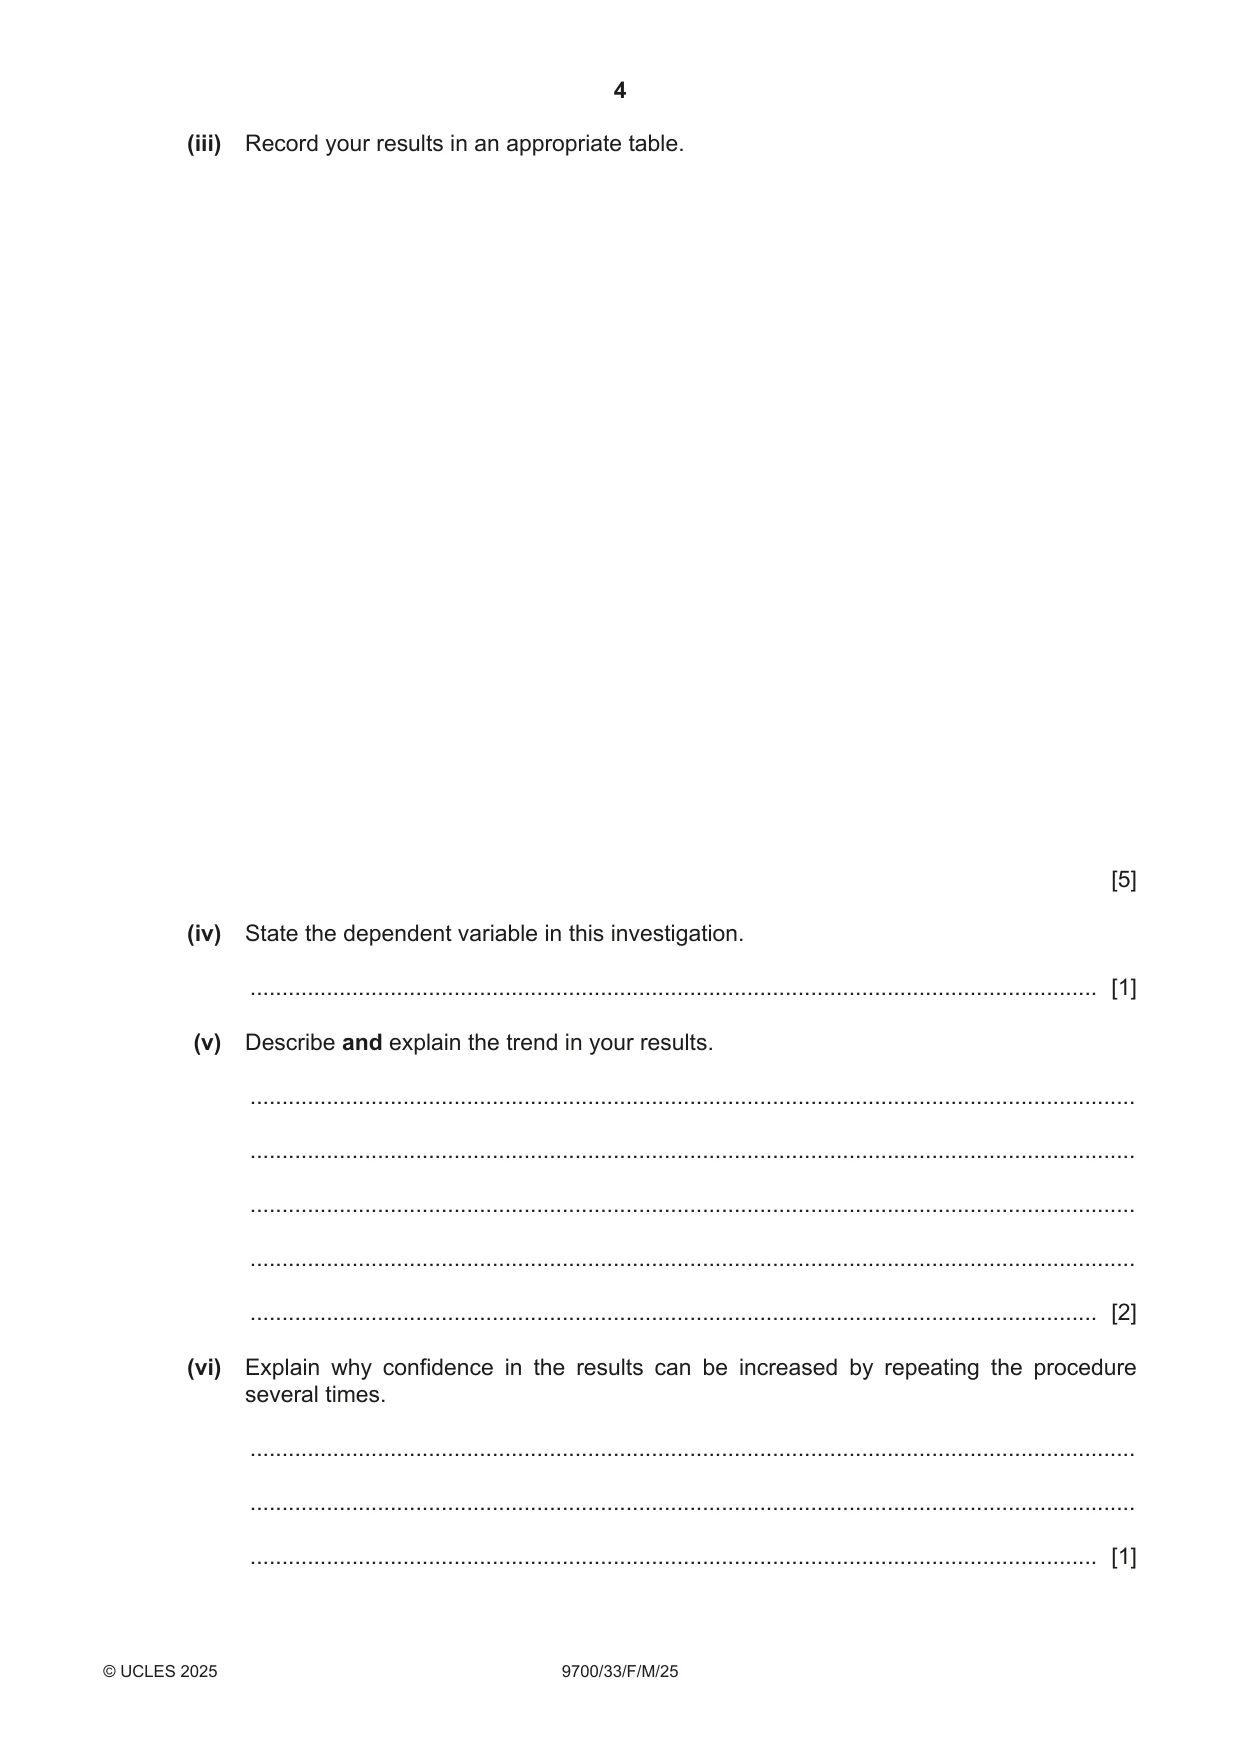
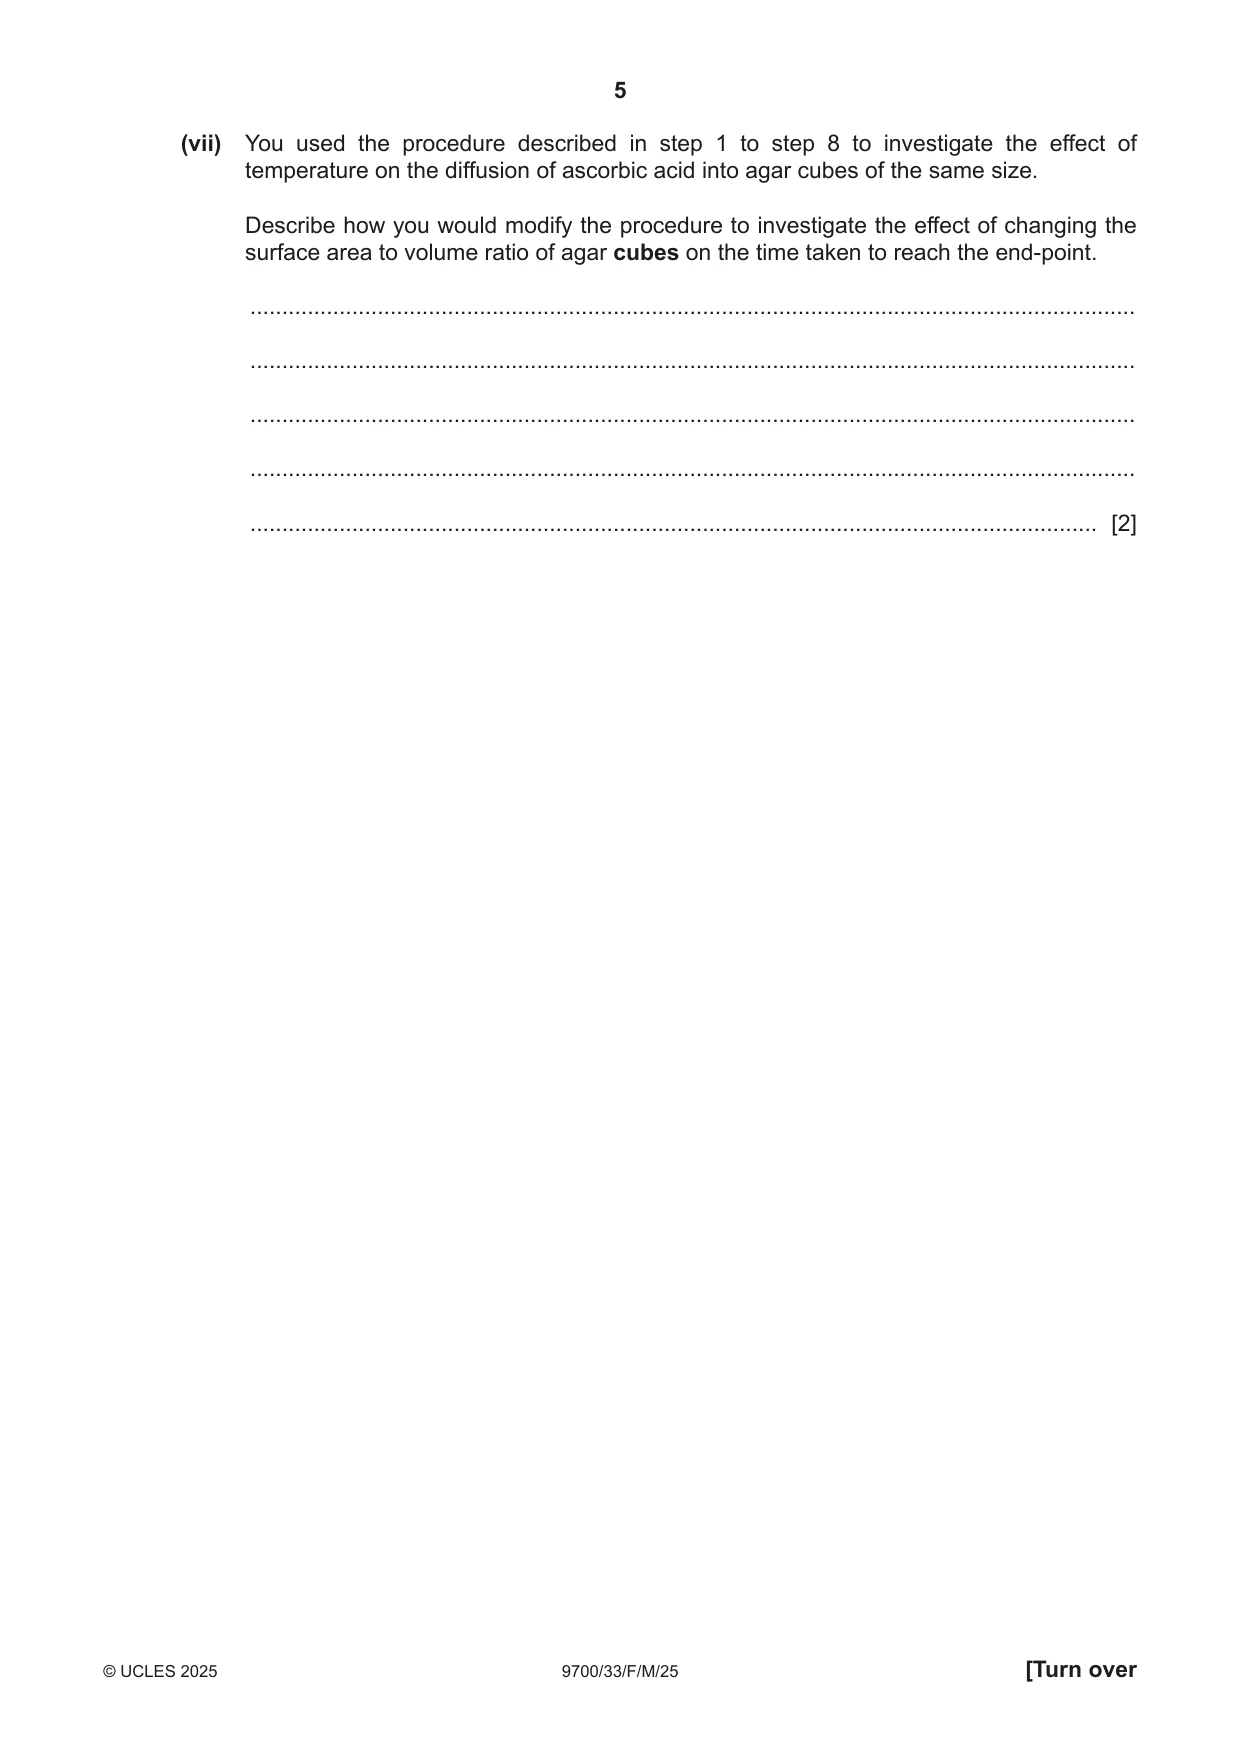
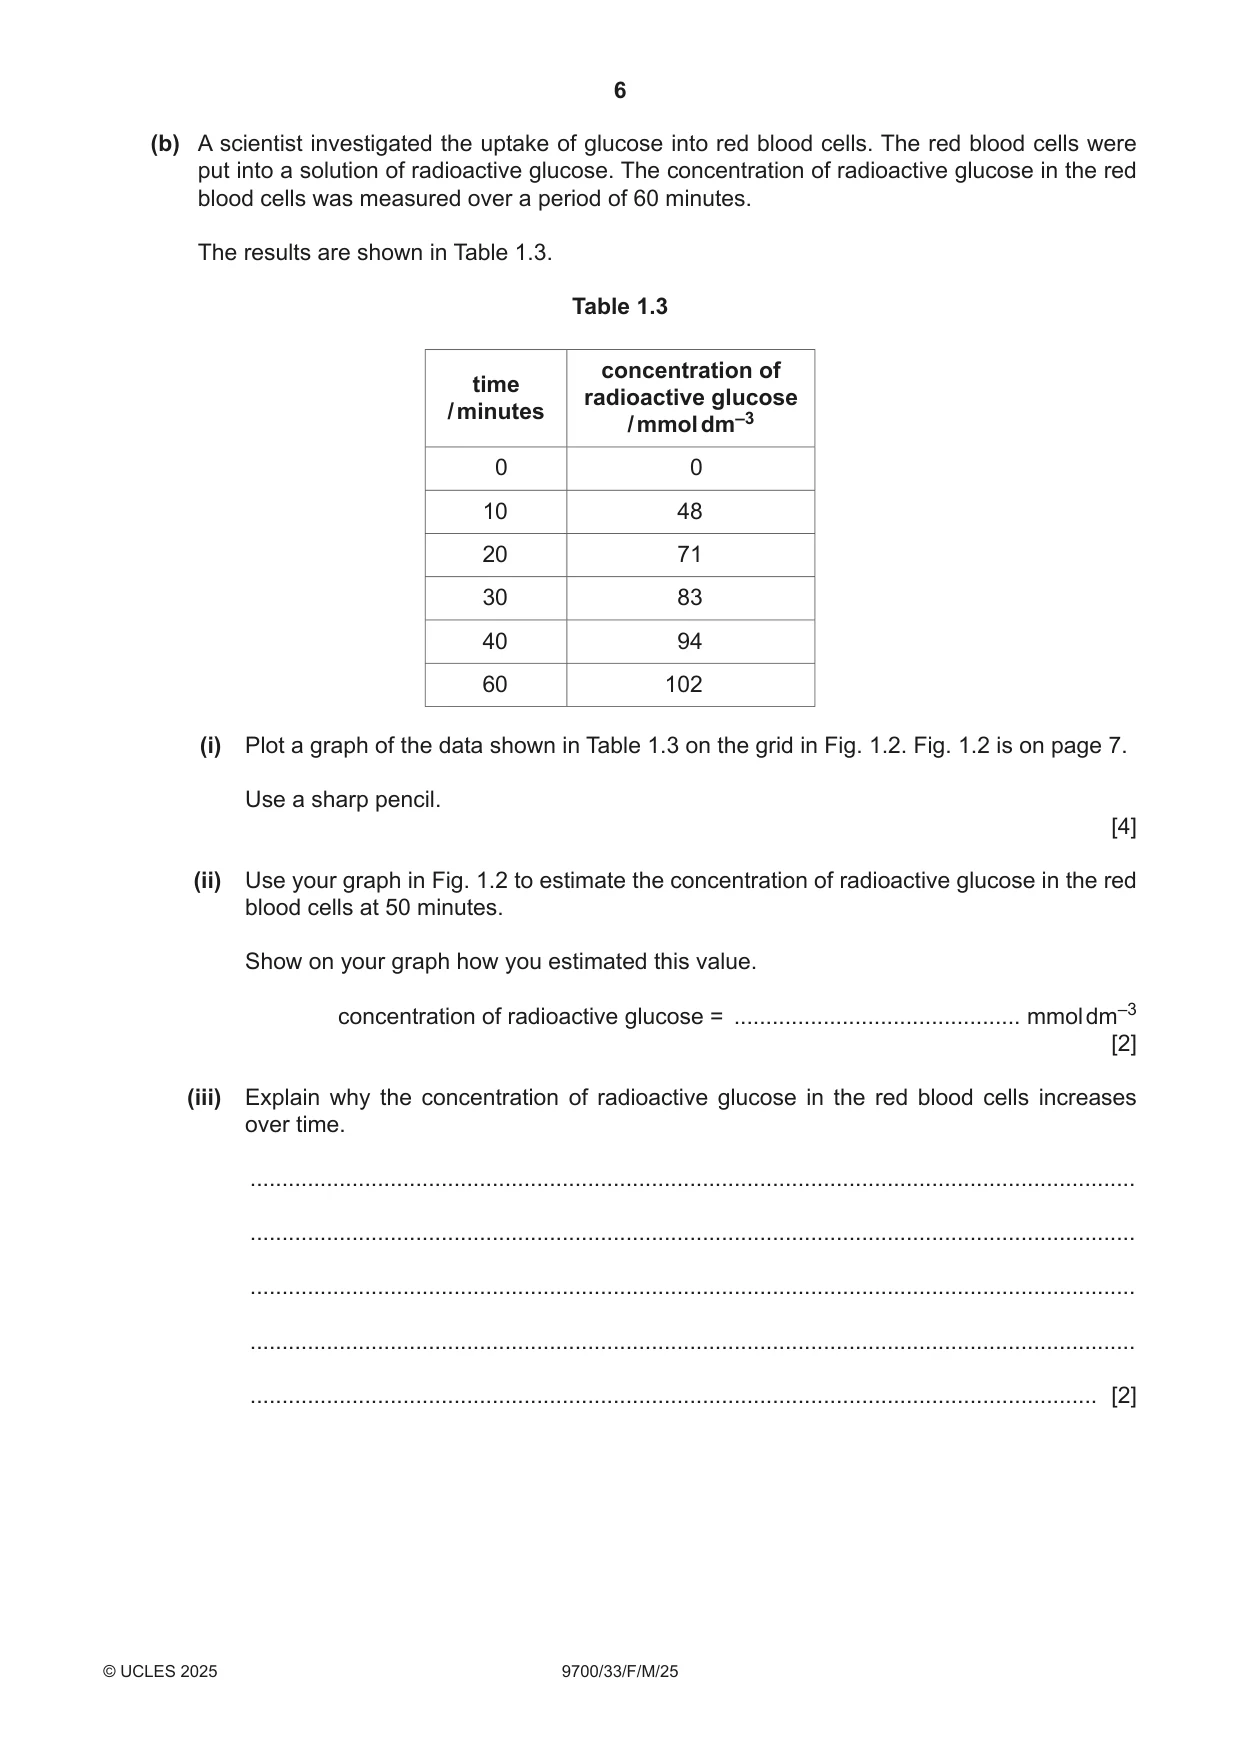
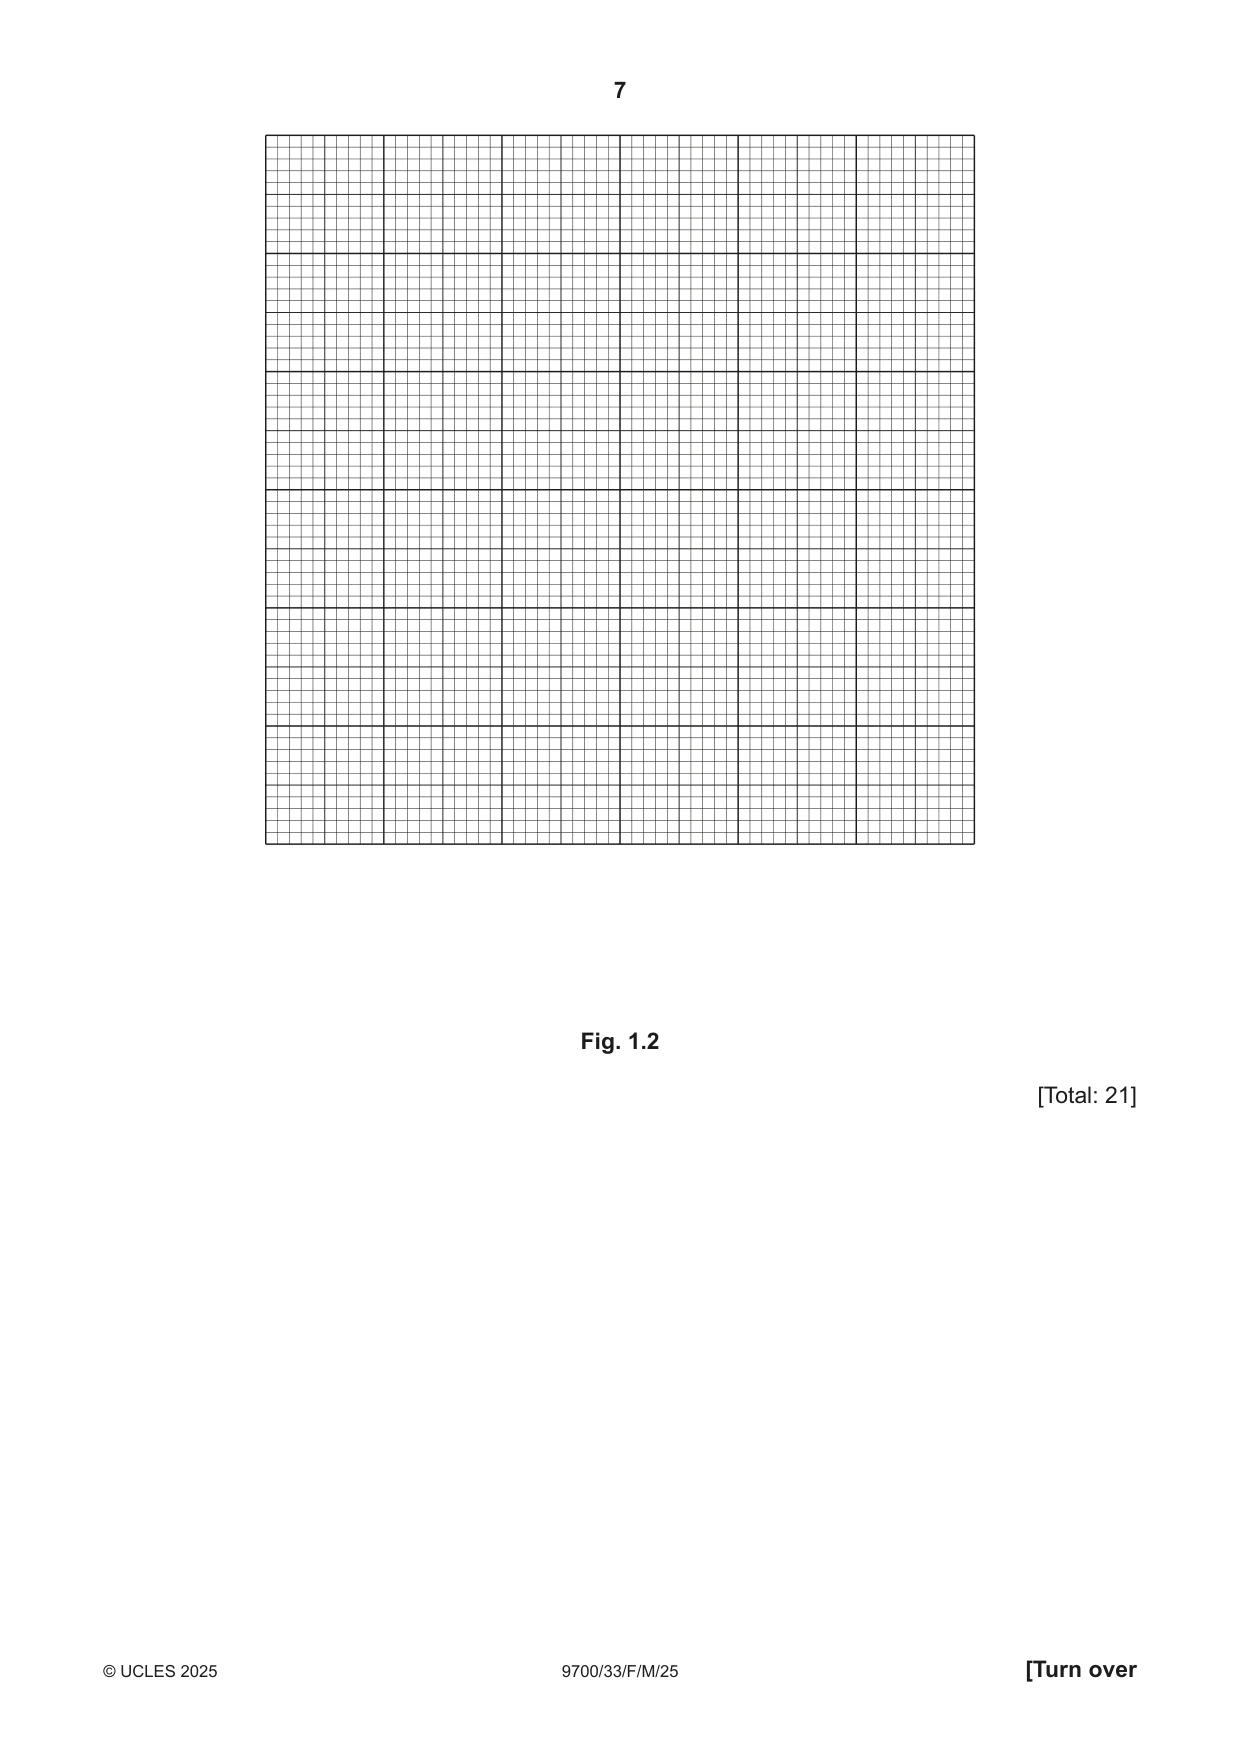
1 Agar cubes that have been stained with a blue indicator called DCPIP can be used to investigate diffusion. When ascorbic acid diffuses into an agar cube stained blue with DCPIP, it causes the DCPIP to decolourise (the blue colour disappears). The end‑point is reached when the agar cube has completely decolourised all the way through to the centre. You will investigate the effect of temperature on the time taken to reach the end‑point. You are provided with the materials shown in Table 1.1. Table 1.1 volume labelled materials hazard / cm3 ascorbic acid A low 100 solution in a beaker agar block stained B blue with DCPIP in low – a Petri dish If A or B comes into contact with your skin, wash the affected area under cold water. It is recommended that you wear suitable eye protection and disposable gloves. You will need to: • cut agar block B into cubes of equal size • incubate the agar cubes in the ascorbic acid solution A at different temperatures • record the time taken for each cube to reach the end‑point. The cubes will all be cut to a size of 5 mm × 5 mm × 5 mm, as shown in Fig. 1.1. agar cube depth 5 mm width length 5 mm 5 mm Fig. 1.1 You will use five different temperatures. The lowest temperature will be the temperature of the water in the beaker labelled water‑bath before heating. The highest temperature will be 60 °C. You will need to decide on the three other temperatures that you will use. (a) (i) Measure the temperature of the water in the beaker labelled water‑bath. Decide on the three other temperatures that you will use. Complete Table 1.2 to show the temperature of the water in the water‑bath and the three other temperatures that you have decided to use. The maximum temperature is already included. Table 1.2 temperature / °C 60 .................. .................. .................. .................. water‑bath maximum [1] Carry out step 1 to step 8. step 1 On the tile provided, cut 5 agar cubes to the size shown in Fig. 1.1. Put any waste pieces of agar into the container labelled For waste. step 2 Put 10 cm3 of A into a large test‑tube. step 3 Put the large test‑tube into the water‑bath and wait for 2 minutes. (ii) Explain why the test‑tube is left in the water‑bath for 2 minutes in step 3. ........................................................................................................................................... ........................................................................................................................................... ..................................................................................................................................... [1] step 4 After 2 minutes, put one of the agar cubes into the large test‑tube and immediately start timing. step 5 Measure the time taken for the agar cube to reach the end‑point. Record this time in (a)(iii). The end‑point is when the blue colour disappears from the whole agar cube. If the end‑point has not been reached after 300 seconds, stop timing and record the result as ‘more than 300’. step 6 Remove the large test‑tube from the water‑bath and place it in the test‑tube rack. step 7 Increase the temperature of the water‑bath to the next temperature stated in Table 1.2 and maintain this temperature. step 8 Repeat step 2 to step 7 until all of the temperatures stated in Table 1.2 have been tested. (iii) Record your results in an appropriate table. [5] (iv) State the dependent variable in this investigation. ..................................................................................................................................... [1] (v) Describe and explain the trend in your results. ........................................................................................................................................... ........................................................................................................................................... ........................................................................................................................................... ........................................................................................................................................... ..................................................................................................................................... [2] (vi) Explain why confidence in the results can be increased by repeating the procedure several times. ........................................................................................................................................... ........................................................................................................................................... ..................................................................................................................................... [1] (vii) You used the procedure described in step 1 to step 8 to investigate the effect of temperature on the diffusion of ascorbic acid into agar cubes of the same size. Describe how you would modify the procedure to investigate the effect of changing the surface area to volume ratio of agar cubes on the time taken to reach the end‑point. ........................................................................................................................................... ........................................................................................................................................... ........................................................................................................................................... ........................................................................................................................................... ..................................................................................................................................... [2] (b) A scientist investigated the uptake of glucose into red blood cells. The red blood cells were put into a solution of radioactive glucose. The concentration of radioactive glucose in the red blood cells was measured over a period of 60 minutes. The results are shown in Table 1.3. Table 1.3 concentration of time radioactive glucose / minutes / mmol dm–3 0 0 10 48 20 71 30 83 40 94 60 102 (i) Plot a graph of the data shown in Table 1.3 on the grid in Fig. 1.2. Fig. 1.2 is on page 7. Use a sharp pencil. [4] (ii) Use your graph in Fig. 1.2 to estimate the concentration of radioactive glucose in the red blood cells at 50 minutes. Show on your graph how you estimated this value. concentration of radioactive glucose = ............................................. mmol dm–3 [2] (iii) Explain why the concentration of radioactive glucose in the red blood cells increases over time. ........................................................................................................................................... ........................................................................................................................................... ........................................................................................................................................... ........................................................................................................................................... ..................................................................................................................................... [2] Fig. 1.2 [Total: 21]
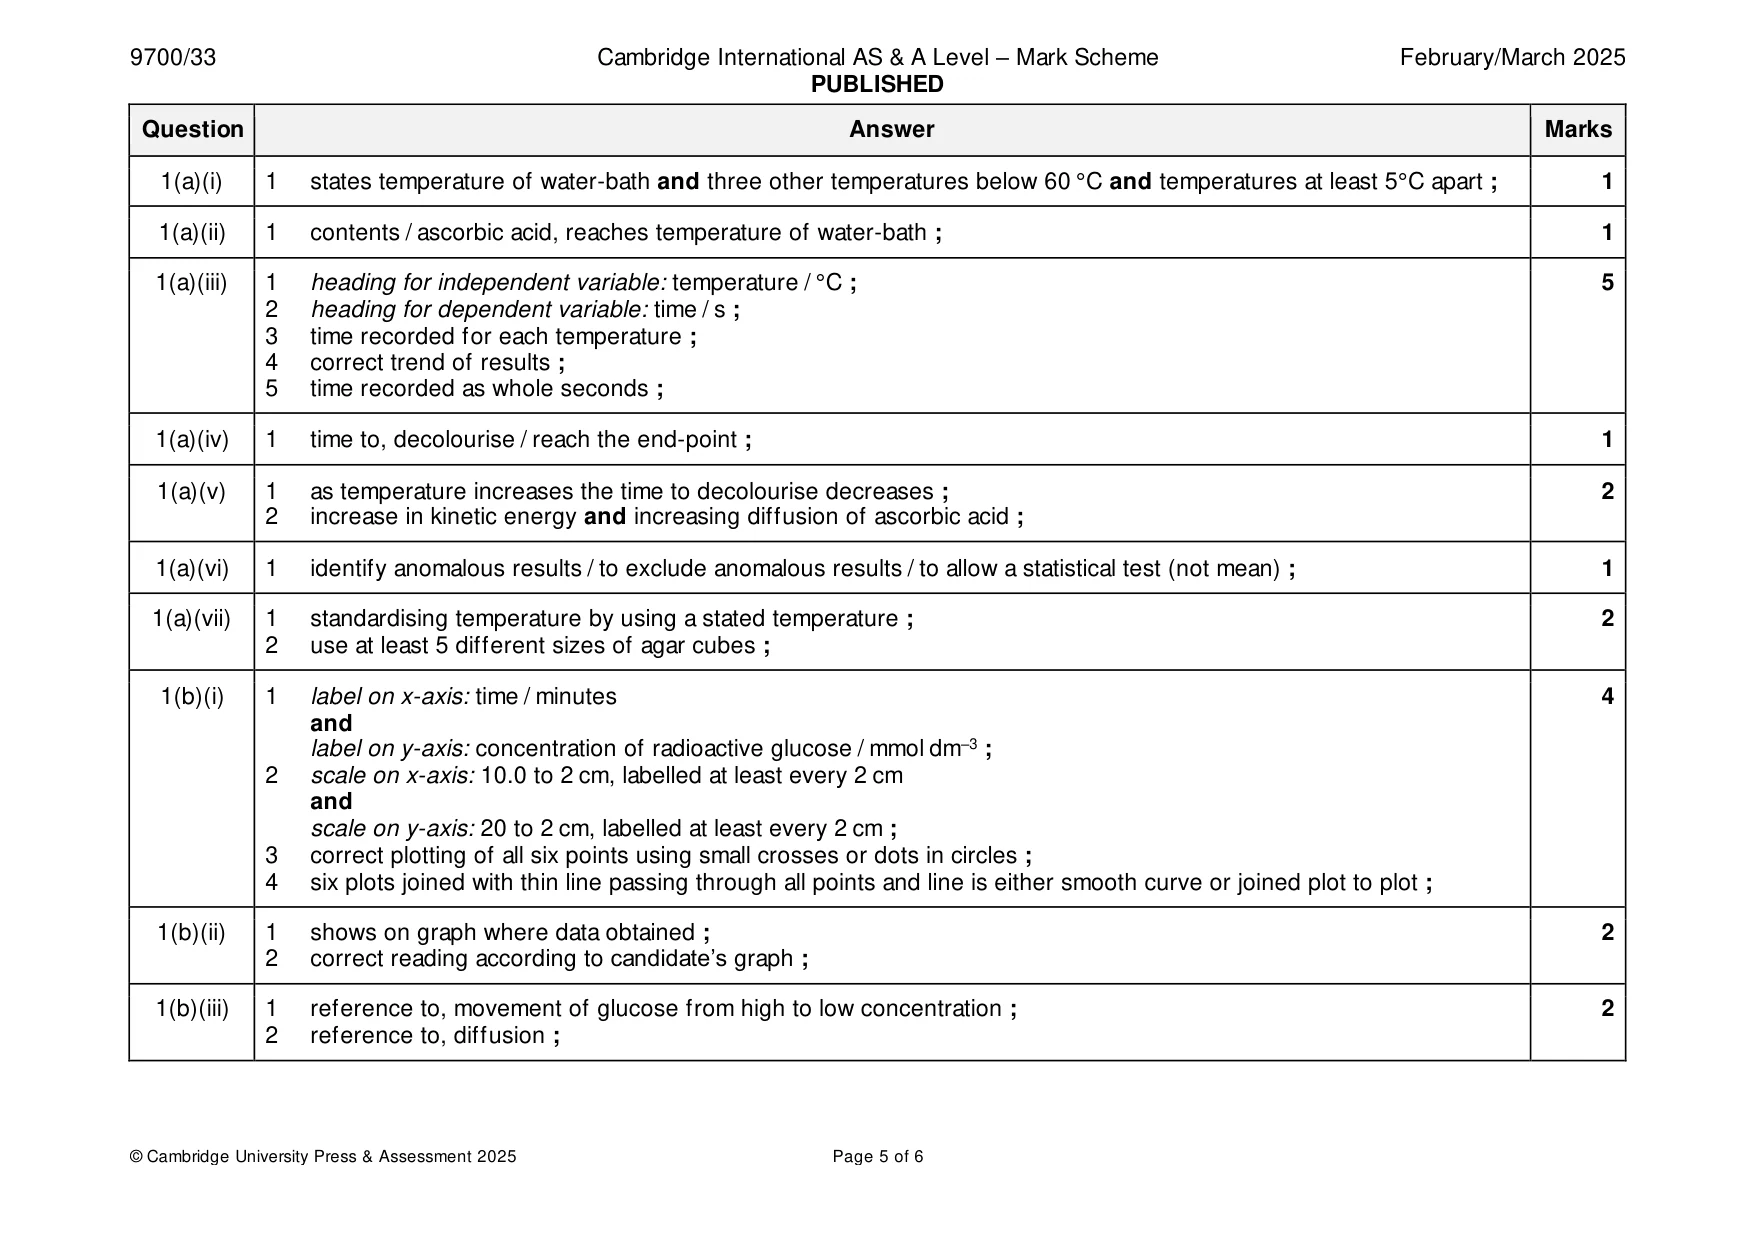
Mark scheme: Question Answer Marks 1(a)(i) 1 states temperature of water-bath and three other temperatures below 60 °C and temperatures at least 5°C apart ; 1 1(a)(ii) 1 contents / ascorbic acid, reaches temperature of water-bath ; 1 1(a)(iii) 1 heading for independent variable: temperature / °C ; 5 2 heading for dependent variable: time / s ; 3 time recorded for each temperature ; 4 correct trend of results ; 5 time recorded as whole seconds ; 1(a)(iv) 1 time to, decolourise / reach the end-point ; 1 1(a)(v) 1 as temperature increases the time to decolourise decreases ; 2 2 increase in kinetic energy and increasing diffusion of ascorbic acid ; 1(a)(vi) 1 identify anomalous results / to exclude anomalous results / to allow a statistical test (not mean) ; 1 1(a)(vii) 1 standardising temperature by using a stated temperature ; 2 2 use at least 5 different sizes of agar cubes ; 1(b)(i) 1 label on x-axis: time / minutes 4 and label on y-axis: concentration of radioactive glucose / mmol dm–3 ; 2 scale on x-axis: 10.0 to 2 cm, labelled at least every 2 cm and scale on y-axis: 20 to 2 cm, labelled at least every 2 cm ; 3 correct plotting of all six points using small crosses or dots in circles ; 4 six plots joined with thin line passing through all points and line is either smooth curve or joined plot to plot ; 1(b)(ii) 1 shows on graph where data obtained ; 2 2 correct reading according to candidate’s graph ; 1(b)(iii) 1 reference to, movement of glucose from high to low concentration ; 2 2 reference to, diffusion ;
Q2 · P1 is a slide of a stained transverse section through a plant organ
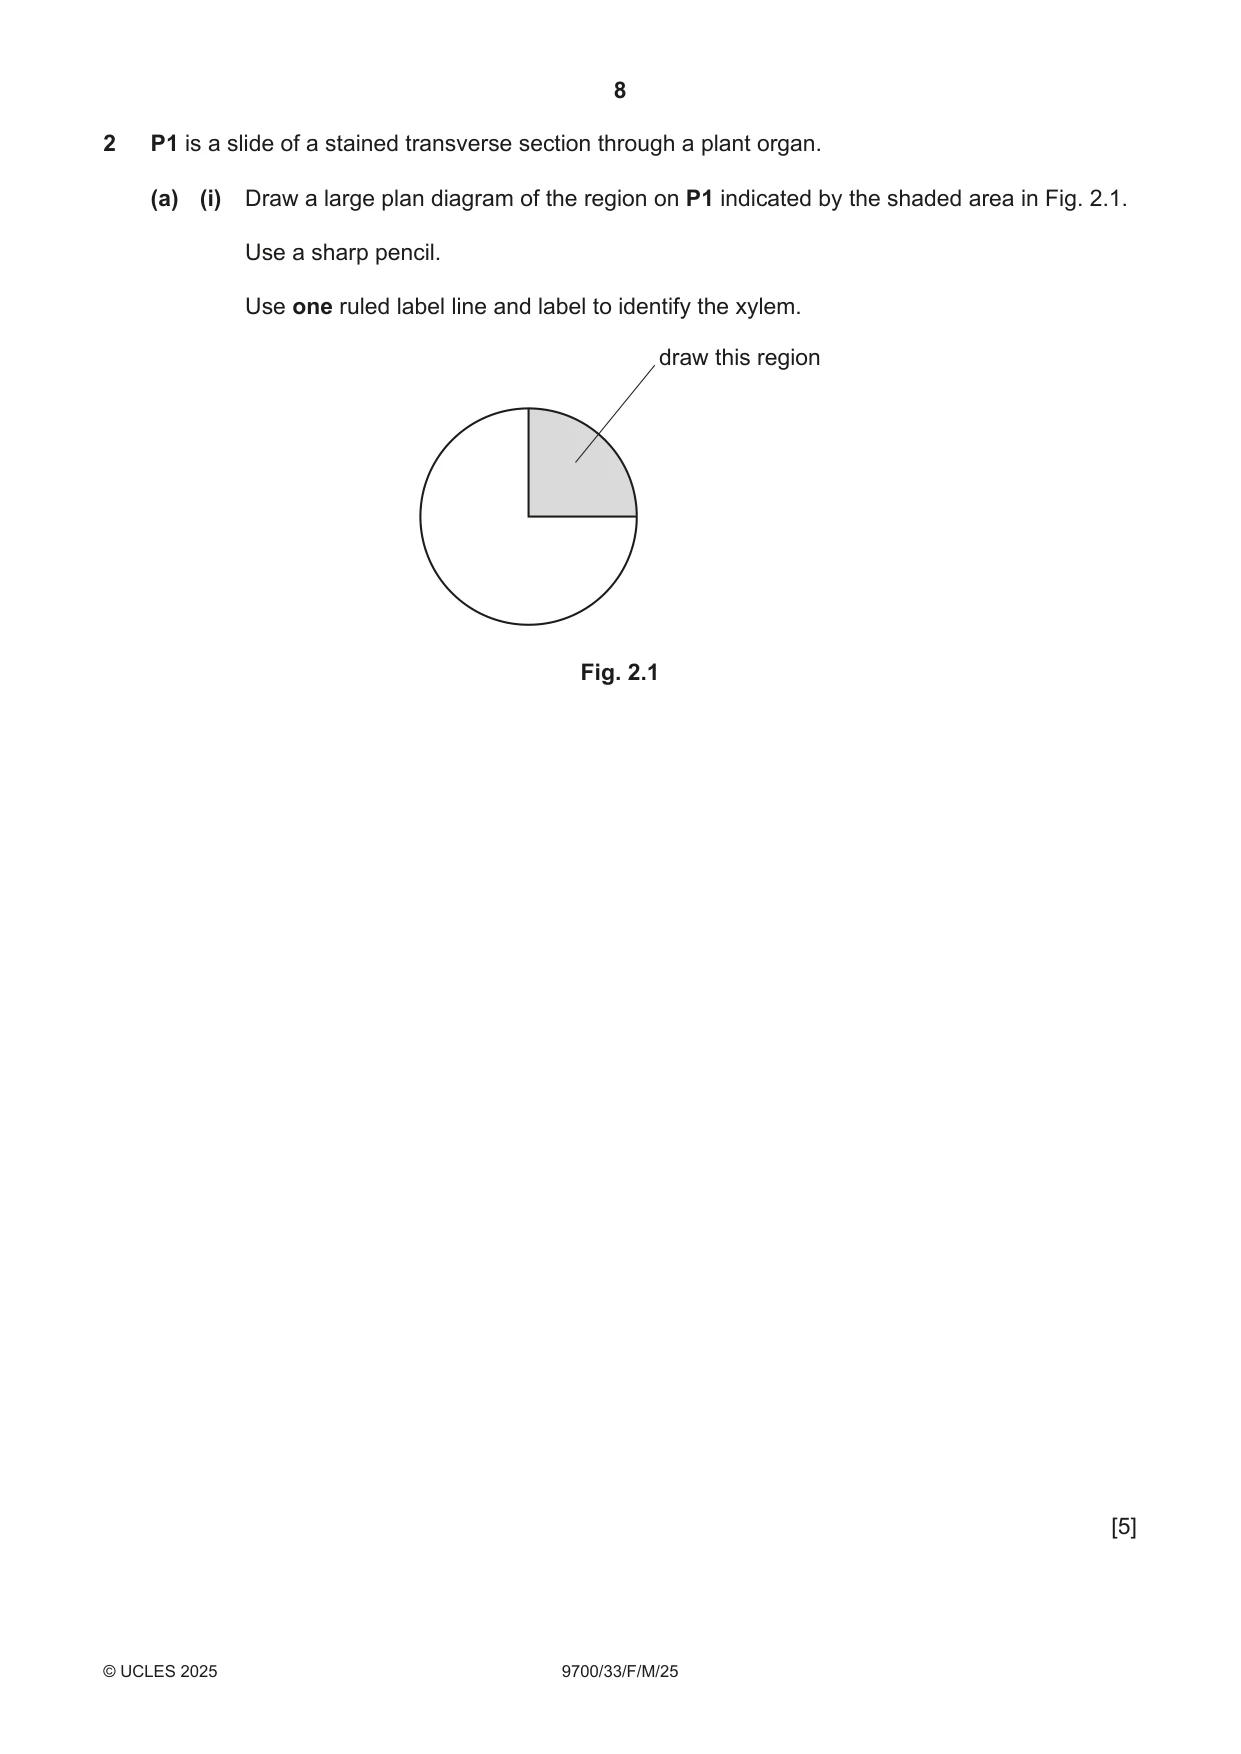
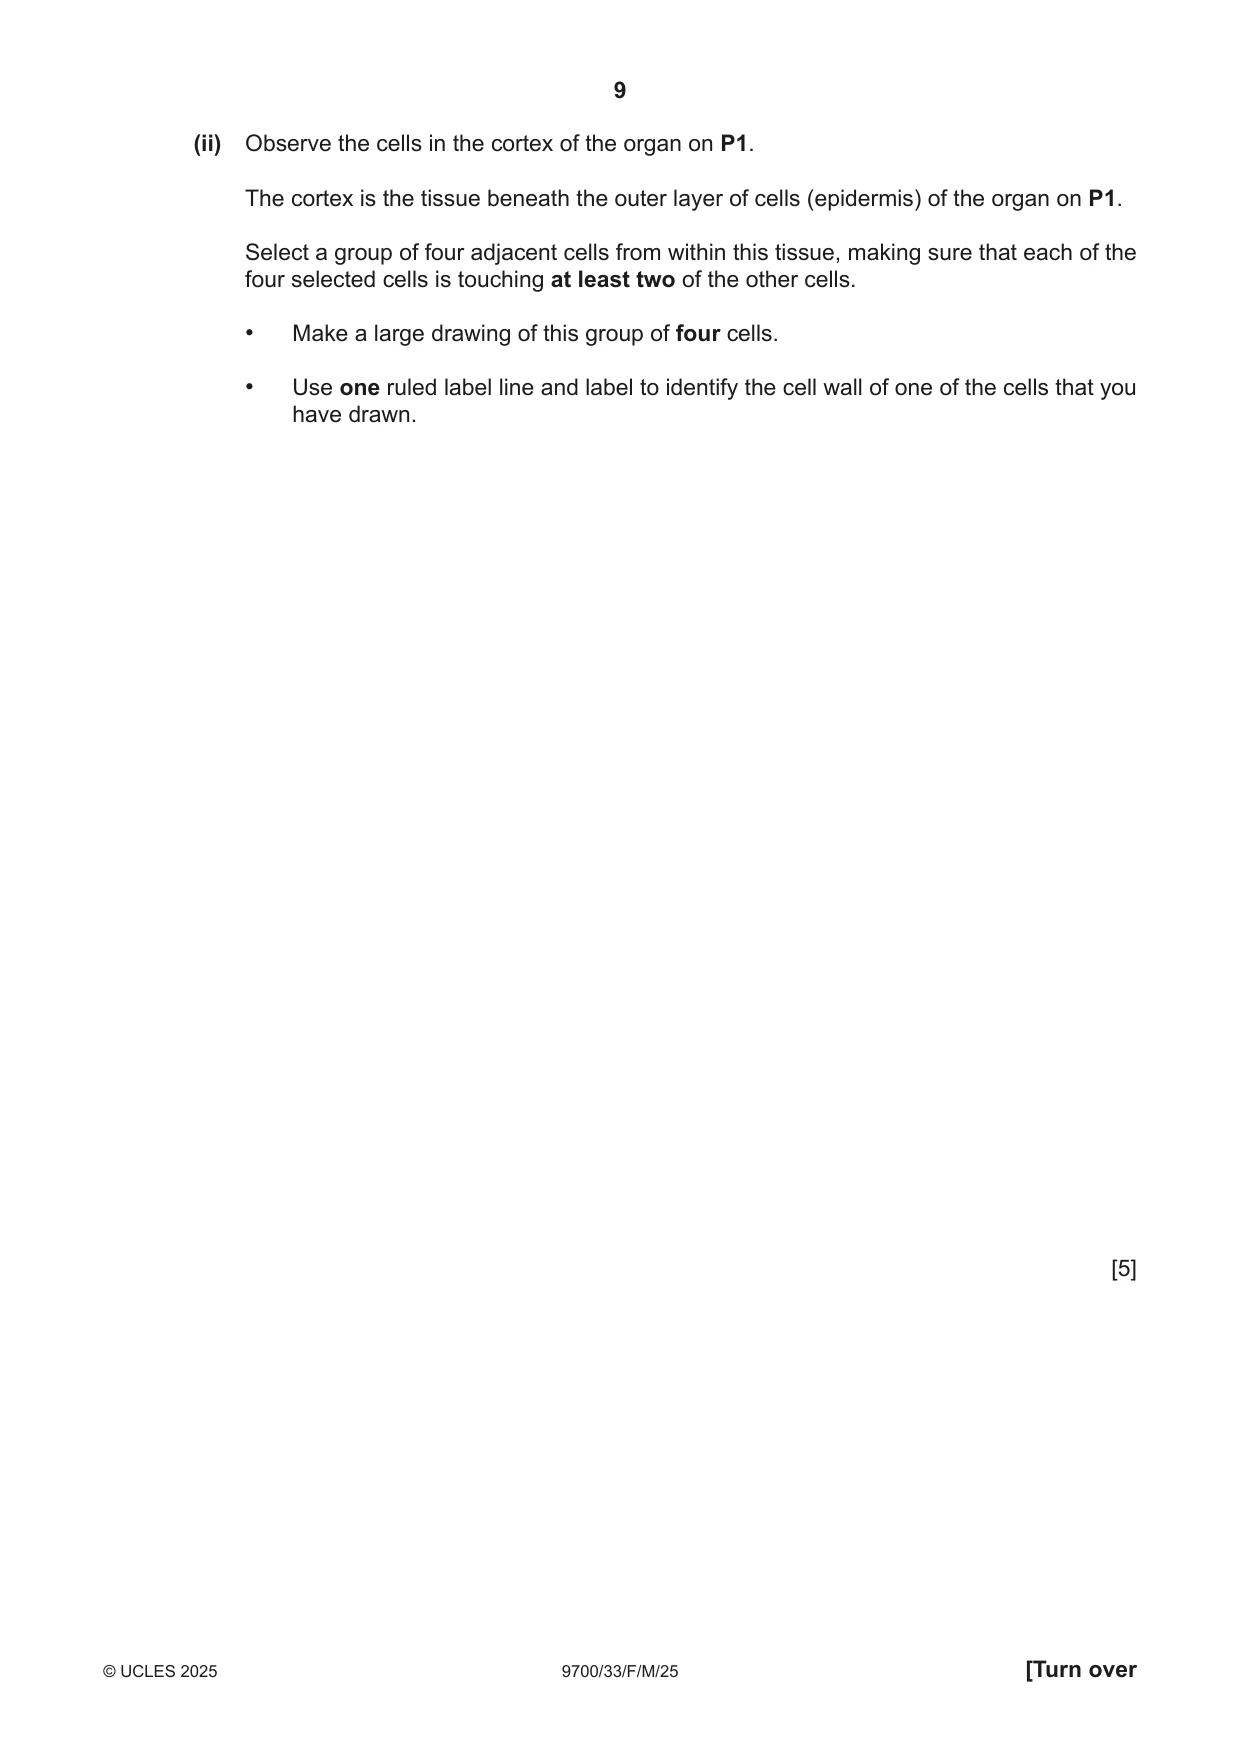
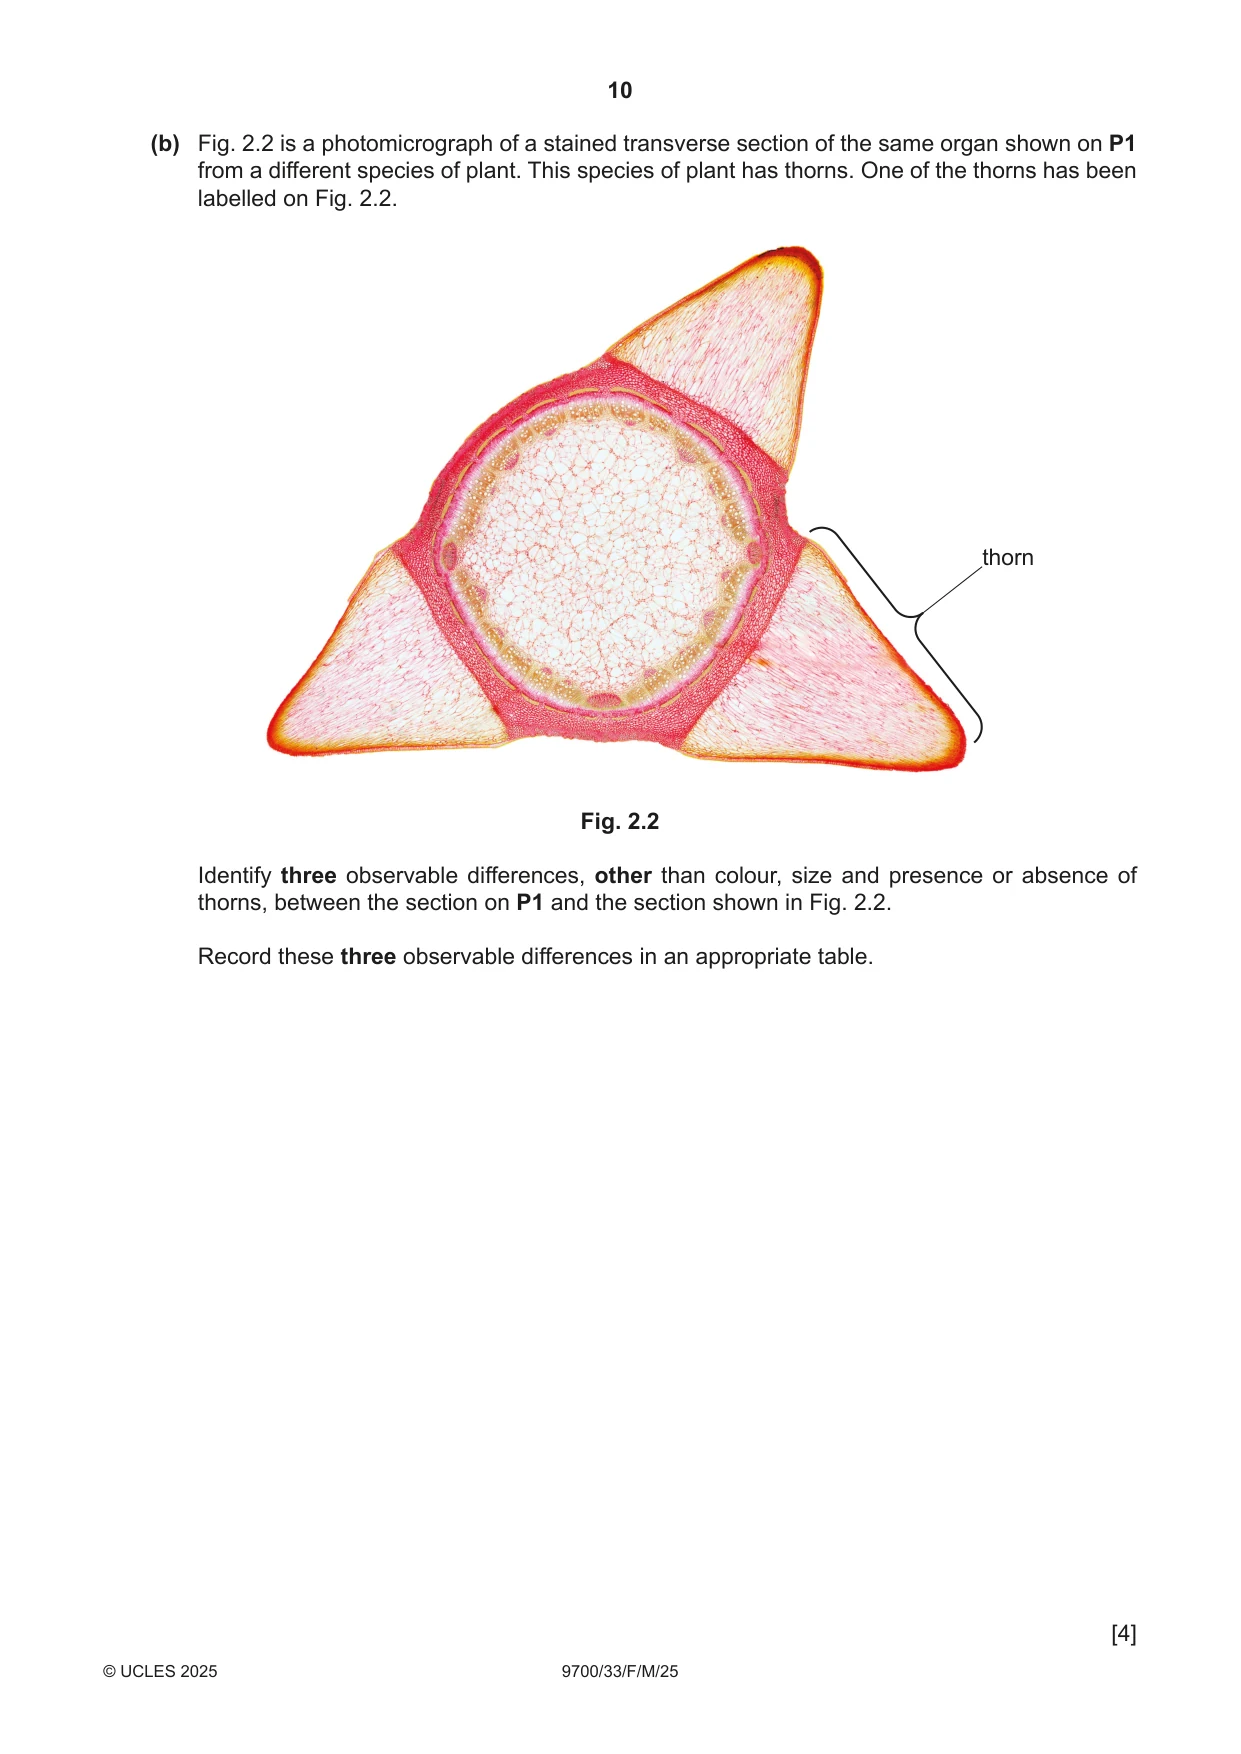
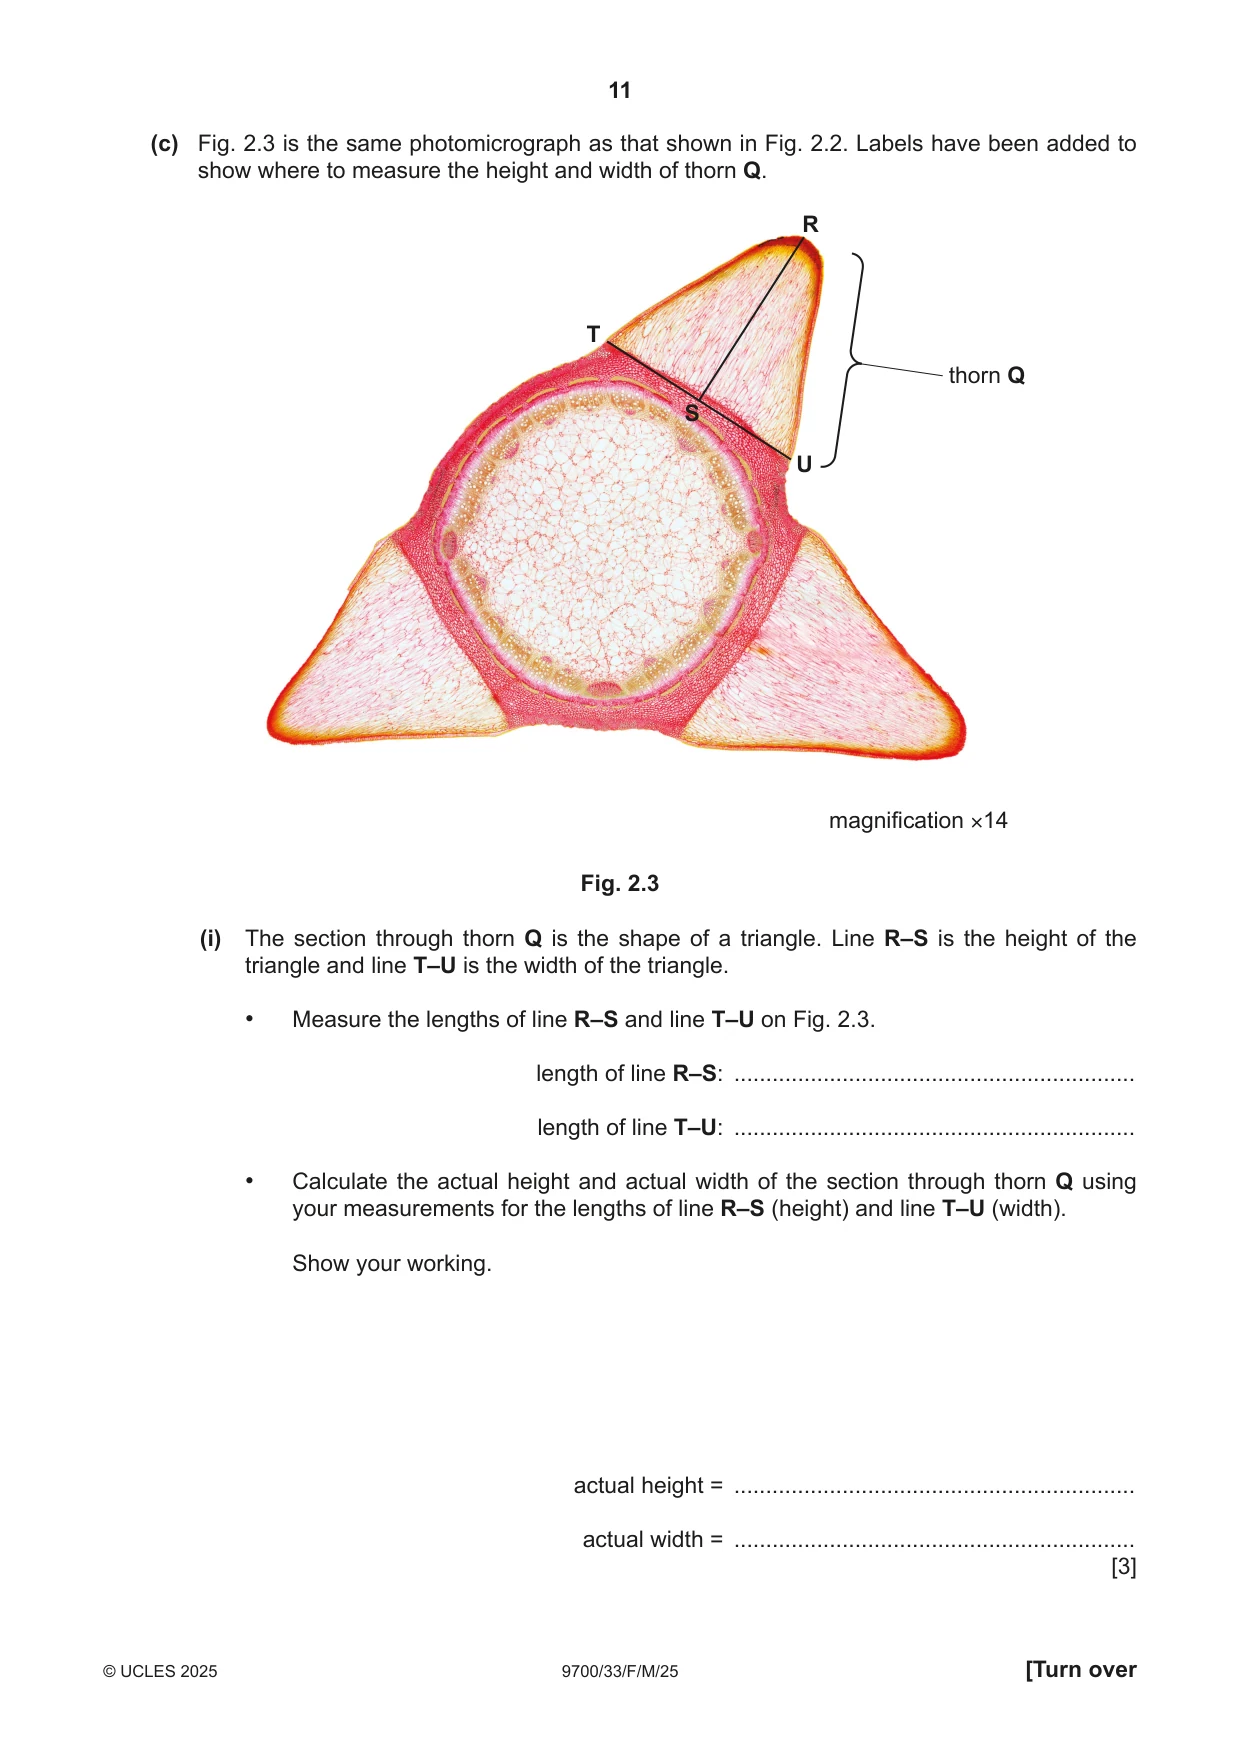
2 P1 is a slide of a stained transverse section through a plant organ. (a) (i) Draw a large plan diagram of the region on P1 indicated by the shaded area in Fig. 2.1. Use a sharp pencil. Use one ruled label line and label to identify the xylem. draw this region Fig. 2.1 [5] (ii) Observe the cells in the cortex of the organ on P1. The cortex is the tissue beneath the outer layer of cells (epidermis) of the organ on P1. Select a group of four adjacent cells from within this tissue, making sure that each of the four selected cells is touching at least two of the other cells. • Make a large drawing of this group of four cells. • Use one ruled label line and label to identify the cell wall of one of the cells that you have drawn. [5] (b) Fig. 2.2 is a photomicrograph of a stained transverse section of the same organ shown on P1 from a different species of plant. This species of plant has thorns. One of the thorns has been labelled on Fig. 2.2. thorn Fig. 2.2 Identify three observable differences, other than colour, size and presence or absence of thorns, between the section on P1 and the section shown in Fig. 2.2. Record these three observable differences in an appropriate table.
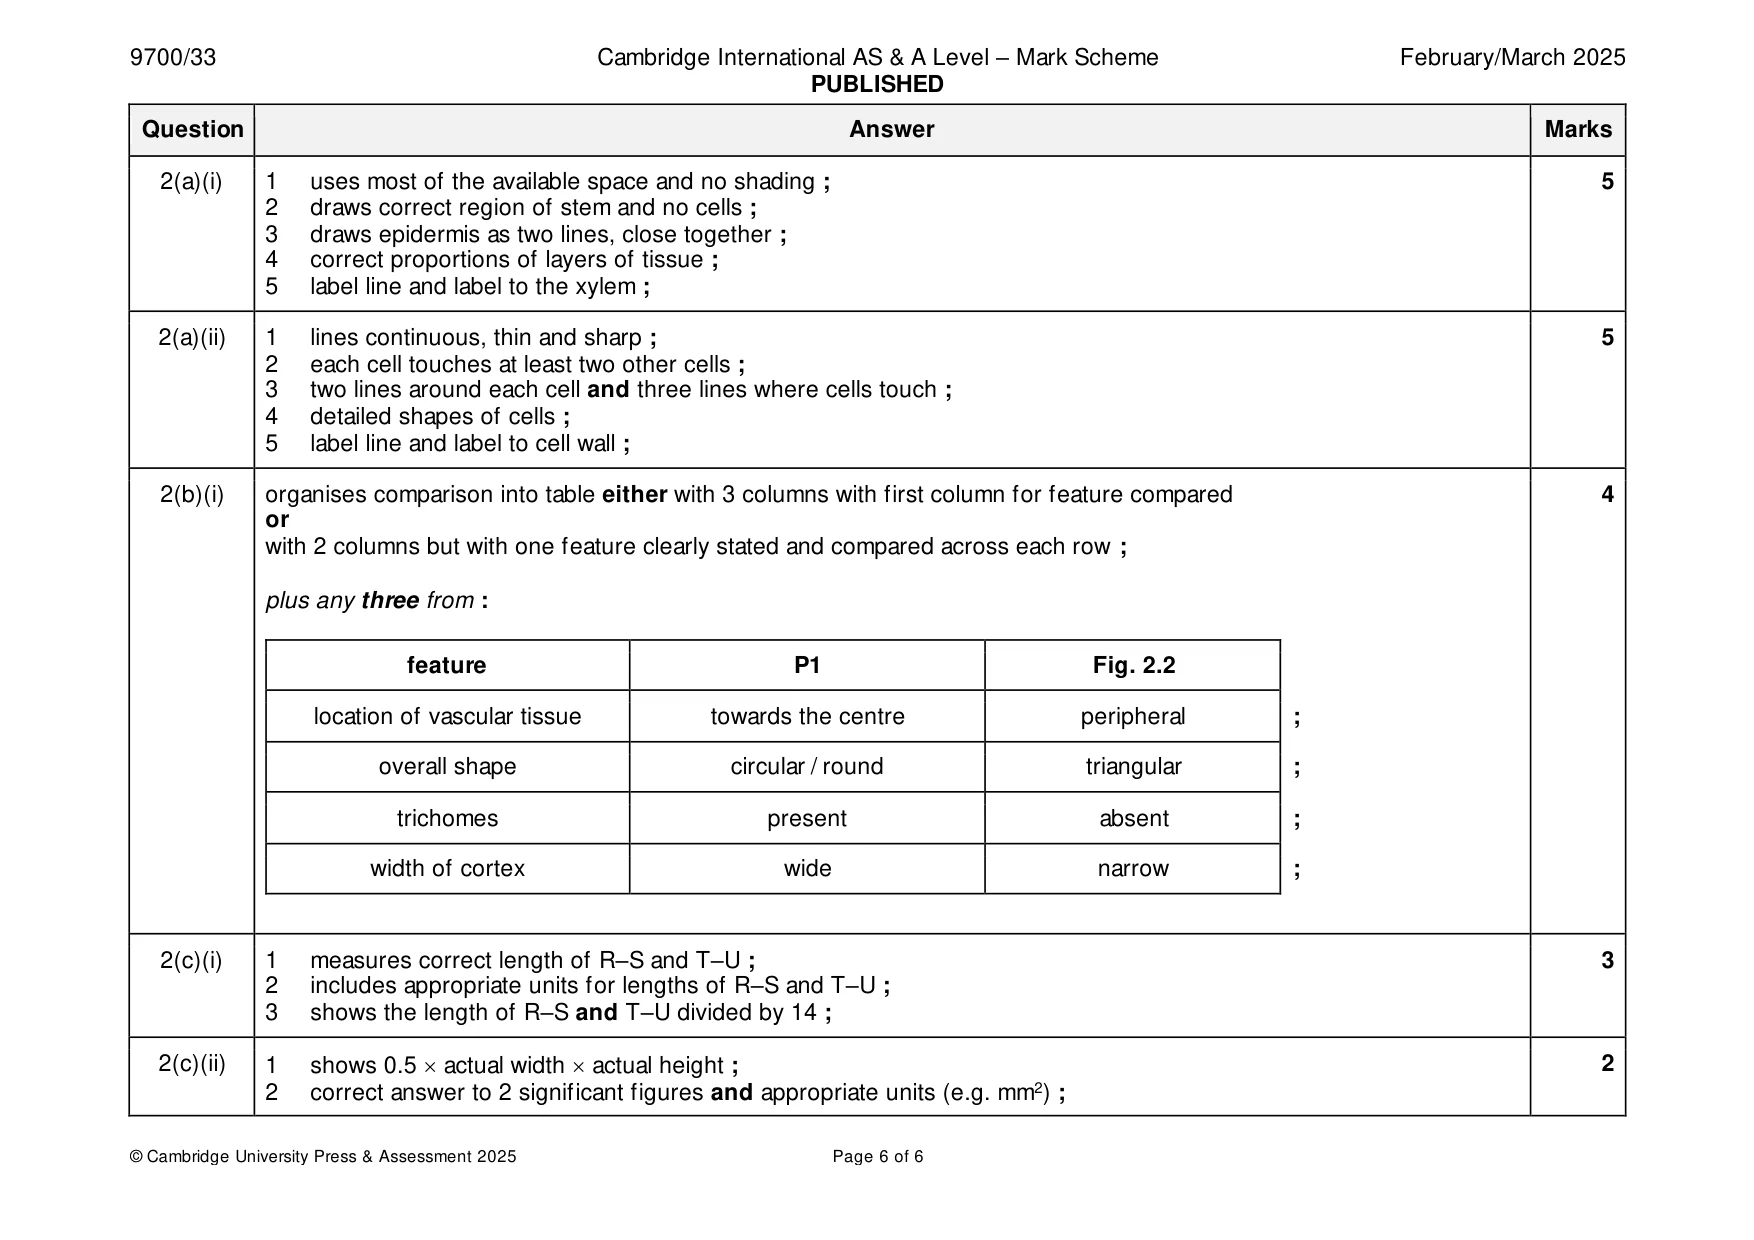
Mark scheme: 2(a)(i) 1 uses most of the available space and no shading ; 5 2 draws correct region of stem and no cells ; 3 draws epidermis as two lines, close together ; 4 correct proportions of layers of tissue ; 5 label line and label to the xylem ; 2(a)(ii) 1 lines continuous, thin and sharp ; 5 2 each cell touches at least two other cells ; 3 two lines around each cell and three lines where cells touch ; 4 detailed shapes of cells ; 5 label line and label to cell wall ; 2(b)(i) organises comparison into table either with 3 columns with first column for feature compared 4 or with 2 columns but with one feature clearly stated and compared across each row ; plus any three from : feature P1 Fig. 2.2 location of vascular tissue towards the centre peripheral ; overall shape circular / round triangular ; trichomes present absent ; width of cortex wide narrow ; 2(c)(i) 1 measures correct length of R–S and T–U ; 3 2 includes appropriate units for lengths of R–S and T–U ; 3 shows the length of R–S and T–U divided by 14 ; 2(c)(ii) 1 shows 0.5 actual width actual height ; 2 2 correct answer to 2 significant figures and appropriate units (e.g. mm2) ;
What was in this paper
The subtopics covered by these 2 questions, and how many questions each got. Open one in a new tab to see every Cambridge question on it.
What you needed in this session
Cambridge’s own grade thresholds for 2025 Feb/March, Paper 3 · Variant 3. A higher threshold means an easier paper — the bar moves with how the cohort did.