Cambridge A Level Biology 9700 — 2023 Feb/March Paper 3 · Variant 3
9700/33/F/M/23 · 2 questions · 40 marks · ≈45 min
The question paper and its mark scheme, free to read here and free to download. This is Cambridge’s own paper, exactly as it was sat.
Question paper16 pages





Mark scheme7 pages
Answers below. Sit the paper first if you are practising.
Questions as text
Q1 · You will investigate the effect of different temperatures on the permeability of the cell…
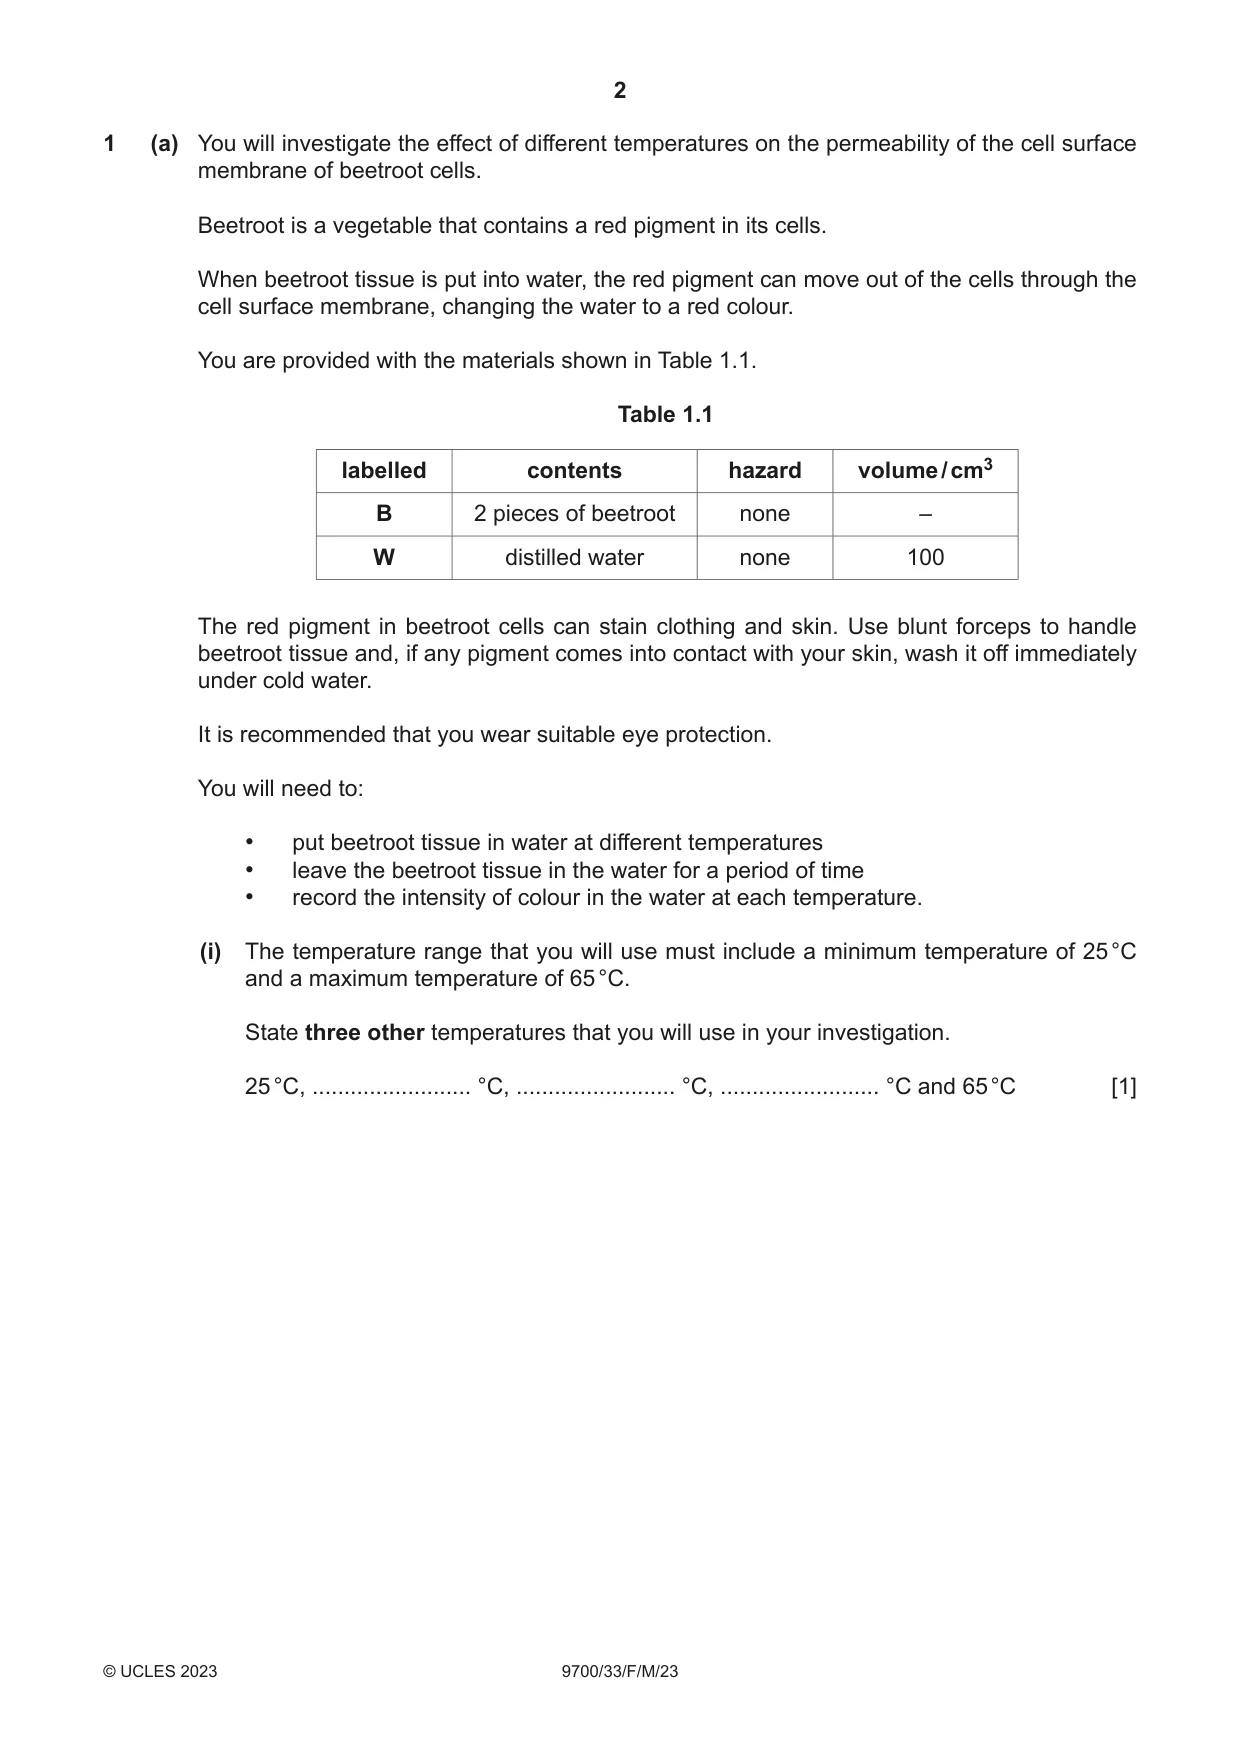
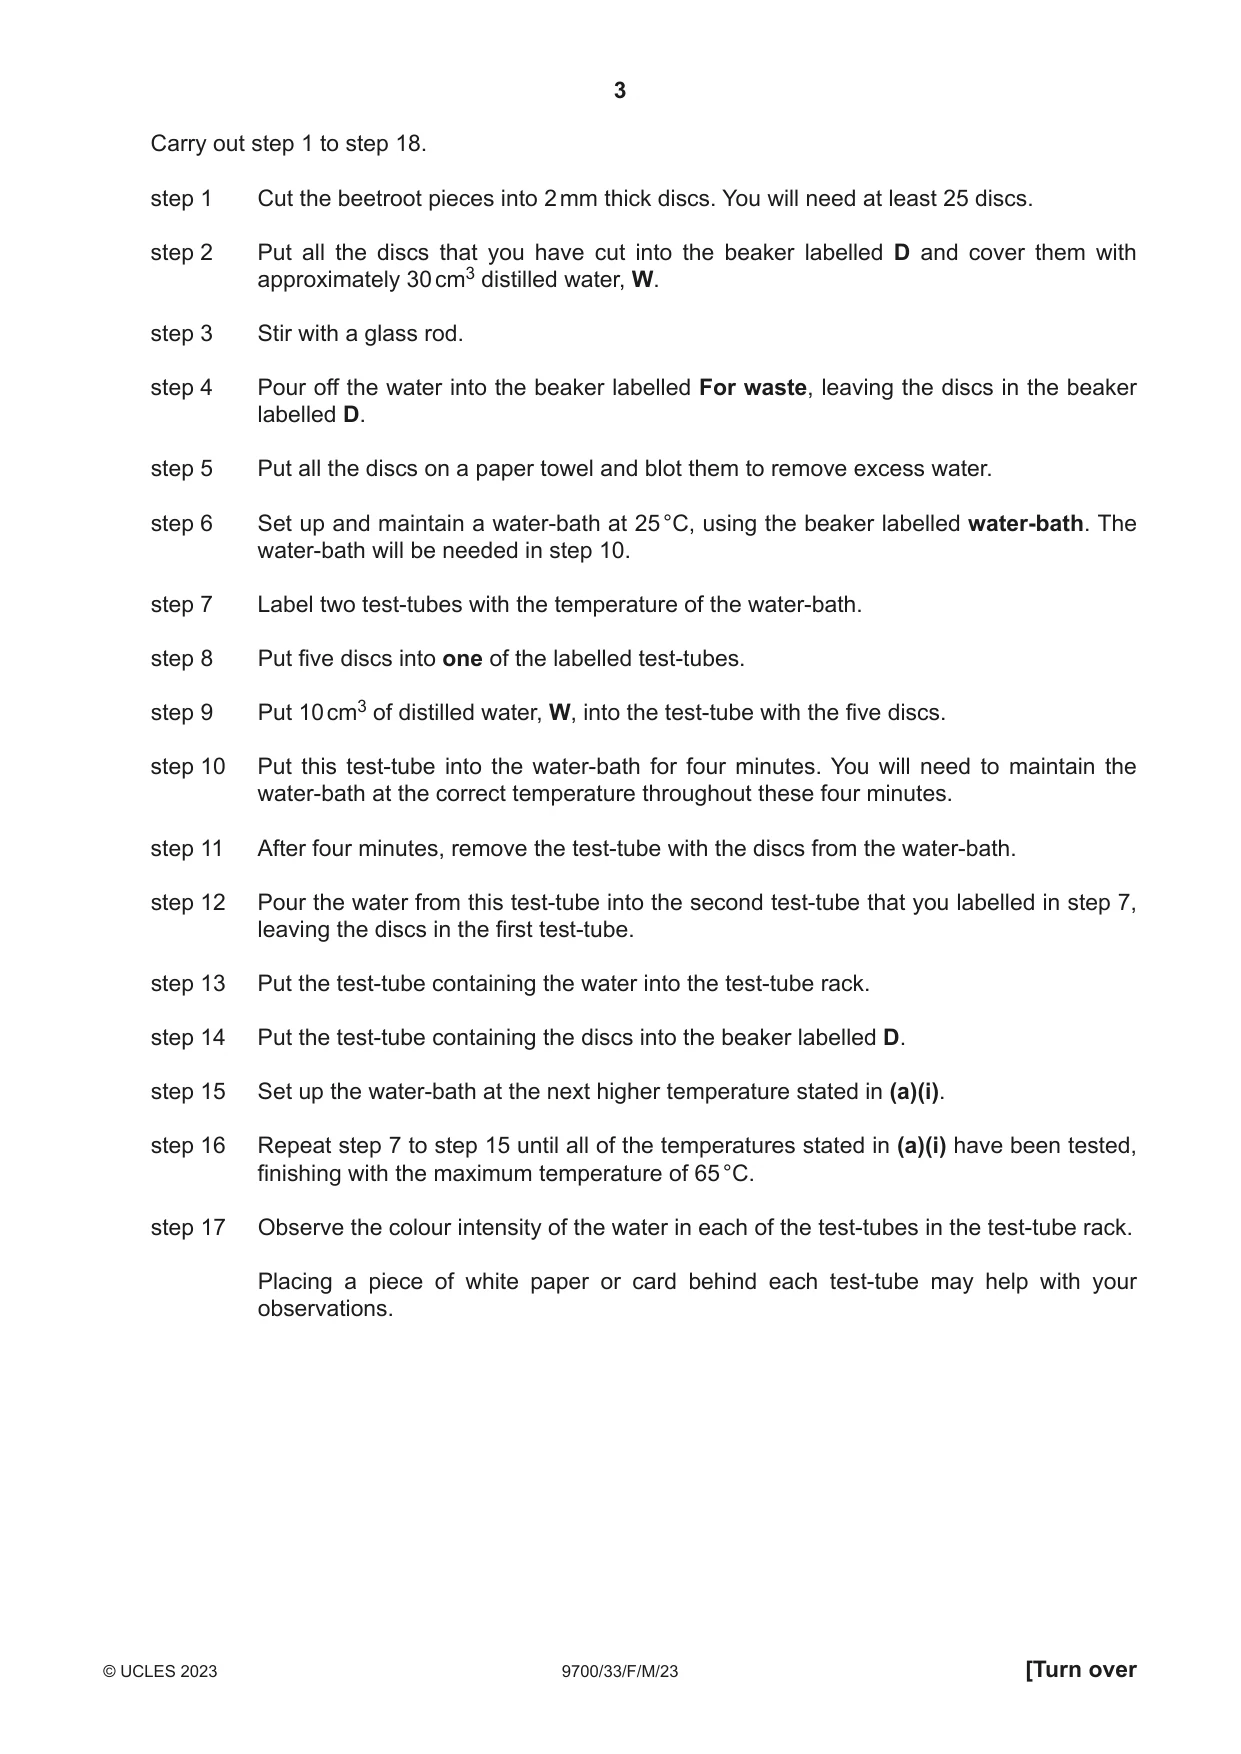
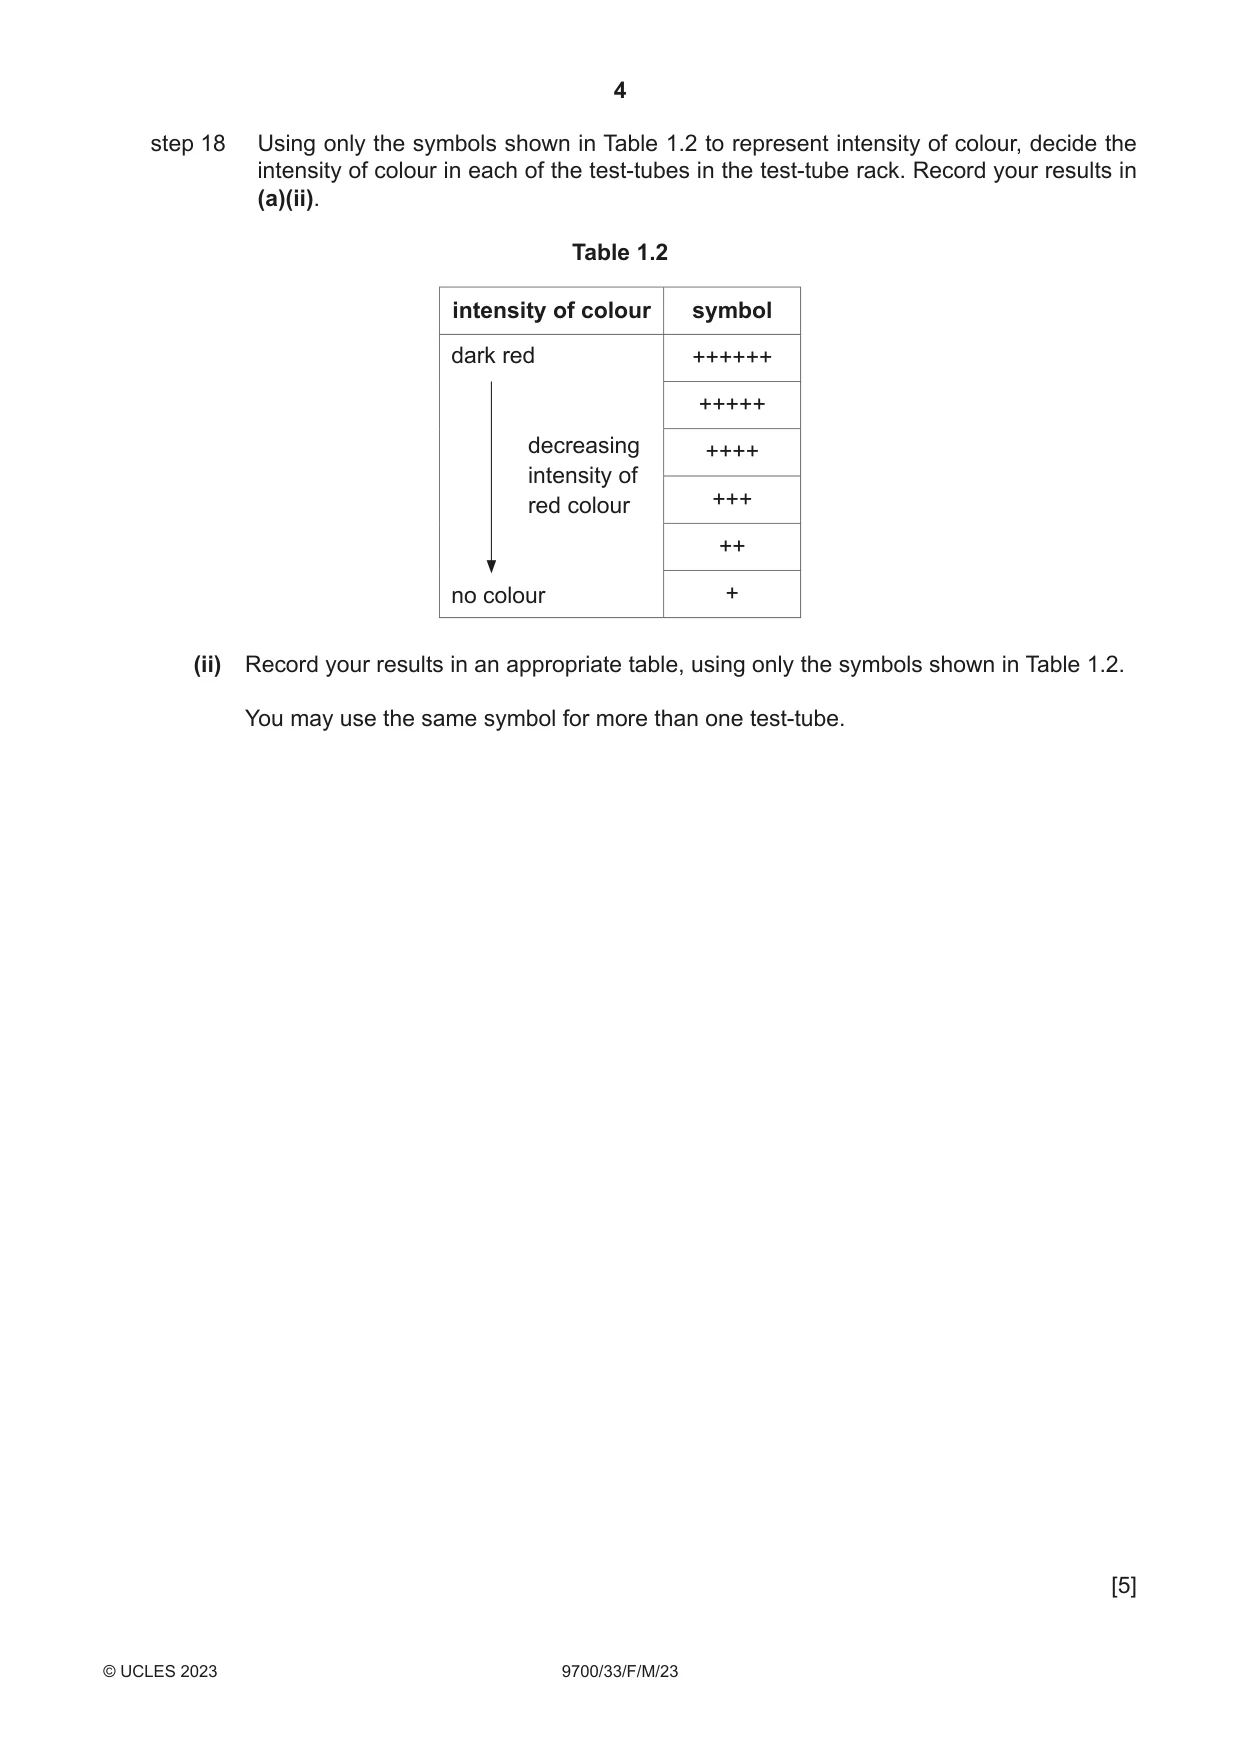
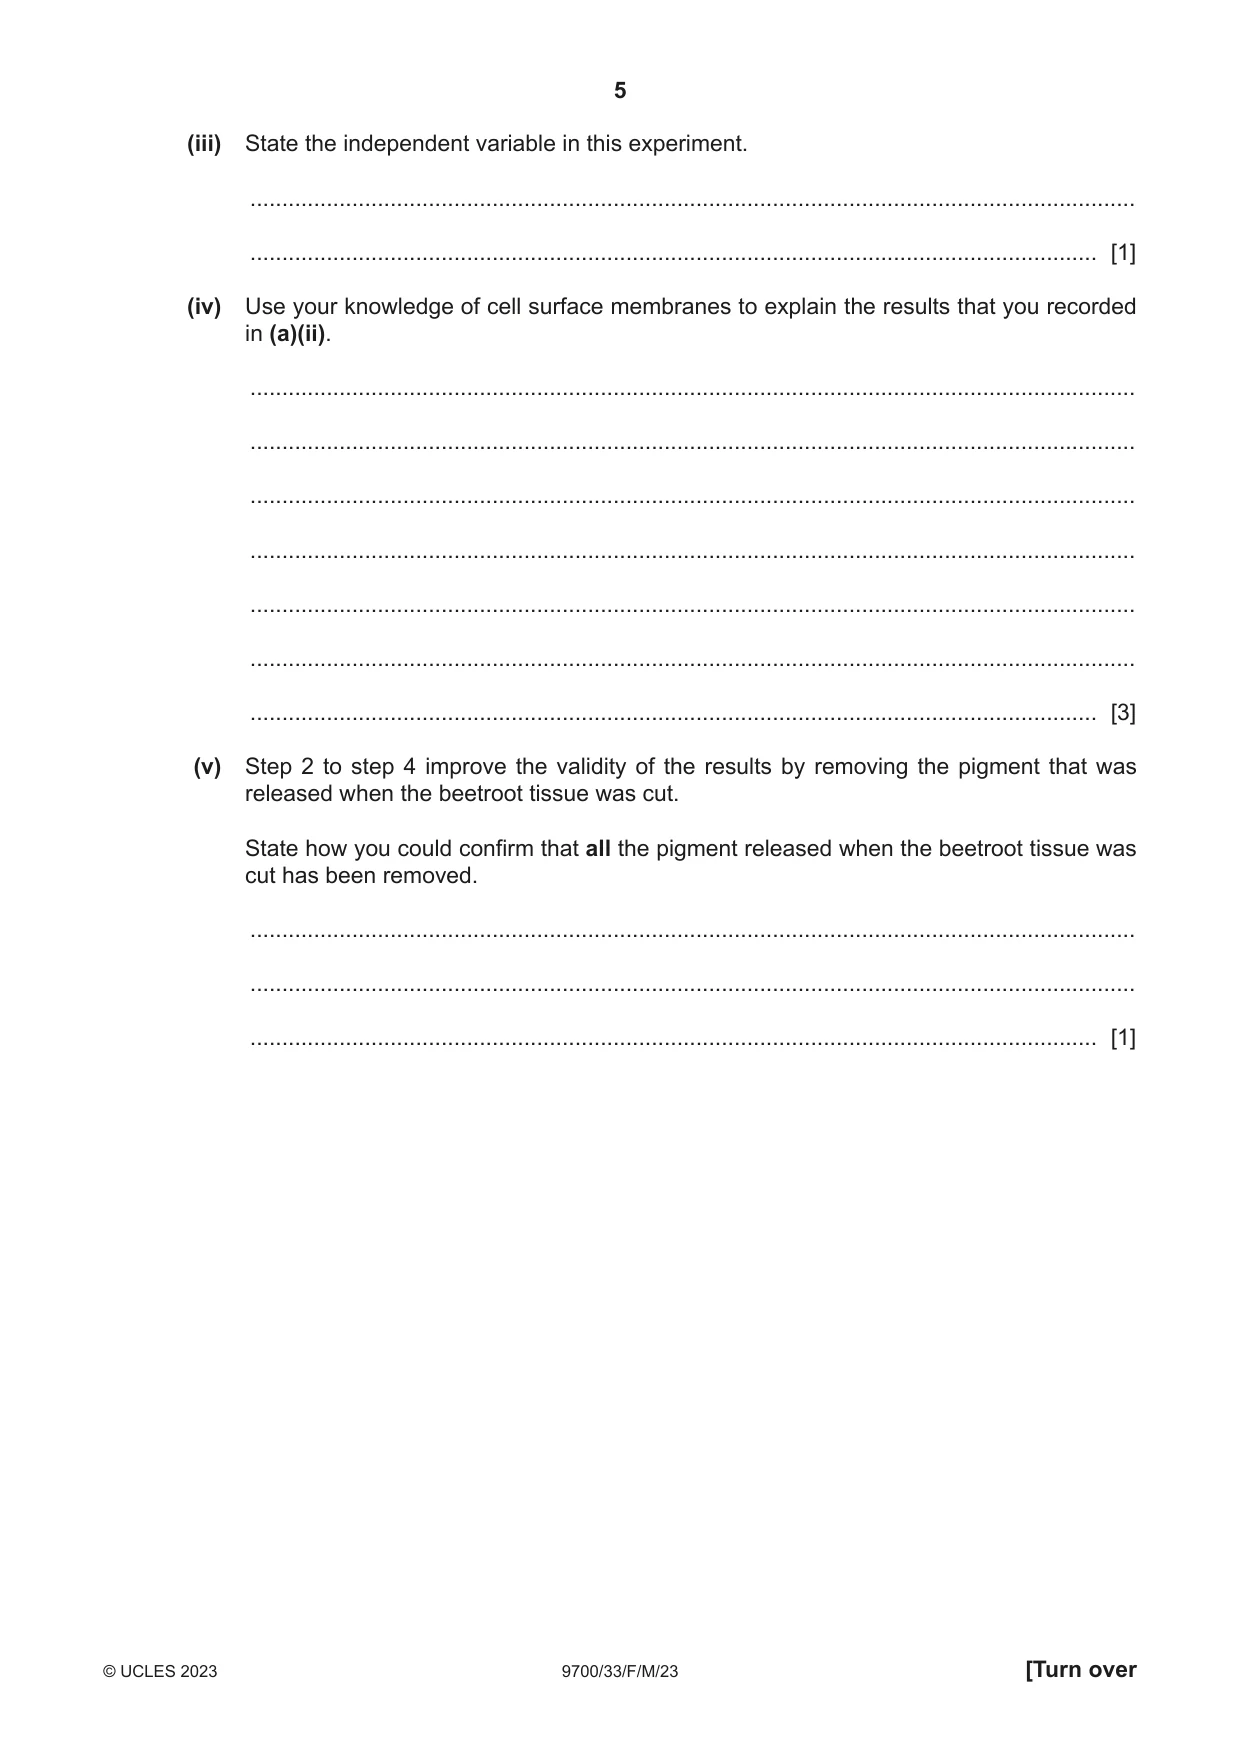
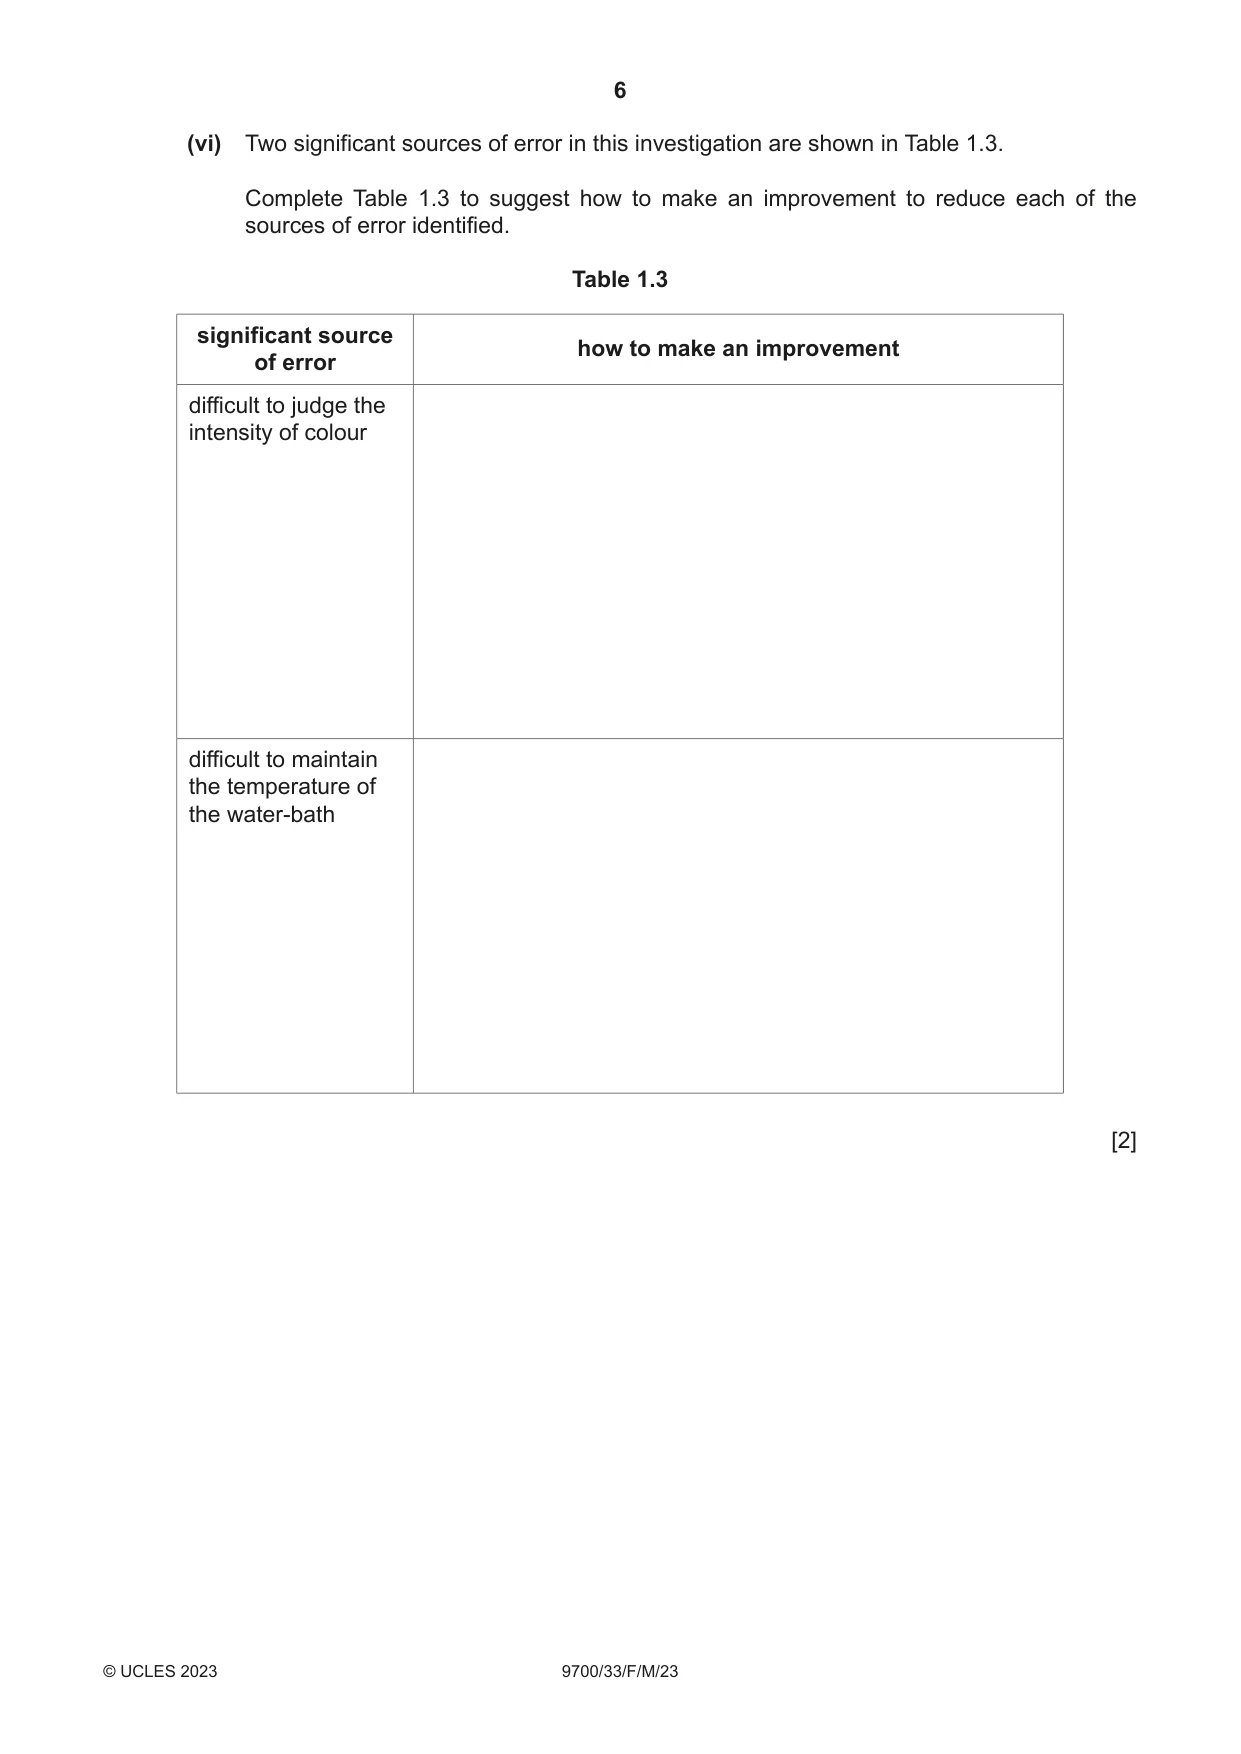
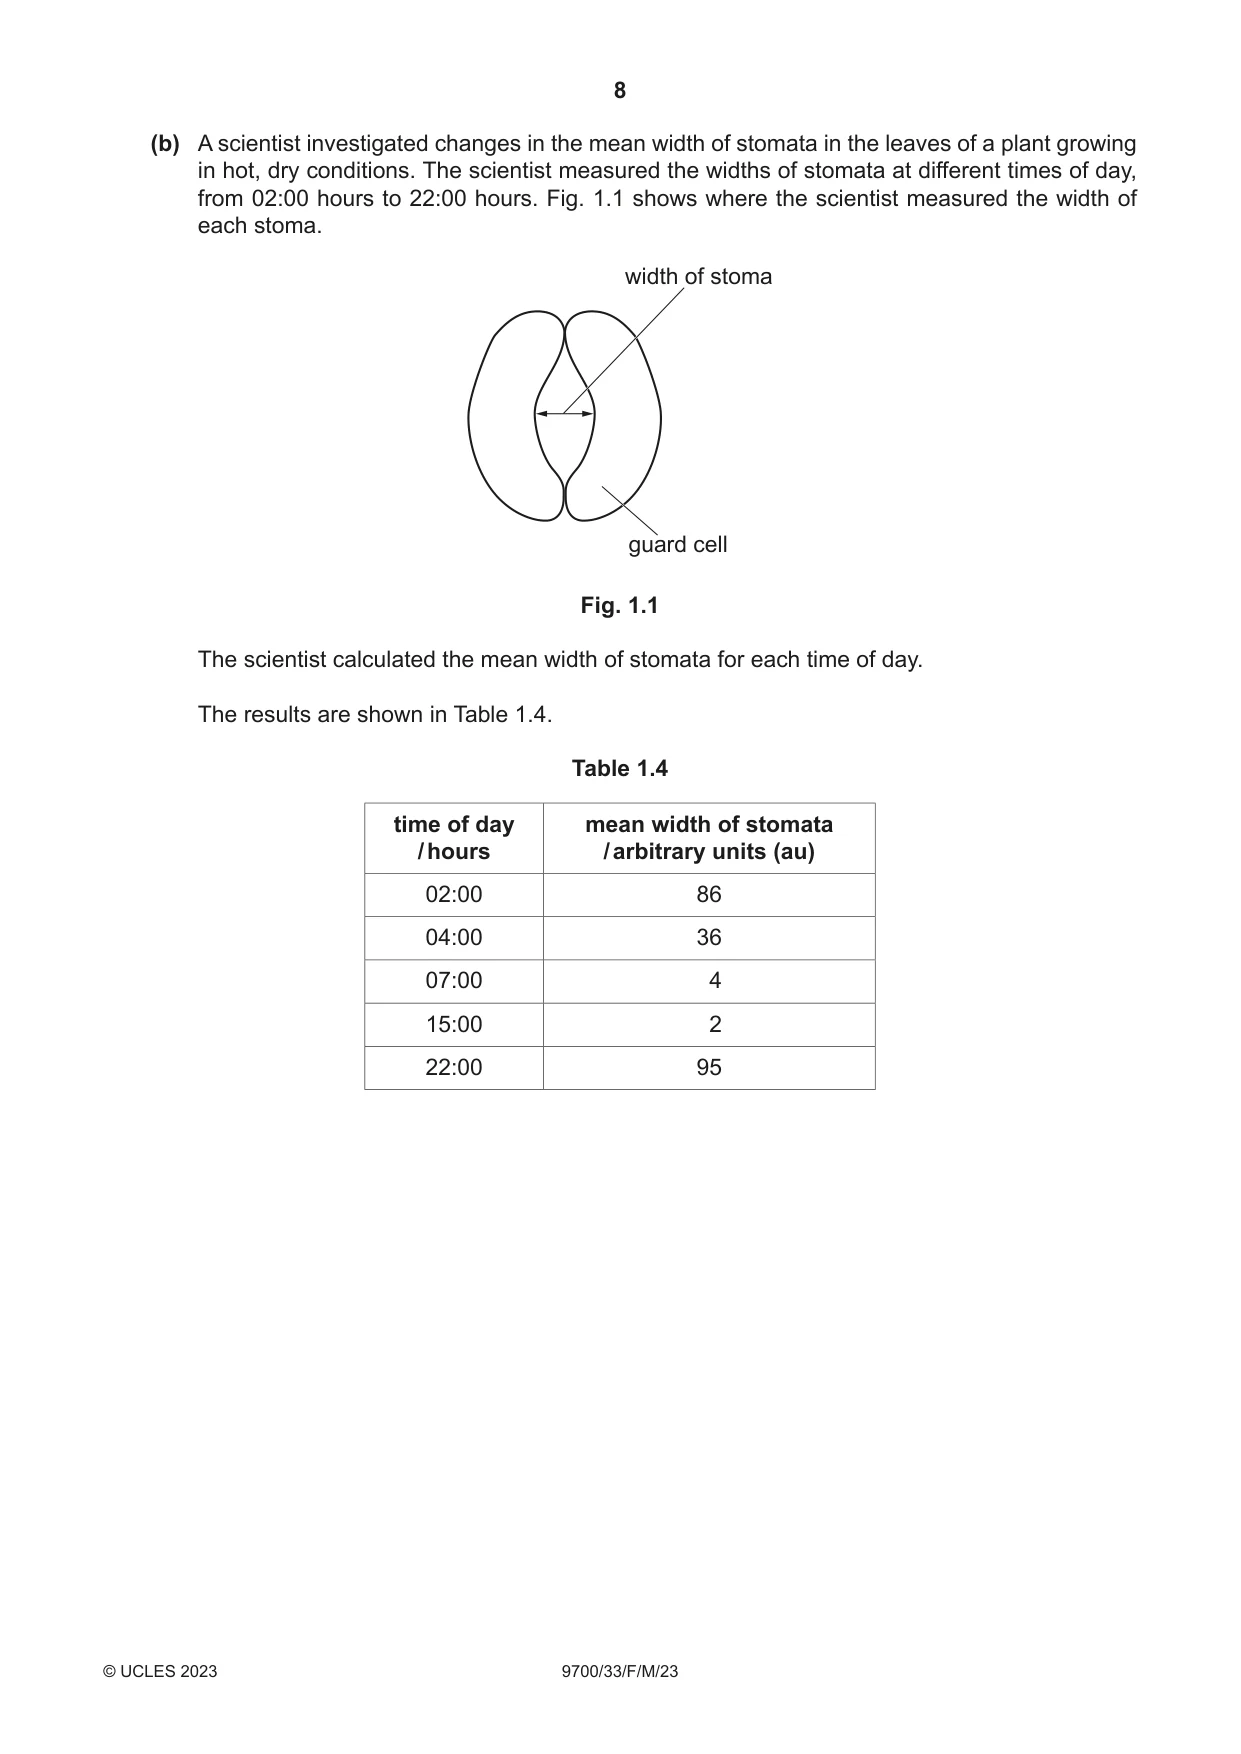
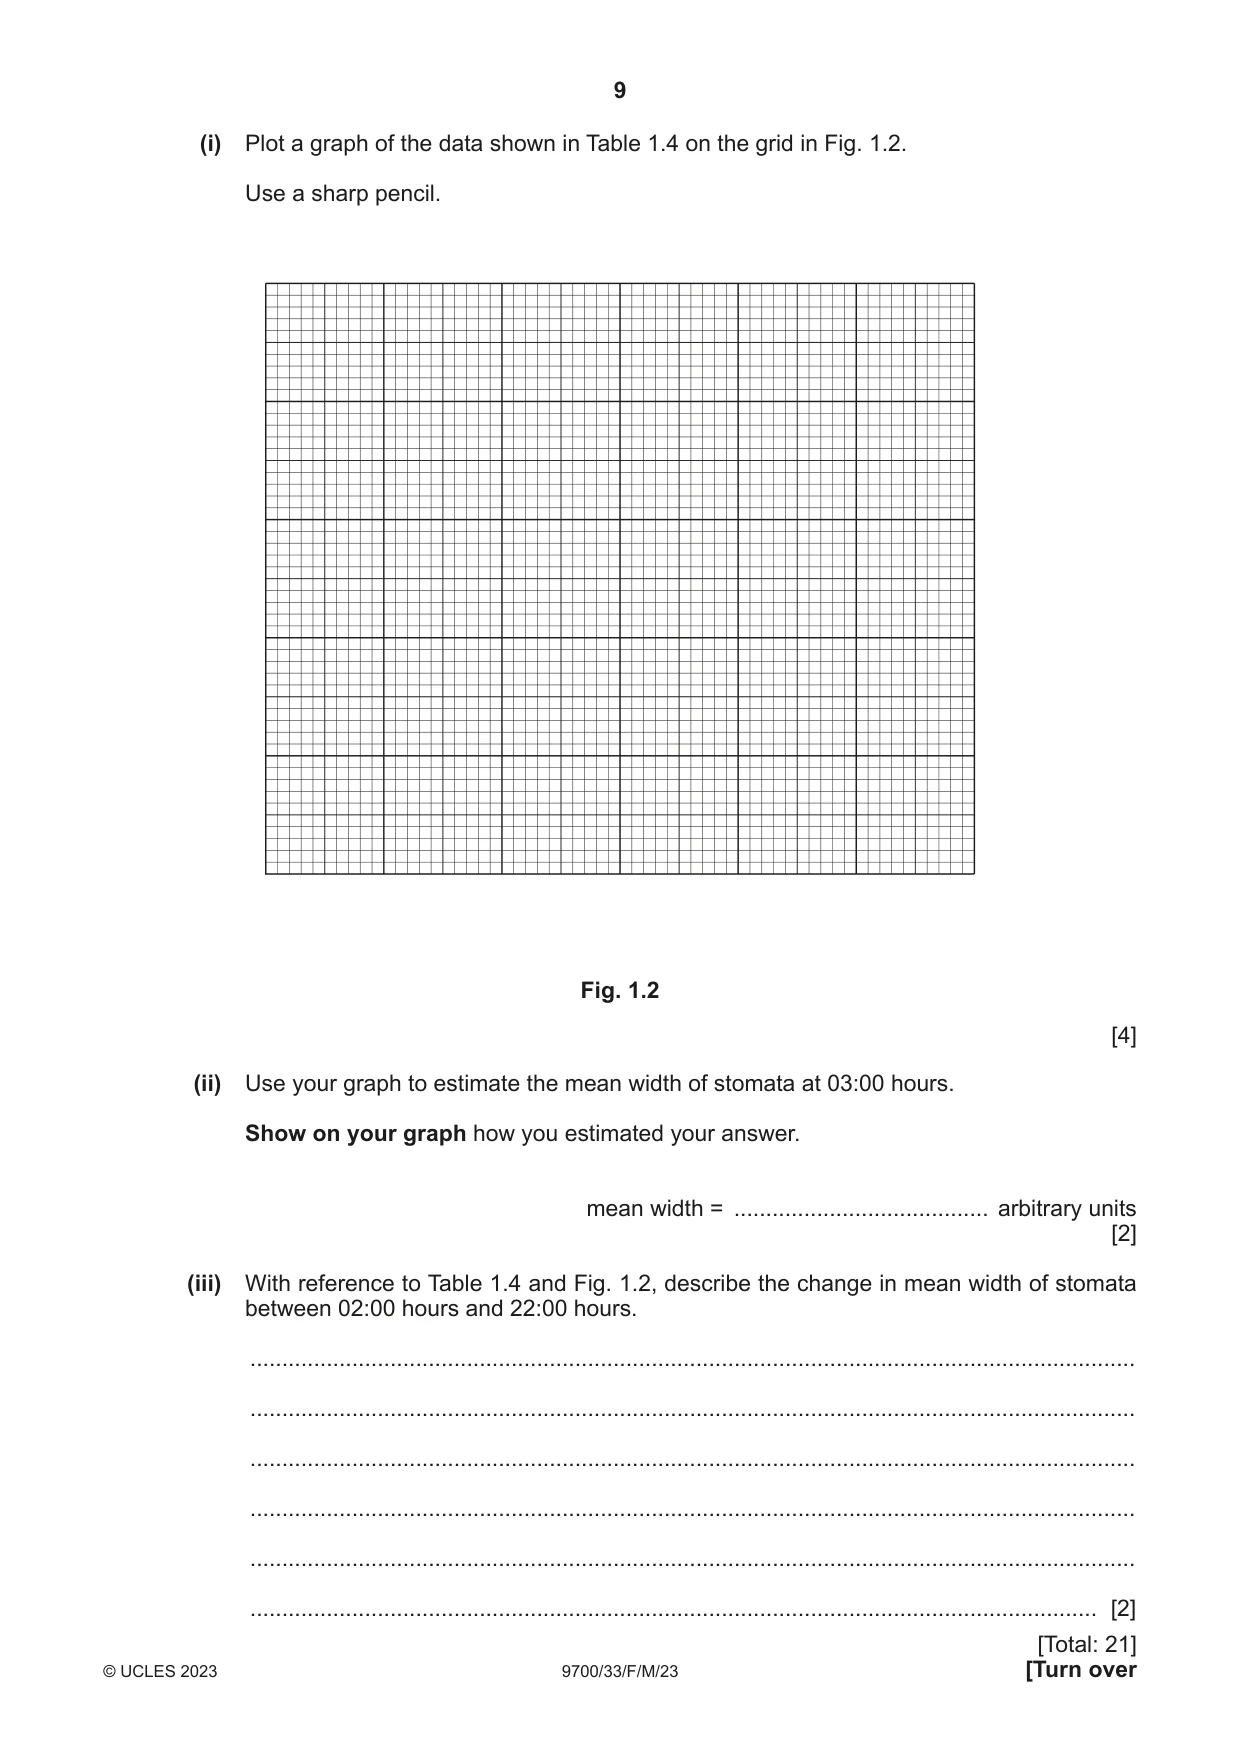
1 (a) You will investigate the effect of different temperatures on the permeability of the cell surface membrane of beetroot cells. Beetroot is a vegetable that contains a red pigment in its cells. When beetroot tissue is put into water, the red pigment can move out of the cells through the cell surface membrane, changing the water to a red colour. You are provided with the materials shown in Table 1.1. Table 1.1 labelled contents hazard volume / cm3 B 2 pieces of beetroot none – W distilled water none 100 The red pigment in beetroot cells can stain clothing and skin. Use blunt forceps to handle beetroot tissue and, if any pigment comes into contact with your skin, wash it off immediately under cold water. It is recommended that you wear suitable eye protection. You will need to: • put beetroot tissue in water at different temperatures • leave the beetroot tissue in the water for a period of time • record the intensity of colour in the water at each temperature. (i) The temperature range that you will use must include a minimum temperature of 25 °C and a maximum temperature of 65 °C. State three other temperatures that you will use in your investigation. 25 °C, ......................... °C, ......................... °C, ......................... °C and 65 °C [1] Carry out step 1 to step 18. step 1 Cut the beetroot pieces into 2 mm thick discs. You will need at least 25 discs. step 2 Put all the discs that you have cut into the beaker labelled D and cover them with approximately 30 cm3 distilled water, W. step 3 Stir with a glass rod. step 4 Pour off the water into the beaker labelled For waste, leaving the discs in the beaker labelled D. step 5 Put all the discs on a paper towel and blot them to remove excess water. step 6 Set up and maintain a water-bath at 25 °C, using the beaker labelled water-bath. The water-bath will be needed in step 10. step 7 Label two test-tubes with the temperature of the water-bath. step 8 Put five discs into one of the labelled test-tubes. step 9 Put 10 cm3 of distilled water, W, into the test-tube with the five discs. step 10 Put this test-tube into the water-bath for four minutes. You will need to maintain the water-bath at the correct temperature throughout these four minutes. step 11 After four minutes, remove the test-tube with the discs from the water-bath. step 12 Pour the water from this test-tube into the second test-tube that you labelled in step 7, leaving the discs in the first test-tube. step 13 Put the test-tube containing the water into the test-tube rack. step 14 Put the test-tube containing the discs into the beaker labelled D. step 15 Set up the water-bath at the next higher temperature stated in (a)(i). step 16 Repeat step 7 to step 15 until all of the temperatures stated in (a)(i) have been tested, finishing with the maximum temperature of 65 °C. step 17 Observe the colour intensity of the water in each of the test-tubes in the test-tube rack. Placing a piece of white paper or card behind each test-tube may help with your observations. step 18 Using only the symbols shown in Table 1.2 to represent intensity of colour, decide the intensity of colour in each of the test-tubes in the test-tube rack. Record your results in (a)(ii). Table 1.2 intensity of colour symbol dark red ++++++ +++++ decreasing ++++ intensity of +++ red colour ++ no colour + (ii) Record your results in an appropriate table, using only the symbols shown in Table 1.2. You may use the same symbol for more than one test-tube. [5] (iii) State the independent variable in this experiment. ........................................................................................................................................... ..................................................................................................................................... [1] (iv) Use your knowledge of cell surface membranes to explain the results that you recorded in (a)(ii). ........................................................................................................................................... ........................................................................................................................................... ........................................................................................................................................... ........................................................................................................................................... ........................................................................................................................................... ........................................................................................................................................... ..................................................................................................................................... [3] (v) Step 2 to step 4 improve the validity of the results by removing the pigment that was released when the beetroot tissue was cut. State how you could confirm that all the pigment released when the beetroot tissue was cut has been removed. ........................................................................................................................................... ........................................................................................................................................... ..................................................................................................................................... [1] (vi) Two significant sources of error in this investigation are shown in Table 1.3. Complete Table 1.3 to suggest how to make an improvement to reduce each of the sources of error identified. Table 1.3 significant source how to make an improvement of error difficult to judge the intensity of colour difficult to maintain the temperature of the water-bath [2] Question 1 continues on page 8. (b) A scientist investigated changes in the mean width of stomata in the leaves of a plant growing in hot, dry conditions. The scientist measured the widths of stomata at different times of day, from 02:00 hours to 22:00 hours. Fig. 1.1 shows where the scientist measured the width of each stoma. width of stoma guard cell Fig. 1.1 The scientist calculated the mean width of stomata for each time of day. The results are shown in Table 1.4. Table 1.4 time of day mean width of stomata / hours / arbitrary units (au) 02:00 86 04:00 36 07:00 4 15:00 2 22:00 95 (i) Plot a graph of the data shown in Table 1.4 on the grid in Fig. 1.2. Use a sharp pencil. Fig. 1.2 [4] (ii) Use your graph to estimate the mean width of stomata at 03:00 hours. Show on your graph how you estimated your answer. mean width = ........................................ arbitrary units [2] (iii) With reference to Table 1.4 and Fig. 1.2, describe the change in mean width of stomata between 02:00 hours and 22:00 hours. ........................................................................................................................................... ........................................................................................................................................... ........................................................................................................................................... ........................................................................................................................................... ........................................................................................................................................... ..................................................................................................................................... [2]
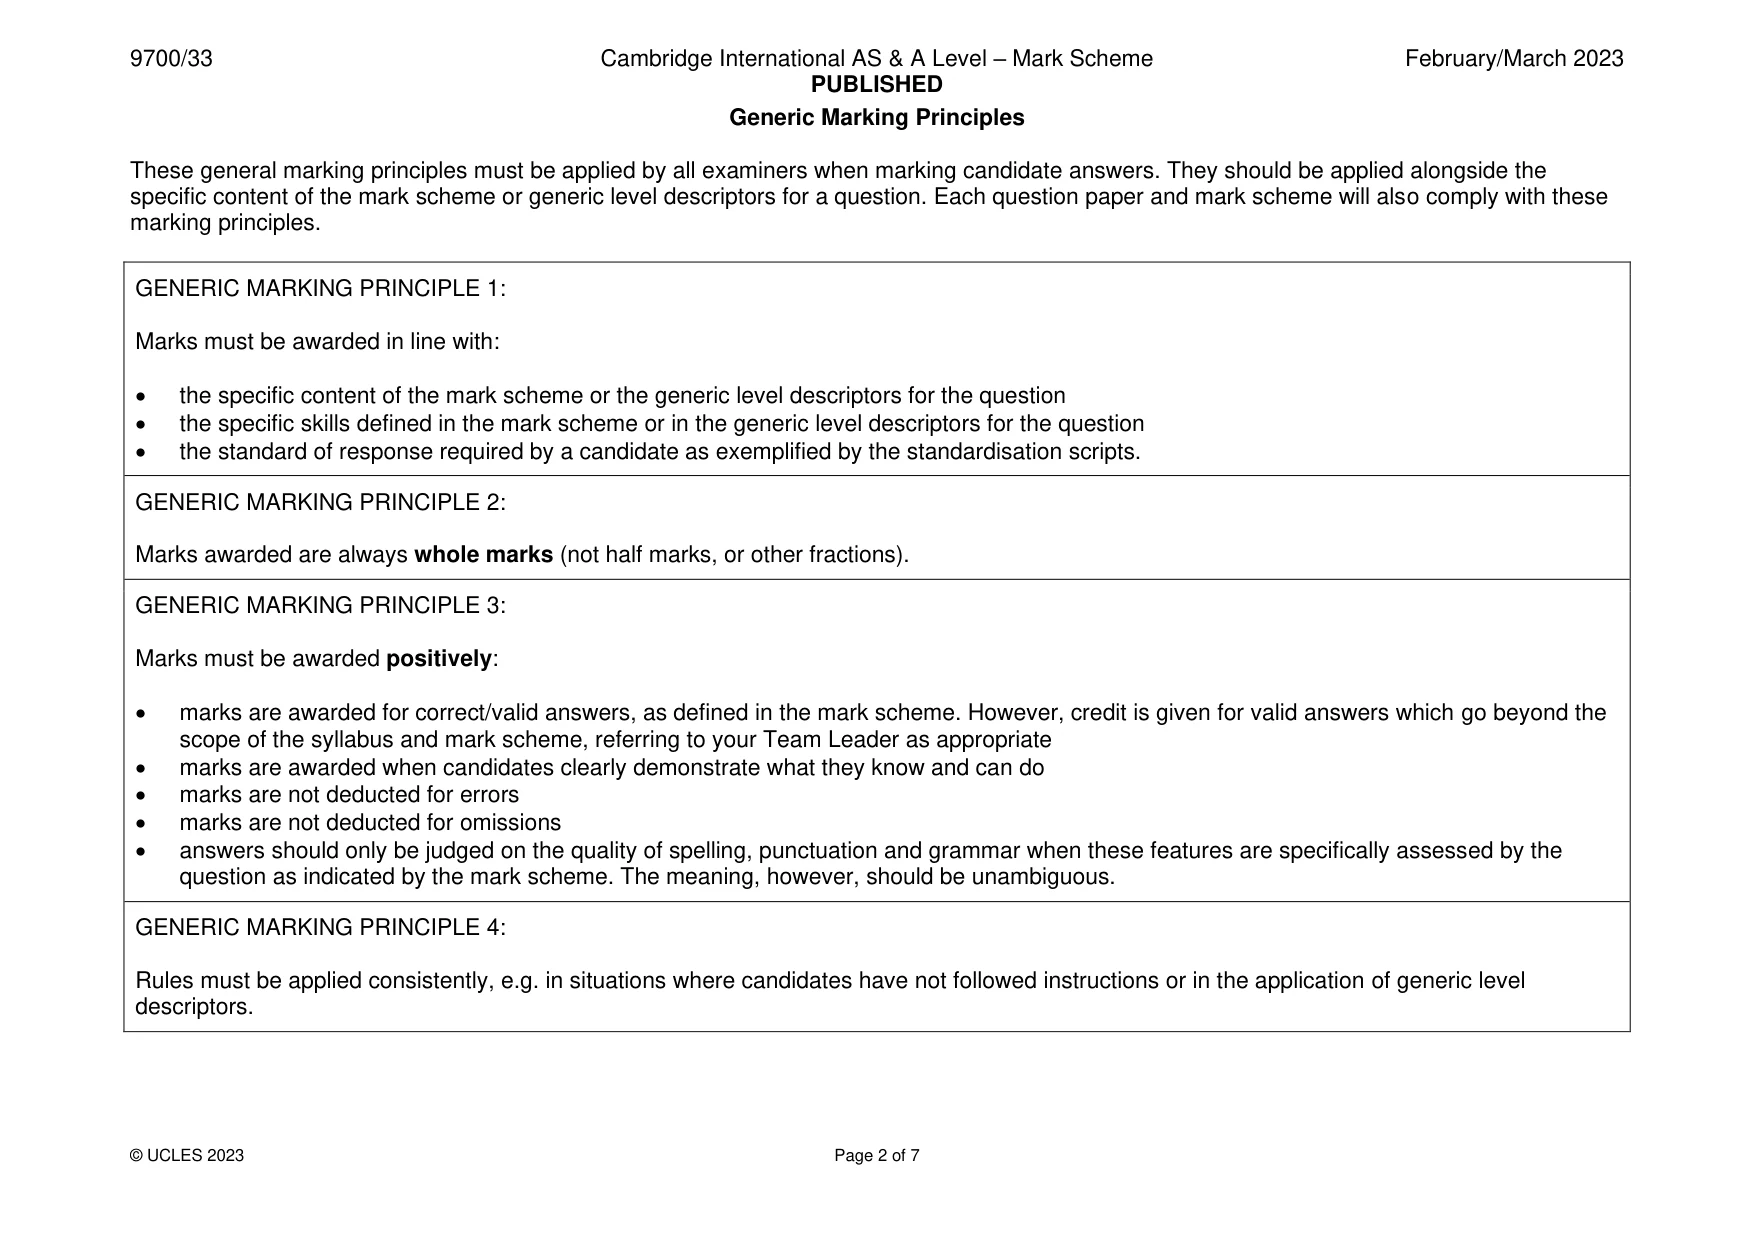
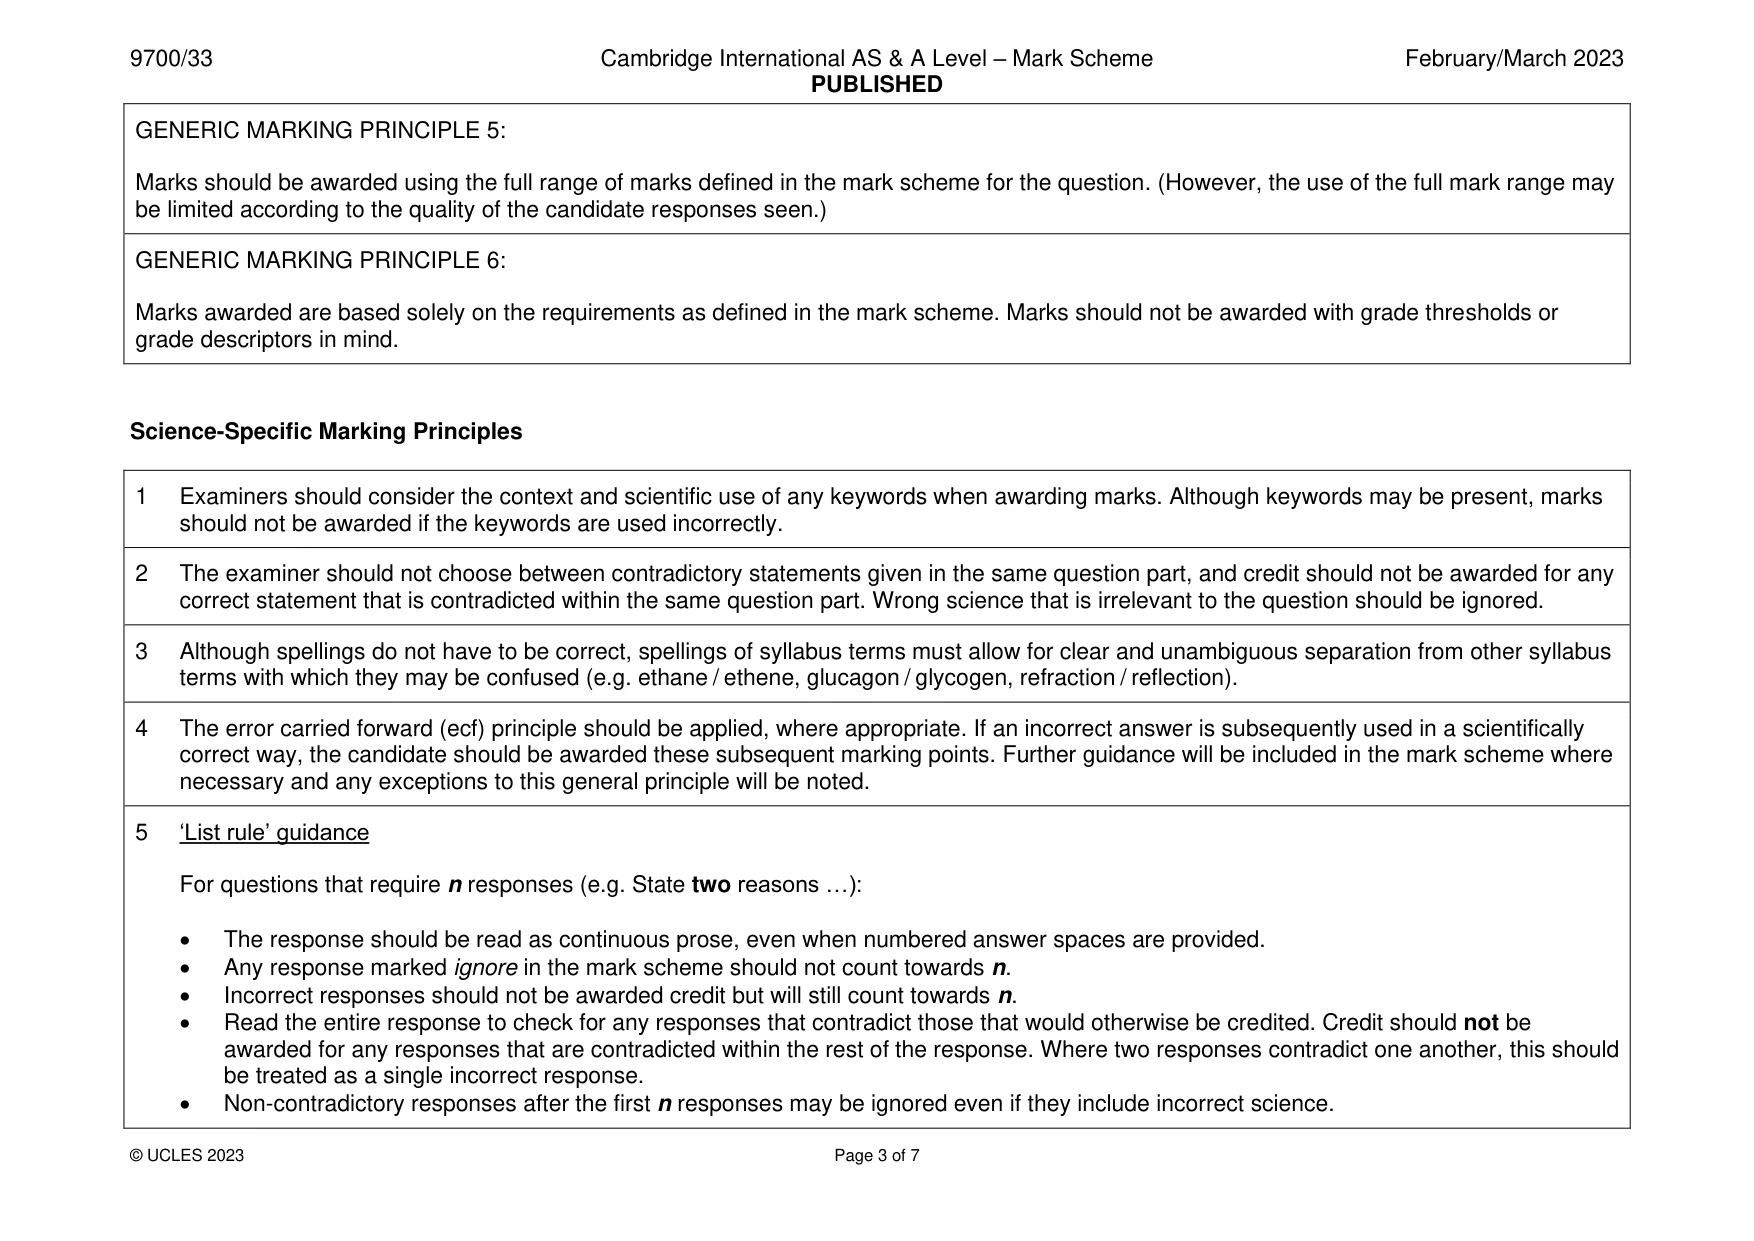
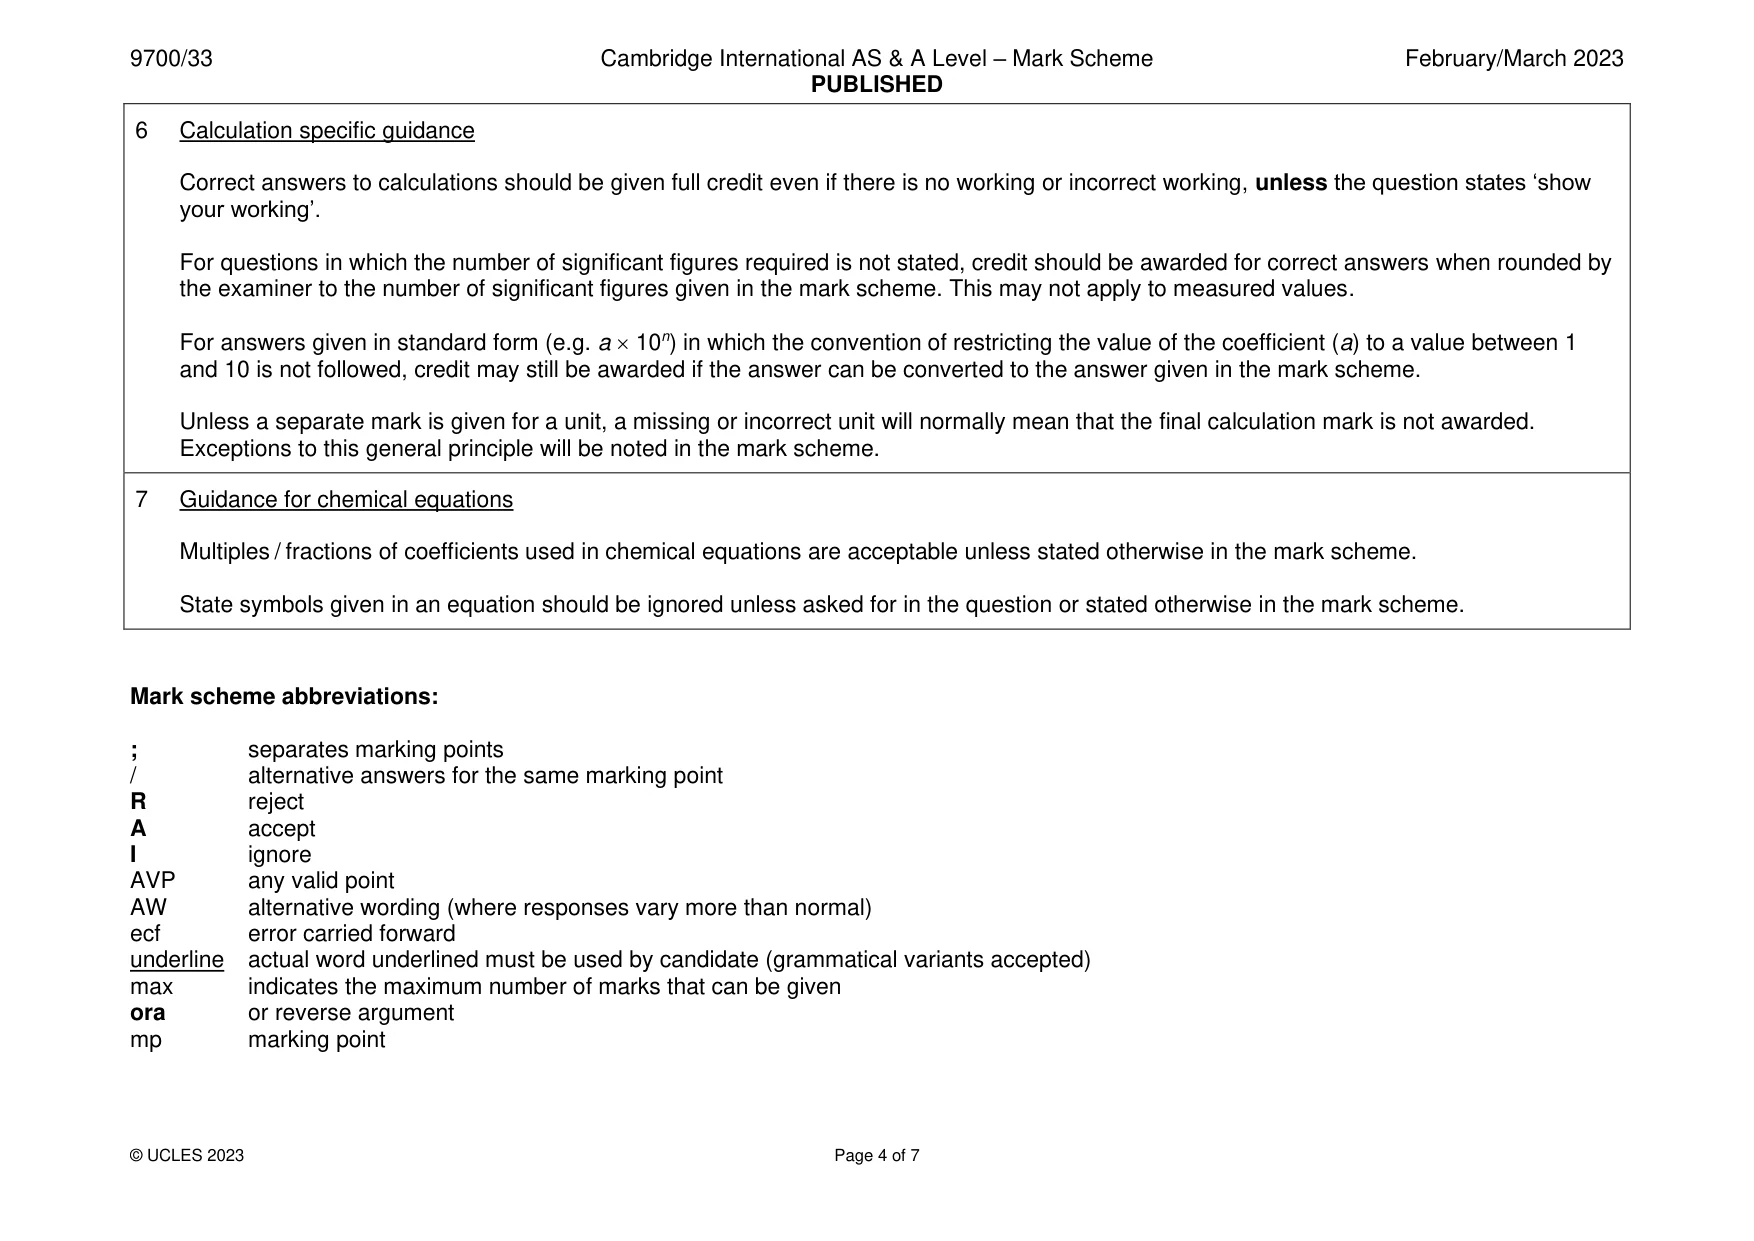
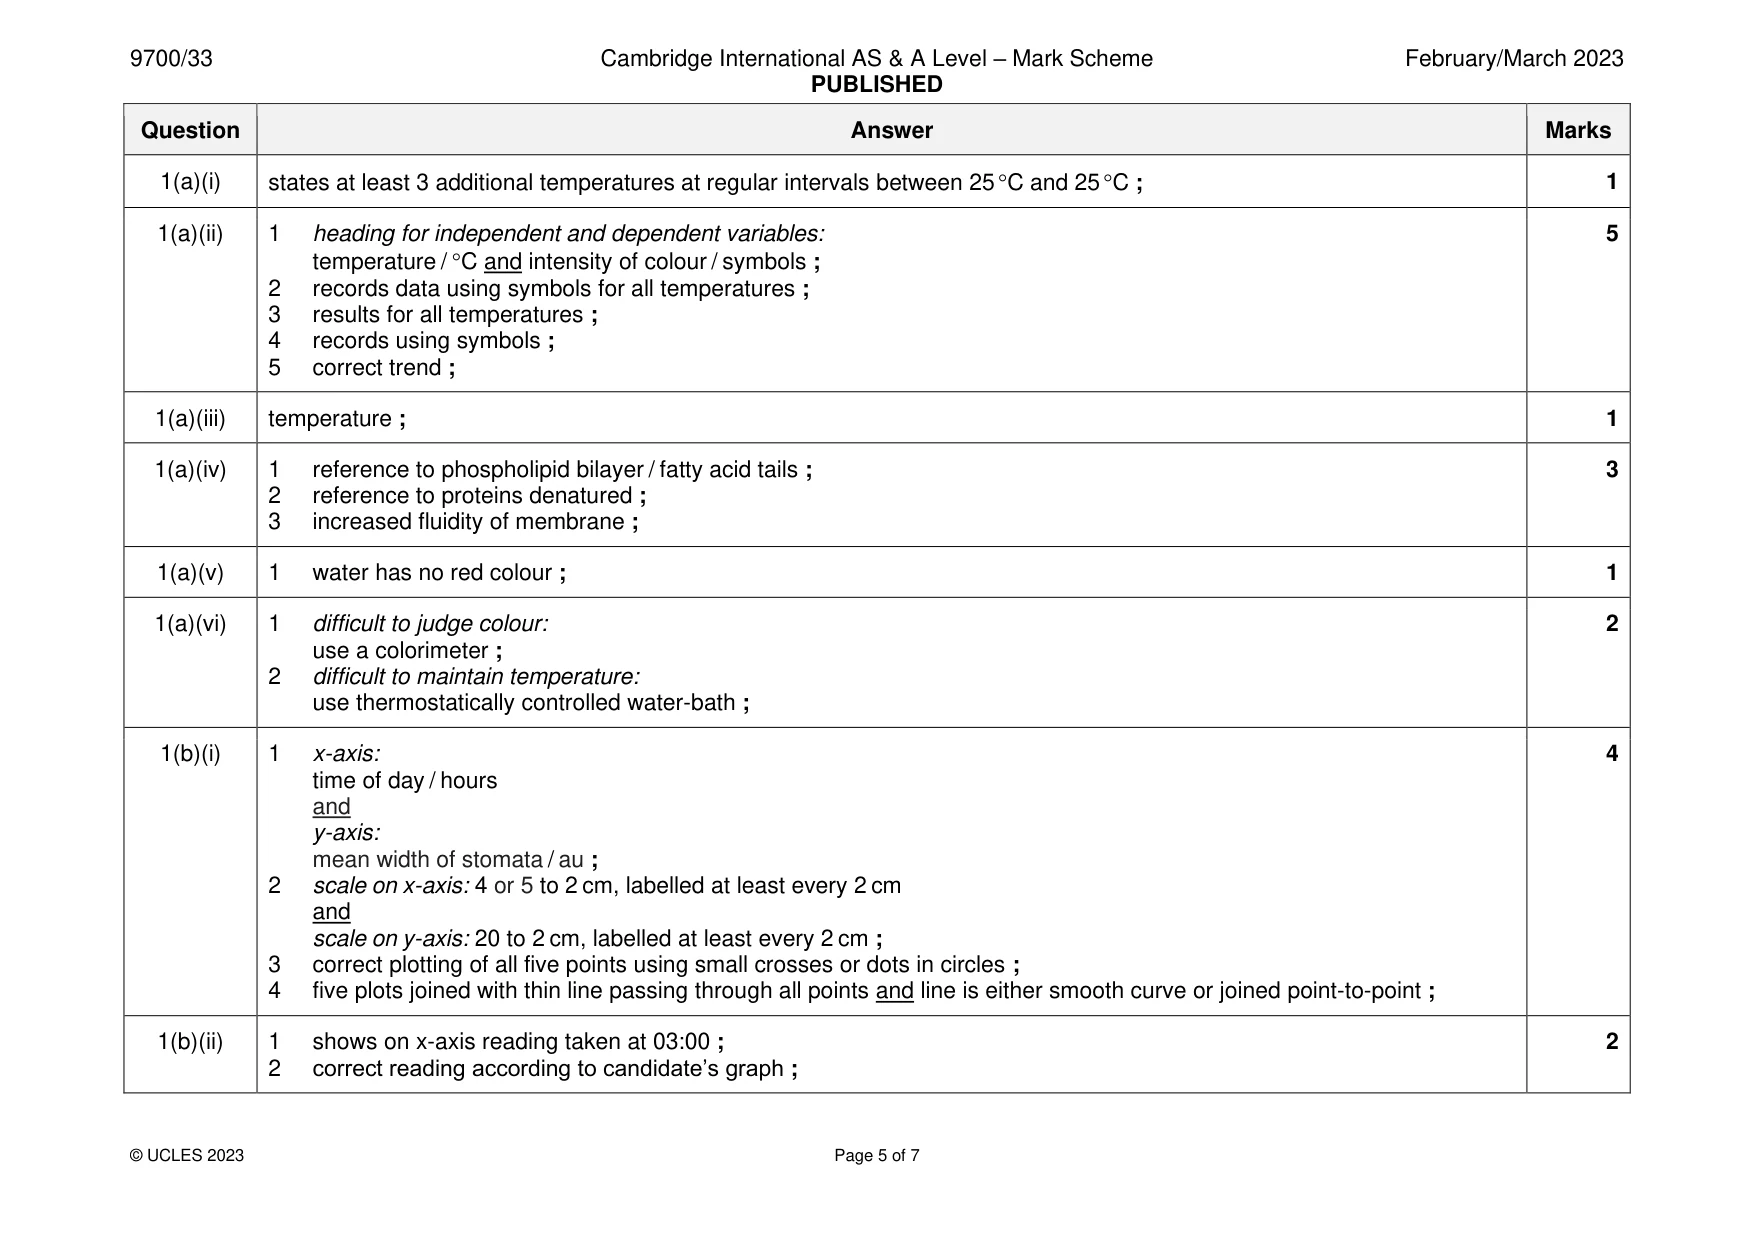
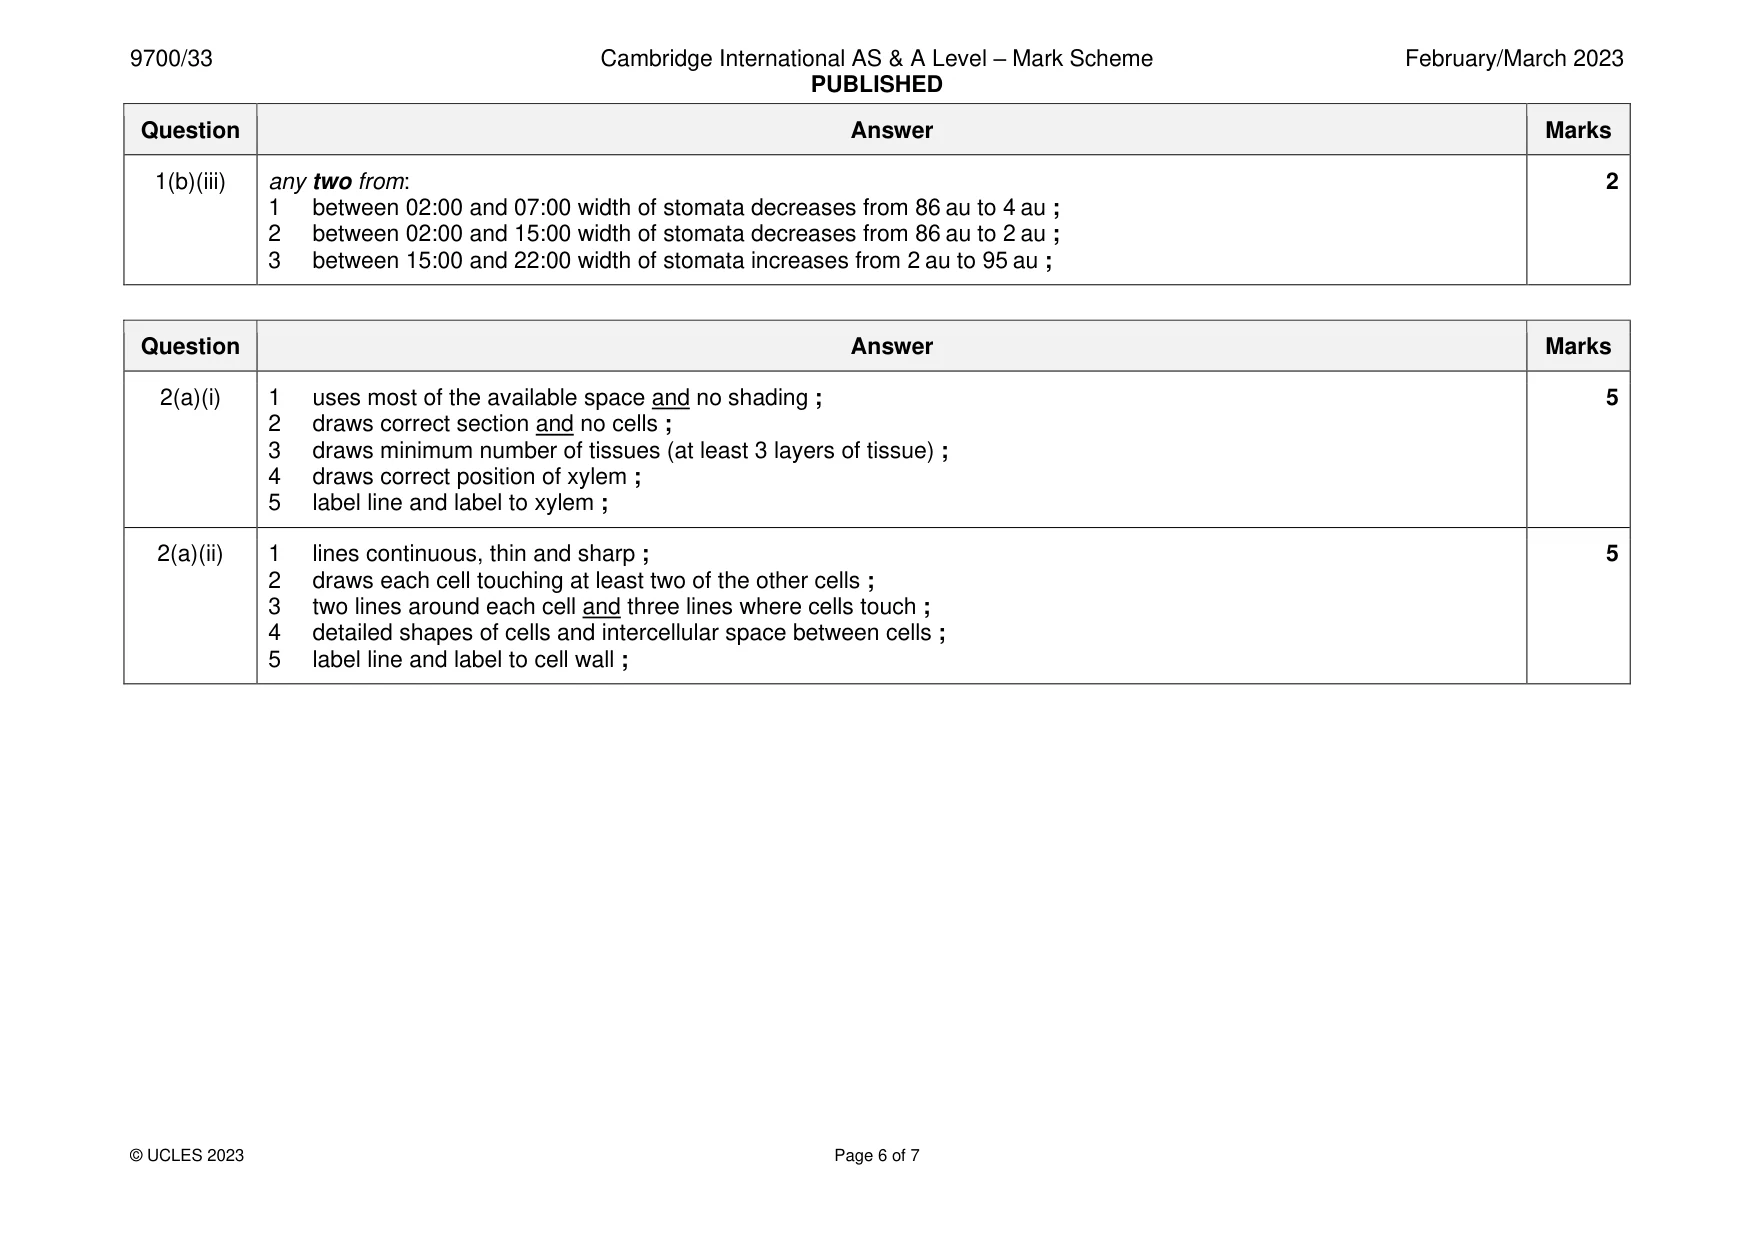
Mark scheme: Question Answer Marks 1(a)(i) states at least 3 additional temperatures at regular intervals between 25 C and 25 C ; 1 1(a)(ii) 1 heading for independent and dependent variables: 5 temperature / C and intensity of colour / symbols ; 2 records data using symbols for all temperatures ; 3 results for all temperatures ; 4 records using symbols ; 5 correct trend ; 1(a)(iii) temperature ; 1 1(a)(iv) 1 reference to phospholipid bilayer / fatty acid tails ; 3 2 reference to proteins denatured ; 3 increased fluidity of membrane ; 1(a)(v) 1 water has no red colour ; 1 1(a)(vi) 1 difficult to judge colour: 2 use a colorimeter ; 2 difficult to maintain temperature: use thermostatically controlled water-bath ; 1(b)(i) 1 x-axis: 4 time of day / hours and y-axis: mean width of stomata / au ; 2 scale on x-axis: 4 or 5 to 2 cm, labelled at least every 2 cm and scale on y-axis: 20 to 2 cm, labelled at least every 2 cm ; 3 correct plotting of all five points using small crosses or dots in circles ; 4 five plots joined with thin line passing through all points and line is either smooth curve or joined point-to-point ; 1(b)(ii) 1 shows on x-axis reading taken at 03:00 ; 2 2 correct reading according to candidate’s graph ; 1(b)(iii) any two from: 2 1 between 02:00 and 07:00 width of stomata decreases from 86 au to 4 au ; 2 between 02:00 and 15:00 width of stomata decreases from 86 au to 2 au ; 3 between 15:00 and 22:00 width of stomata increases from 2 au to 95 au ;
Q2 · P1 is a slide of a stained transverse section through a plant root
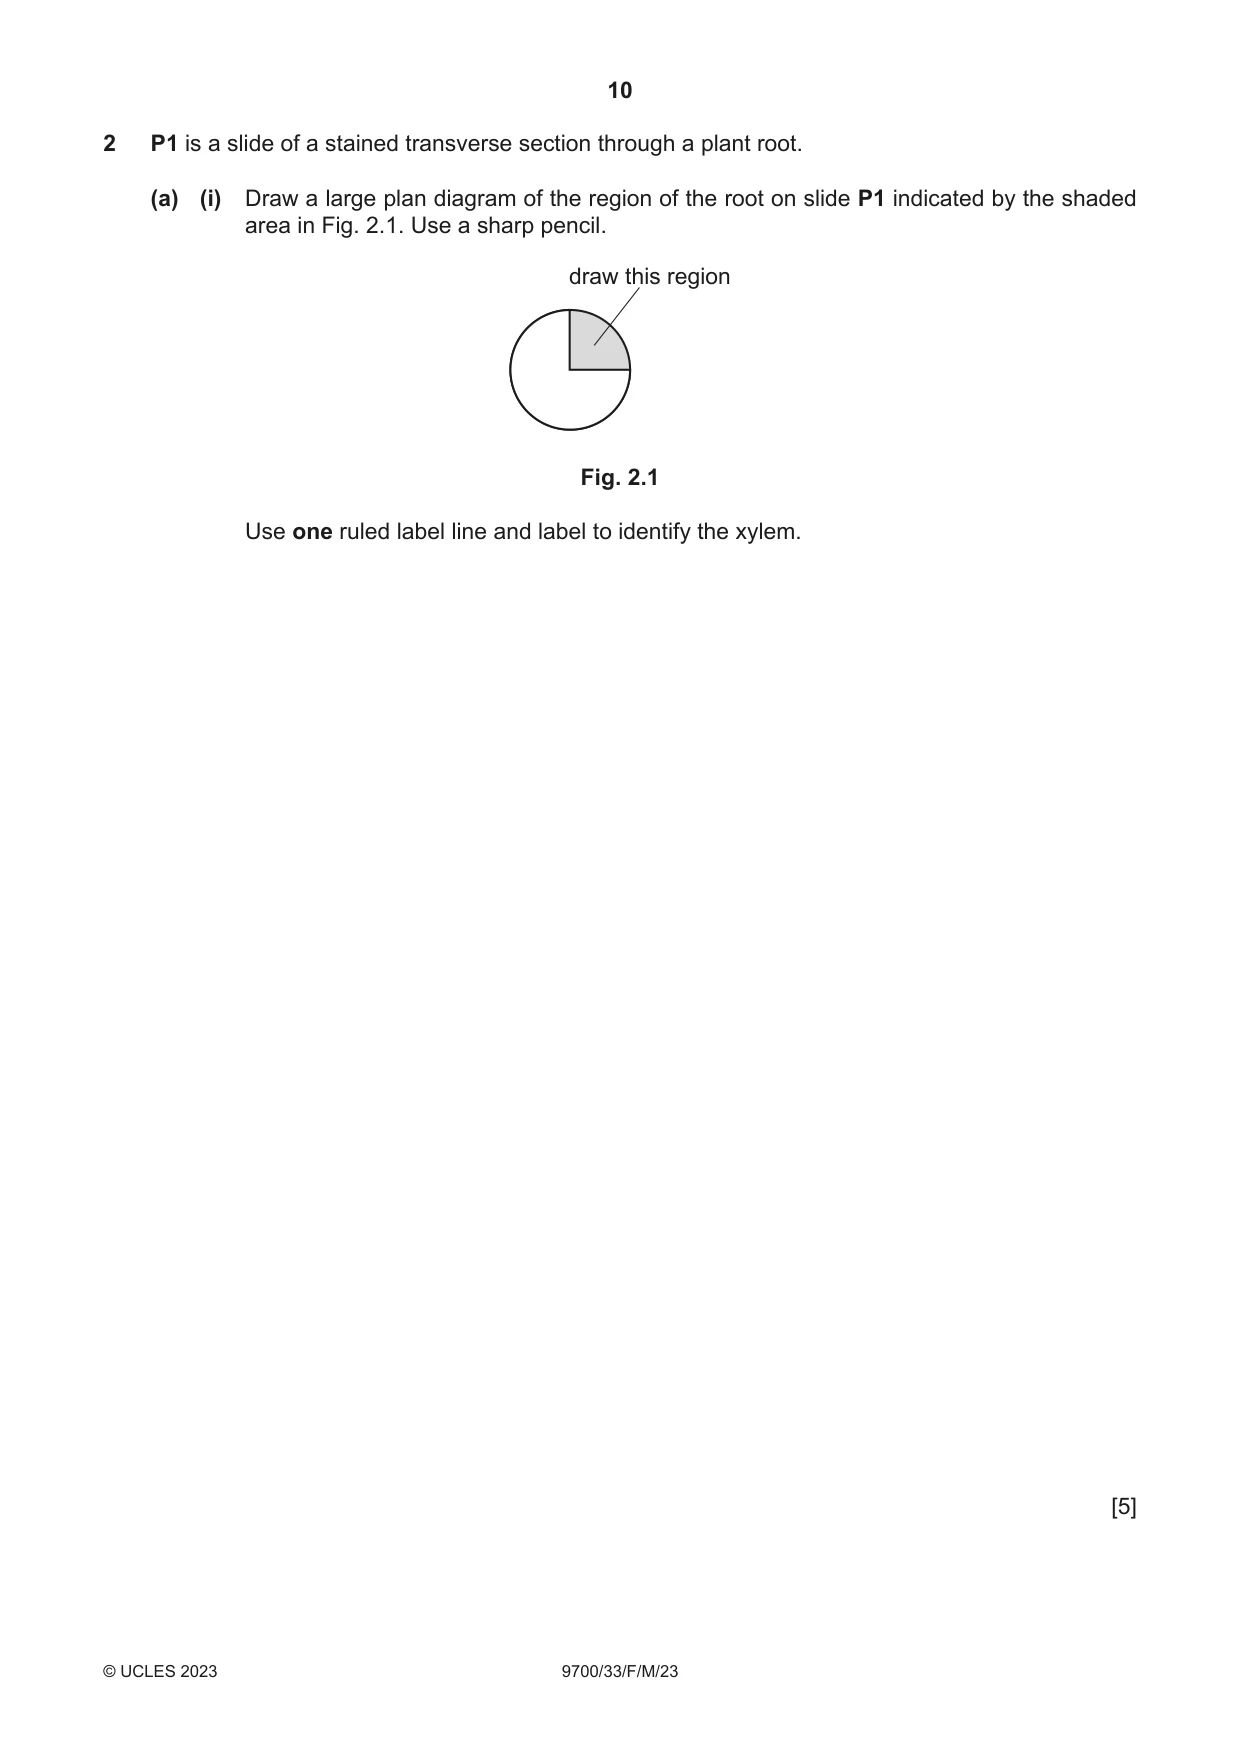
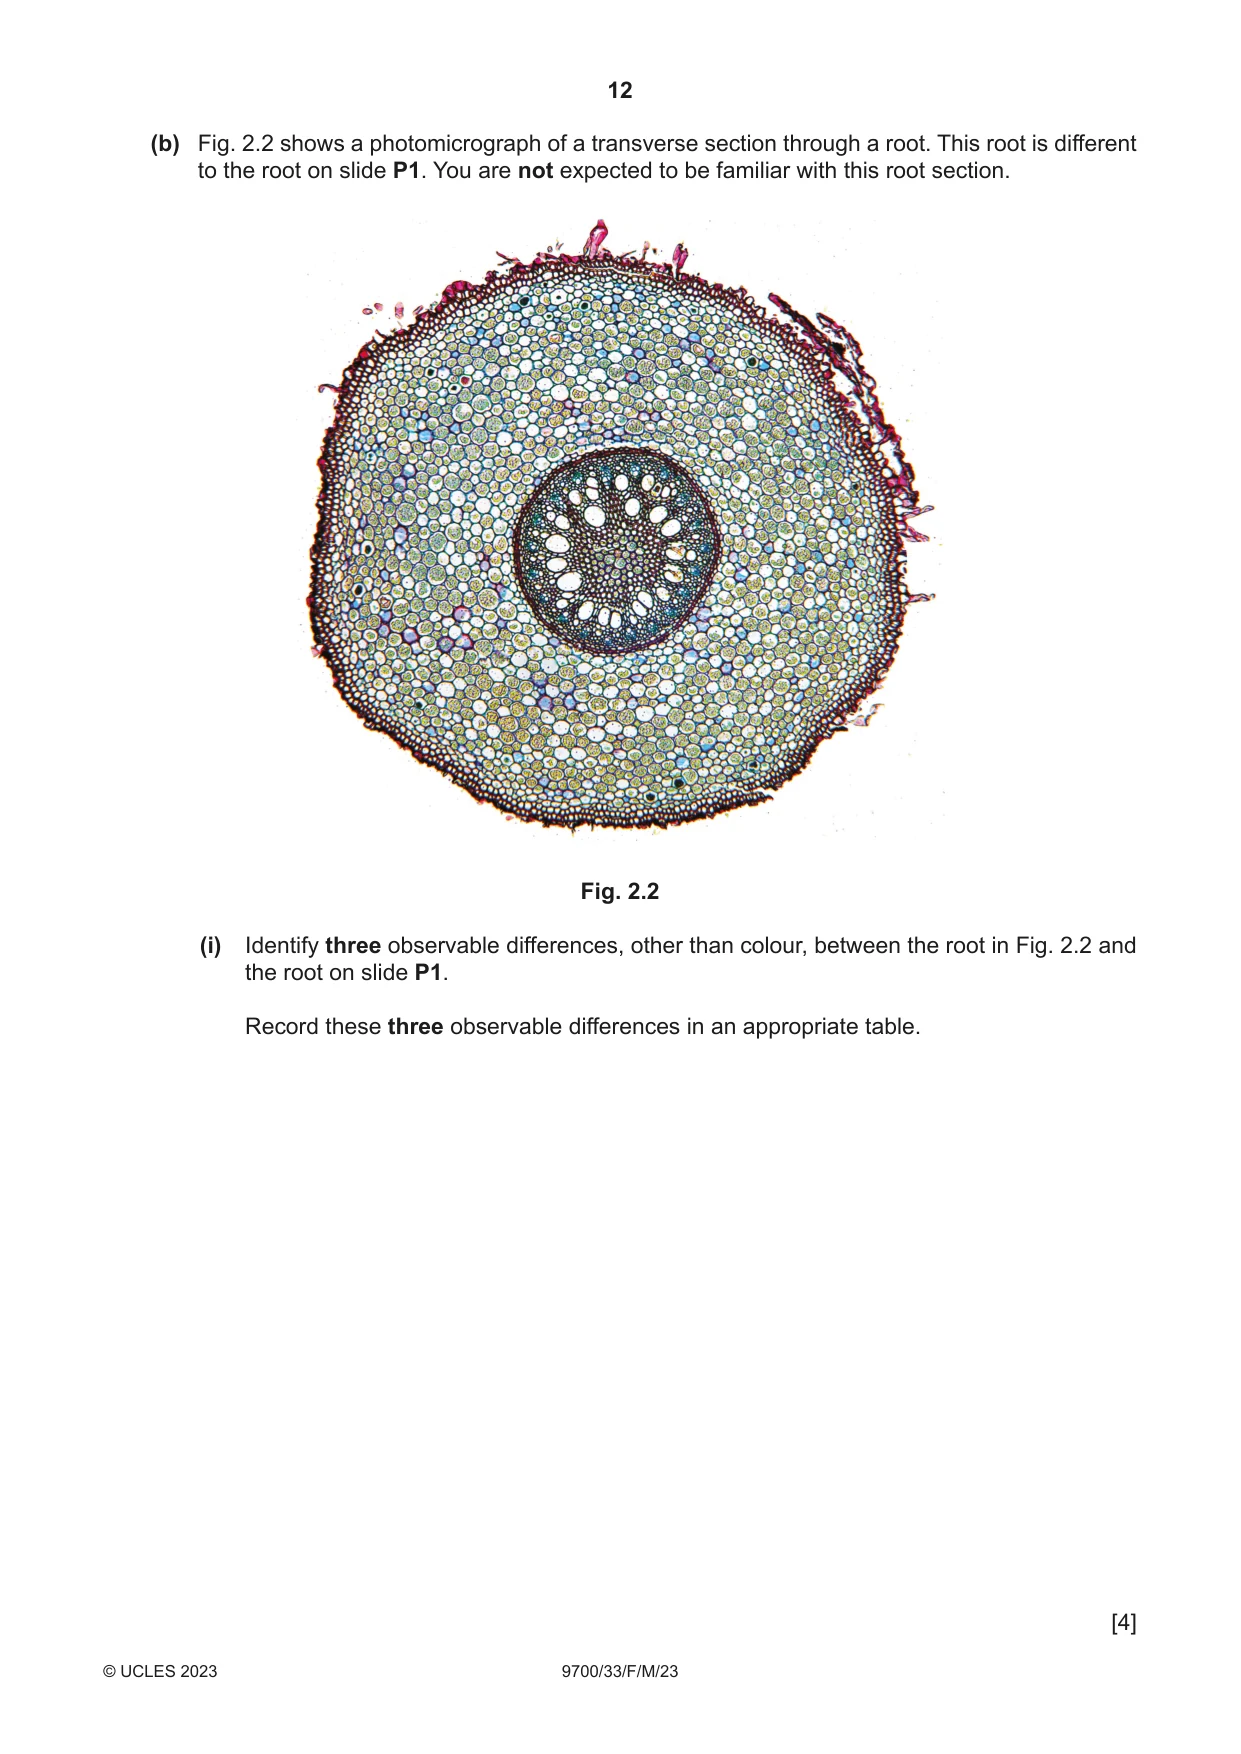
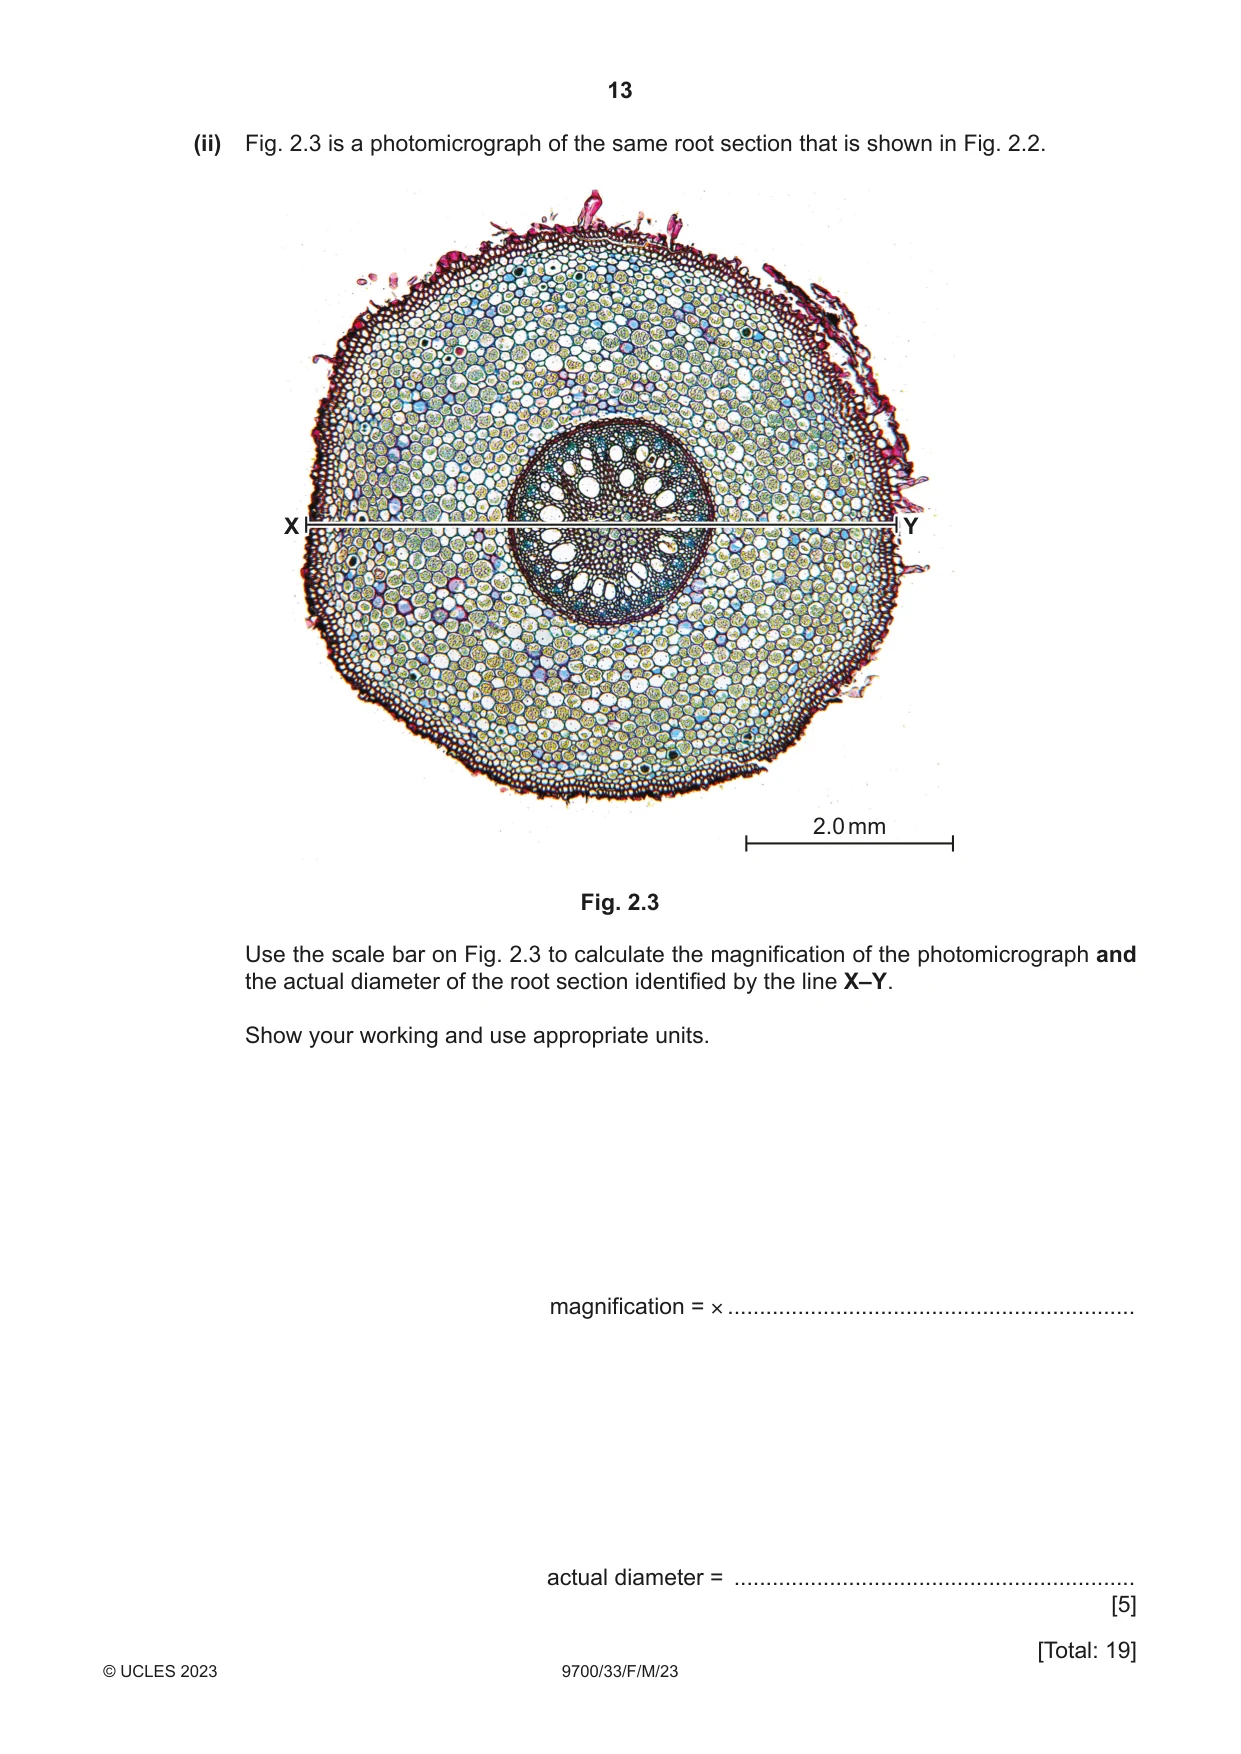
2 P1 is a slide of a stained transverse section through a plant root. (a) (i) Draw a large plan diagram of the region of the root on slide P1 indicated by the shaded area in Fig. 2.1. Use a sharp pencil. draw this region Fig. 2.1 Use one ruled label line and label to identify the xylem. [5] (ii) Observe the cells in the centre of the root on slide P1. Select a group of four adjacent cells. Each cell must touch at least two other cells. • Make a large drawing of this group of four cells. • Use one ruled label line and label to identify the cell wall of one cell. [5] (b) Fig. 2.2 shows a photomicrograph of a transverse section through a root. This root is different to the root on slide P1. You are not expected to be familiar with this root section. Fig. 2.2 (i) Identify three observable differences, other than colour, between the root in Fig. 2.2 and the root on slide P1. Record these three observable differences in an appropriate table. [4]
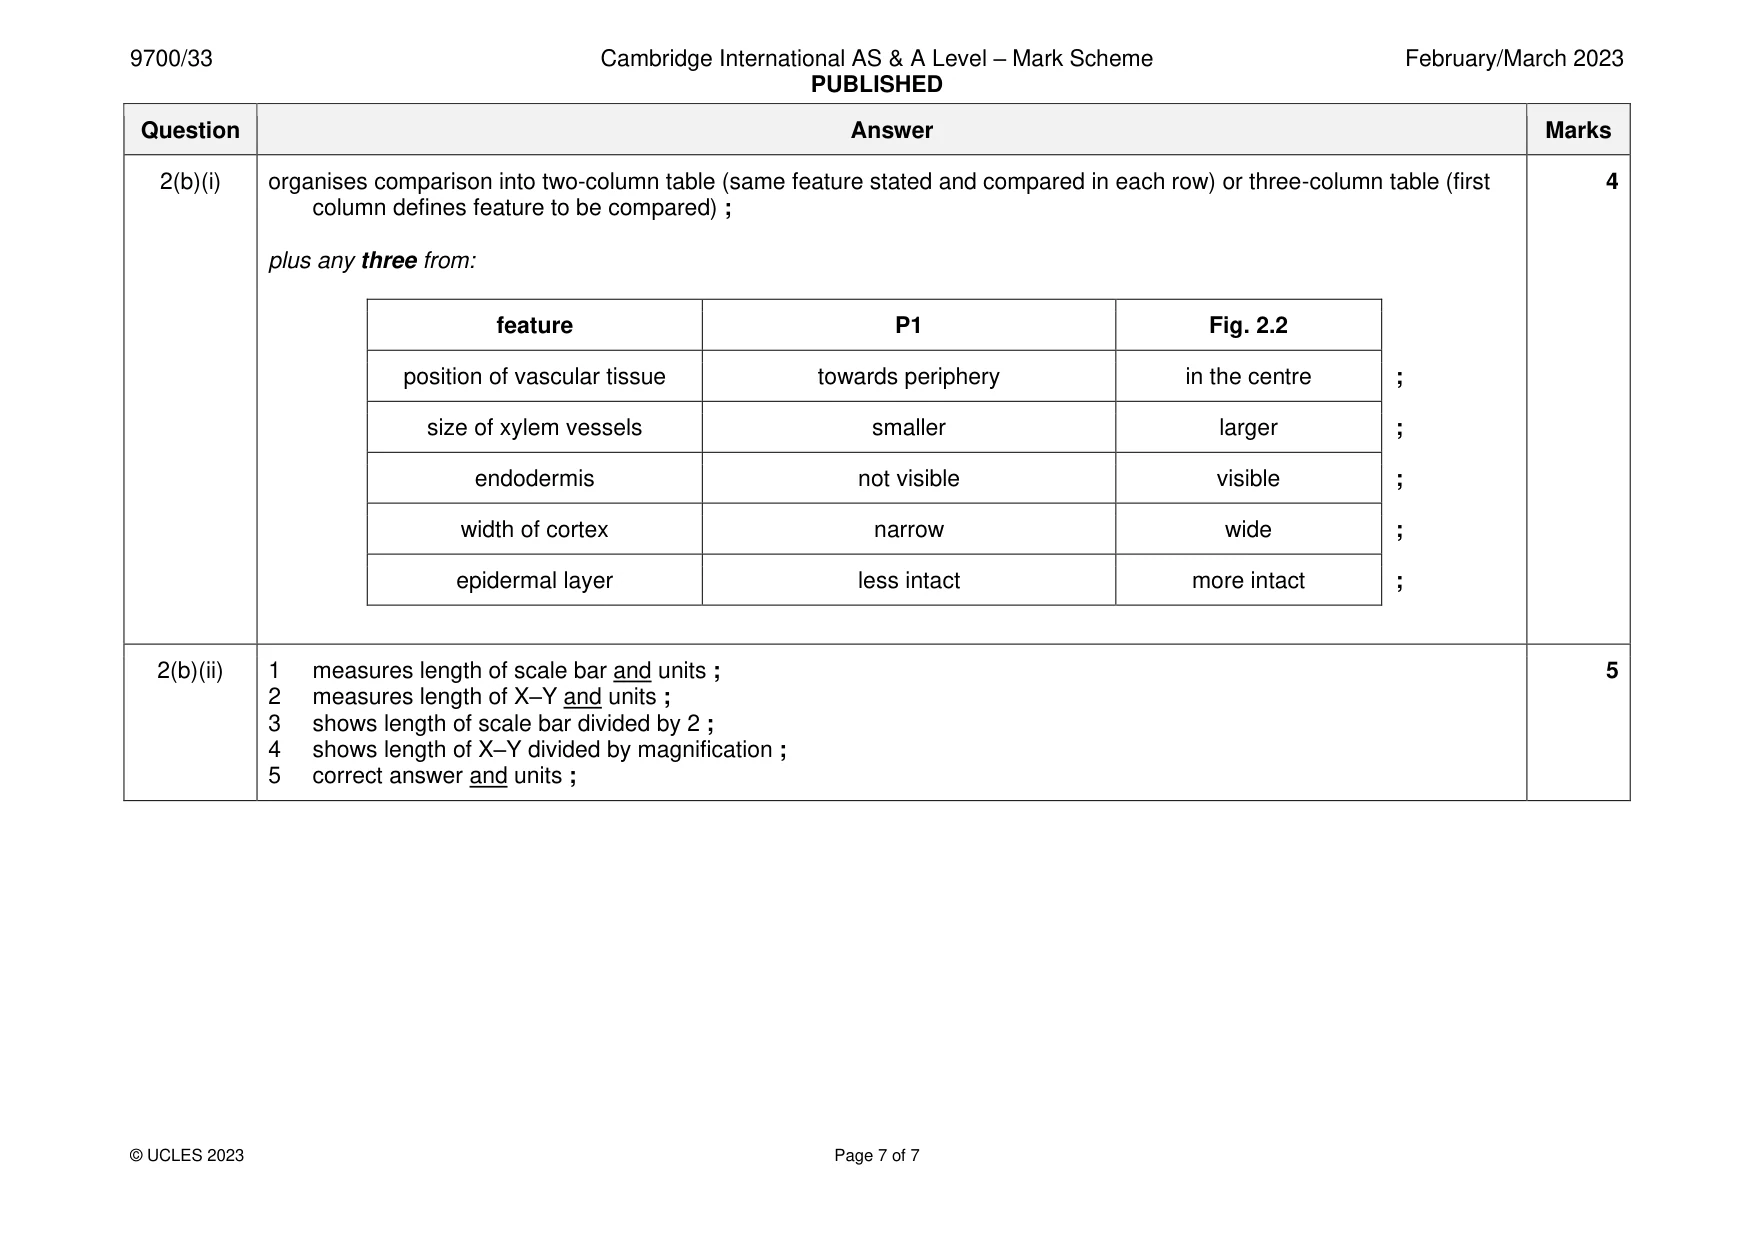
Mark scheme: 2(a)(i) 1 uses most of the available space and no shading ; 5 2 draws correct section and no cells ; 3 draws minimum number of tissues (at least 3 layers of tissue) ; 4 draws correct position of xylem ; 5 label line and label to xylem ; 2(a)(ii) 1 lines continuous, thin and sharp ; 5 2 draws each cell touching at least two of the other cells ; 3 two lines around each cell and three lines where cells touch ; 4 detailed shapes of cells and intercellular space between cells ; 5 label line and label to cell wall ; 2(b)(i) organises comparison into two-column table (same feature stated and compared in each row) or three-column table (first 4 column defines feature to be compared) ; plus any three from: feature P1 Fig. 2.2 position of vascular tissue towards periphery in the centre ; size of xylem vessels smaller larger ; endodermis not visible visible ; width of cortex narrow wide ; epidermal layer less intact more intact ; 2(b)(ii) 1 measures length of scale bar and units ; 5 2 measures length of X–Y and units ; 3 shows length of scale bar divided by 2 ; 4 shows length of X–Y divided by magnification ; 5 correct answer and units ;
What was in this paper
The subtopics covered by these 2 questions, and how many questions each got. Open one in a new tab to see every Cambridge question on it.
What you needed in this session
Cambridge’s own grade thresholds for 2023 Feb/March, Paper 3 · Variant 3. A higher threshold means an easier paper — the bar moves with how the cohort did.