Cambridge A Level Biology 9700 — 2017 Oct/Nov Paper 5 · Variant 2
9700/52/O/N/17 · 2 questions · 30 marks · ≈34 min
The question paper and its mark scheme, free to read here and free to download. This is Cambridge’s own paper, exactly as it was sat.
Question paper12 pages








Mark scheme7 pages
Answers below. Sit the paper first if you are practising.
Questions as text
Q1 · The enzyme lactase hydrolyses the disaccharide lactose to glucose and galactose
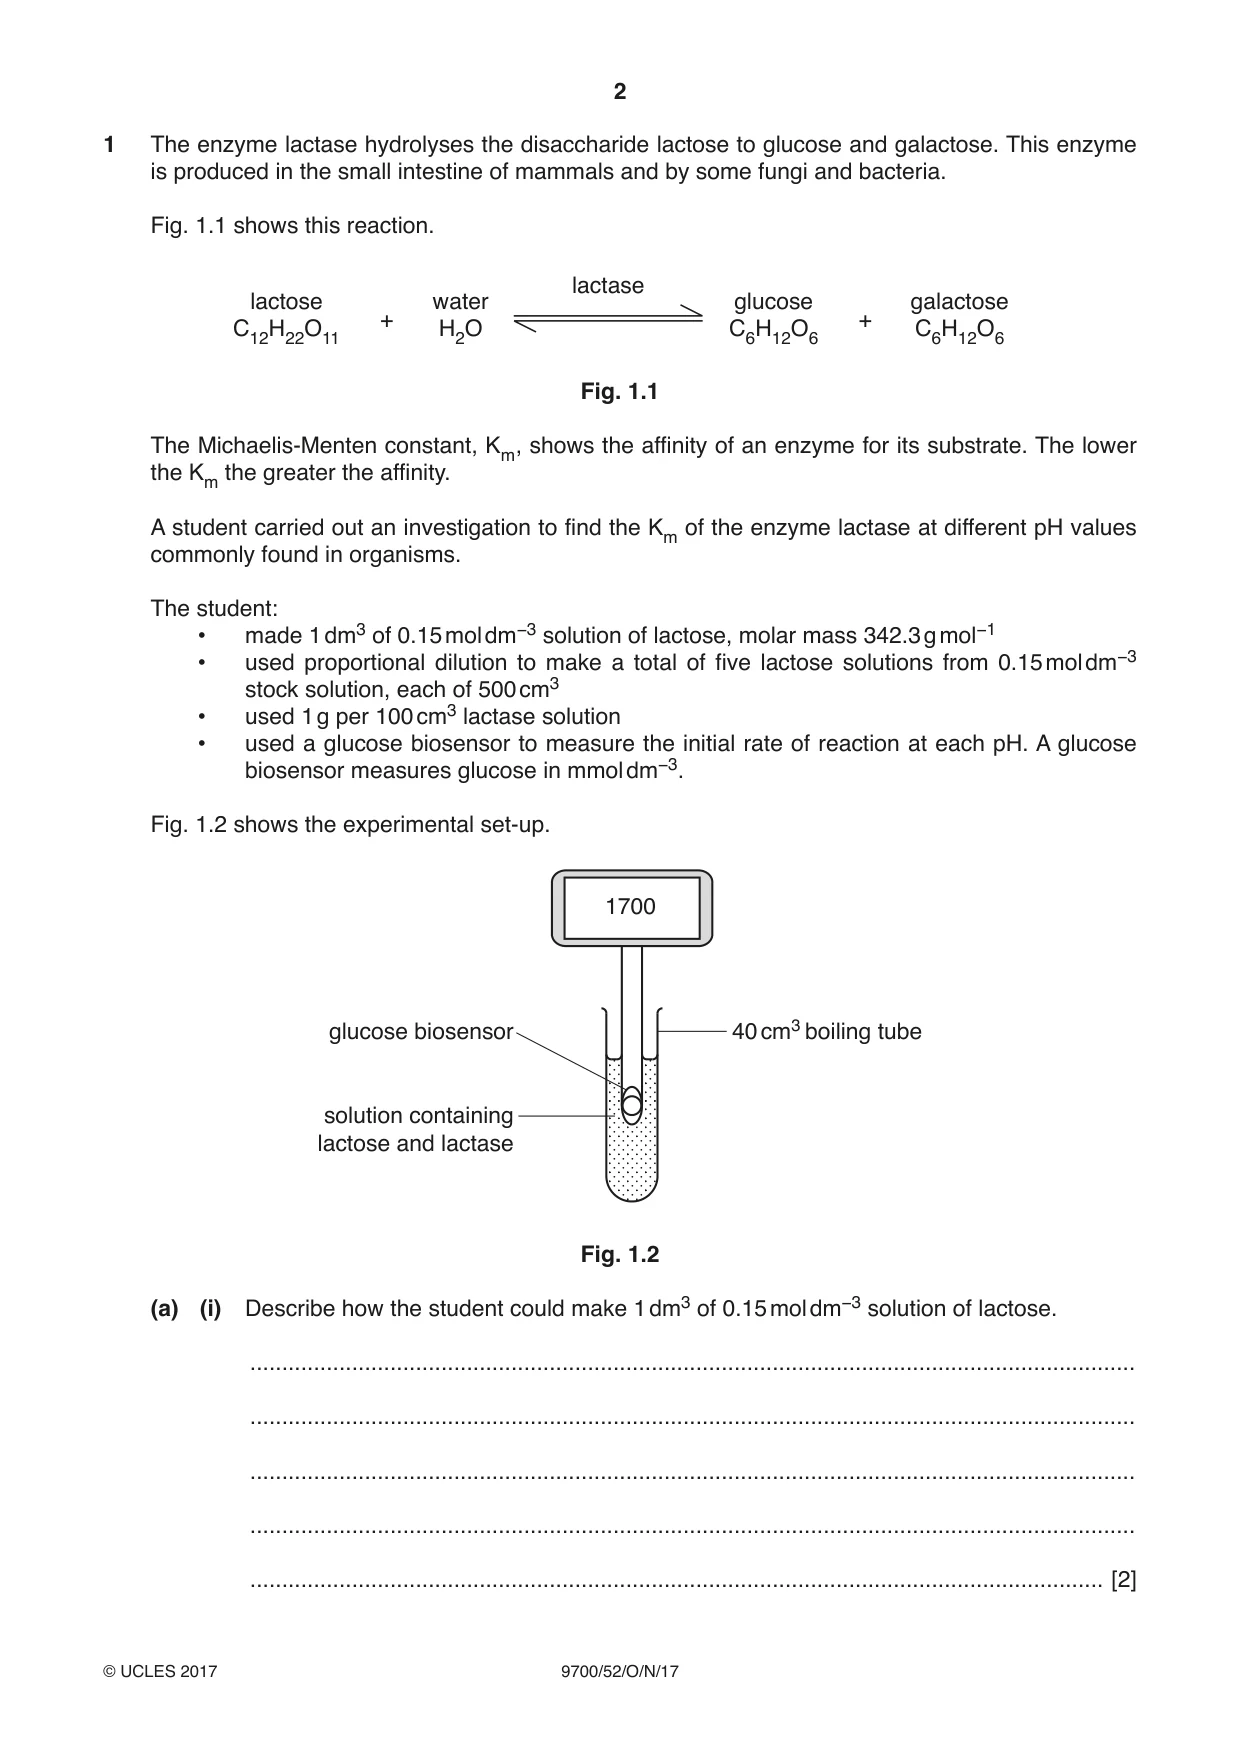
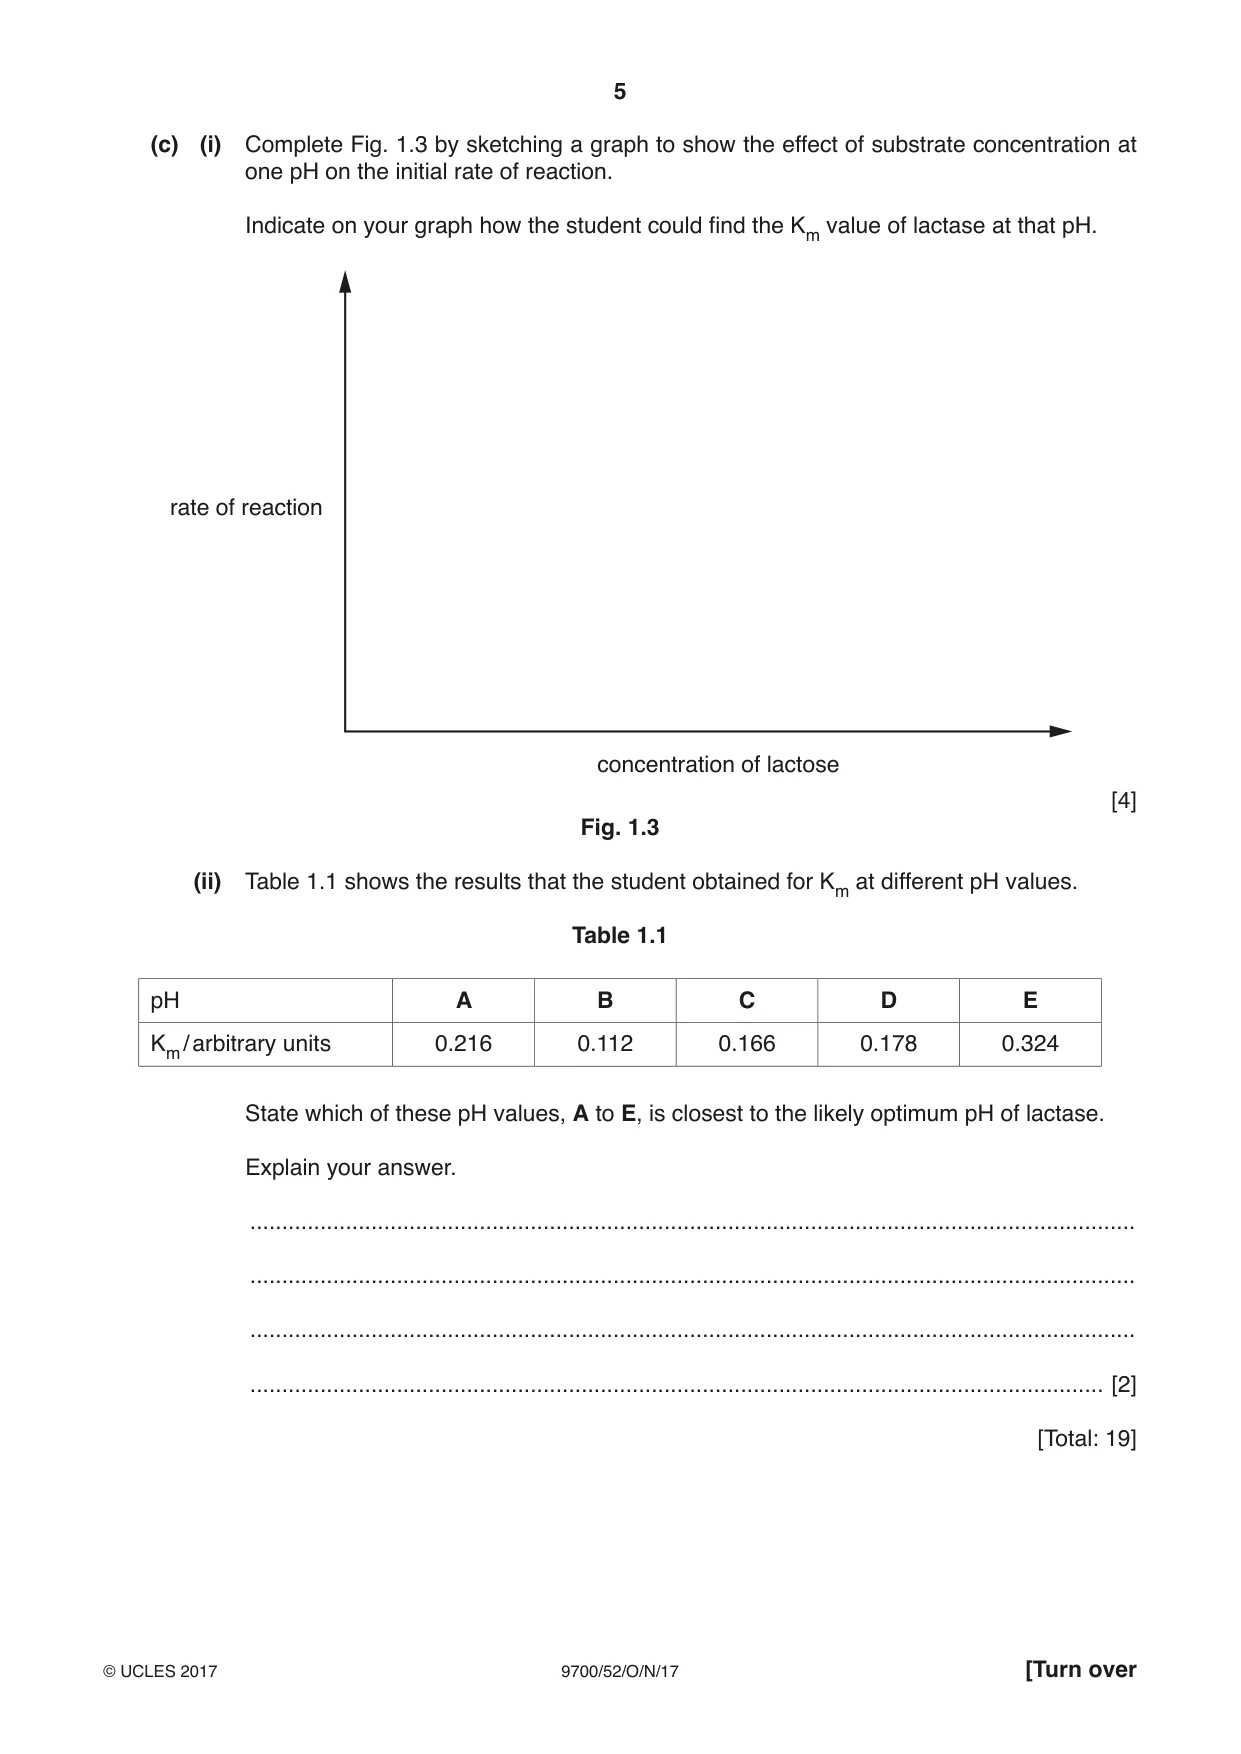
1 The enzyme lactase hydrolyses the disaccharide lactose to glucose and galactose. This enzyme is produced in the small intestine of mammals and by some fungi and bacteria. Fig. 1.1 shows this reaction. lactase lactose water glucose galactose + + C12H22O11 H2O C6H12O6 C6H12O6 Fig. 1.1 The Michaelis-Menten constant, Km, shows the affinity of an enzyme for its substrate. The lower the Km the greater the affinity. A student carried out an investigation to find the Km of the enzyme lactase at different pH values commonly found in organisms. The student: • made 1 dm3 of 0.15 mol dm−3 solution of lactose, molar mass 342.3 g mol−1 • used proportional dilution to make a total of five lactose solutions from 0.15 mol dm−3 stock solution, each of 500 cm3 • used 1 g per 100 cm3 lactase solution • used a glucose biosensor to measure the initial rate of reaction at each pH. A glucose biosensor measures glucose in mmol dm−3. Fig. 1.2 shows the experimental set-up. 1700 glucose biosensor 40 cm3 boiling tube solution containing lactose and lactase Fig. 1.2 (a) (i) Describe how the student could make 1 dm3 of 0.15 mol dm−3 solution of lactose. ........................................................................................................................................... ........................................................................................................................................... ........................................................................................................................................... ........................................................................................................................................... ...................................................................................................................................... [2] (ii) Describe how the student made a further four solutions of lactose by proportional dilution. ........................................................................................................................................... ........................................................................................................................................... ........................................................................................................................................... ........................................................................................................................................... ........................................................................................................................................... ........................................................................................................................................... ........................................................................................................................................... ...................................................................................................................................... [2] (b) (i) Identify the independent and dependent variables in this investigation. independent ...................................................................................................................... dependent ......................................................................................................................... [2] (ii) Suggest a suitable control for this investigation. ........................................................................................................................................... ...................................................................................................................................... [1] (iii) Describe a method that the student could use to find the Km of lactase at different pH values. The solutions were made as described in (a) (i) and (a) (ii) and the apparatus shown in Fig. 1.2 was used. Your method should be set out in a logical way and be detailed enough to let another person follow it. You should not include details of how to make the lactose or lactase solutions. ........................................................................................................................................... ........................................................................................................................................... ........................................................................................................................................... ........................................................................................................................................... ........................................................................................................................................... ........................................................................................................................................... ........................................................................................................................................... ........................................................................................................................................... ........................................................................................................................................... ........................................................................................................................................... ........................................................................................................................................... ........................................................................................................................................... ........................................................................................................................................... ........................................................................................................................................... ........................................................................................................................................... ........................................................................................................................................... ........................................................................................................................................... ........................................................................................................................................... ........................................................................................................................................... ........................................................................................................................................... ........................................................................................................................................... ........................................................................................................................................... ...................................................................................................................................... [6] (c) (i) Complete Fig. 1.3 by sketching a graph to show the effect of substrate concentration at one pH on the initial rate of reaction. Indicate on your graph how the student could find the Km value of lactase at that pH. rate of reaction concentration of lactose [4] Fig. 1.3 (ii) Table 1.1 shows the results that the student obtained for Km at different pH values. Table 1.1 pH A B C D E Km / arbitrary units 0.216 0.112 0.166 0.178 0.324 State which of these pH values, A to E, is closest to the likely optimum pH of lactase. Explain your answer. ........................................................................................................................................... ........................................................................................................................................... ........................................................................................................................................... ...................................................................................................................................... [2] [Total: 19]
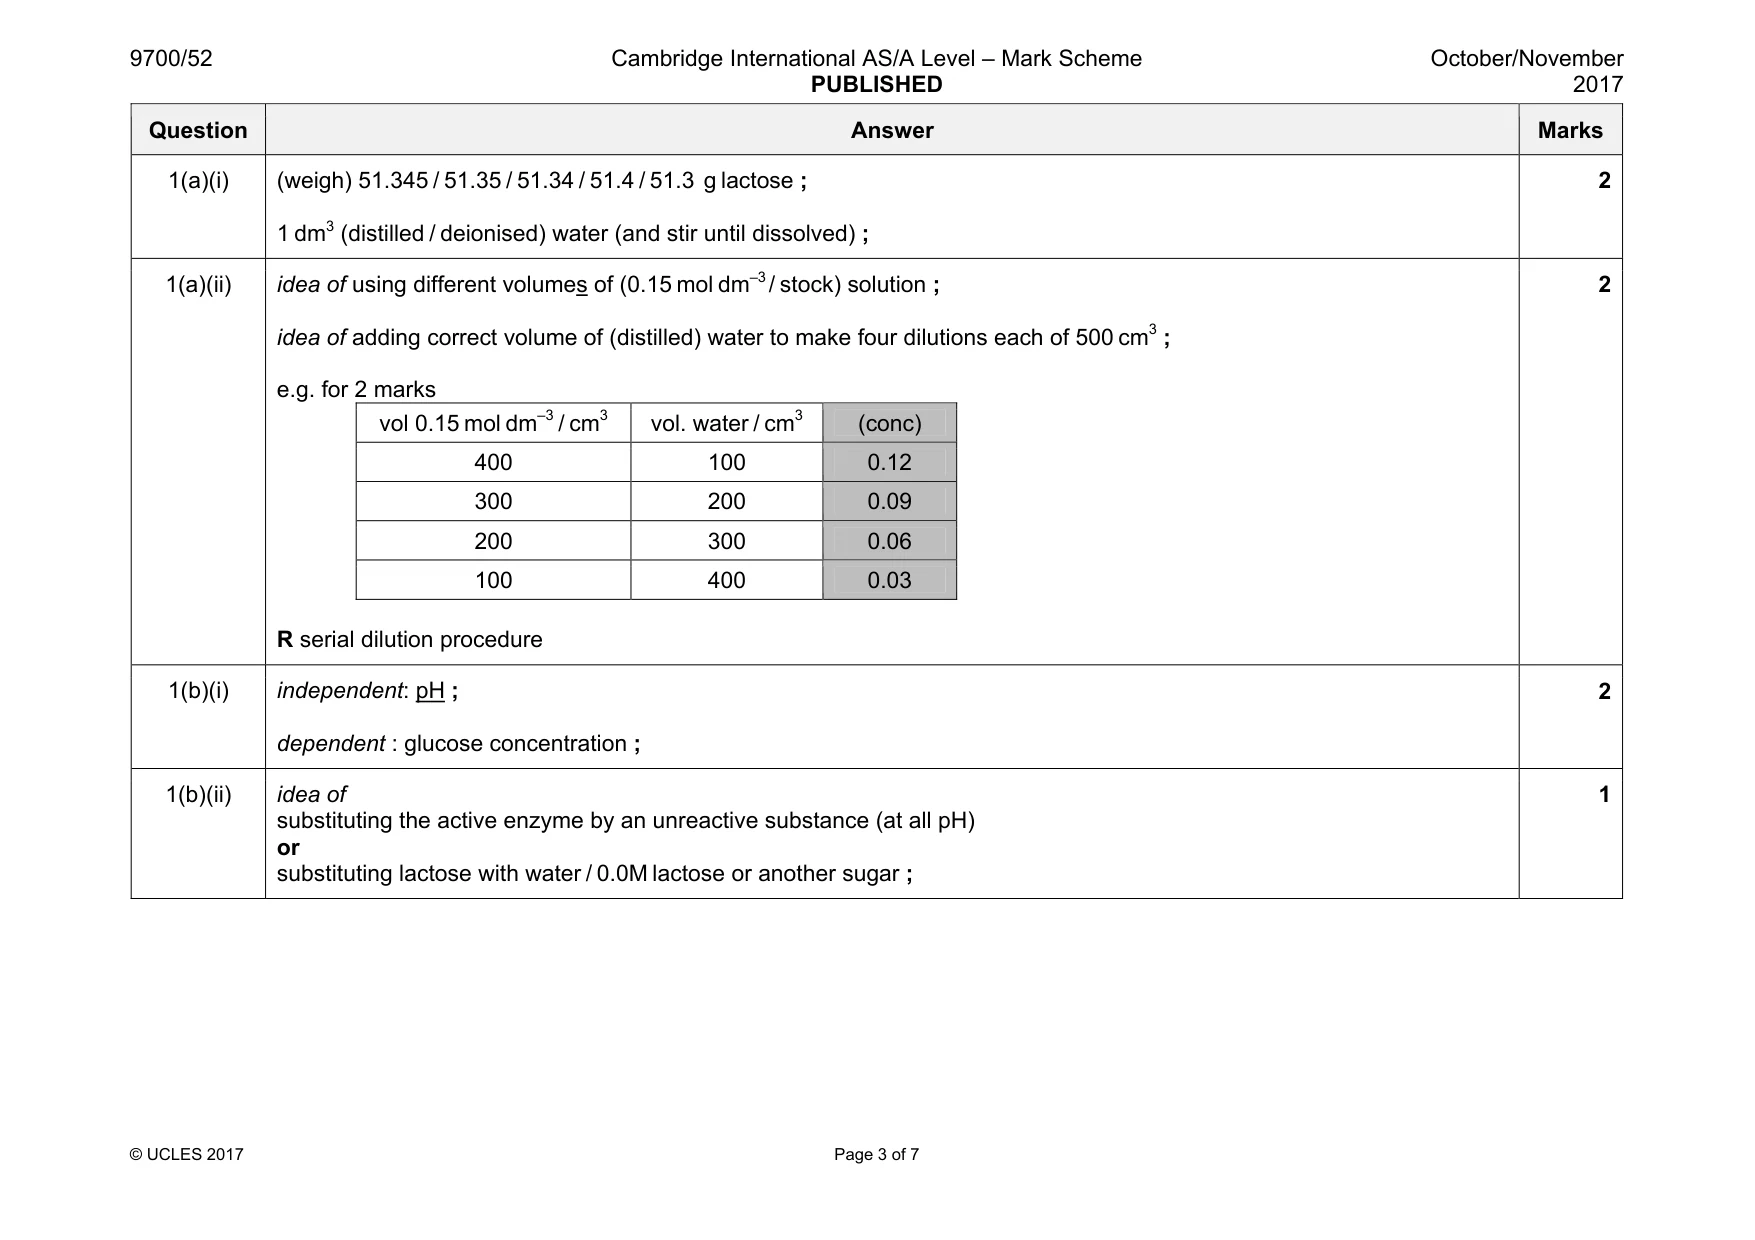
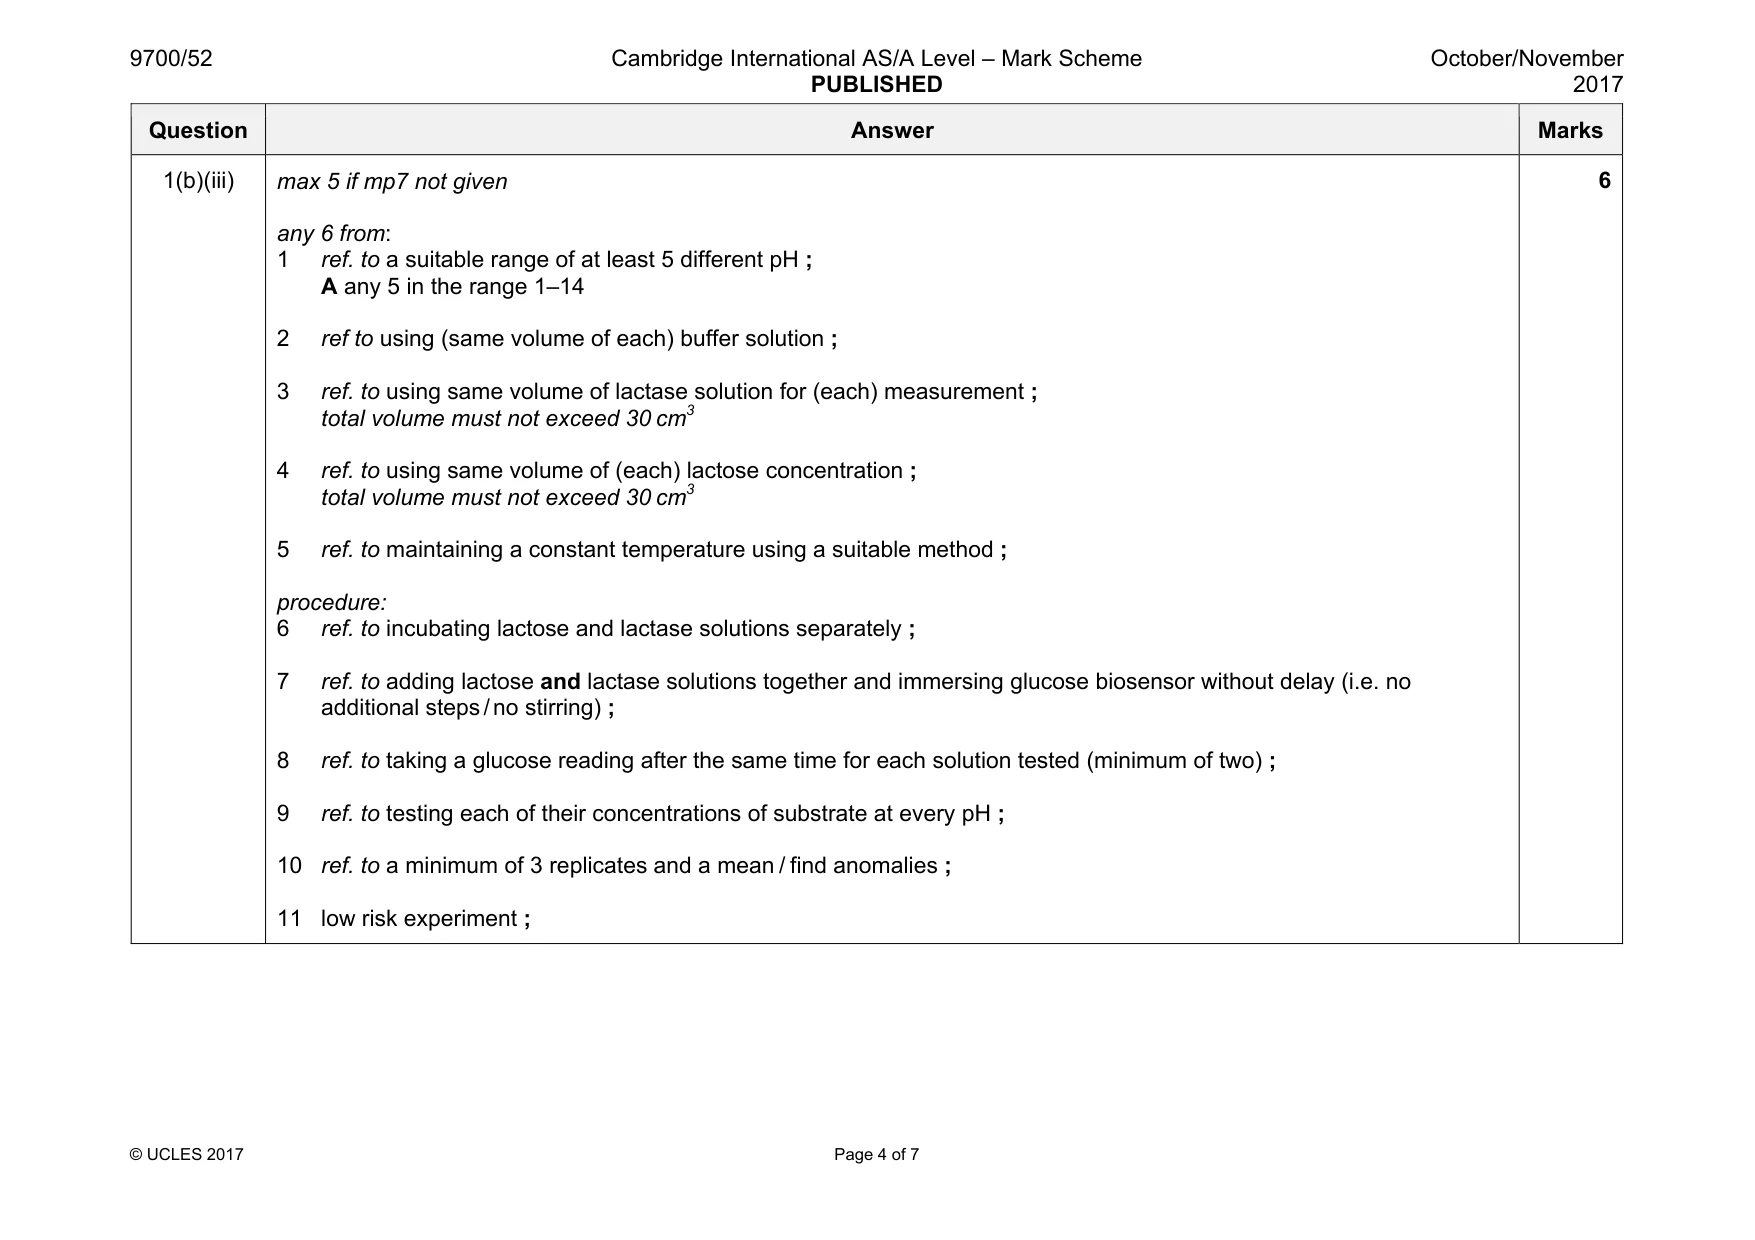
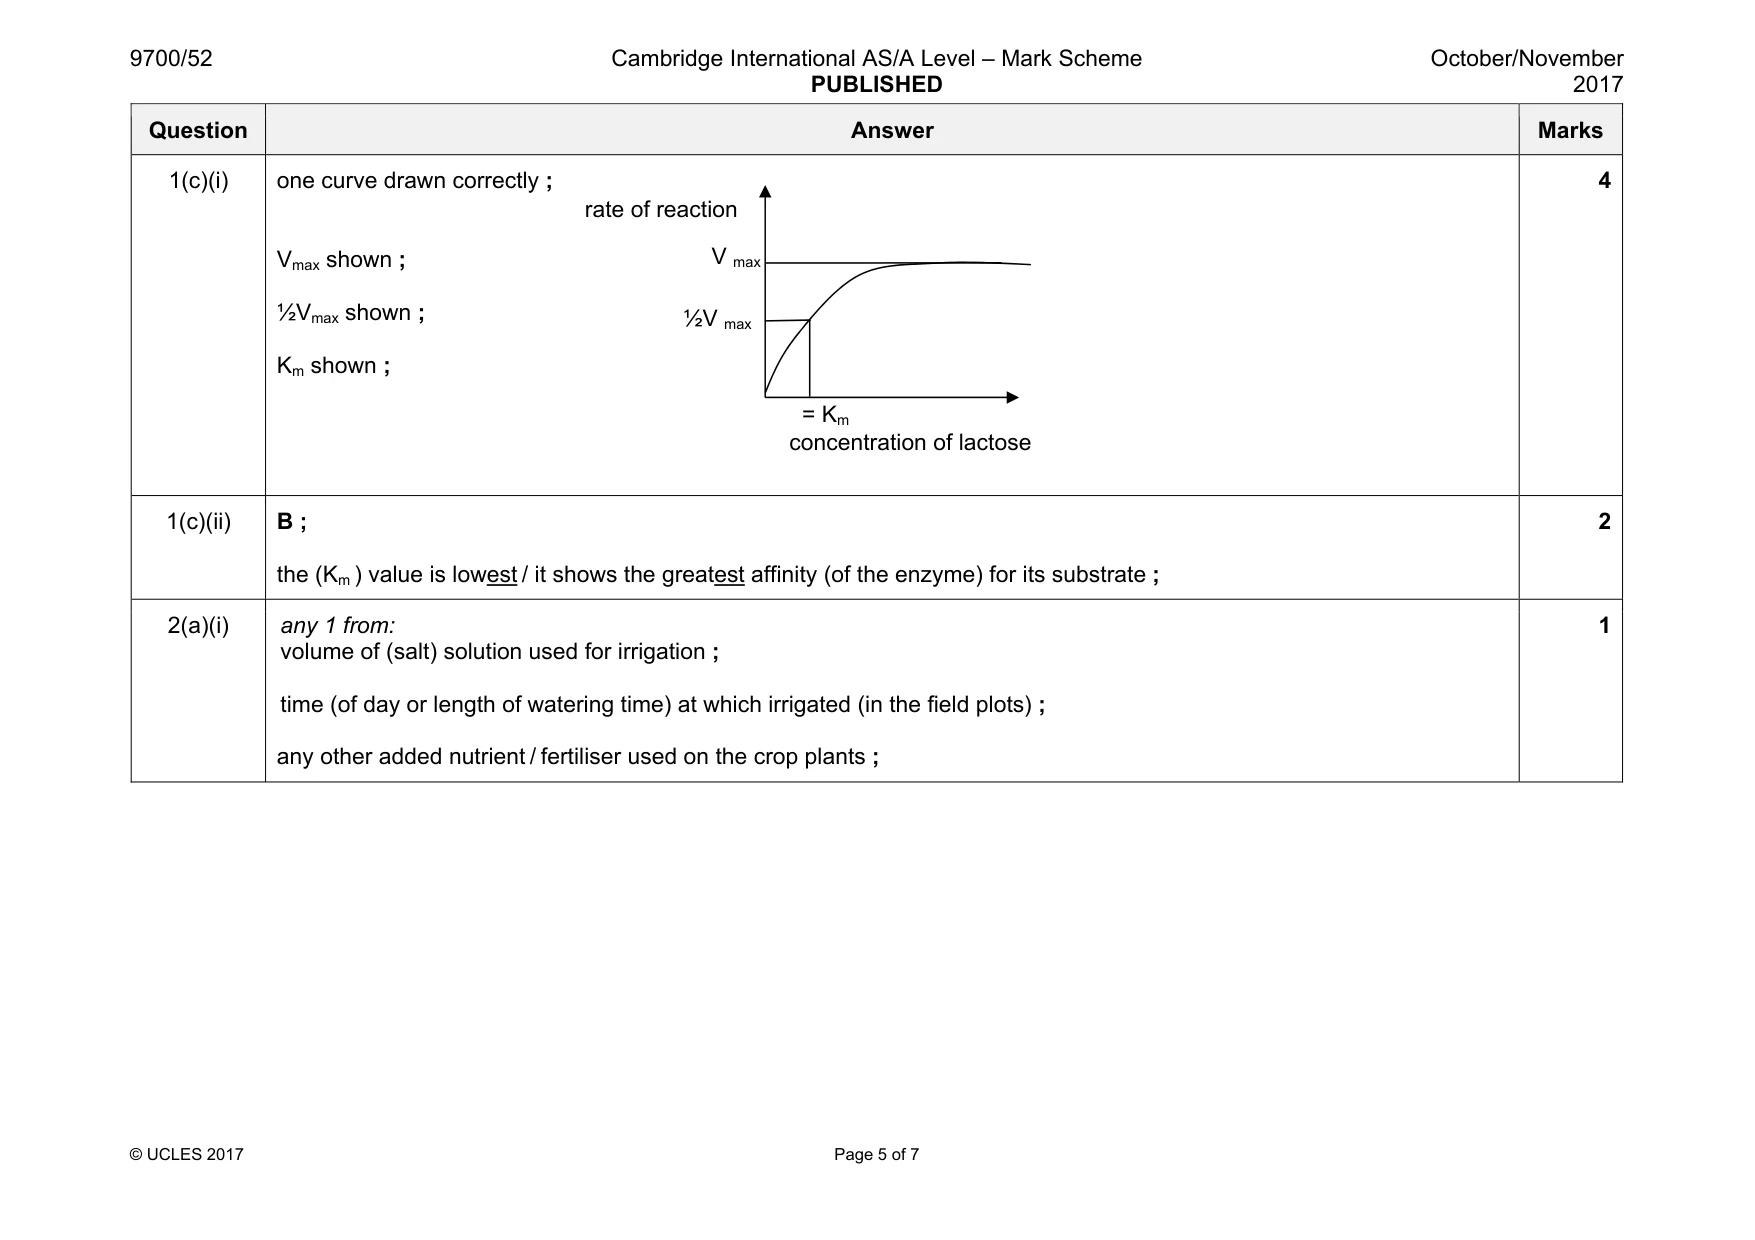
Mark scheme: 1(a)(i) (weigh) 51.345 / 51.35 / 51.34 / 51.4 / 51.3 g lactose ; 1 dm3 (distilled / deionised) water (and stir until dissolved) ; 2 1(a)(ii) idea of using different volumes of (0.15 mol dm–3/ stock) solution ; idea of adding correct volume of (distilled) water to make four dilutions each of 500 cm3 ; e.g. for 2 marks vol 0.15 mol dm–3 / cm3 vol. water / cm3 (conc) 400 100 0.12 300 200 0.09 200 300 0.06 100 400 0.03 R serial dilution procedure 2 1(b)(i) independent: pH ; dependent : glucose concentration ; 2 1(b)(ii) idea of substituting the active enzyme by an unreactive substance (at all pH) or substituting lactose with water / 0.0M lactose or another sugar ; 1 Question Answer Marks 1(b)(iii) max 5 if mp7 not given any 6 from: 1 ref. to a suitable range of at least 5 different pH ; A any 5 in the range 1–14 2 ref to using (same volume of each) buffer solution ; 3 ref. to using same volume of lactase solution for (each) measurement ; total volume must not exceed 30 cm3 4 ref. to using same volume of (each) lactose concentration ; total volume must not exceed 30 cm3 5 ref. to maintaining a constant temperature using a suitable method ; procedure: 6 ref. to incubating lactose and lactase solutions separately ; 7 ref. to adding lactose and lactase solutions together and immersing glucose biosensor without delay (i.e. no additional steps / no stirring) ; 8 ref. to taking a glucose reading after the same time for each solution tested (minimum of two) ; 9 ref. to testing each of their concentrations of substrate at every pH ; 10 ref. to a minimum of 3 replicates and a mean / find anomalies ; 11 low risk experiment ; 6 Question Answer Marks 1(c)(i) one curve drawn correctly ; Vmax shown ; ½Vmax shown ; Km shown ; 4 1(c)(ii) B ; the (Km ) value is lowest / it shows the greatest affinity (of the enzyme) for its substrate ; 2 rate of reaction concentration of lactose V max ½V max = Km
Q2 · In some countries crops are irrigated using water containing salt (sodium chloride)
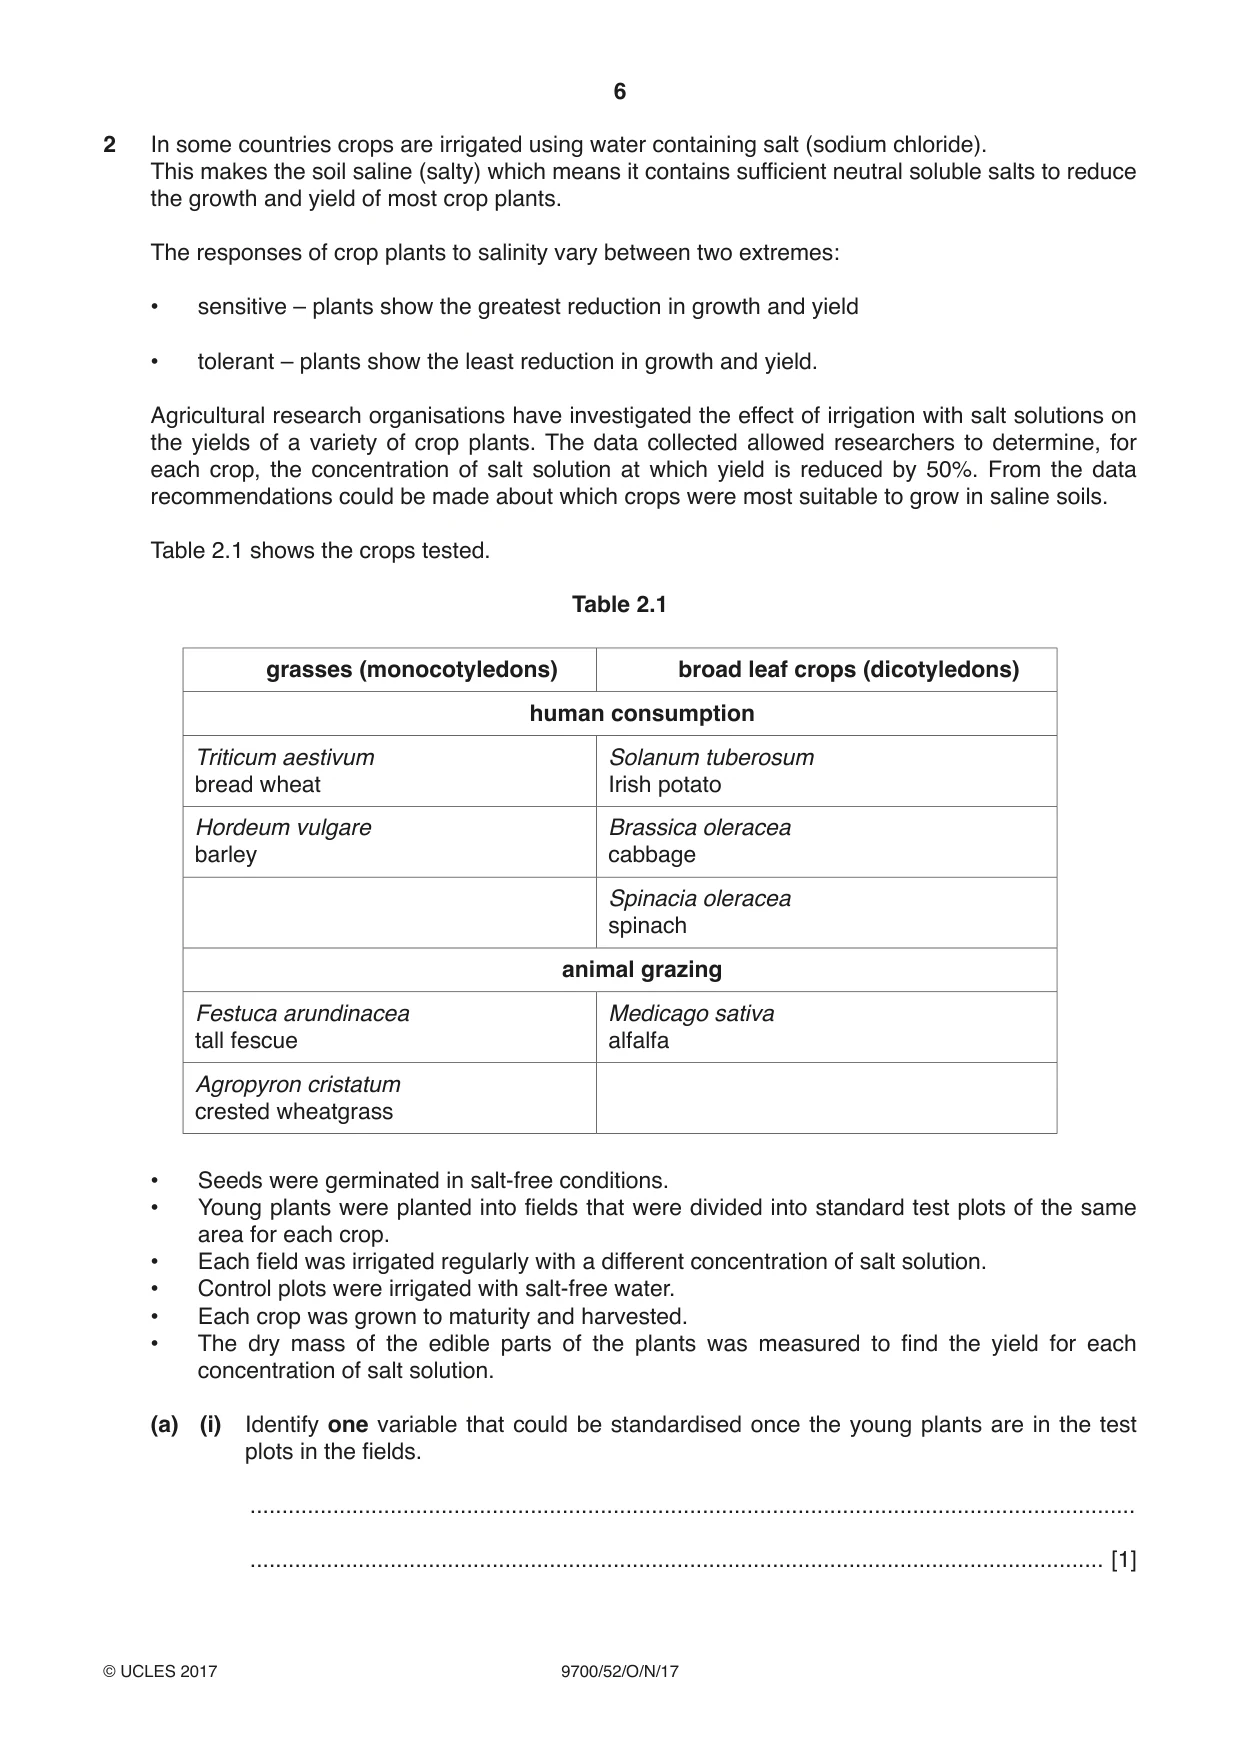
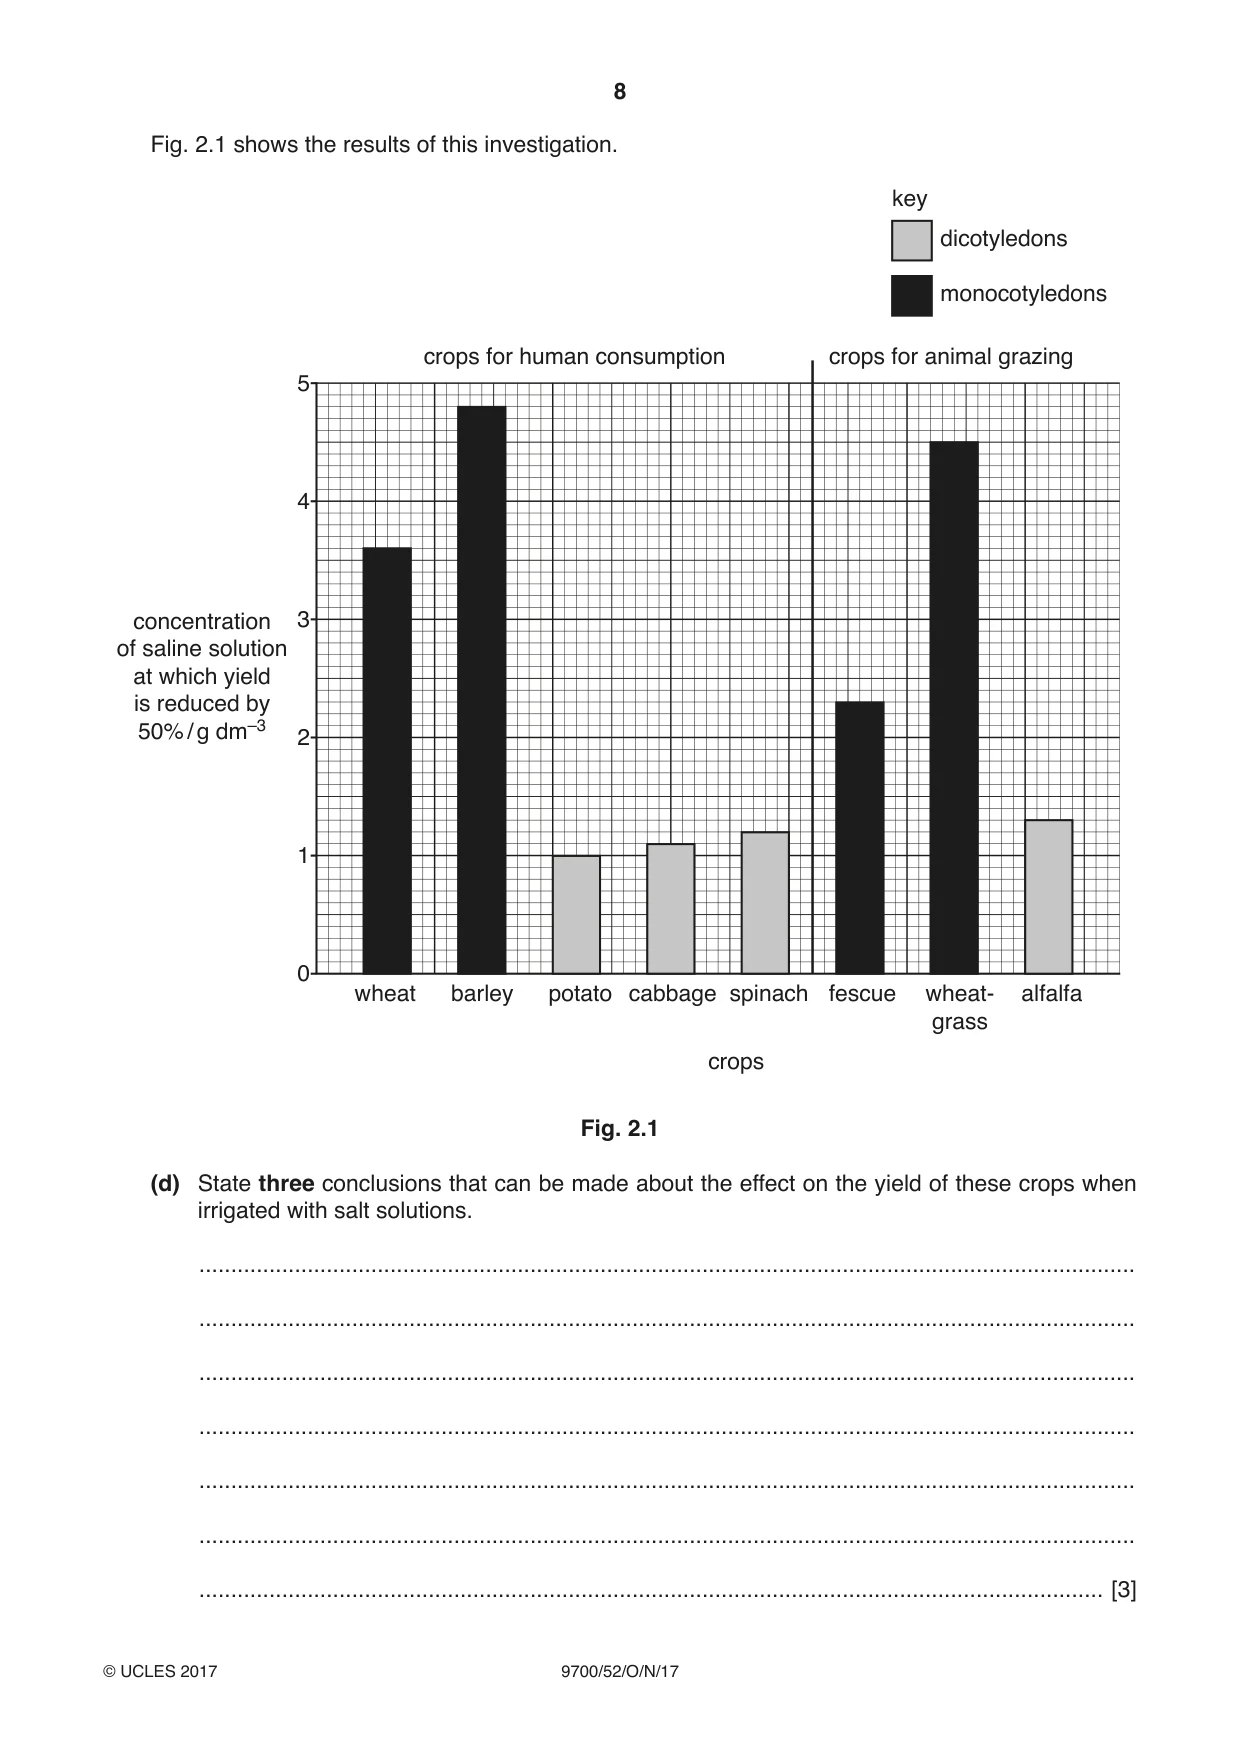
2 In some countries crops are irrigated using water containing salt (sodium chloride). This makes the soil saline (salty) which means it contains sufficient neutral soluble salts to reduce the growth and yield of most crop plants. The responses of crop plants to salinity vary between two extremes: • sensitive – plants show the greatest reduction in growth and yield • tolerant – plants show the least reduction in growth and yield. Agricultural research organisations have investigated the effect of irrigation with salt solutions on the yields of a variety of crop plants. The data collected allowed researchers to determine, for each crop, the concentration of salt solution at which yield is reduced by 50%. From the data recommendations could be made about which crops were most suitable to grow in saline soils. Table 2.1 shows the crops tested. Table 2.1 grasses (monocotyledons) broad leaf crops (dicotyledons) human consumption Triticum aestivum Solanum tuberosum bread wheat Irish potato Hordeum vulgare Brassica oleracea barley cabbage Spinacia oleracea spinach animal grazing Festuca arundinacea Medicago sativa tall fescue alfalfa Agropyron cristatum crested wheatgrass • Seeds were germinated in salt-free conditions. • Young plants were planted into fields that were divided into standard test plots of the same area for each crop. • Each field was irrigated regularly with a different concentration of salt solution. • Control plots were irrigated with salt-free water. • Each crop was grown to maturity and harvested. • The dry mass of the edible parts of the plants was measured to find the yield for each concentration of salt solution. (a) (i) Identify one variable that could be standardised once the young plants are in the test plots in the fields. ........................................................................................................................................... ...................................................................................................................................... [1] (ii) Suggest one other variable that cannot be standardised once the young plants are in the test plots in the fields. ........................................................................................................................................... ...................................................................................................................................... [1] (b) Suggest why the researchers used dry mass to estimate the yield of the different crops. ................................................................................................................................................... ................................................................................................................................................... ................................................................................................................................................... ................................................................................................................................................... .............................................................................................................................................. [2] (c) The data collected by the researchers allowed them to determine, for each crop, the concentration of salt solution at which yield is reduced by 50%. Explain how the researchers determined the concentration of salt at which yield is reduced by 50%. ................................................................................................................................................... ................................................................................................................................................... ................................................................................................................................................... ................................................................................................................................................... .............................................................................................................................................. [2] Fig. 2.1 shows the results of this investigation. key dicotyledons monocotyledons crops for human consumption crops for animal grazing 5 4 concentration 3 of saline solution at which yield is reduced by 50% / g dm–3 2 1 0 wheat barley potato cabbage spinach fescue wheat- alfalfa grass crops Fig. 2.1 (d) State three conclusions that can be made about the effect on the yield of these crops when irrigated with salt solutions. ................................................................................................................................................... ................................................................................................................................................... ................................................................................................................................................... ................................................................................................................................................... ................................................................................................................................................... ................................................................................................................................................... .............................................................................................................................................. [3]
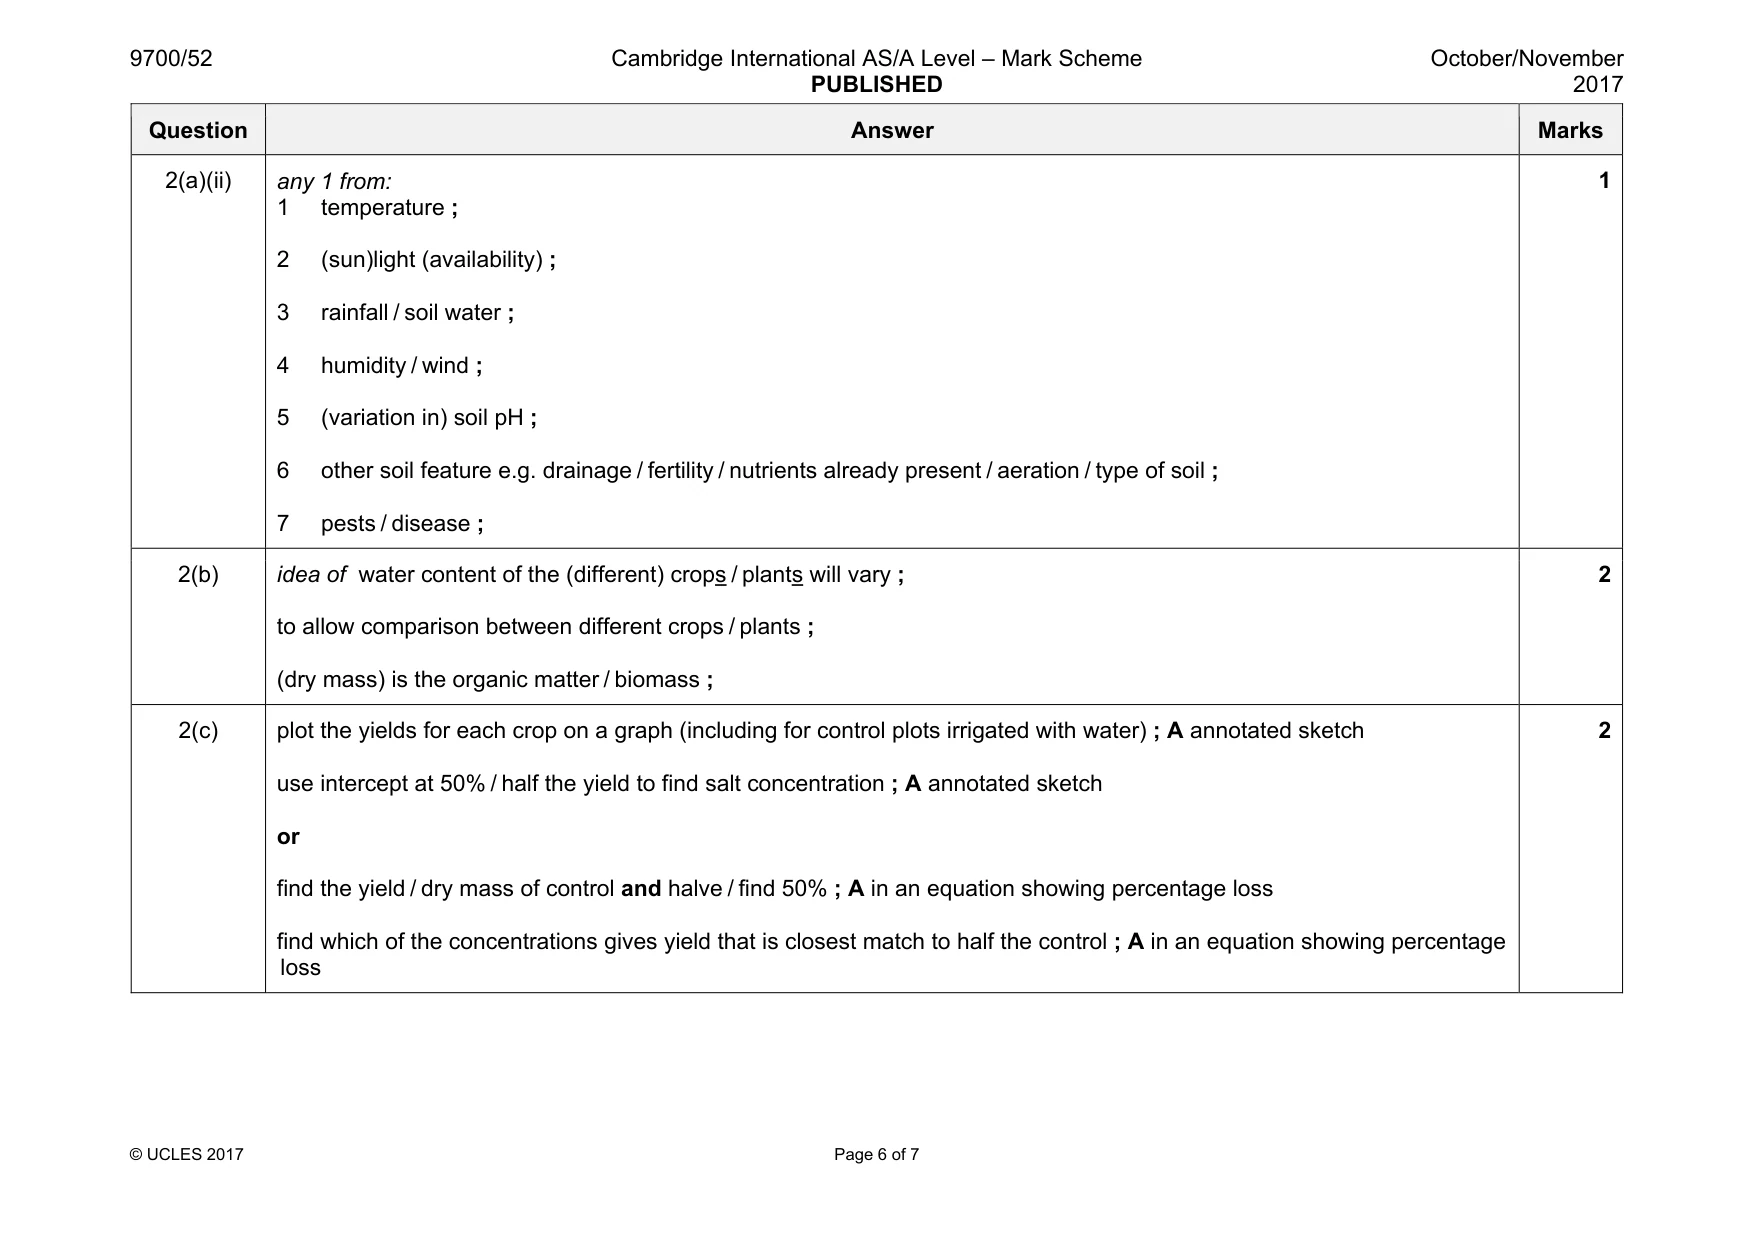
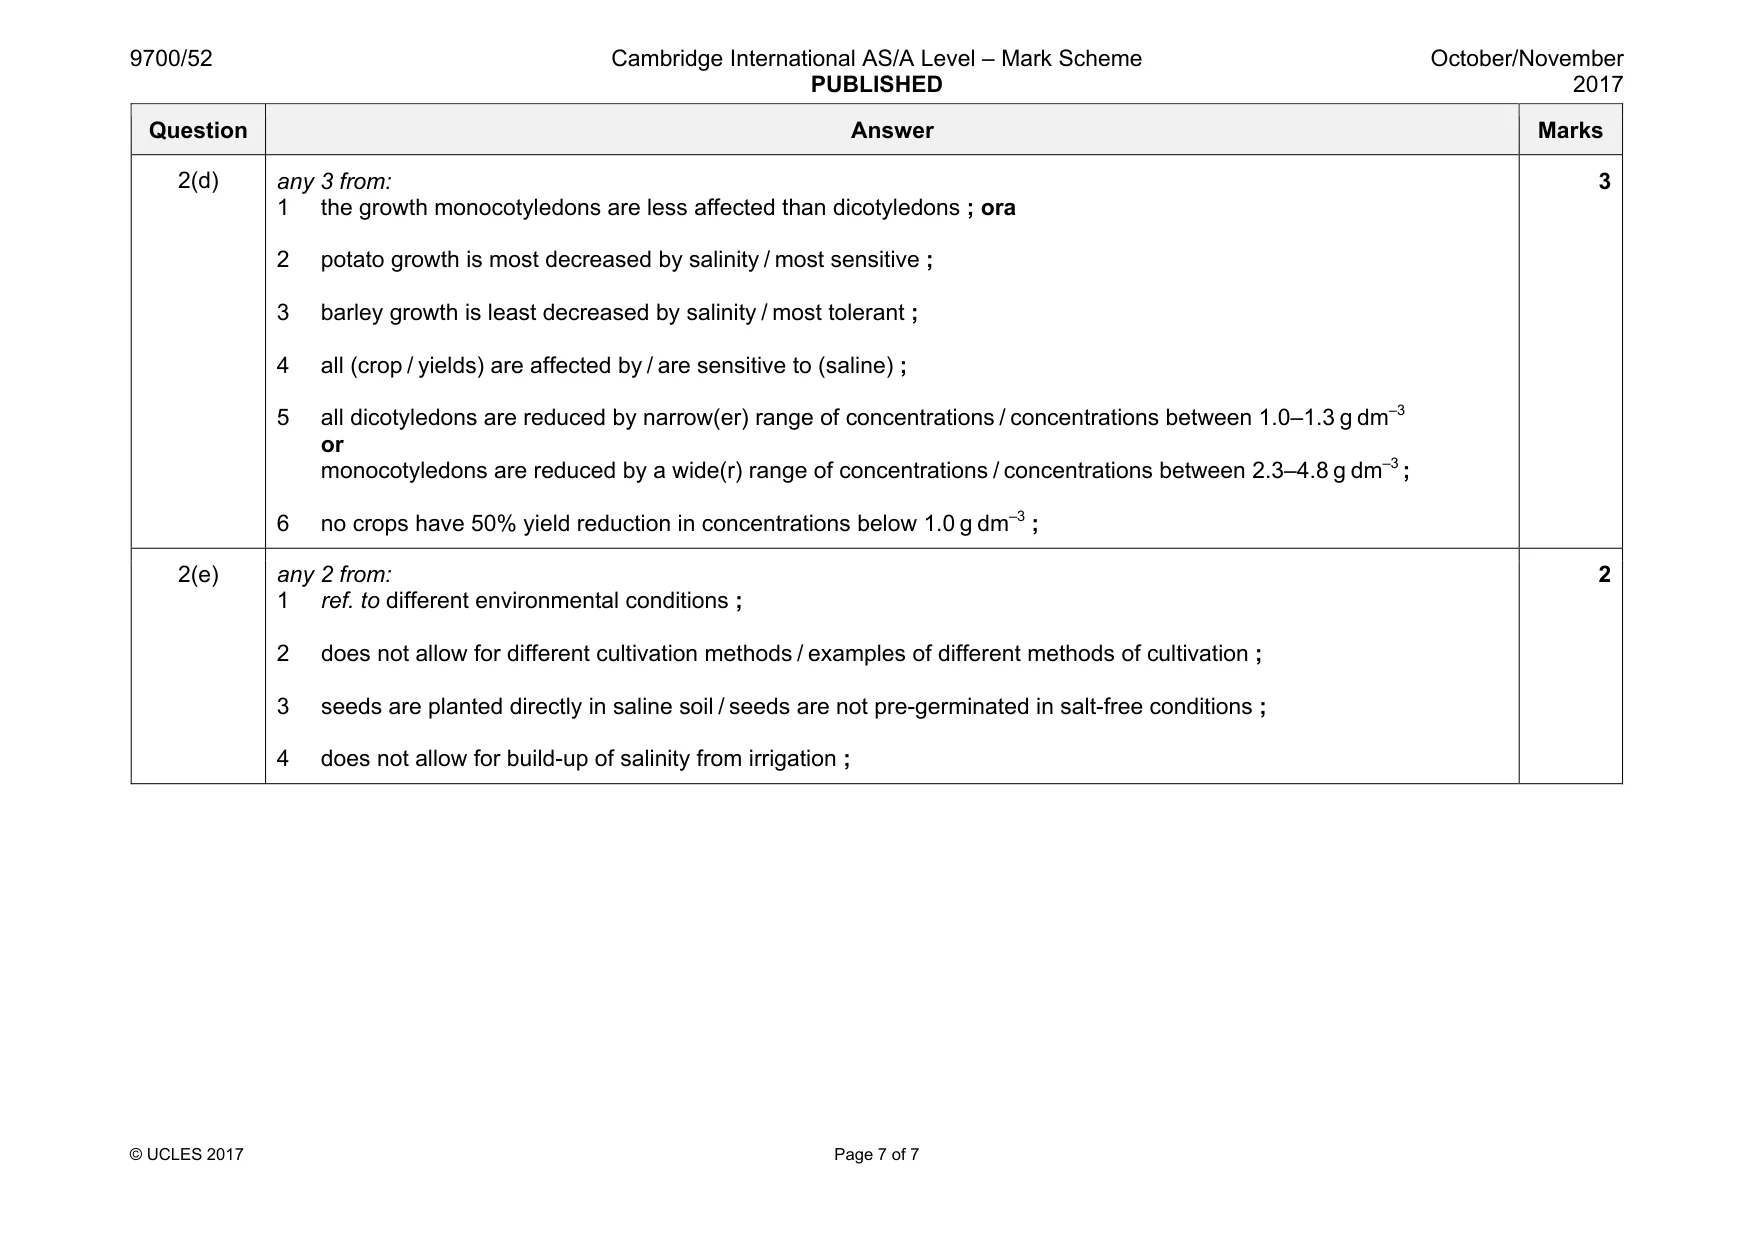
Mark scheme: 2(a)(i) any 1 from: volume of (salt) solution used for irrigation ; time (of day or length of watering time) at which irrigated (in the field plots) ; any other added nutrient / fertiliser used on the crop plants ; 1 Question Answer Marks 2(a)(ii) any 1 from: 1 temperature ; 2 (sun)light (availability) ; 3 rainfall / soil water ; 4 humidity / wind ; 5 (variation in) soil pH ; 6 other soil feature e.g. drainage / fertility / nutrients already present / aeration / type of soil ; 7 pests / disease ; 1 2(b) idea of water content of the (different) crops / plants will vary ; to allow comparison between different crops / plants ; (dry mass) is the organic matter / biomass ; 2 2(c) plot the yields for each crop on a graph (including for control plots irrigated with water) ; A annotated sketch use intercept at 50% / half the yield to find salt concentration ; A annotated sketch or find the yield / dry mass of control and halve / find 50% ; A in an equation showing percentage loss find which of the concentrations gives yield that is closest match to half the control ; A in an equation showing percentage loss 2 Question Answer Marks 2(d) any 3 from: 1 the growth monocotyledons are less affected than dicotyledons ; ora 2 potato growth is most decreased by salinity / most sensitive ; 3 barley growth is least decreased by salinity / most tolerant ; 4 all (crop / yields) are affected by / are sensitive to (saline) ; 5 all dicotyledons are reduced by narrow(er) range of concentrations / concentrations between 1.0–1.3 g dm–3 or monocotyledons are reduced by a wide(r) range of concentrations / concentrations between 2.3–4.8 g dm–3 ; 6 no crops have 50% yield reduction in concentrations below 1.0 g dm–3 ; 3 2(e) any 2 from: 1 ref. to different environmental conditions ; 2 does not allow for different cultivation methods / examples of different methods of cultivation ; 3 seeds are planted directly in saline soil / seeds are not pre-germinated in salt-free conditions ; 4 does not allow for build-up of salinity from irrigation ; 2
What was in this paper
The subtopics covered by these 2 questions, and how many questions each got. Open one in a new tab to see every Cambridge question on it.
What you needed in this session
Cambridge’s own grade thresholds for 2017 Oct/Nov, Paper 5 · Variant 2. A higher threshold means an easier paper — the bar moves with how the cohort did.