Cambridge A Level Biology 9700 — 2017 Oct/Nov Paper 5 · Variant 1
9700/51/O/N/17 · 2 questions · 30 marks · ≈34 min
The question paper and its mark scheme, free to read here and free to download. This is Cambridge’s own paper, exactly as it was sat.
Question paper12 pages




Mark scheme8 pages
Answers below. Sit the paper first if you are practising.
Questions as text
Q1 · The enzyme urease catalyses the breakdown of urea into carbonate ions and ammonium ions…
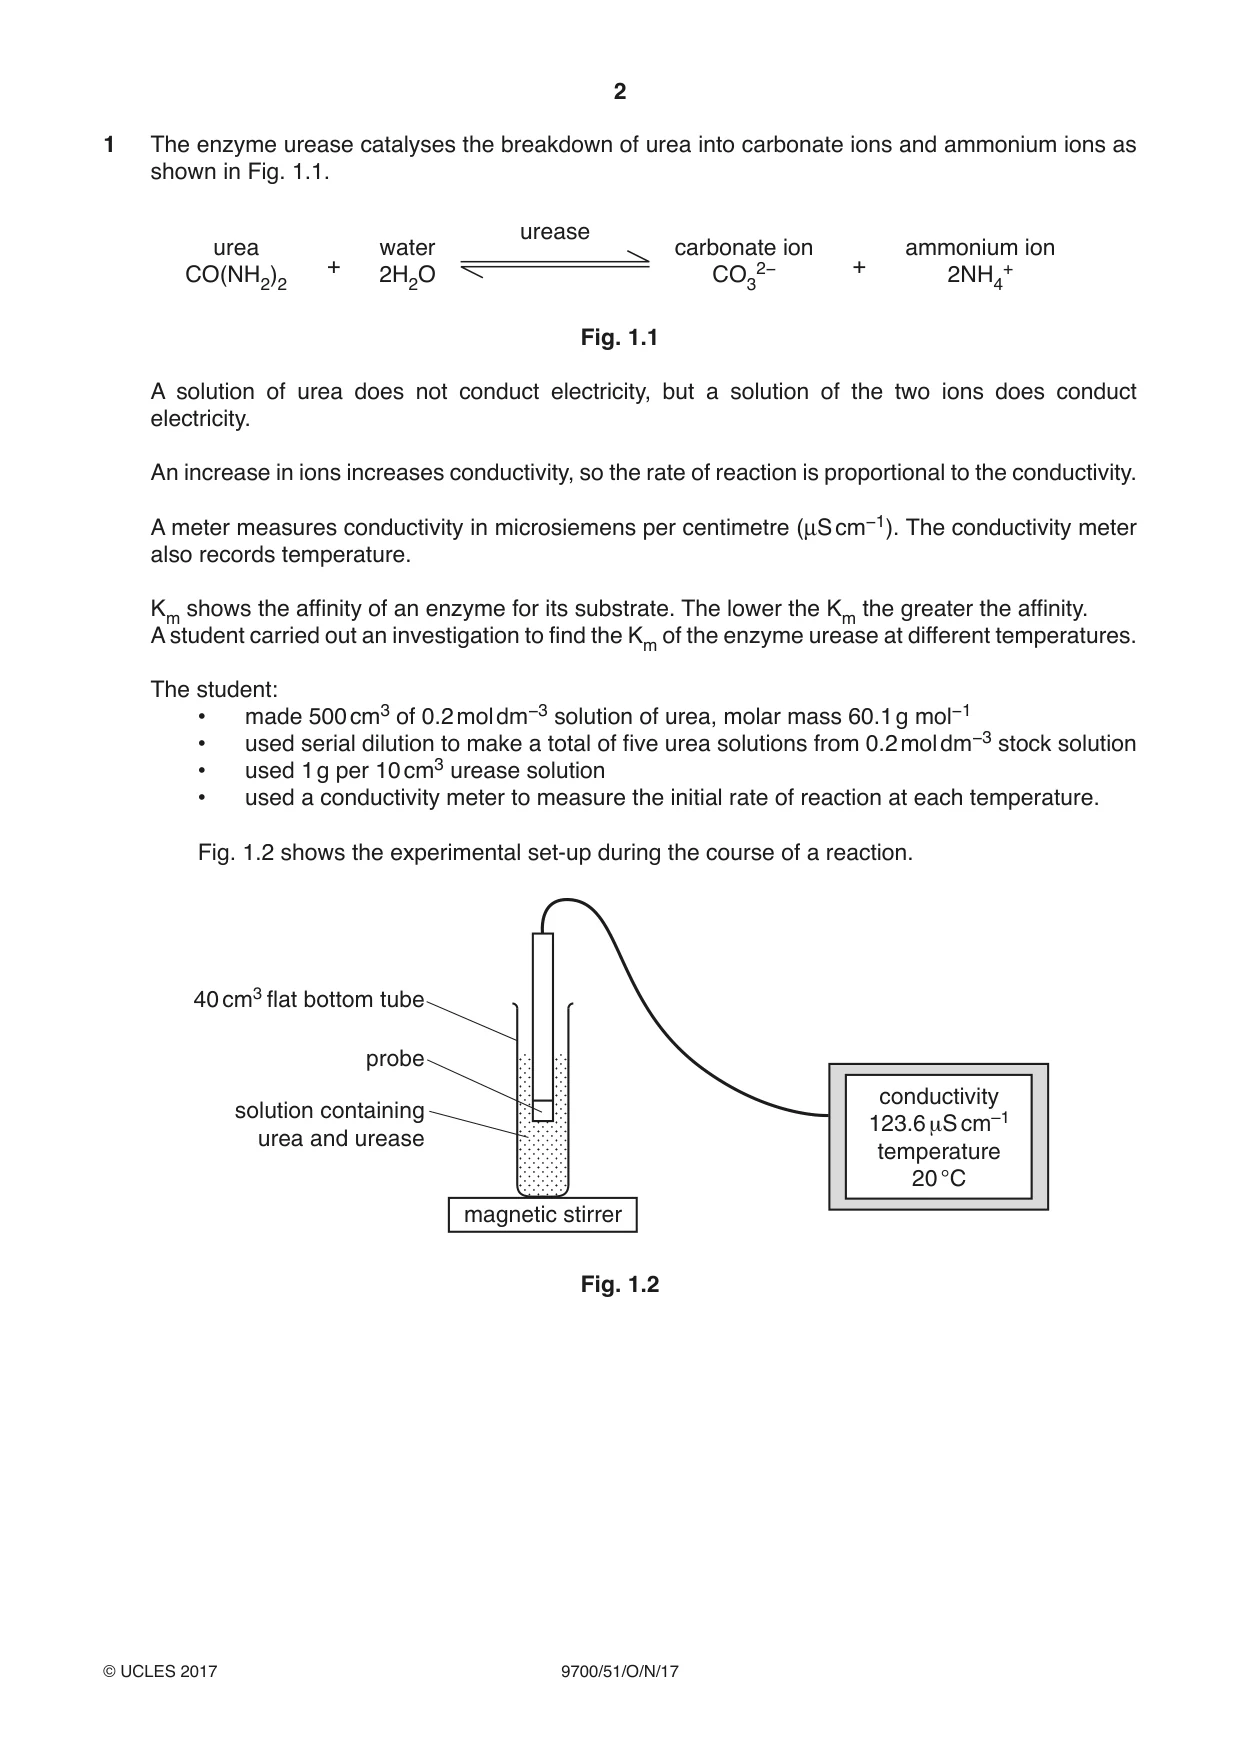
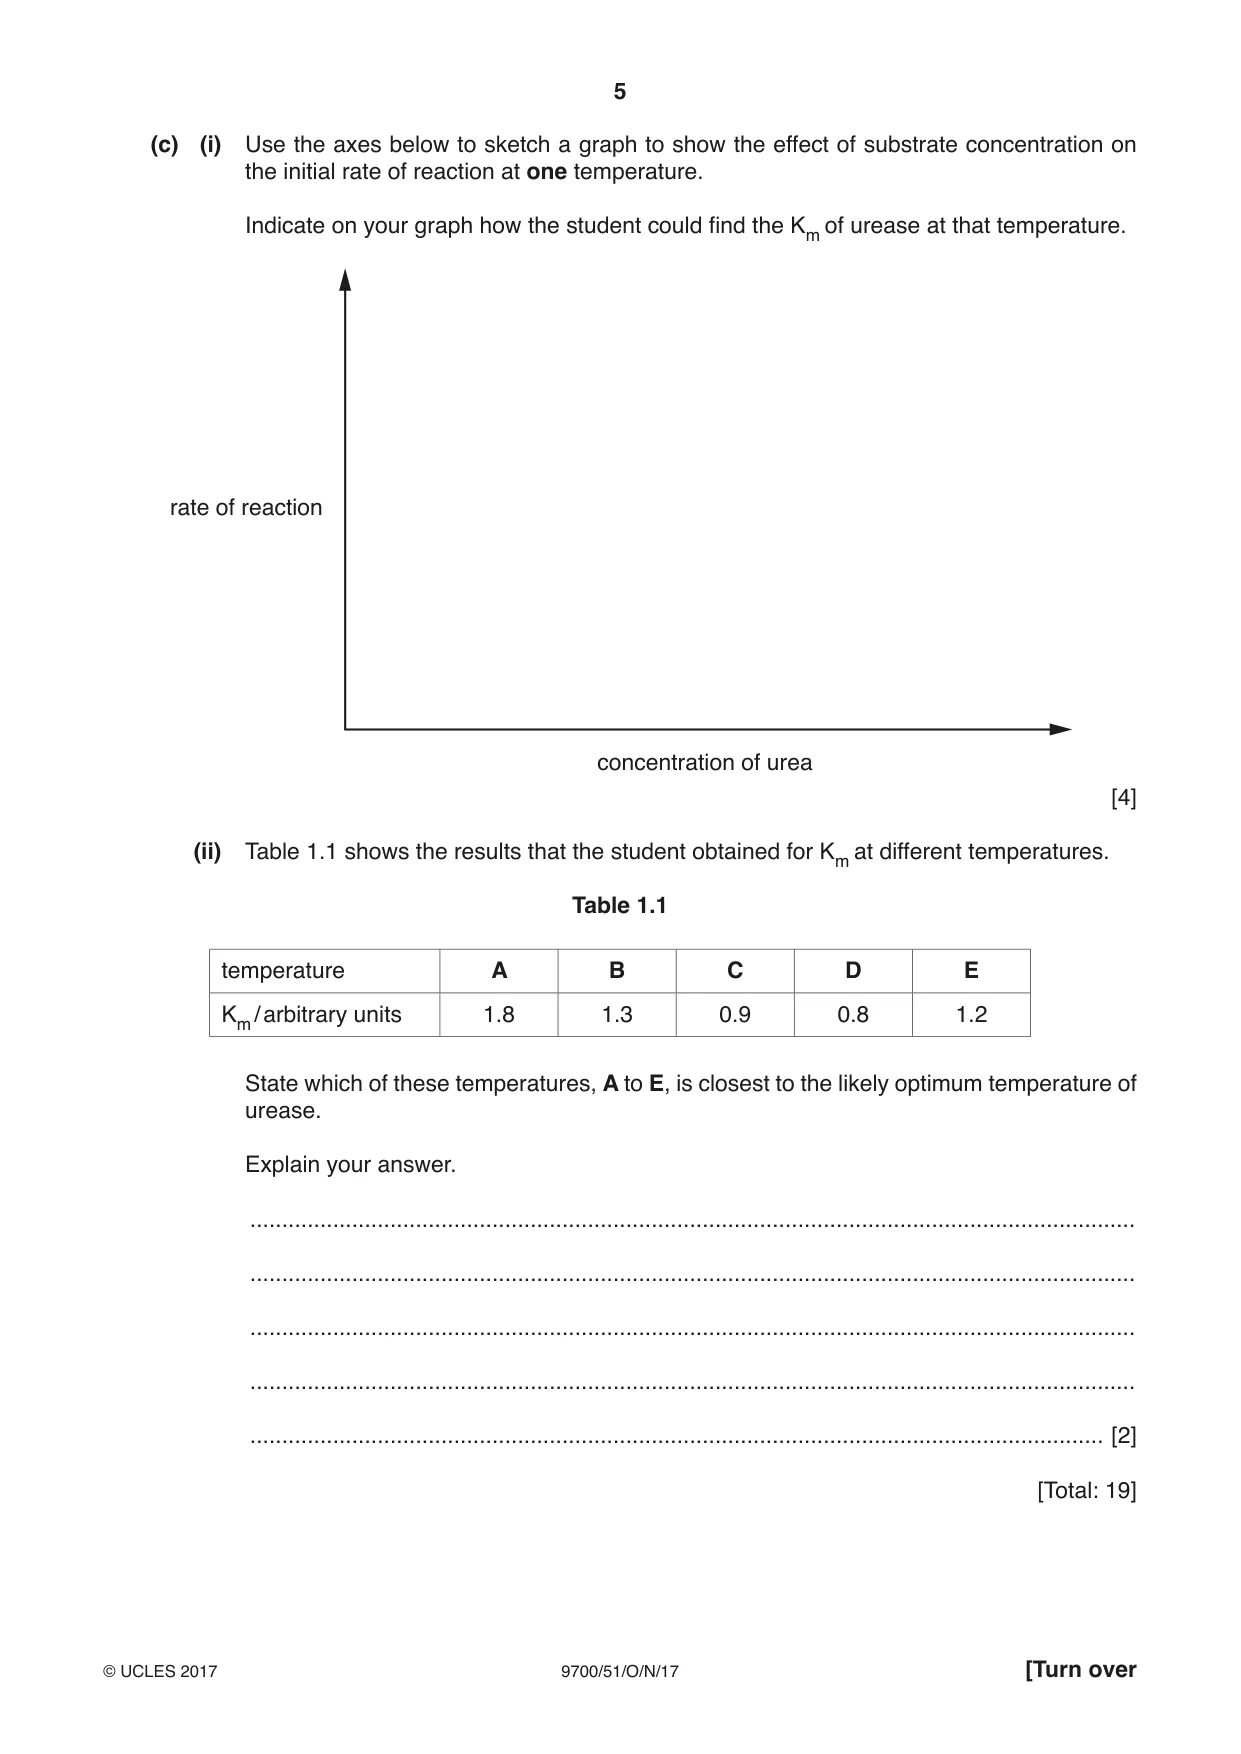
1 The enzyme urease catalyses the breakdown of urea into carbonate ions and ammonium ions as shown in Fig. 1.1. urease urea water carbonate ion ammonium ion + 2− + + CO(NH2)2 2H2O CO3 2NH4 Fig. 1.1 A solution of urea does not conduct electricity, but a solution of the two ions does conduct electricity. An increase in ions increases conductivity, so the rate of reaction is proportional to the conductivity. A meter measures conductivity in microsiemens per centimetre (μS cm−1). The conductivity meter also records temperature. Km shows the affinity of an enzyme for its substrate. The lower the Km the greater the affinity. A student carried out an investigation to find the Km of the enzyme urease at different temperatures. The student: • made 500 cm3 of 0.2 mol dm−3 solution of urea, molar mass 60.1 g mol−1 • used serial dilution to make a total of five urea solutions from 0.2 mol dm−3 stock solution • used 1 g per 10 cm3 urease solution • used a conductivity meter to measure the initial rate of reaction at each temperature. Fig. 1.2 shows the experimental set-up during the course of a reaction. 40 cm3 flat bottom tube probe conductivity solution containing 123.6 μS cm–1 urea and urease temperature 20 °C magnetic stirrer Fig. 1.2 (a) (i) Describe how the student could make 500 cm3 of 0.2 mol dm−3 solution of urea. ........................................................................................................................................... ........................................................................................................................................... ........................................................................................................................................... ........................................................................................................................................... ...................................................................................................................................... [2] (ii) Describe how the student made a further four solutions of urea by serial dilution. ........................................................................................................................................... ........................................................................................................................................... ........................................................................................................................................... ........................................................................................................................................... ........................................................................................................................................... ........................................................................................................................................... ........................................................................................................................................... ...................................................................................................................................... [2] (b) (i) Identify the independent and dependent variables in this investigation. independent ...................................................................................................................... dependent ......................................................................................................................... [2] (ii) Suggest a suitable control for this investigation. ........................................................................................................................................... ...................................................................................................................................... [1] (iii) Describe a method the student could use to find the Km value of urease at different temperatures. The solutions were made as described in (a)(i) and (a)(ii) and the apparatus shown in Fig. 1.2 was used. Your method should be set out in a logical way and be detailed enough to let another person follow it. You should not include details of how to prepare the urea or urease solutions. ........................................................................................................................................... ........................................................................................................................................... ........................................................................................................................................... ........................................................................................................................................... ........................................................................................................................................... ........................................................................................................................................... ........................................................................................................................................... ........................................................................................................................................... ........................................................................................................................................... ........................................................................................................................................... ........................................................................................................................................... ........................................................................................................................................... ........................................................................................................................................... ........................................................................................................................................... ........................................................................................................................................... ........................................................................................................................................... ........................................................................................................................................... ........................................................................................................................................... ........................................................................................................................................... ........................................................................................................................................... ........................................................................................................................................... ........................................................................................................................................... ........................................................................................................................................... ...................................................................................................................................... [6] (c) (i) Use the axes below to sketch a graph to show the effect of substrate concentration on the initial rate of reaction at one temperature. Indicate on your graph how the student could find the Km of urease at that temperature. rate of reaction concentration of urea [4] (ii) Table 1.1 shows the results that the student obtained for Km at different temperatures. Table 1.1 temperature A B C D E Km / arbitrary units 1.8 1.3 0.9 0.8 1.2 State which of these temperatures, A to E, is closest to the likely optimum temperature of urease. Explain your answer. ........................................................................................................................................... ........................................................................................................................................... ........................................................................................................................................... ........................................................................................................................................... ...................................................................................................................................... [2] [Total: 19]
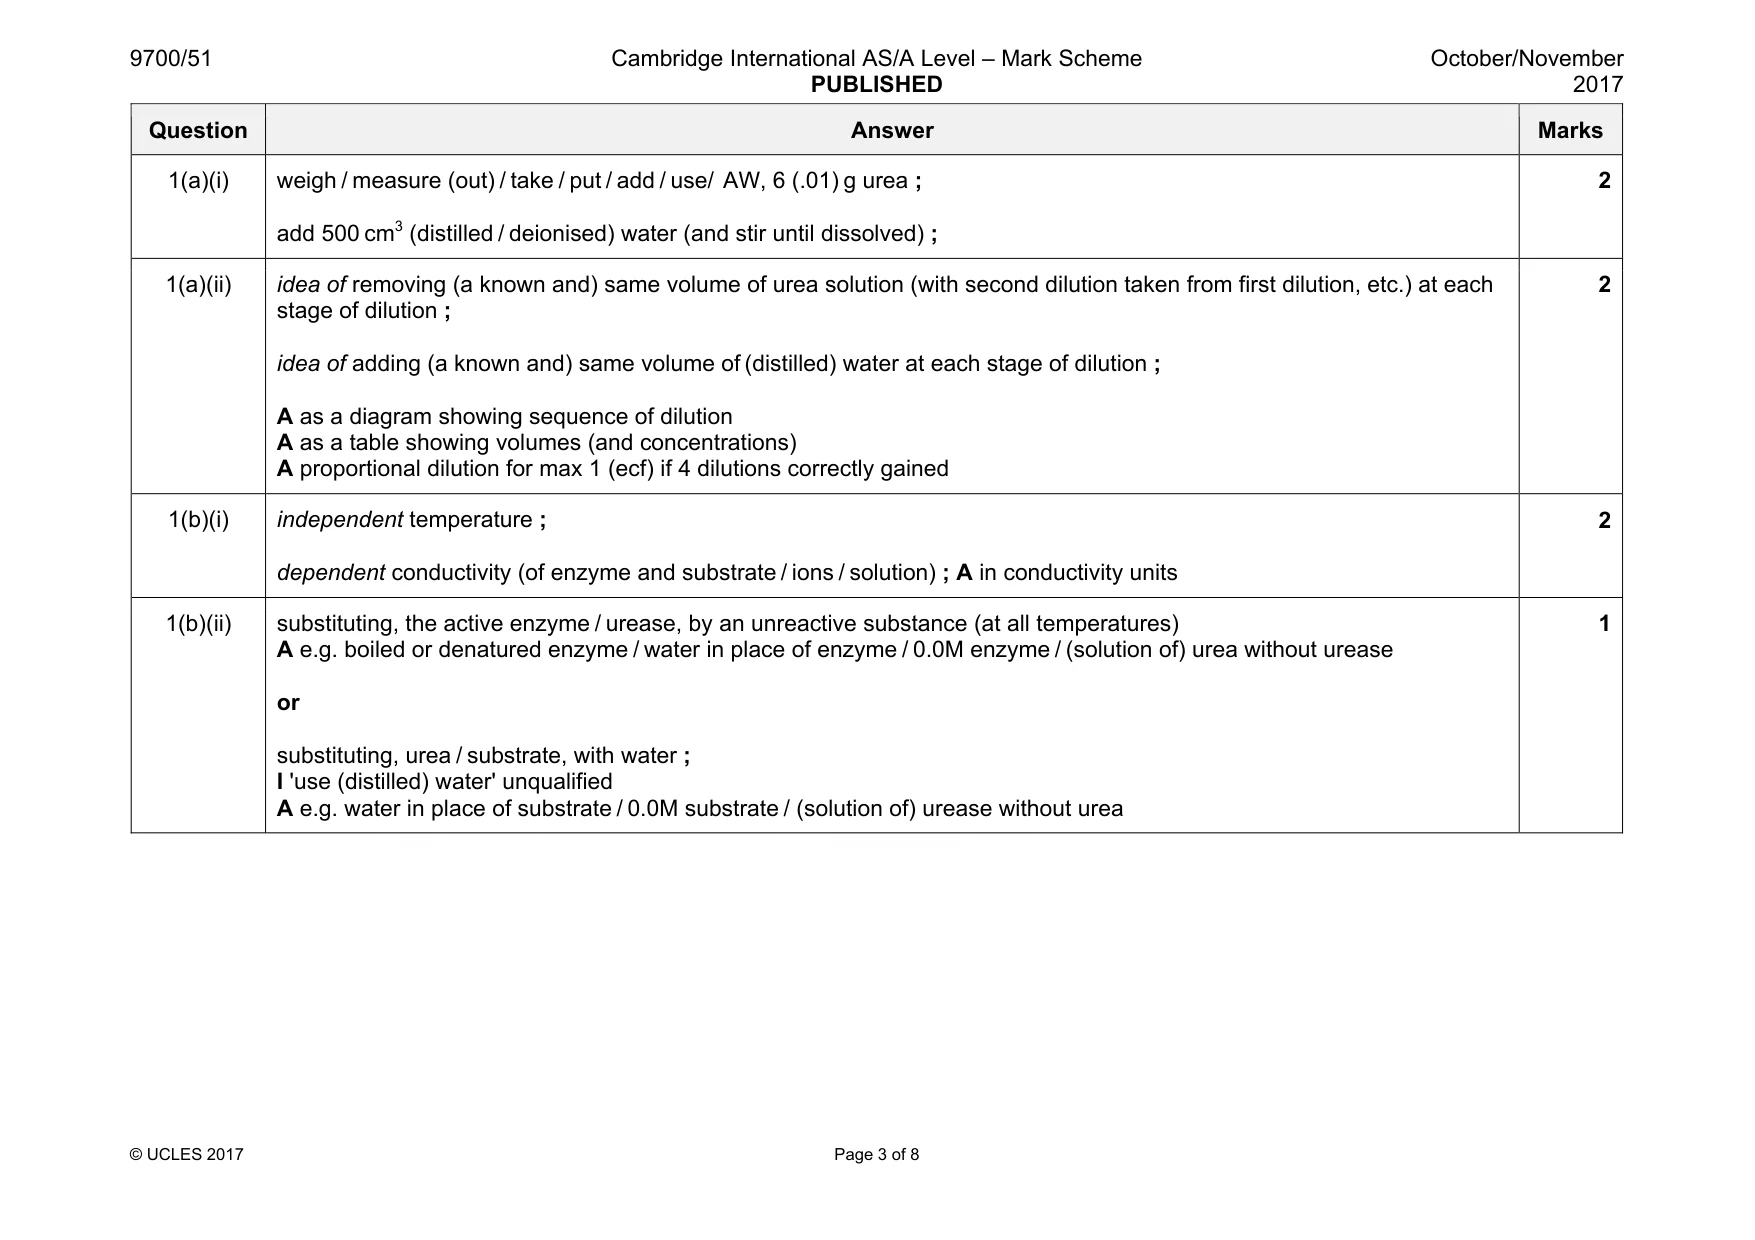
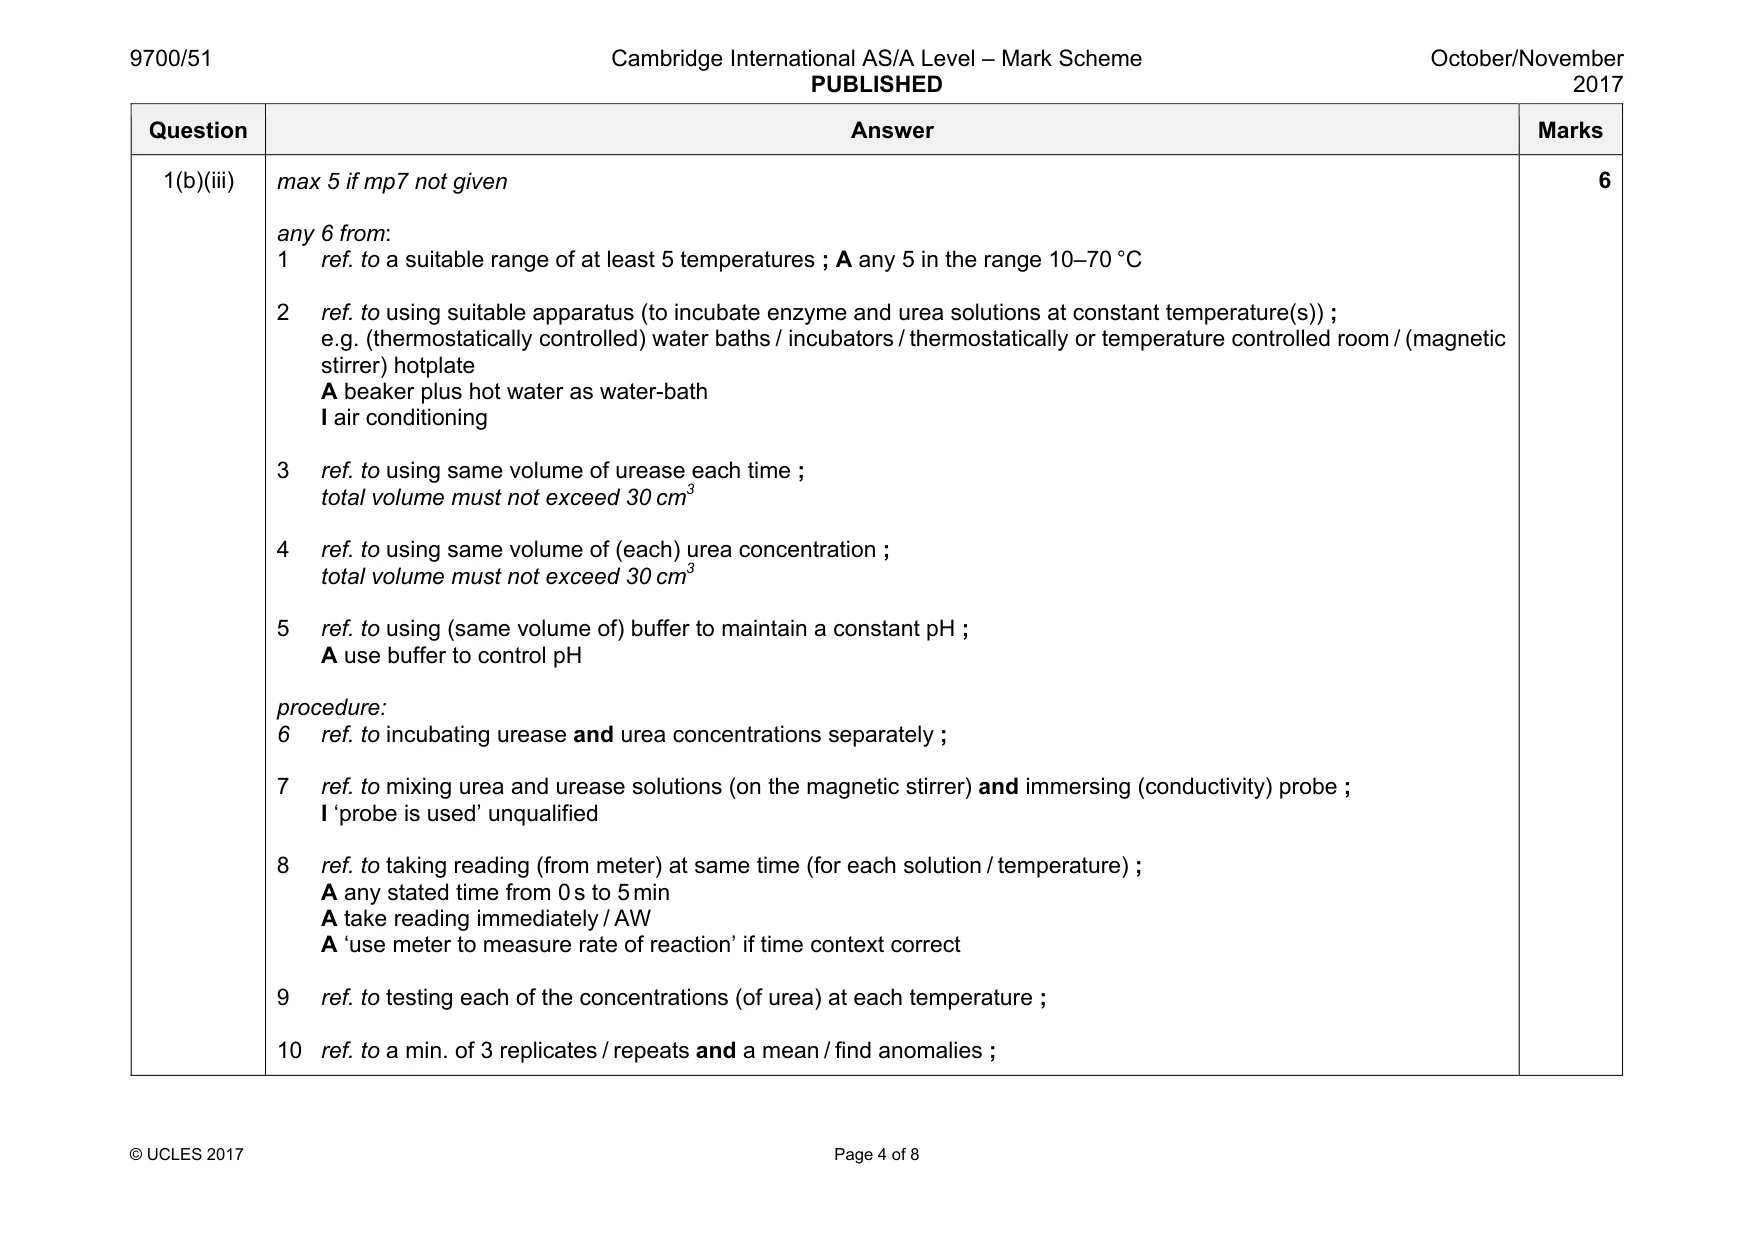
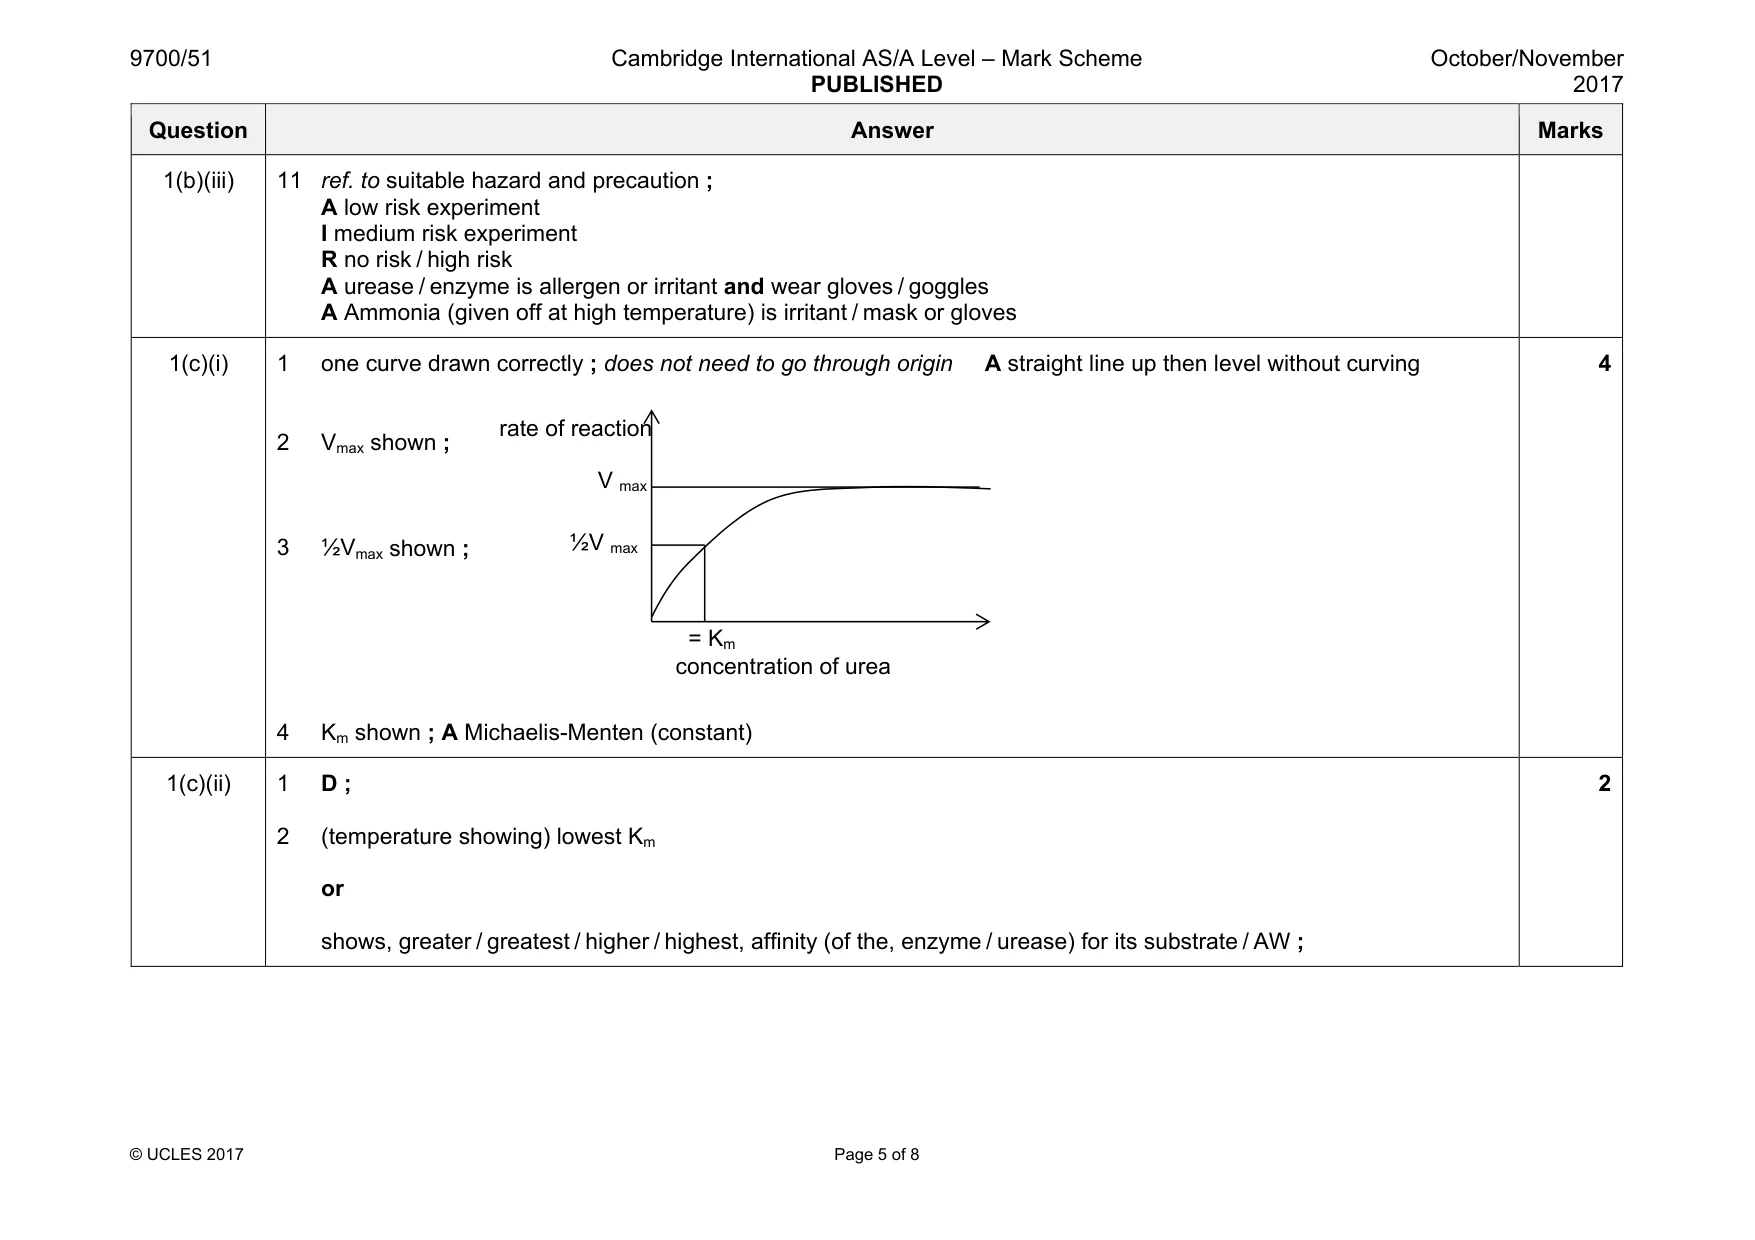
Mark scheme: 1(a)(i) weigh / measure (out) / take / put / add / use/ AW, 6 (.01) g urea ; add 500 cm3 (distilled / deionised) water (and stir until dissolved) ; 2 1(a)(ii) idea of removing (a known and) same volume of urea solution (with second dilution taken from first dilution, etc.) at each stage of dilution ; idea of adding (a known and) same volume of (distilled) water at each stage of dilution ; A as a diagram showing sequence of dilution A as a table showing volumes (and concentrations) A proportional dilution for max 1 (ecf) if 4 dilutions correctly gained 2 1(b)(i) independent temperature ; dependent conductivity (of enzyme and substrate / ions / solution) ; A in conductivity units 2 1(b)(ii) substituting, the active enzyme / urease, by an unreactive substance (at all temperatures) A e.g. boiled or denatured enzyme / water in place of enzyme / 0.0M enzyme / (solution of) urea without urease or substituting, urea / substrate, with water ; I 'use (distilled) water' unqualified A e.g. water in place of substrate / 0.0M substrate / (solution of) urease without urea 1 Question Answer Marks 1(b)(iii) max 5 if mp7 not given any 6 from: 1 ref. to a suitable range of at least 5 temperatures ; A any 5 in the range 10–70 °C 2 ref. to using suitable apparatus (to incubate enzyme and urea solutions at constant temperature(s)) ; e.g. (thermostatically controlled) water baths / incubators / thermostatically or temperature controlled room / (magnetic stirrer) hotplate A beaker plus hot water as water-bath I air conditioning 3 ref. to using same volume of urease each time ; total volume must not exceed 30 cm3 4 ref. to using same volume of (each) urea concentration ; total volume must not exceed 30 cm3 5 ref. to using (same volume of) buffer to maintain a constant pH ; A use buffer to control pH procedure: 6 ref. to incubating urease and urea concentrations separately ; 7 ref. to mixing urea and urease solutions (on the magnetic stirrer) and immersing (conductivity) probe ; I ‘probe is used’ unqualified 8 ref. to taking reading (from meter) at same time (for each solution / temperature) ; A any stated time from 0 s to 5 min A take reading immediately / AW A ‘use meter to measure rate of reaction’ if time context correct 9 ref. to testing each of the concentrations (of urea) at each temperature ; 10 ref. to a min. of 3 replicates / repeats and a mean / find anomalies ; 6 Question Answer Marks 1(b)(iii) 11 ref. to suitable hazard and precaution ; A low risk experiment I medium risk experiment R no risk / high risk A urease / enzyme is allergen or irritant and wear gloves / goggles A Ammonia (given off at high temperature) is irritant / mask or gloves 1(c)(i) 1 one curve drawn correctly ; does not need to go through origin A straight line up then level without curving 2 Vmax shown ; 3 ½Vmax shown ; 4 Km shown ; A Michaelis-Menten (constant) 4 1(c)(ii) 1 D ; 2 (temperature showing) lowest Km or shows, greater / greatest / higher / highest, affinity (of the, enzyme / urease) for its substrate / AW ; 2 rate of reaction concentration of urea V max ½V max = Km
Q2 · Barley is often grown in soils that are high in salt (sodium chloride)
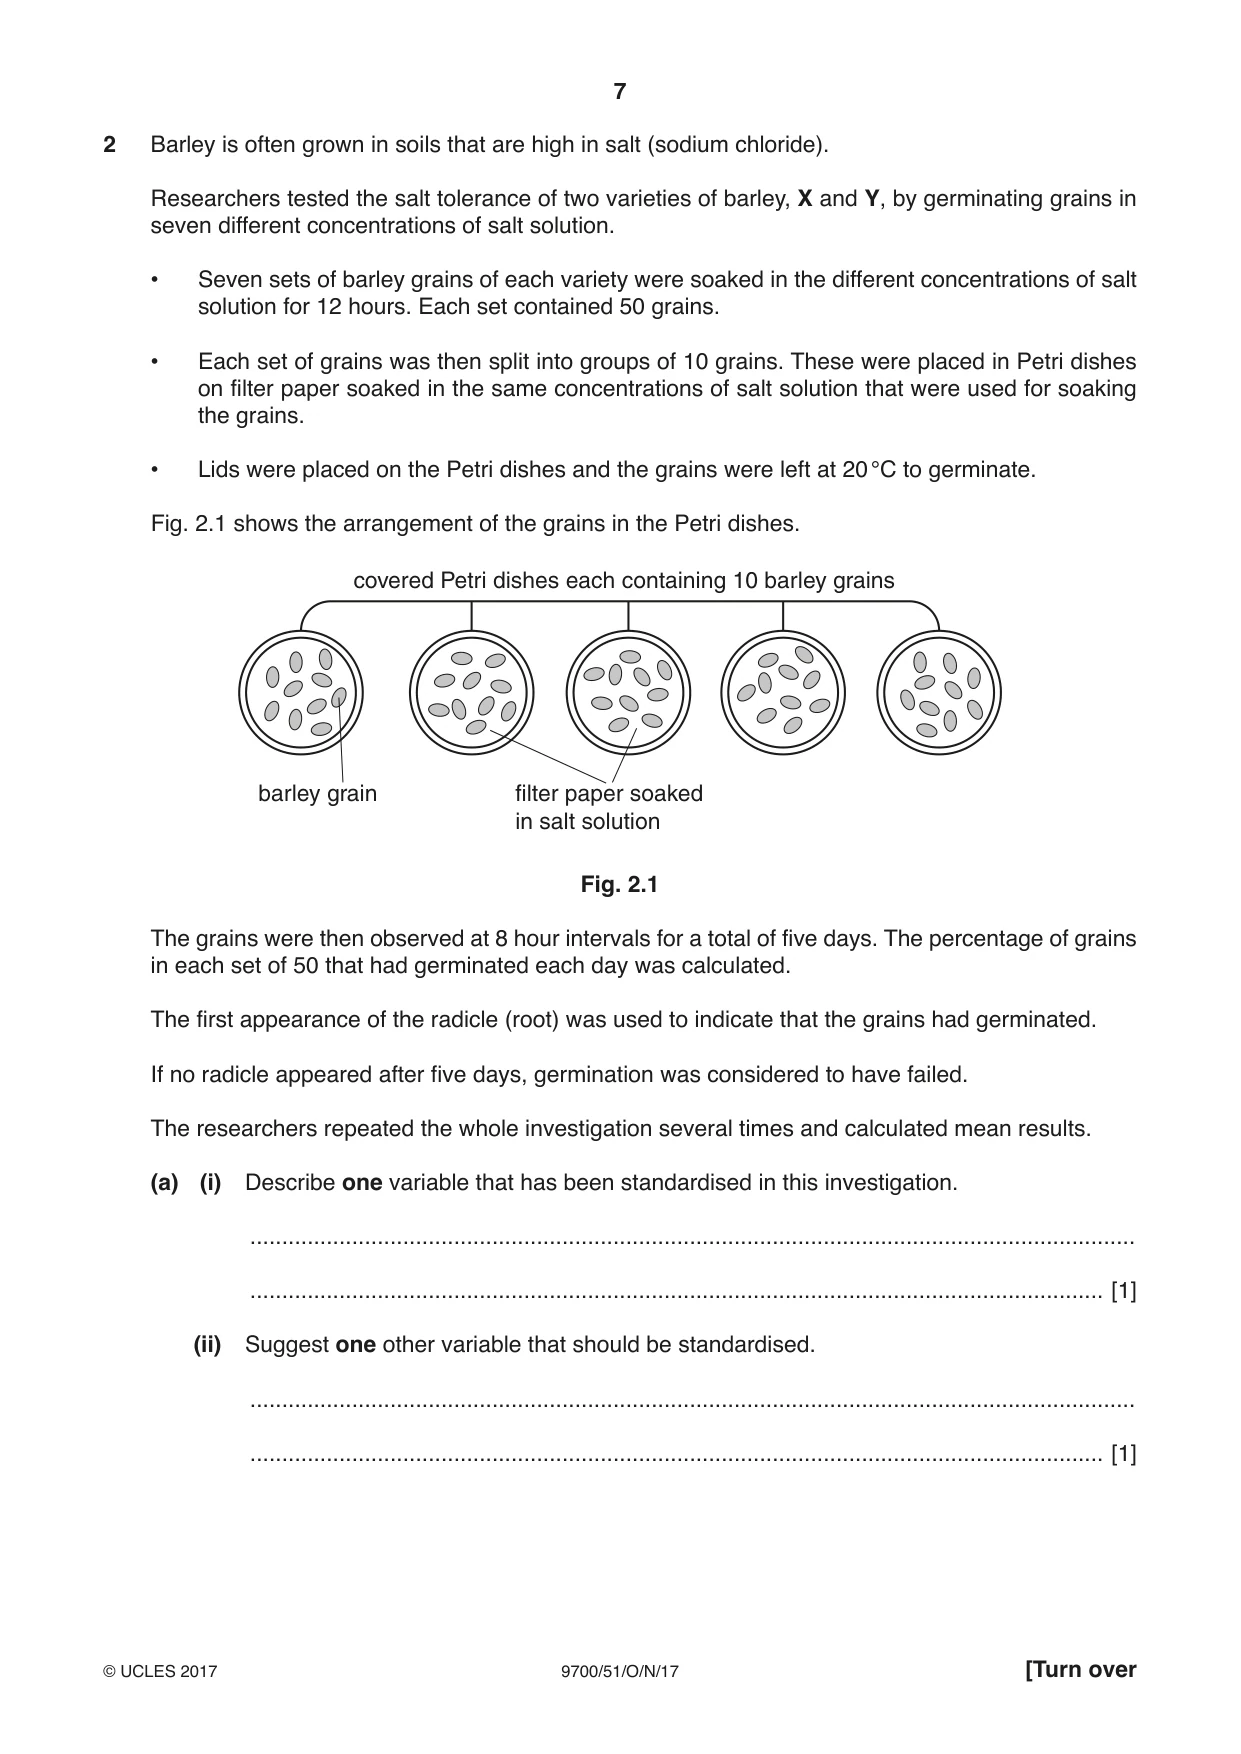
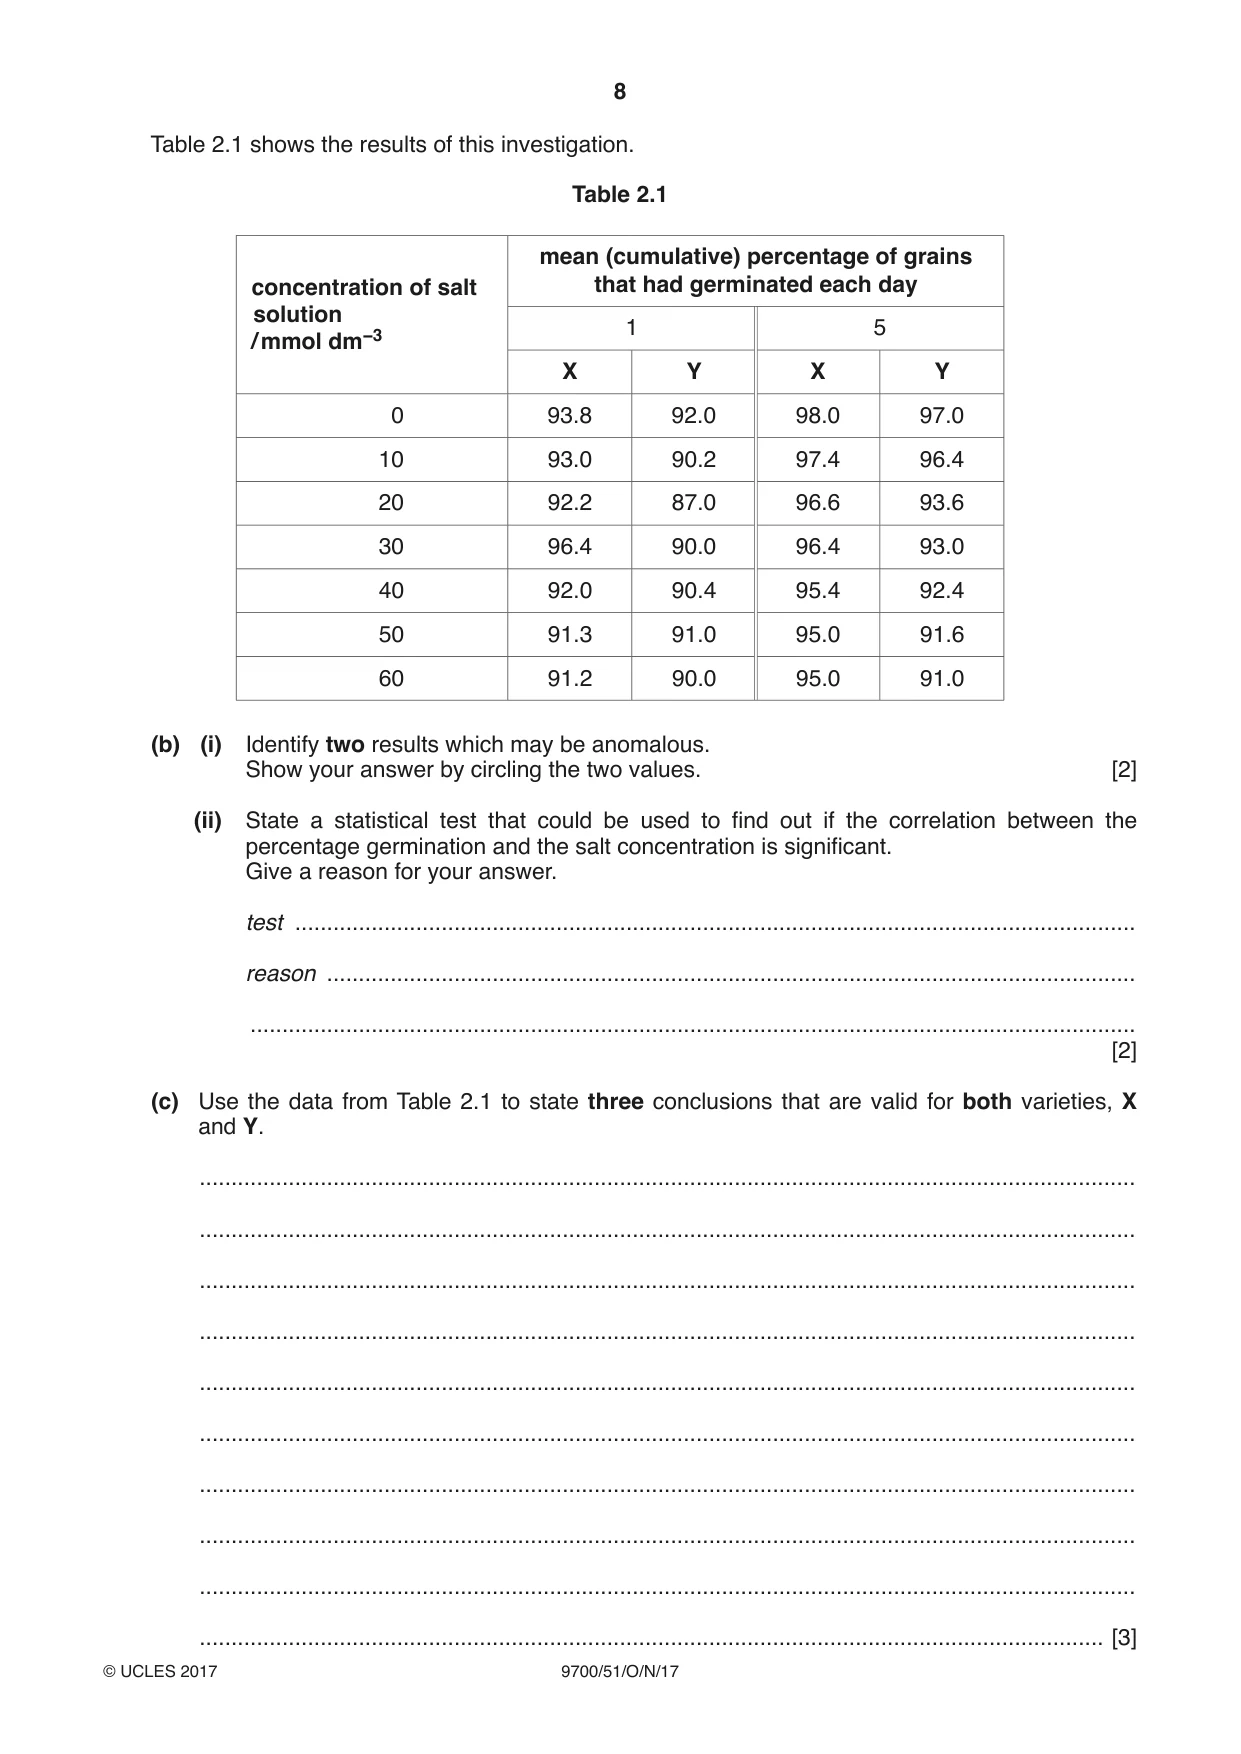
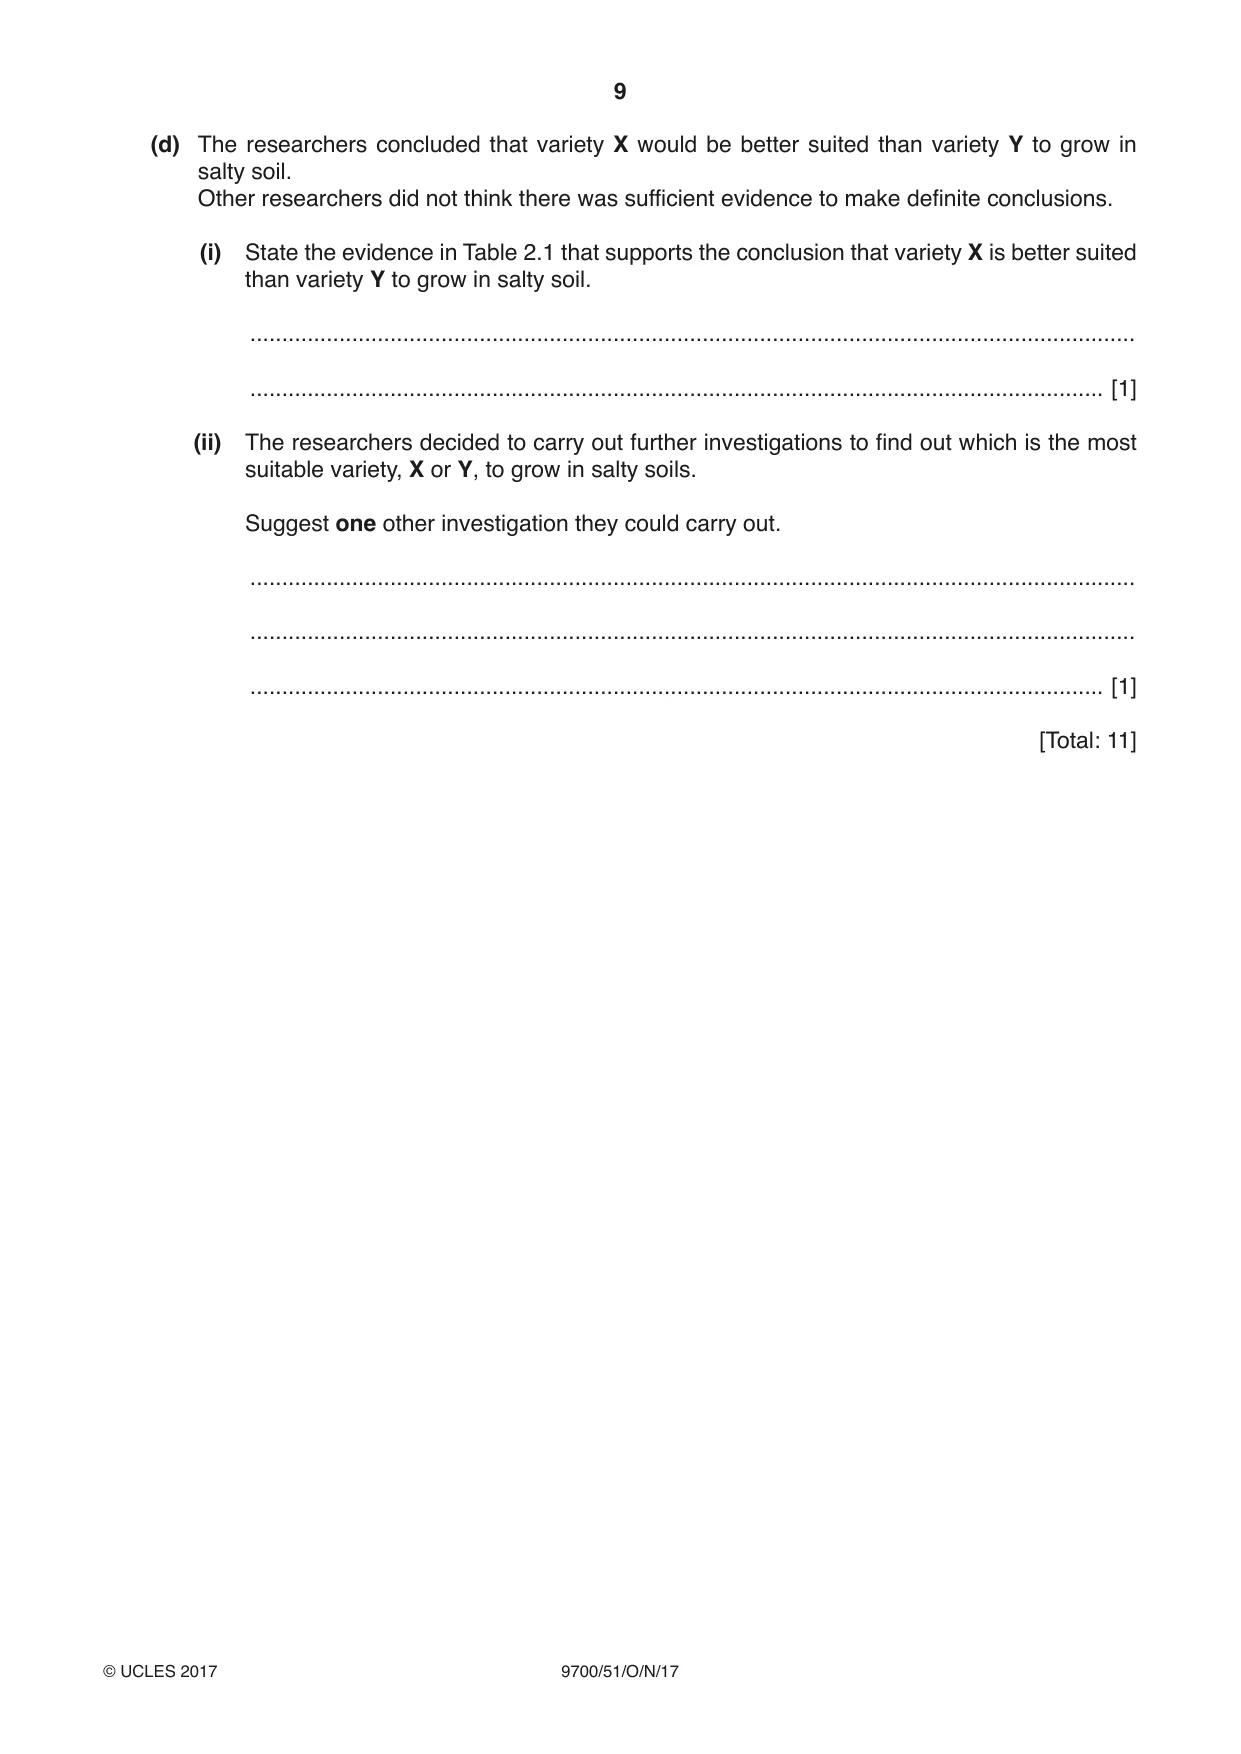
2 Barley is often grown in soils that are high in salt (sodium chloride). Researchers tested the salt tolerance of two varieties of barley, X and Y, by germinating grains in seven different concentrations of salt solution. • Seven sets of barley grains of each variety were soaked in the different concentrations of salt solution for 12 hours. Each set contained 50 grains. • Each set of grains was then split into groups of 10 grains. These were placed in Petri dishes on filter paper soaked in the same concentrations of salt solution that were used for soaking the grains. • Lids were placed on the Petri dishes and the grains were left at 20 °C to germinate. Fig. 2.1 shows the arrangement of the grains in the Petri dishes. covered Petri dishes each containing 10 barley grains barley grain filter paper soaked in salt solution Fig. 2.1 The grains were then observed at 8 hour intervals for a total of five days. The percentage of grains in each set of 50 that had germinated each day was calculated. The first appearance of the radicle (root) was used to indicate that the grains had germinated. If no radicle appeared after five days, germination was considered to have failed. The researchers repeated the whole investigation several times and calculated mean results. (a) (i) Describe one variable that has been standardised in this investigation. ........................................................................................................................................... ...................................................................................................................................... [1] (ii) Suggest one other variable that should be standardised. ........................................................................................................................................... ...................................................................................................................................... [1] Table 2.1 shows the results of this investigation. Table 2.1 mean (cumulative) percentage of grains concentration of salt that had germinated each day solution 1 5 / mmol dm−3 X Y X Y 0 93.8 92.0 98.0 97.0 10 93.0 90.2 97.4 96.4 20 92.2 87.0 96.6 93.6 30 96.4 90.0 96.4 93.0 40 92.0 90.4 95.4 92.4 50 91.3 91.0 95.0 91.6 60 91.2 90.0 95.0 91.0 (b) (i) Identify two results which may be anomalous. Show your answer by circling the two values. [2] (ii) State a statistical test that could be used to find out if the correlation between the percentage germination and the salt concentration is significant. Give a reason for your answer. test .................................................................................................................................... reason ............................................................................................................................... ........................................................................................................................................... [2] (c) Use the data from Table 2.1 to state three conclusions that are valid for both varieties, X and Y. ................................................................................................................................................... ................................................................................................................................................... ................................................................................................................................................... ................................................................................................................................................... ................................................................................................................................................... ................................................................................................................................................... ................................................................................................................................................... ................................................................................................................................................... ................................................................................................................................................... .............................................................................................................................................. [3] (d) The researchers concluded that variety X would be better suited than variety Y to grow in salty soil. Other researchers did not think there was sufficient evidence to make definite conclusions. (i) State the evidence in Table 2.1 that supports the conclusion that variety X is better suited than variety Y to grow in salty soil. ........................................................................................................................................... ...................................................................................................................................... [1] (ii) The researchers decided to carry out further investigations to find out which is the most suitable variety, X or Y, to grow in salty soils. Suggest one other investigation they could carry out. ........................................................................................................................................... ........................................................................................................................................... ...................................................................................................................................... [1] [Total: 11]
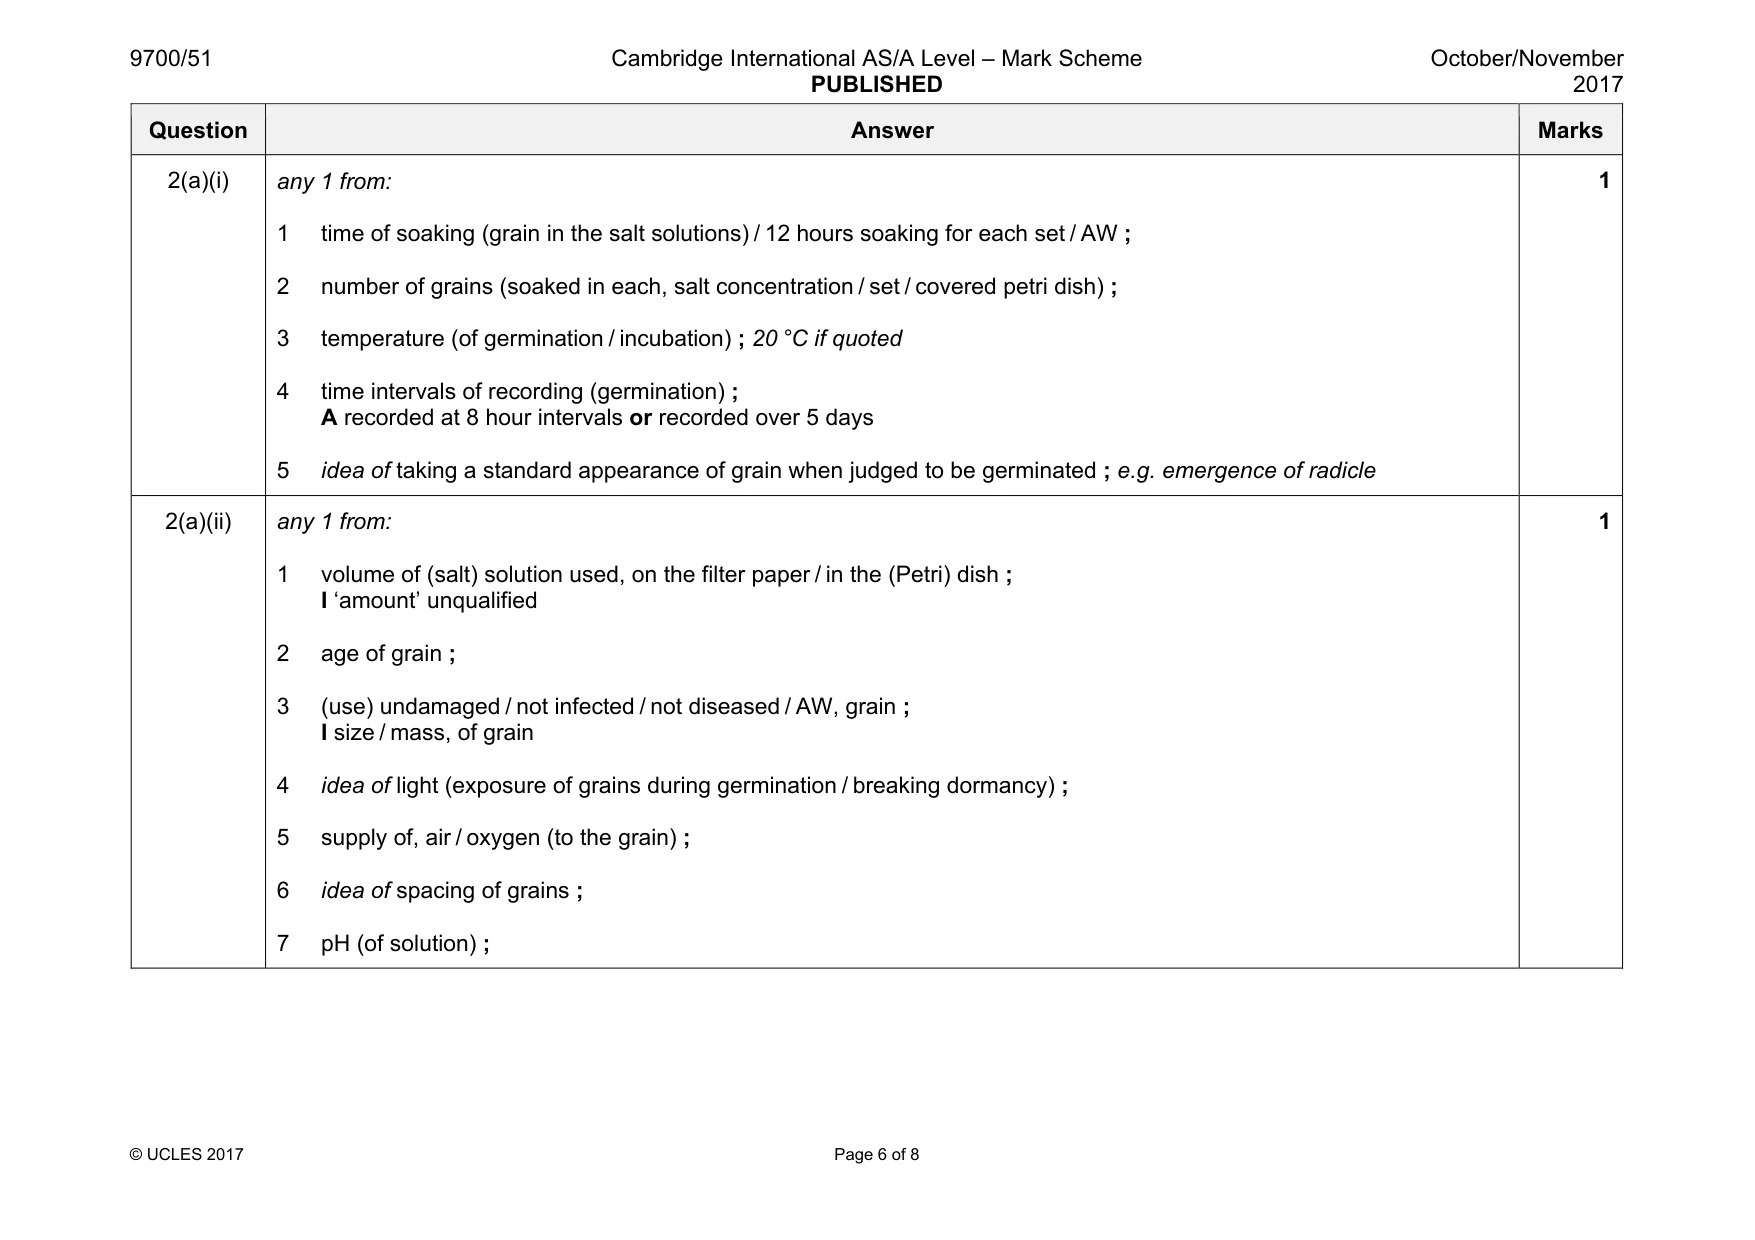
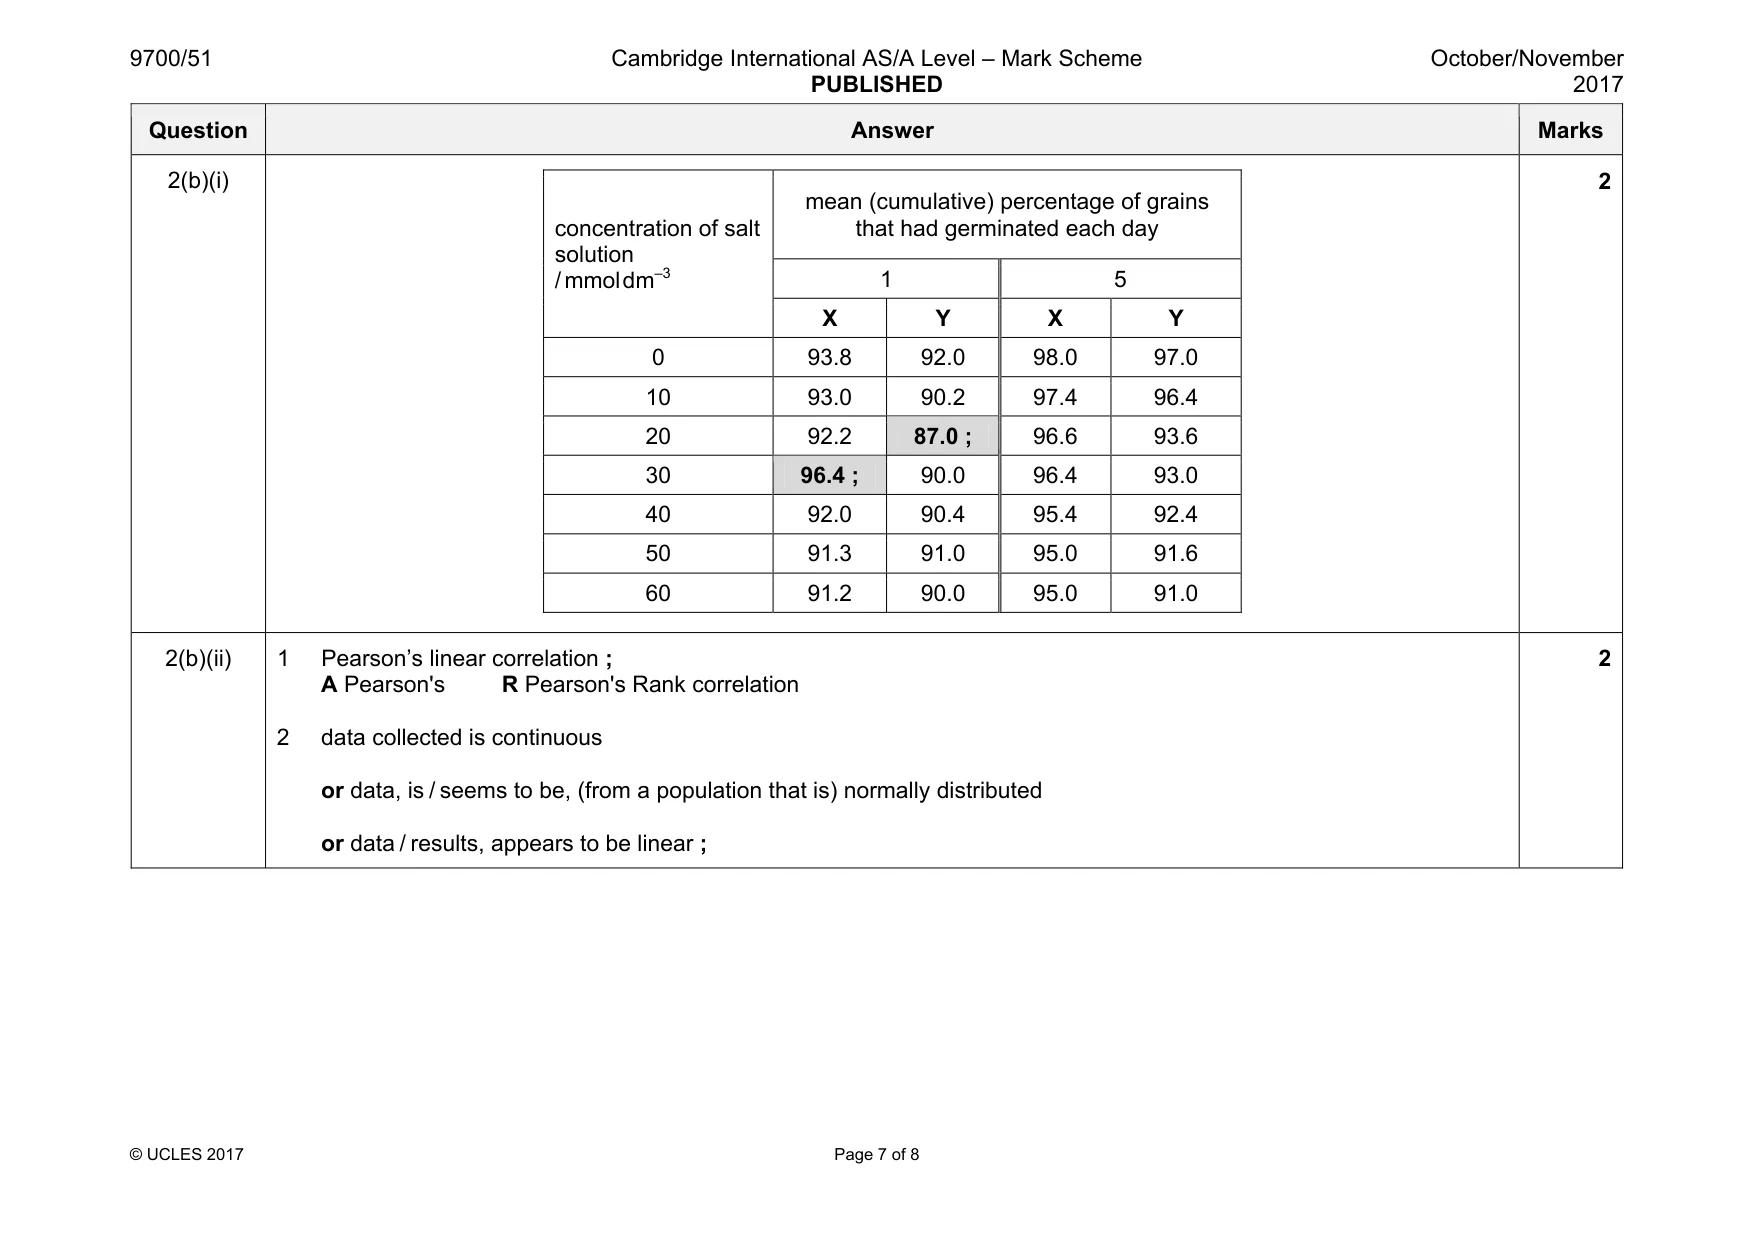
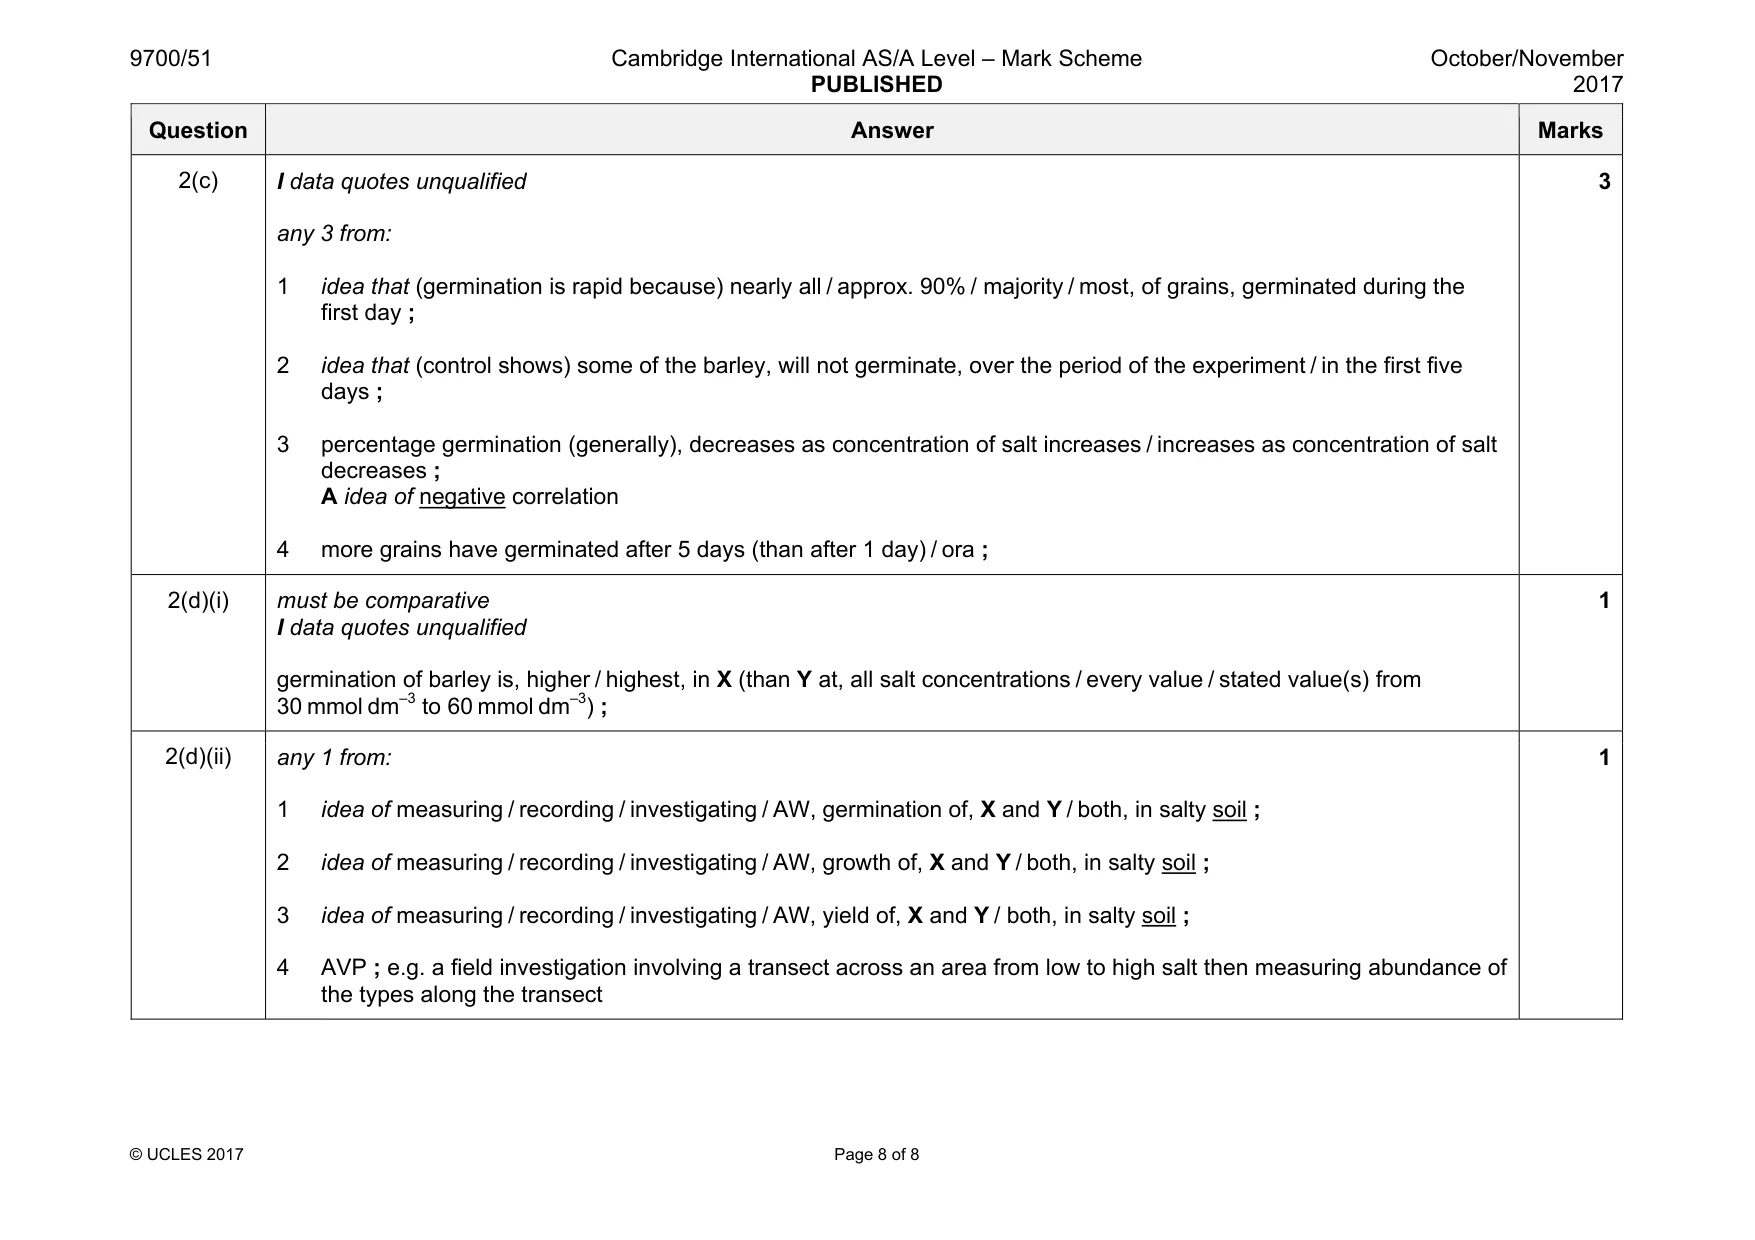
Mark scheme: 2(a)(i) any 1 from: 1 time of soaking (grain in the salt solutions) / 12 hours soaking for each set / AW ; 2 number of grains (soaked in each, salt concentration / set / covered petri dish) ; 3 temperature (of germination / incubation) ; 20 °C if quoted 4 time intervals of recording (germination) ; A recorded at 8 hour intervals or recorded over 5 days 5 idea of taking a standard appearance of grain when judged to be germinated ; e.g. emergence of radicle 1 2(a)(ii) any 1 from: 1 volume of (salt) solution used, on the filter paper / in the (Petri) dish ; I ‘amount’ unqualified 2 age of grain ; 3 (use) undamaged / not infected / not diseased / AW, grain ; I size / mass, of grain 4 idea of light (exposure of grains during germination / breaking dormancy) ; 5 supply of, air / oxygen (to the grain) ; 6 idea of spacing of grains ; 7 pH (of solution) ; 1 Question Answer Marks 2(b)(i) concentration of salt solution / mmol dm–3 mean (cumulative) percentage of grains that had germinated each day 1 5 X Y X Y 0 93.8 92.0 98.0 97.0 10 93.0 90.2 97.4 96.4 20 92.2 87.0 ; 96.6 93.6 30 96.4 ; 90.0 96.4 93.0 40 92.0 90.4 95.4 92.4 50 91.3 91.0 95.0 91.6 60 91.2 90.0 95.0 91.0 2 2(b)(ii) 1 Pearson’s linear correlation ; A Pearson's R Pearson's Rank correlation 2 data collected is continuous or data, is / seems to be, (from a population that is) normally distributed or data / results, appears to be linear ; 2 Question Answer Marks 2(c) I data quotes unqualified any 3 from: 1 idea that (germination is rapid because) nearly all / approx. 90% / majority / most, of grains, germinated during the first day ; 2 idea that (control shows) some of the barley, will not germinate, over the period of the experiment / in the first five days ; 3 percentage germination (generally), decreases as concentration of salt increases / increases as concentration of salt decreases ; A idea of negative correlation 4 more grains have germinated after 5 days (than after 1 day) / ora ; 3 2(d)(i) must be comparative I data quotes unqualified germination of barley is, higher / highest, in X (than Y at, all salt concentrations / every value / stated value(s) from 30 mmol dm–3 to 60 mmol dm–3) ; 1 2(d)(ii) any 1 from: 1 idea of measuring / recording / investigating / AW, germination of, X and Y / both, in salty soil ; 2 idea of measuring / recording / investigating / AW, growth of, X and Y / both, in salty soil ; 3 idea of measuring / recording / investigating / AW, yield of, X and Y / both, in salty soil ; 4 AVP ; e.g. a field investigation involving a transect across an area from low to high salt then measuring abundance of the types along the transect 1
What was in this paper
The subtopics covered by these 2 questions, and how many questions each got. Open one in a new tab to see every Cambridge question on it.
What you needed in this session
Cambridge’s own grade thresholds for 2017 Oct/Nov, Paper 5 · Variant 1. A higher threshold means an easier paper — the bar moves with how the cohort did.