Cambridge A Level Biology 9700 — 2017 May/June Paper 5 · Variant 2
9700/52/M/J/17 · 3 questions · 30 marks · ≈34 min
The question paper and its mark scheme, free to read here and free to download. This is Cambridge’s own paper, exactly as it was sat.
Question paper12 pages



Mark scheme8 pages
Answers below. Sit the paper first if you are practising.
Questions as text
Q1 · An aquatic crustacean belonging to the genus Daphnia
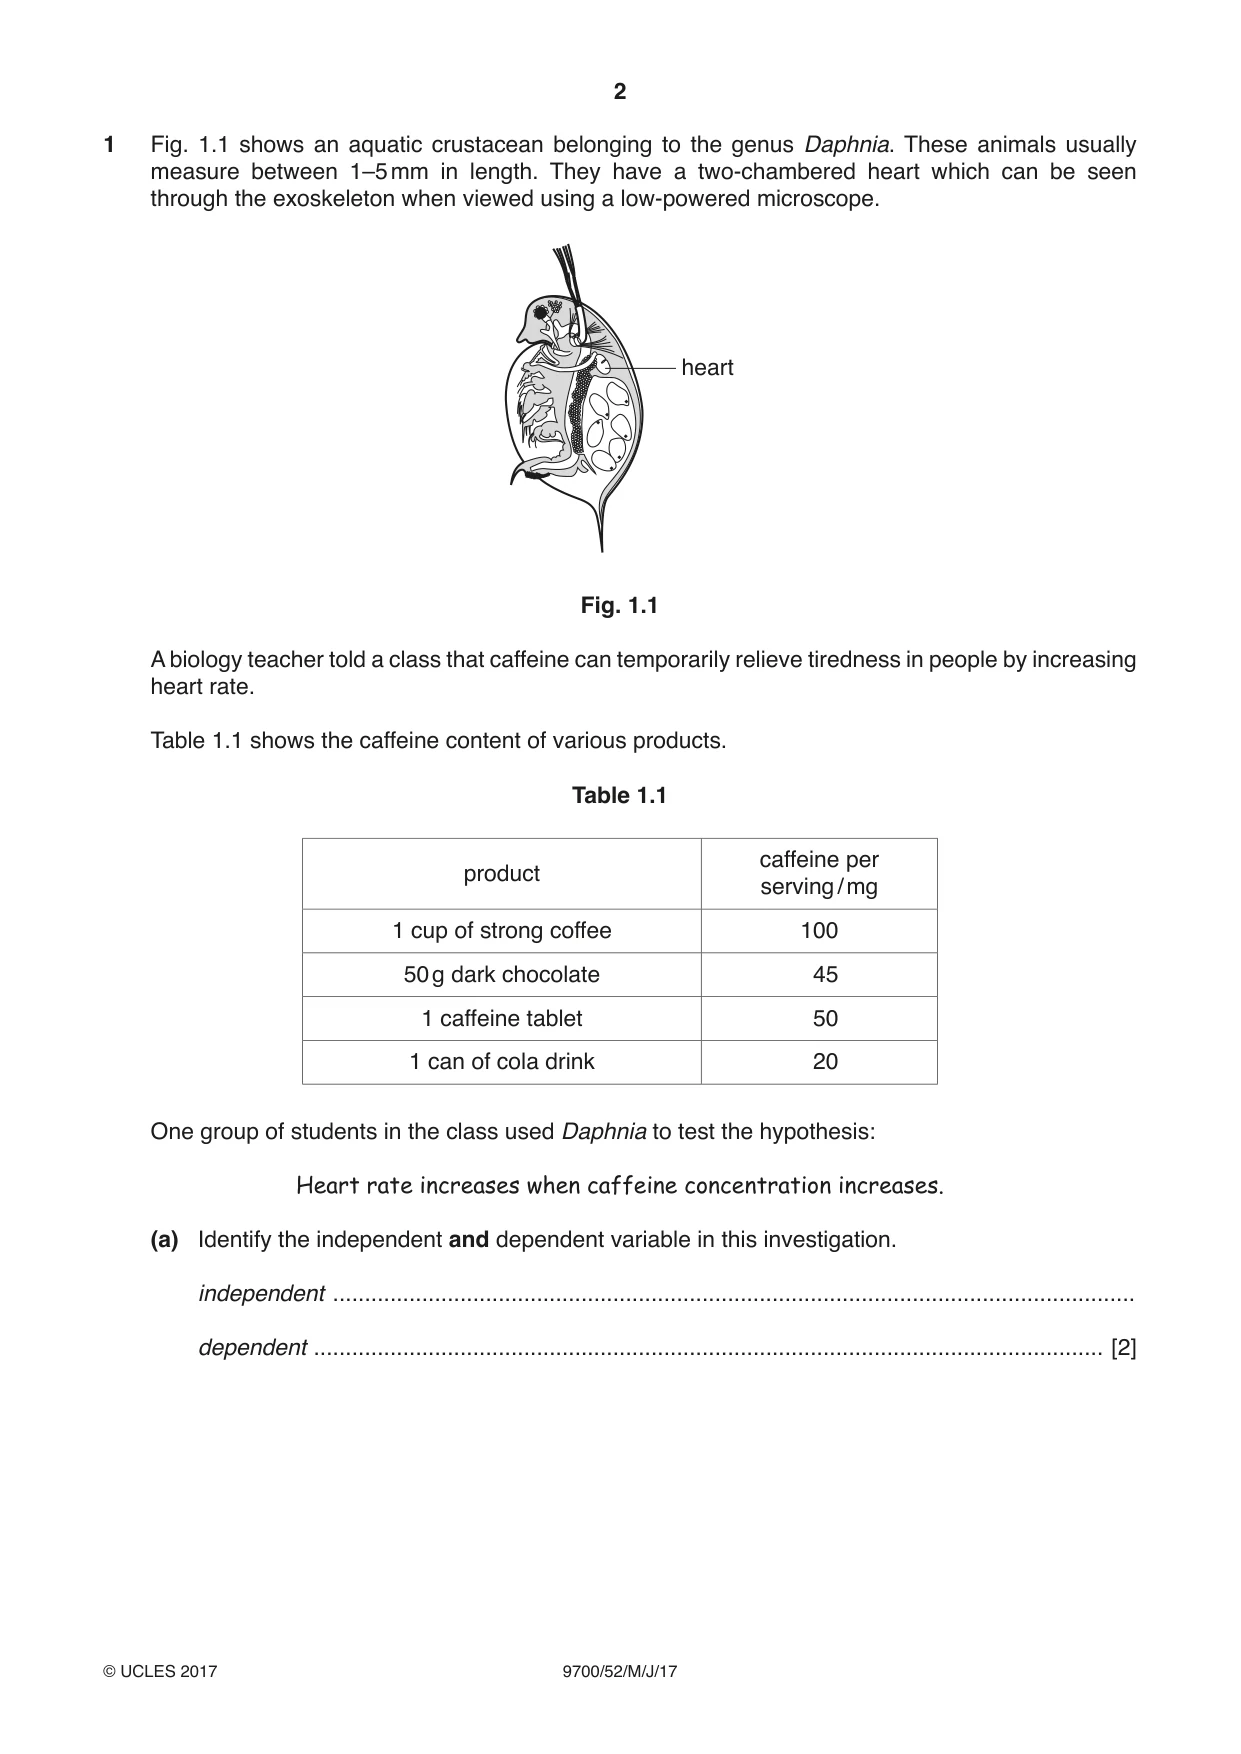
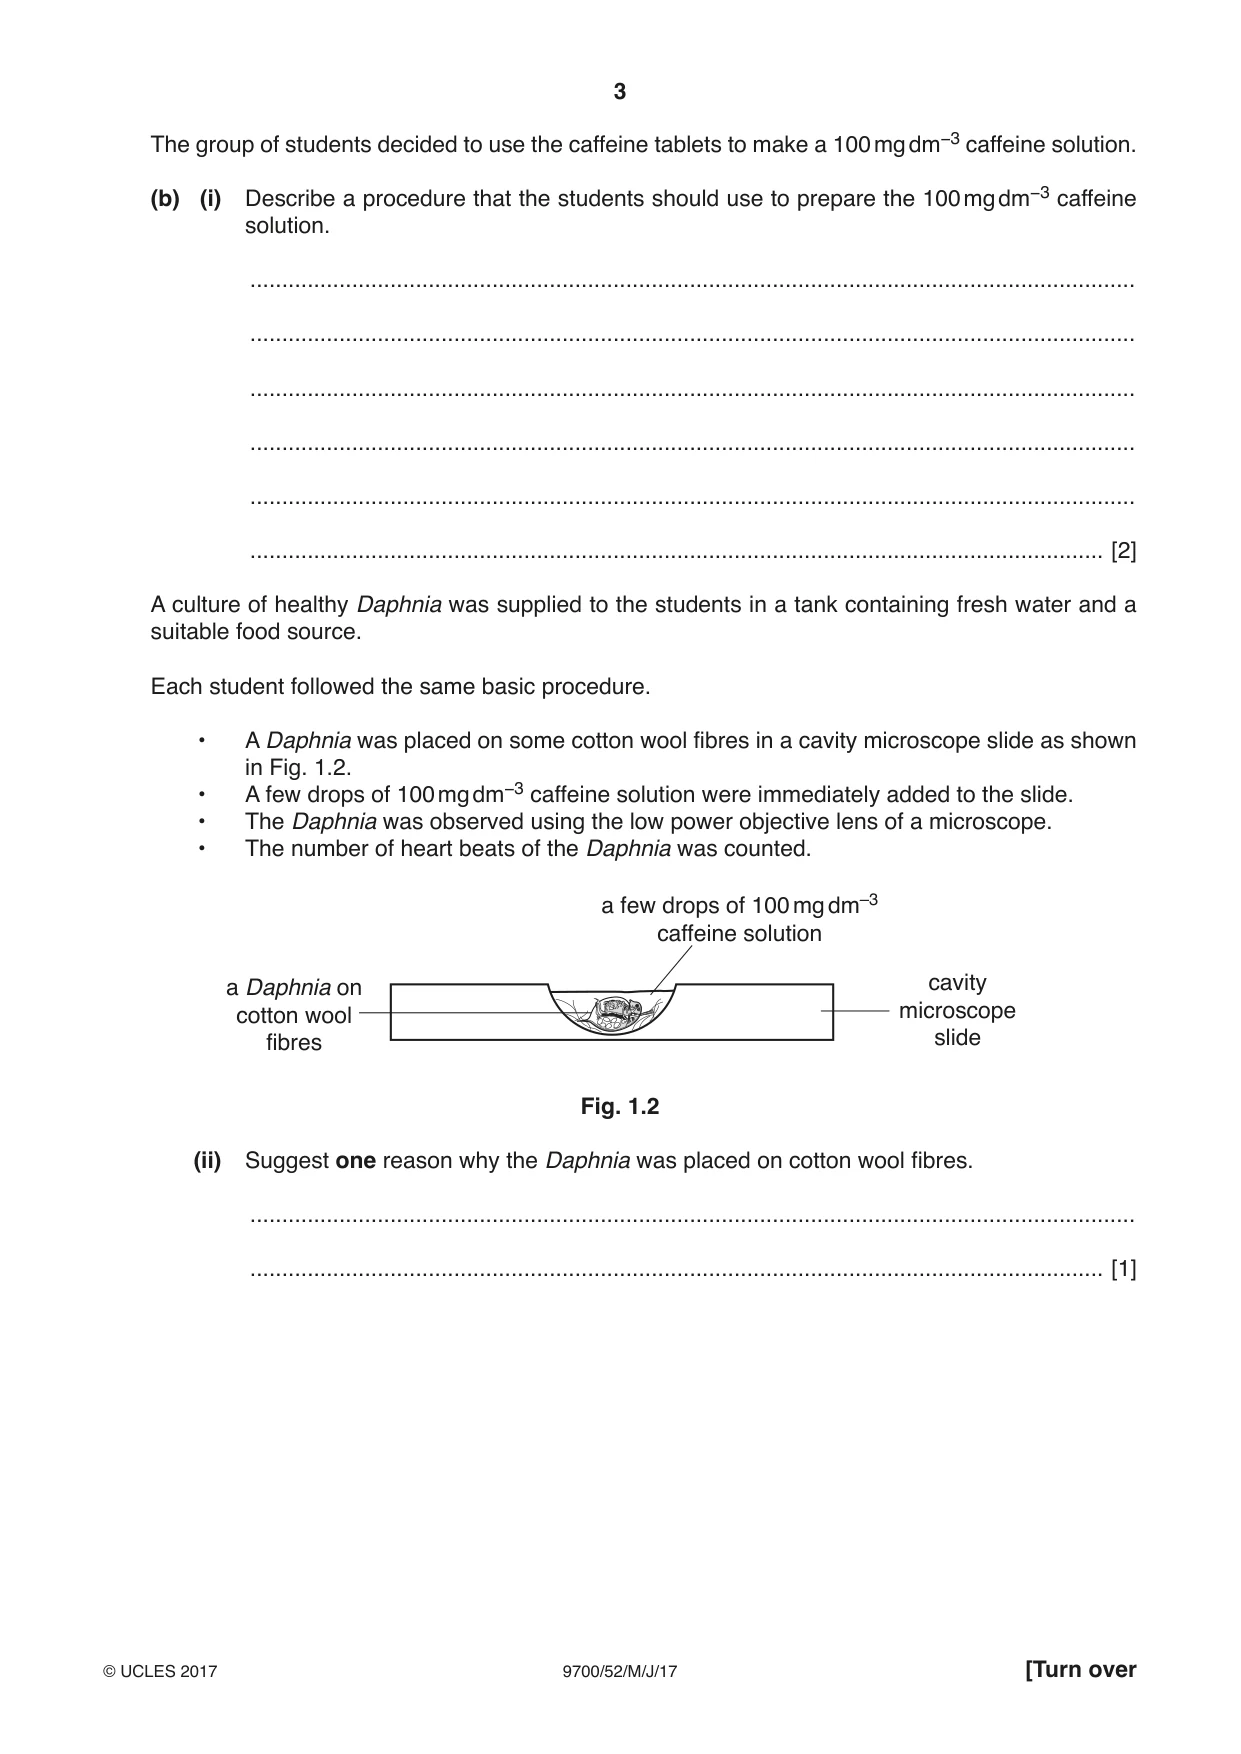
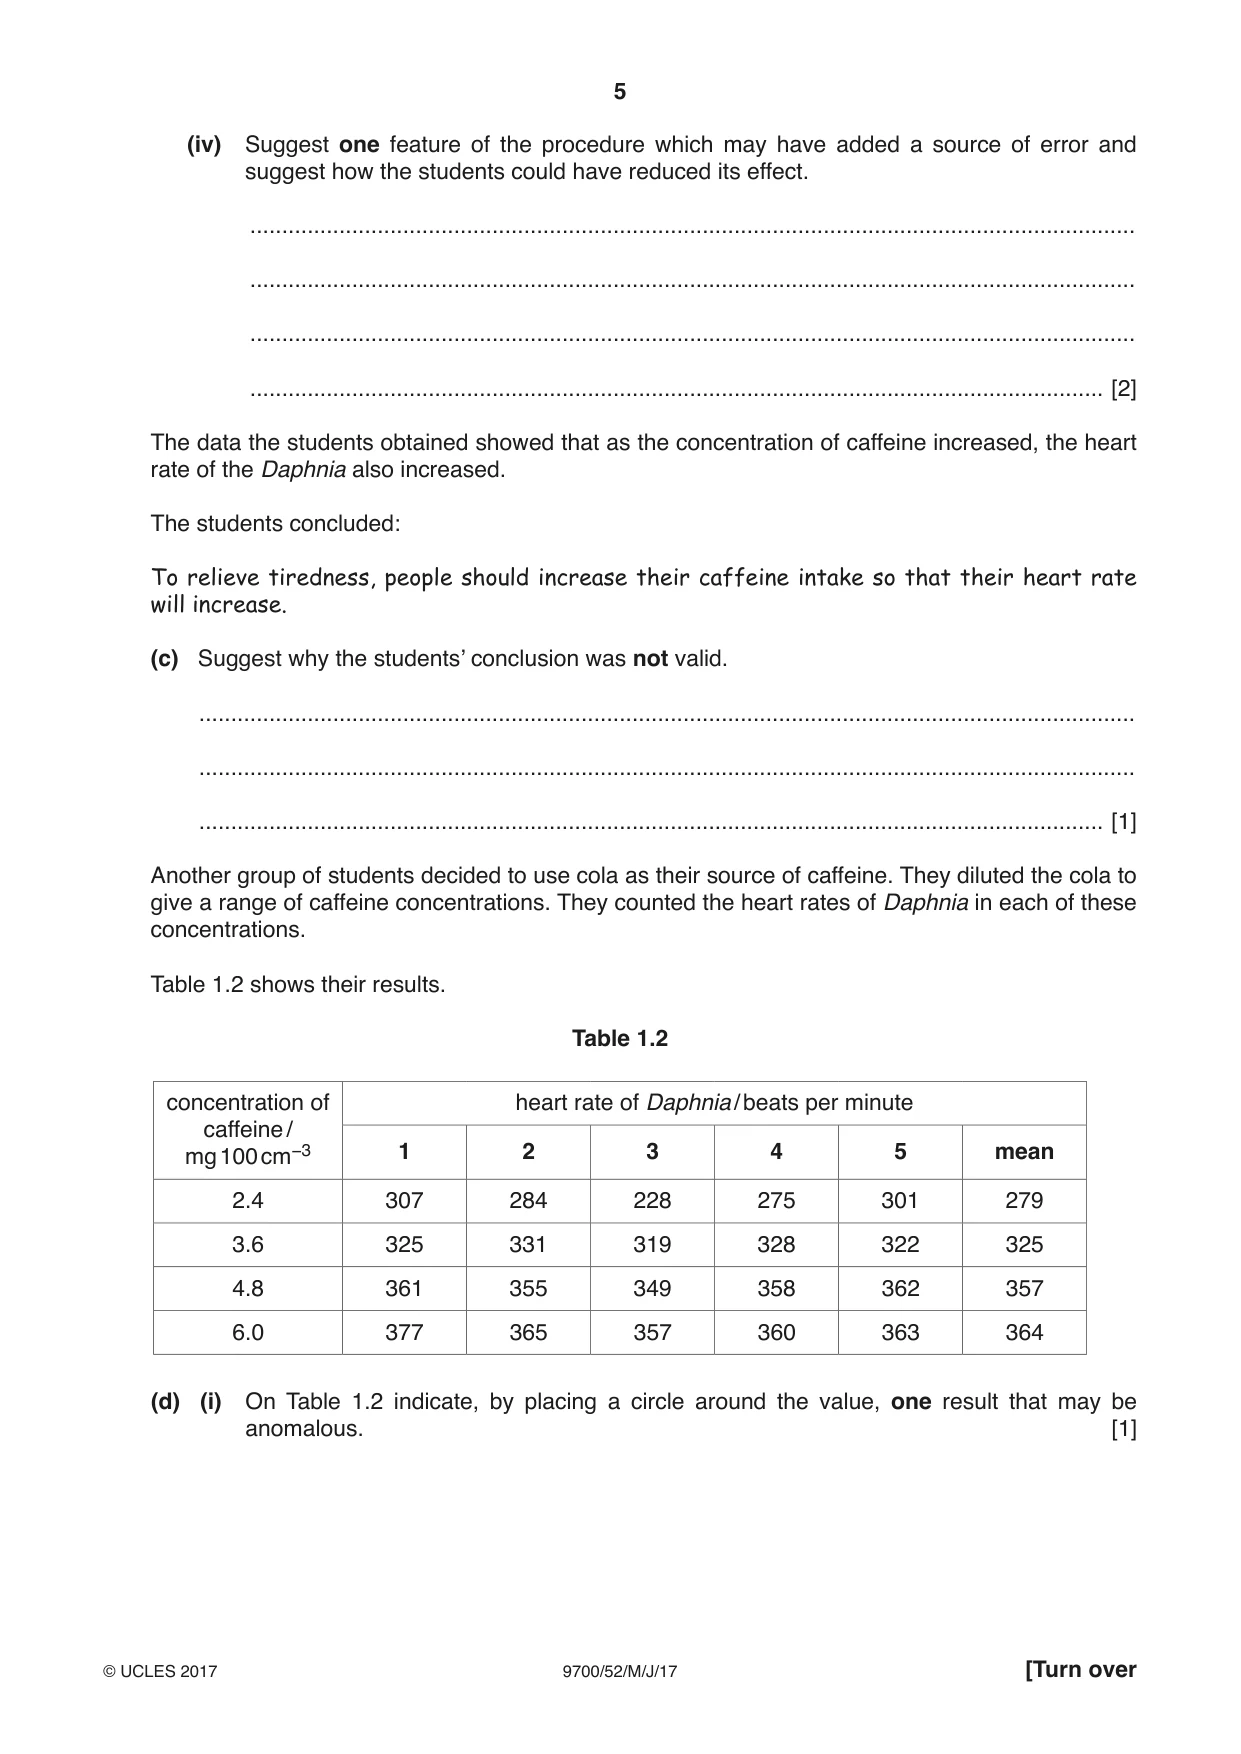
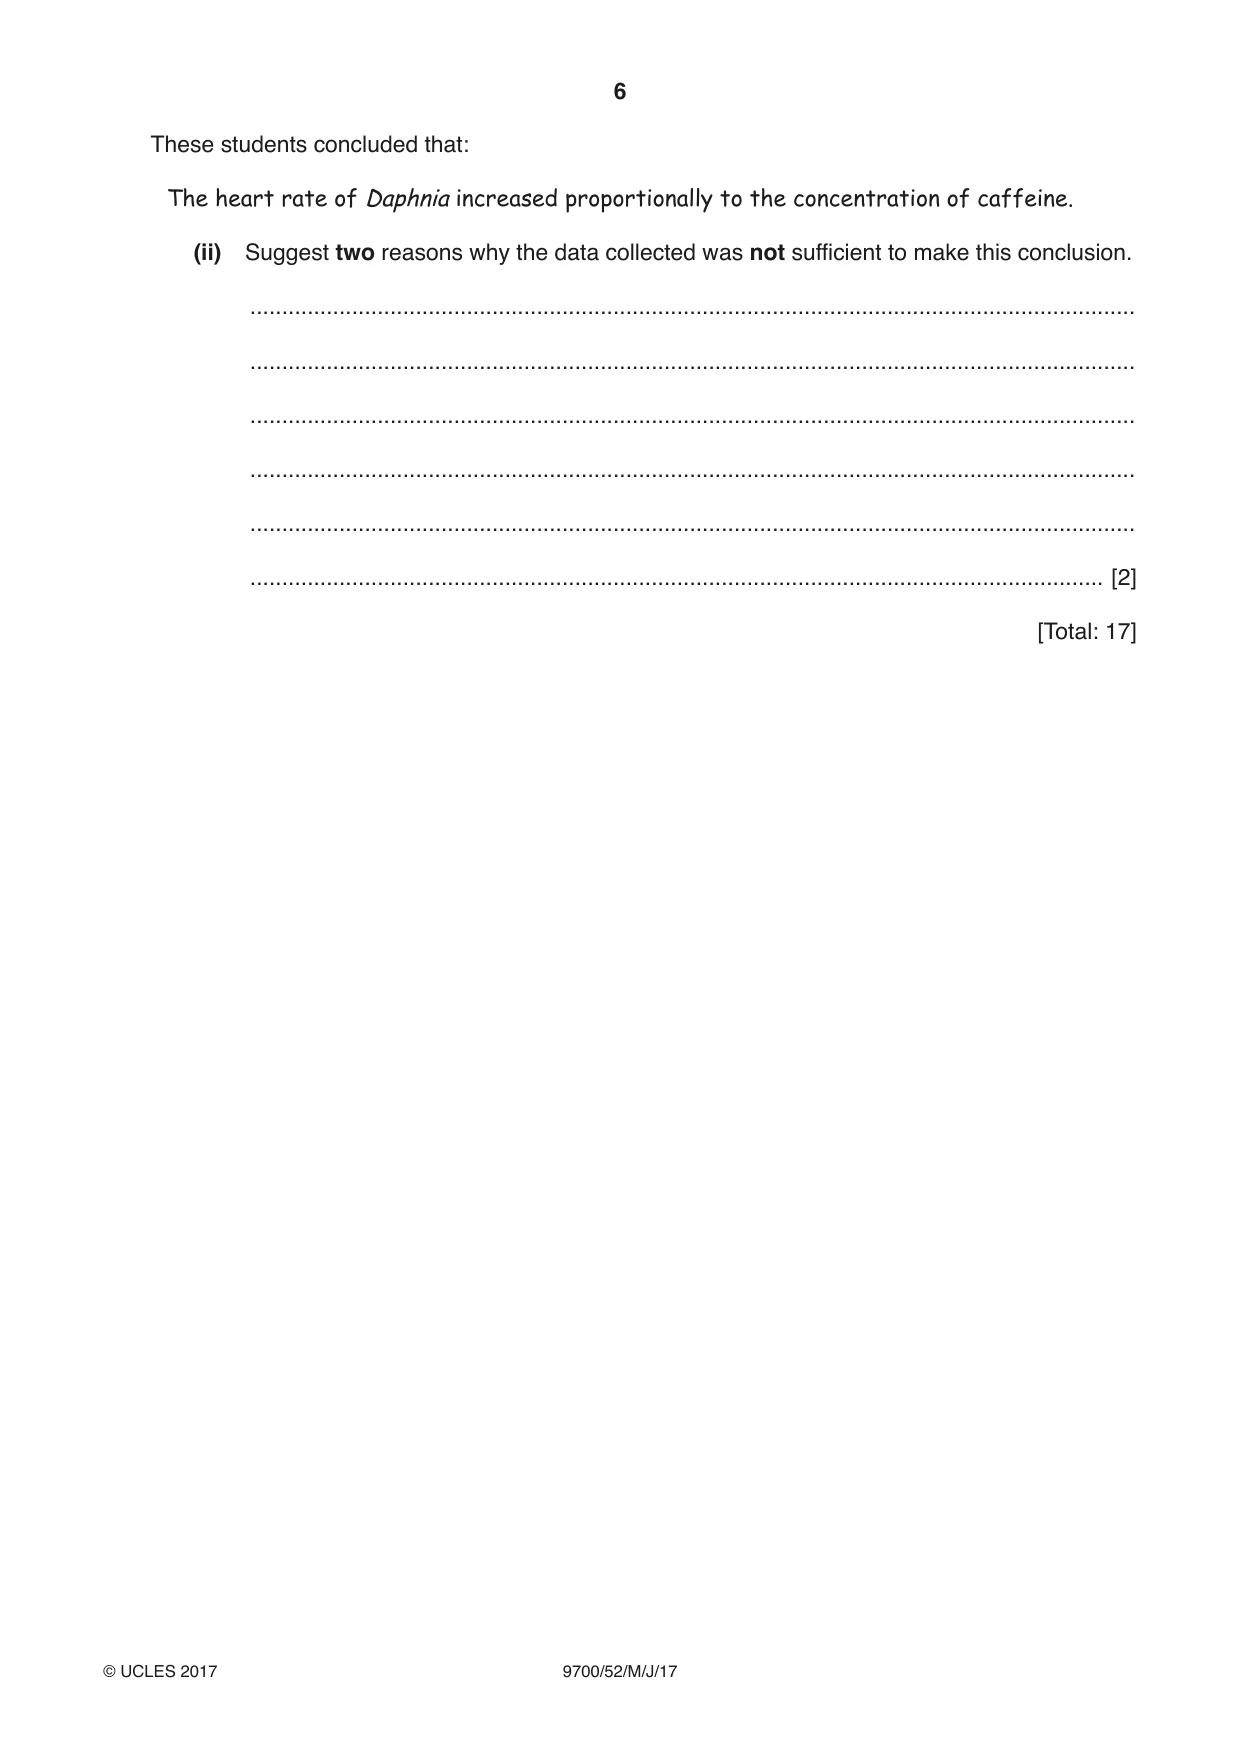
1 Fig. 1.1 shows an aquatic crustacean belonging to the genus Daphnia. These animals usually measure between 1–5 mm in length. They have a two-chambered heart which can be seen through the exoskeleton when viewed using a low-powered microscope. heart Fig. 1.1 A biology teacher told a class that caffeine can temporarily relieve tiredness in people by increasing heart rate. Table 1.1 shows the caffeine content of various products. Table 1.1 caffeine per product serving / mg 1 cup of strong coffee 100 50 g dark chocolate 45 1 caffeine tablet 50 1 can of cola drink 20 One group of students in the class used Daphnia to test the hypothesis: Heart rate increases when caffeine concentration increases. (a) Identify the independent and dependent variable in this investigation. independent .............................................................................................................................. dependent ............................................................................................................................ [2] The group of students decided to use the caffeine tablets to make a 100 mg dm−3 caffeine solution. (b) (i) Describe a procedure that the students should use to prepare the 100 mg dm−3 caffeine solution. ........................................................................................................................................... ........................................................................................................................................... ........................................................................................................................................... ........................................................................................................................................... ........................................................................................................................................... ...................................................................................................................................... [2] A culture of healthy Daphnia was supplied to the students in a tank containing fresh water and a suitable food source. Each student followed the same basic procedure. • A Daphnia was placed on some cotton wool fibres in a cavity microscope slide as shown in Fig. 1.2. • A few drops of 100 mg dm−3 caffeine solution were immediately added to the slide. • The Daphnia was observed using the low power objective lens of a microscope. • The number of heart beats of the Daphnia was counted. a few drops of 100 mg dm–3 caffeine solution a Daphnia on cavity cotton wool microscope fibres slide Fig. 1.2 (ii) Suggest one reason why the Daphnia was placed on cotton wool fibres. ........................................................................................................................................... ...................................................................................................................................... [1] (iii) The students decided to adapt their basic procedure to test their hypothesis that: Heart rate increases when caffeine concentration increases. Describe a method which the students could use to test this hypothesis. Your method should be detailed enough for another person to follow. ........................................................................................................................................... ........................................................................................................................................... ........................................................................................................................................... ........................................................................................................................................... ........................................................................................................................................... ........................................................................................................................................... ........................................................................................................................................... ........................................................................................................................................... ........................................................................................................................................... ........................................................................................................................................... ........................................................................................................................................... ........................................................................................................................................... ........................................................................................................................................... ........................................................................................................................................... ........................................................................................................................................... ........................................................................................................................................... ........................................................................................................................................... ........................................................................................................................................... ........................................................................................................................................... ........................................................................................................................................... ........................................................................................................................................... ........................................................................................................................................... ........................................................................................................................................... ........................................................................................................................................... ...................................................................................................................................... [6] (iv) Suggest one feature of the procedure which may have added a source of error and suggest how the students could have reduced its effect. ........................................................................................................................................... ........................................................................................................................................... ........................................................................................................................................... ...................................................................................................................................... [2] The data the students obtained showed that as the concentration of caffeine increased, the heart rate of the Daphnia also increased. The students concluded: To relieve tiredness, people should increase their caffeine intake so that their heart rate will increase. (c) Suggest why the students’ conclusion was not valid. ................................................................................................................................................... ................................................................................................................................................... .............................................................................................................................................. [1] Another group of students decided to use cola as their source of caffeine. They diluted the cola to give a range of caffeine concentrations. They counted the heart rates of Daphnia in each of these concentrations. Table 1.2 shows their results. Table 1.2 concentration of heart rate of Daphnia / beats per minute caffeine / mg 100 cm−3 1 2 3 4 5 mean 2.4 307 284 228 275 301 279 3.6 325 331 319 328 322 325 4.8 361 355 349 358 362 357 6.0 377 365 357 360 363 364 (d) (i) On Table 1.2 indicate, by placing a circle around the value, one result that may be anomalous. [1] These students concluded that: The heart rate of Daphnia increased proportionally to the concentration of caffeine. (ii) Suggest two reasons why the data collected was not sufficient to make this conclusion. ........................................................................................................................................... ........................................................................................................................................... ........................................................................................................................................... ........................................................................................................................................... ........................................................................................................................................... ...................................................................................................................................... [2] [Total: 17]
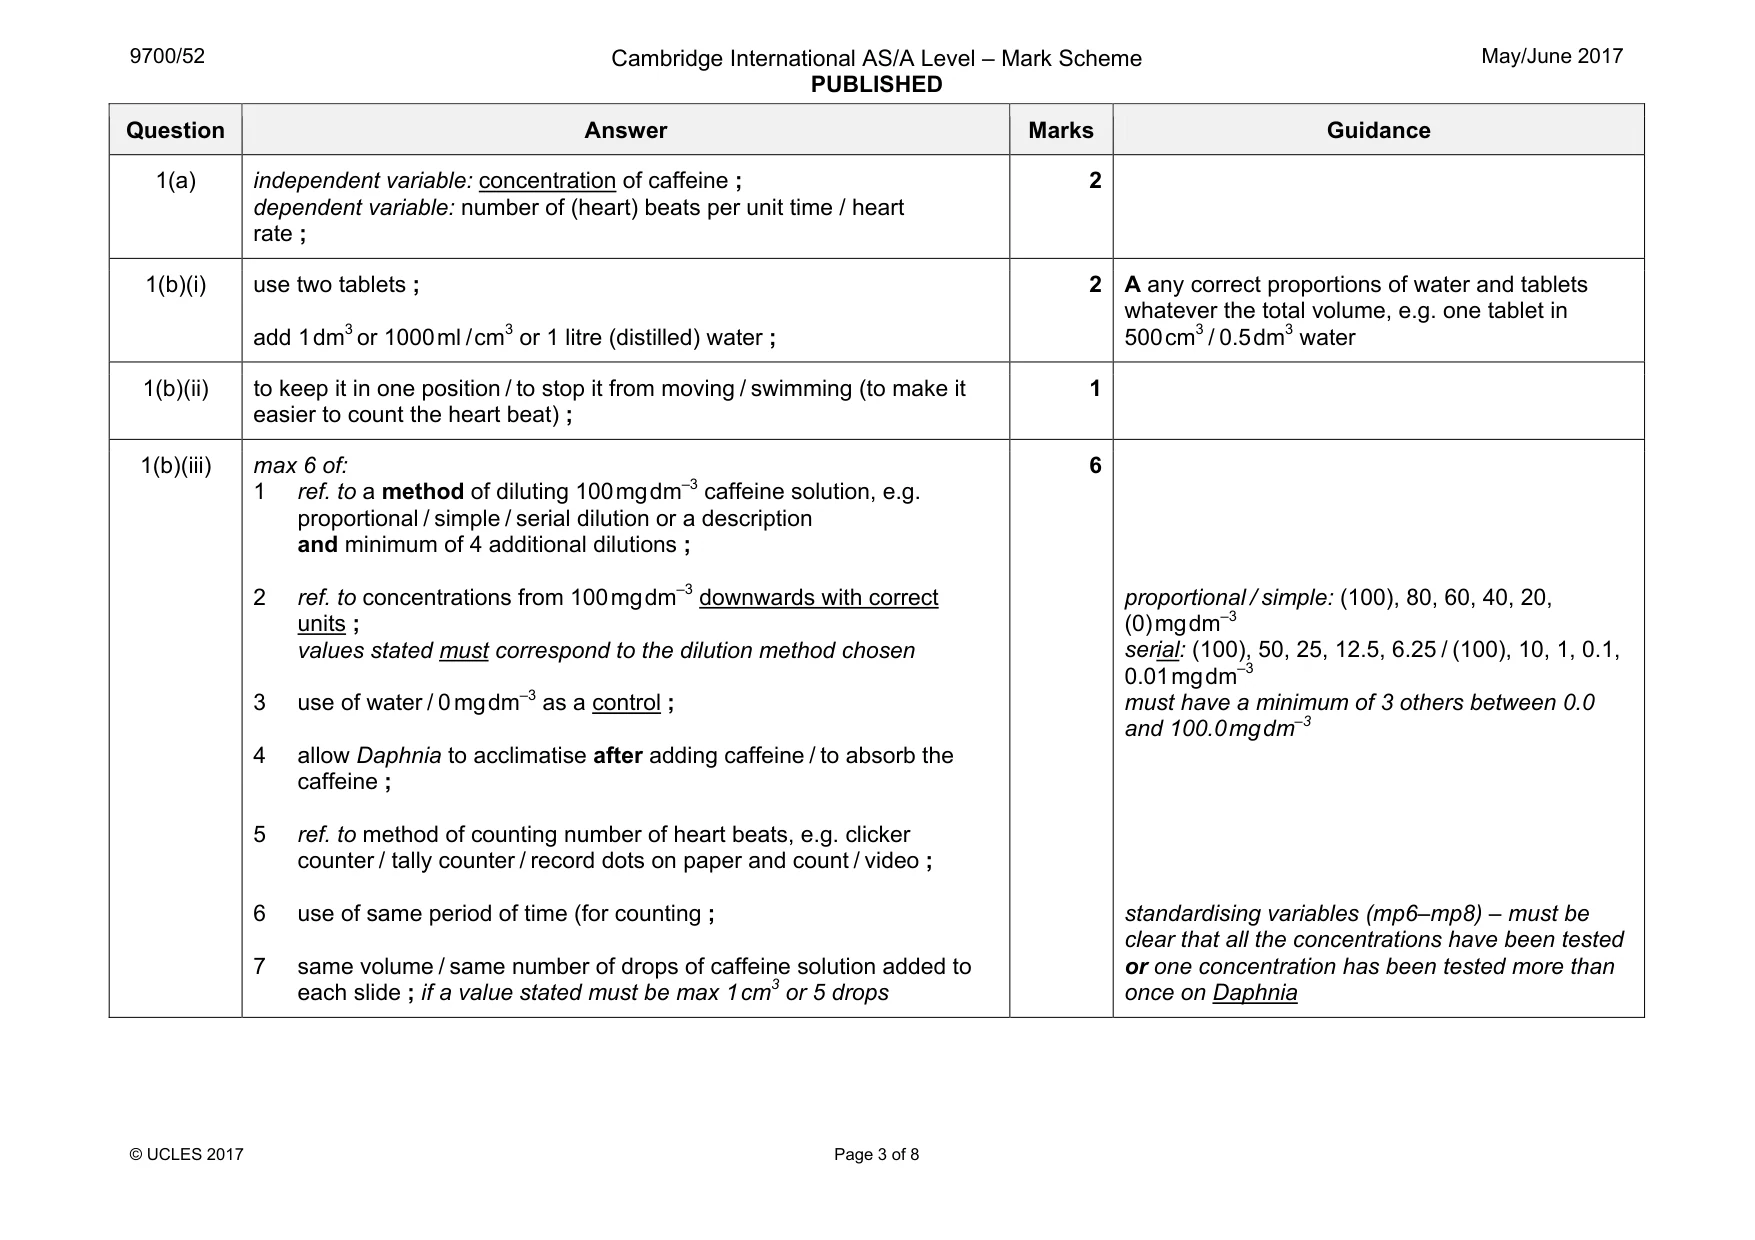
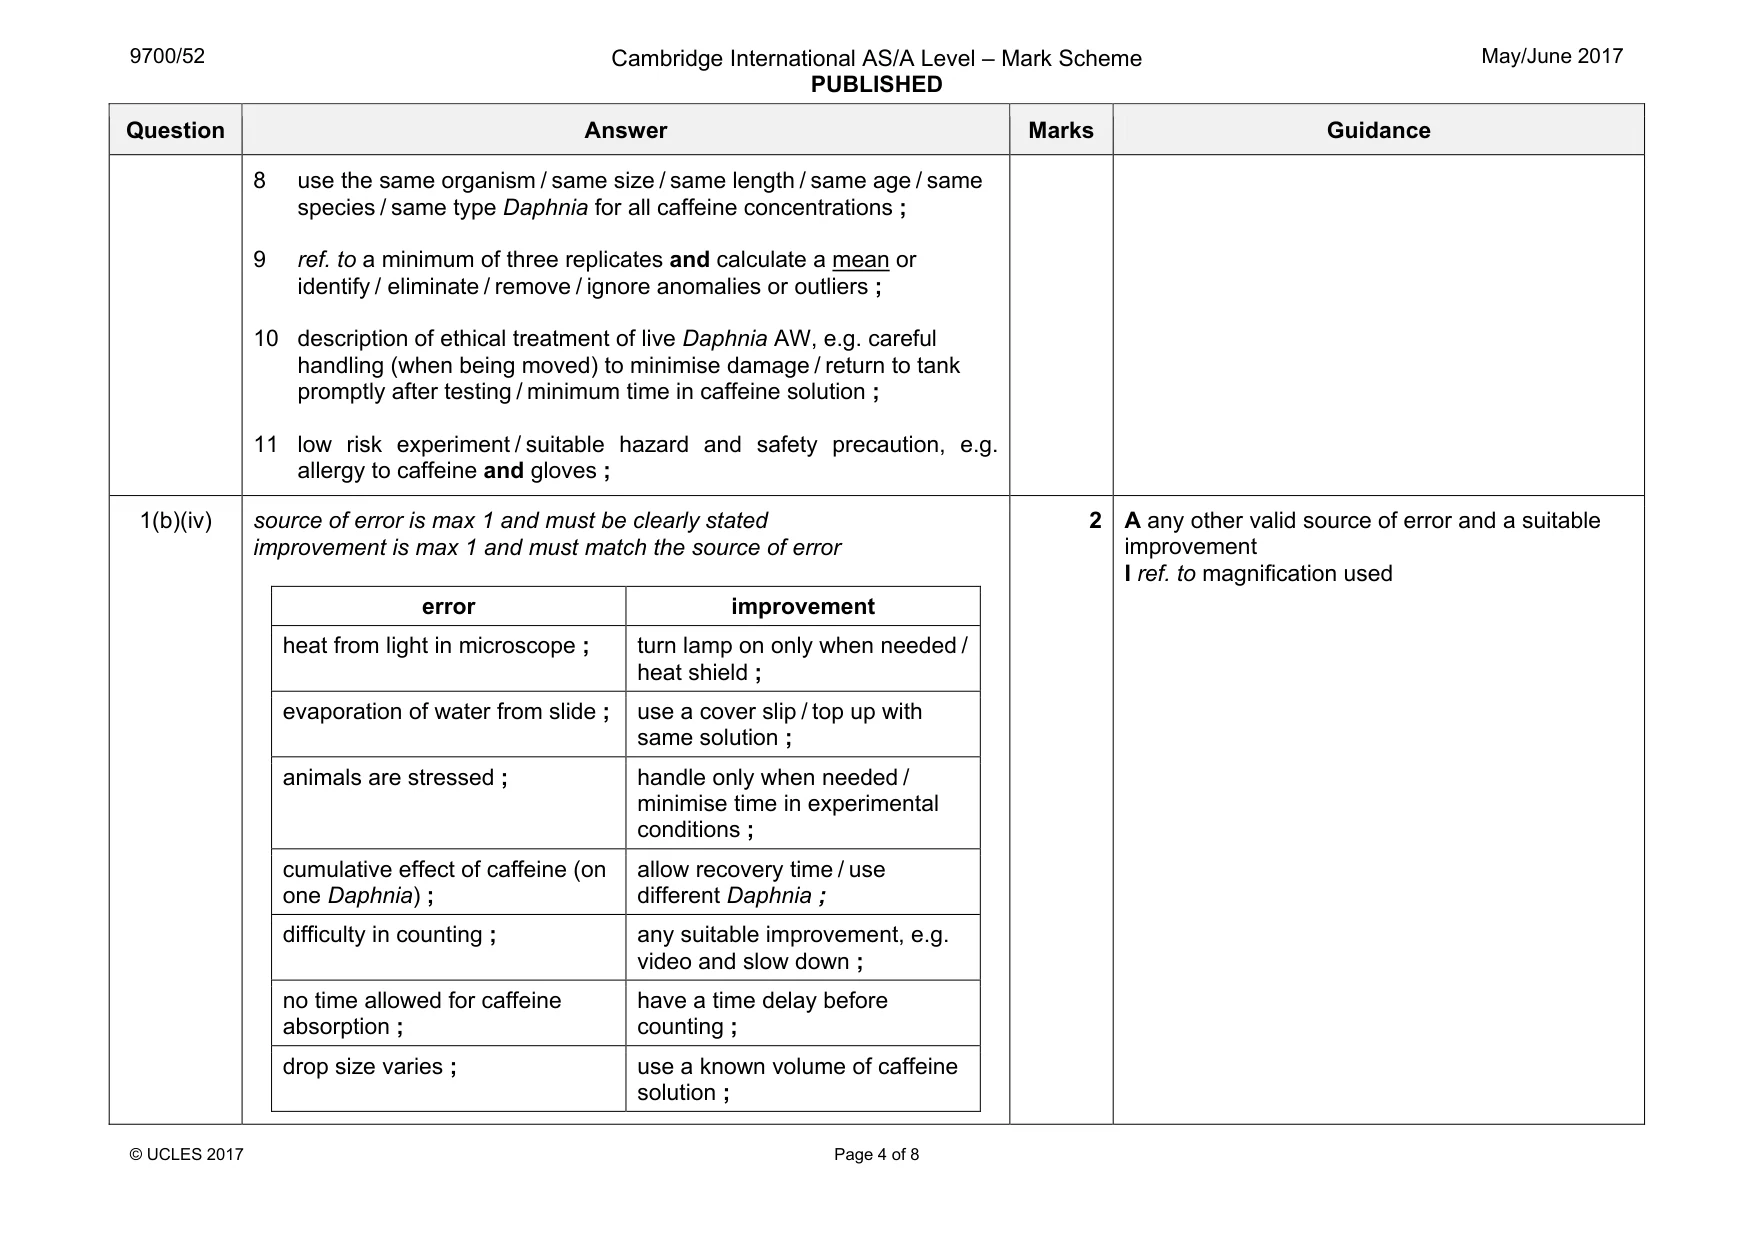
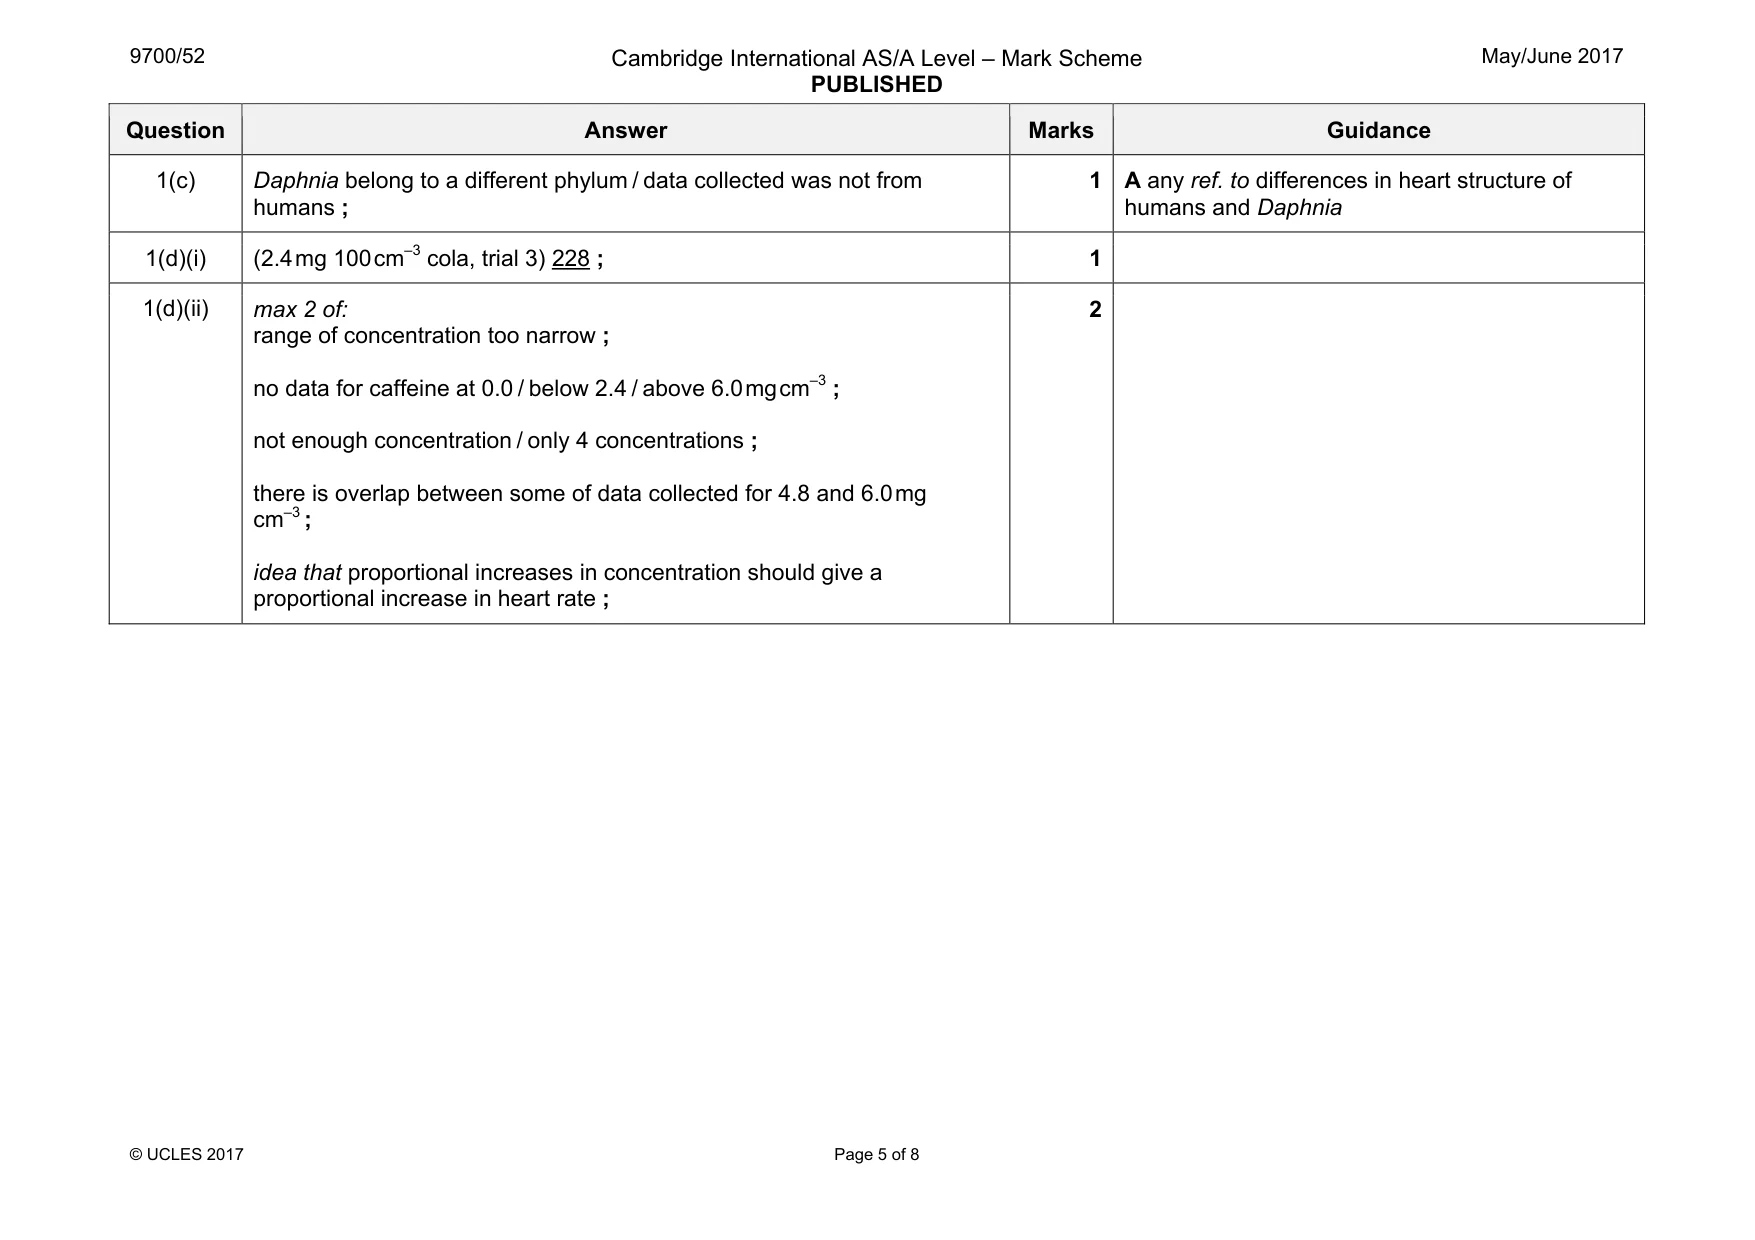
Mark scheme: 1(a) independent variable: concentration of caffeine ; dependent variable: number of (heart) beats per unit time / heart rate ; 2 1(b)(i) use two tablets ; add 1 dm3 or 1000 ml / cm3 or 1 litre (distilled) water ; 2 A any correct proportions of water and tablets whatever the total volume, e.g. one tablet in 500 cm3 / 0.5 dm3 water 1(b)(ii) to keep it in one position / to stop it from moving / swimming (to make it easier to count the heart beat) ; 1 1(b)(iii) max 6 of: 1 ref. to a method of diluting 100 mg dm–3 caffeine solution, e.g. proportional / simple / serial dilution or a description and minimum of 4 additional dilutions ; 2 ref. to concentrations from 100 mg dm–3 downwards with correct units ; values stated must correspond to the dilution method chosen 3 use of water / 0 mg dm–3 as a control ; 4 allow Daphnia to acclimatise after adding caffeine / to absorb the caffeine ; 5 ref. to method of counting number of heart beats, e.g. clicker counter / tally counter / record dots on paper and count / video ; 6 use of same period of time (for counting ; 7 same volume / same number of drops of caffeine solution added to each slide ; if a value stated must be max 1 cm3 or 5 drops 6 proportional / simple: (100), 80, 60, 40, 20, (0) mg dm–3 serial: (100), 50, 25, 12.5, 6.25 / (100), 10, 1, 0.1, 0.01 mg dm–3 must have a minimum of 3 others between 0.0 and 100.0 mg dm–3 standardising variables (mp6–mp8) – must be clear that all the concentrations have been tested or one concentration has been tested more than once on Daphnia Question Answer Marks Guidance 8 use the same organism / same size / same length / same age / same species / same type Daphnia for all caffeine concentrations ; 9 ref. to a minimum of three replicates and calculate a mean or identify / eliminate / remove / ignore anomalies or outliers ; 10 description of ethical treatment of live Daphnia AW, e.g. careful handling (when being moved) to minimise damage / return to tank promptly after testing / minimum time in caffeine solution ; 11 low risk experiment / suitable hazard and safety precaution, e.g. allergy to caffeine and gloves ; 1(b)(iv) source of error is max 1 and must be clearly stated improvement is max 1 and must match the source of error error improvement heat from light in microscope ; turn lamp on only when needed / heat shield ; evaporation of water from slide ; use a cover slip / top up with same solution ; animals are stressed ; handle only when needed / minimise time in experimental conditions ; cumulative effect of caffeine (on one Daphnia) ; allow recovery time / use different Daphnia ; difficulty in counting ; any suitable improvement, e.g. video and slow down ; no time allowed for caffeine absorption ; have a time delay before counting ; drop size varies ; use a known volume of caffeine solution ; 2 A any other valid source of error and a suitable improvement I ref. to magnification used Question Answer Marks Guidance 1(c) Daphnia belong to a different phylum / data collected was not from humans ; 1 A any ref. to differences in heart structure of humans and Daphnia 1(d)(i) (2.4 mg 100 cm–3 cola, trial 3) 228 ; 1 1(d)(ii) max 2 of: range of concentration too narrow ; no data for caffeine at 0.0 / below 2.4 / above 6.0 mg cm–3 ; not enough concentration / only 4 concentrations ; there is overlap between some of data collected for 4.8 and 6.0 mg cm–3 ; idea that proportional increases in concentration should give a proportional increase in heart rate ; 2
Q2 · Some populations of white clover, Trifolium repens, are described as cyanogenic because…
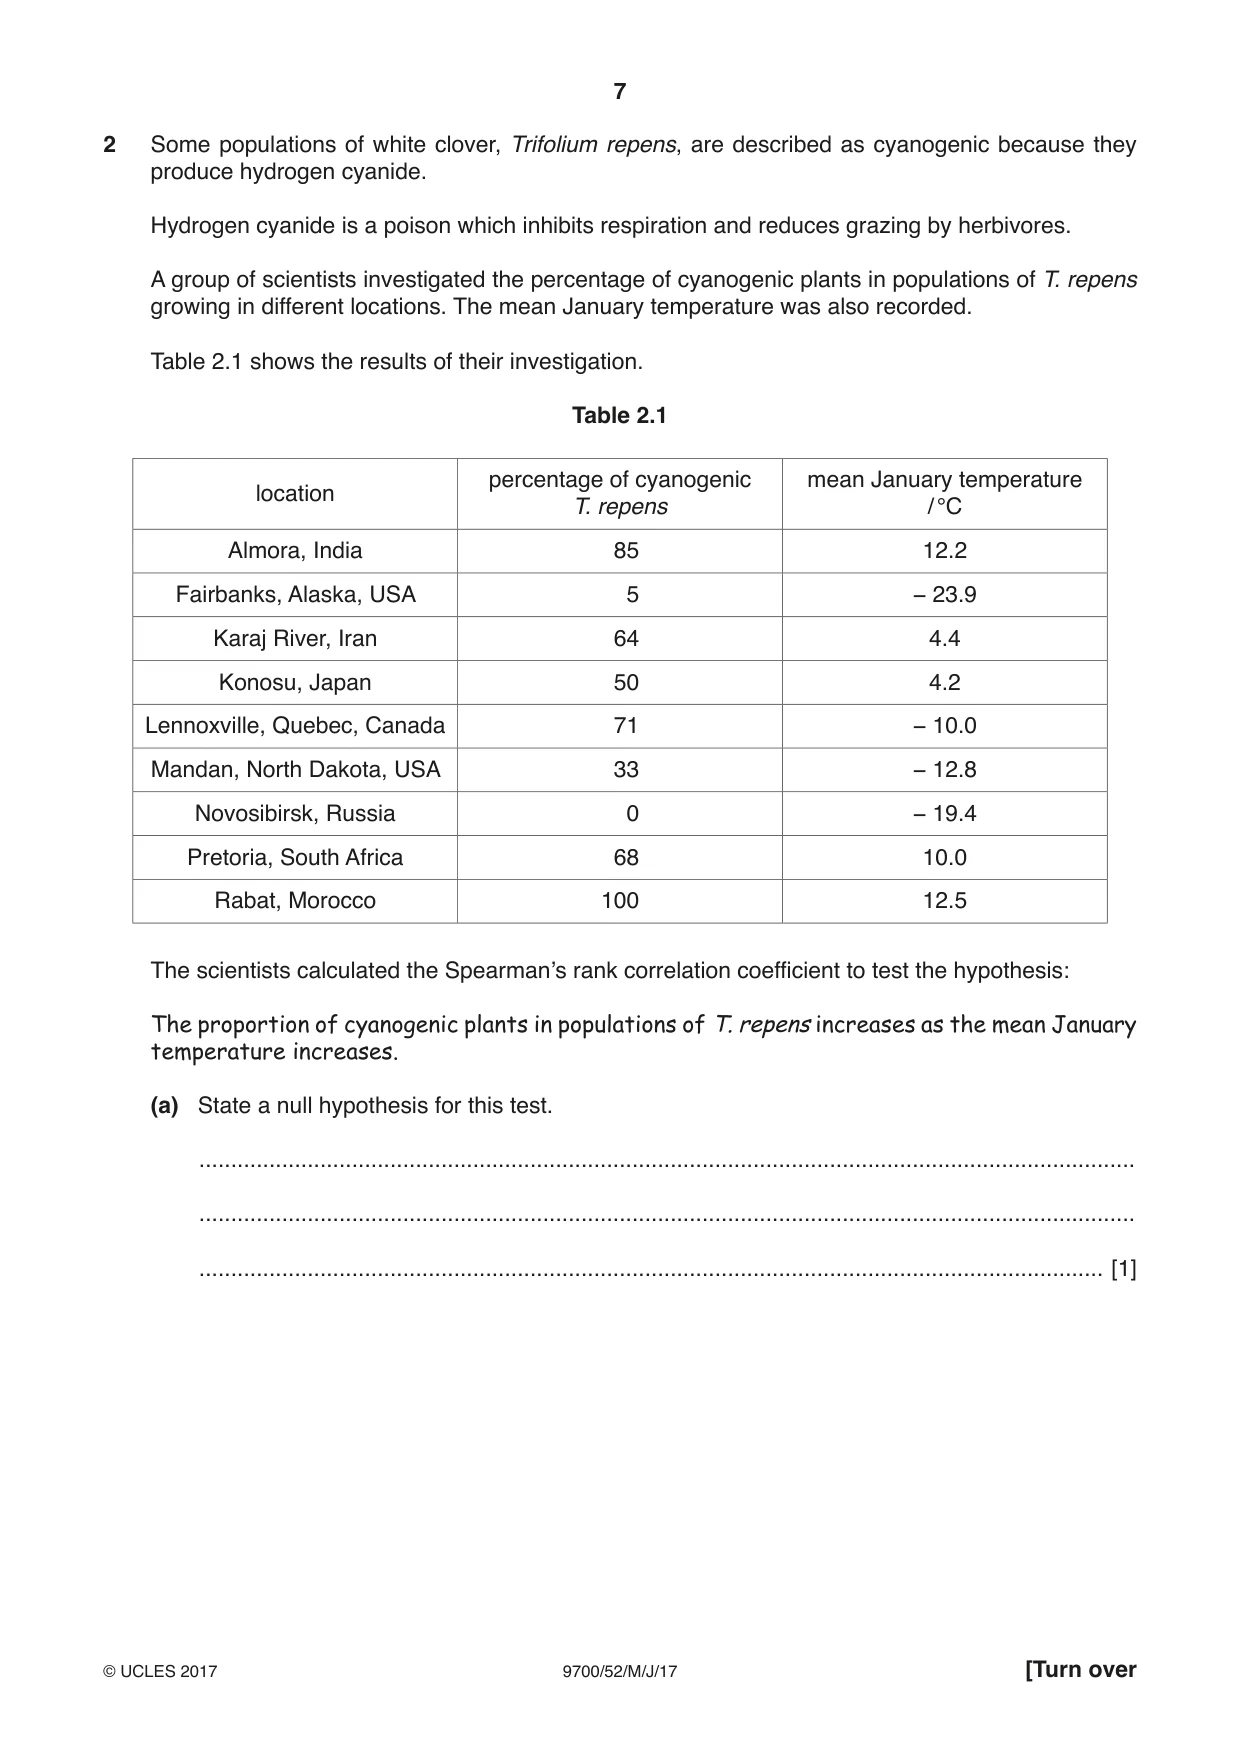
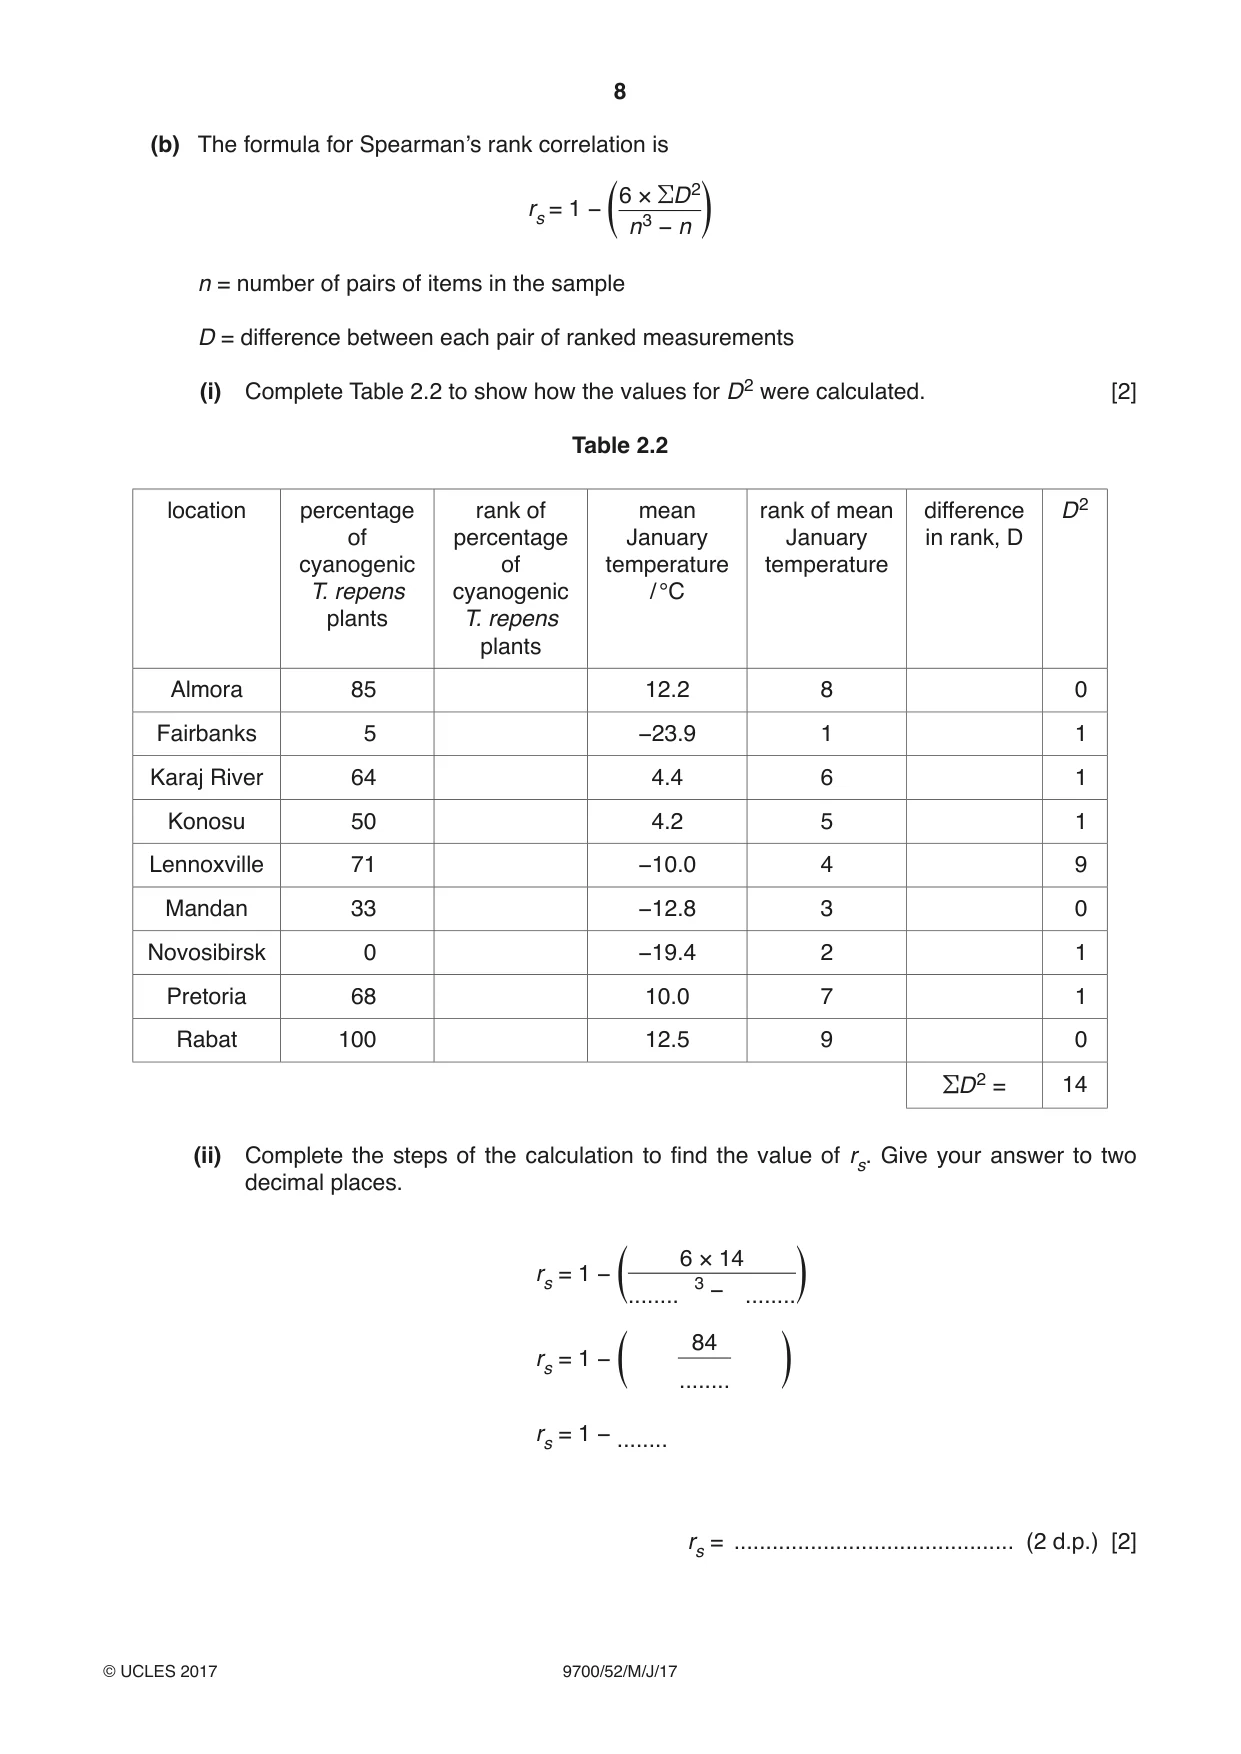
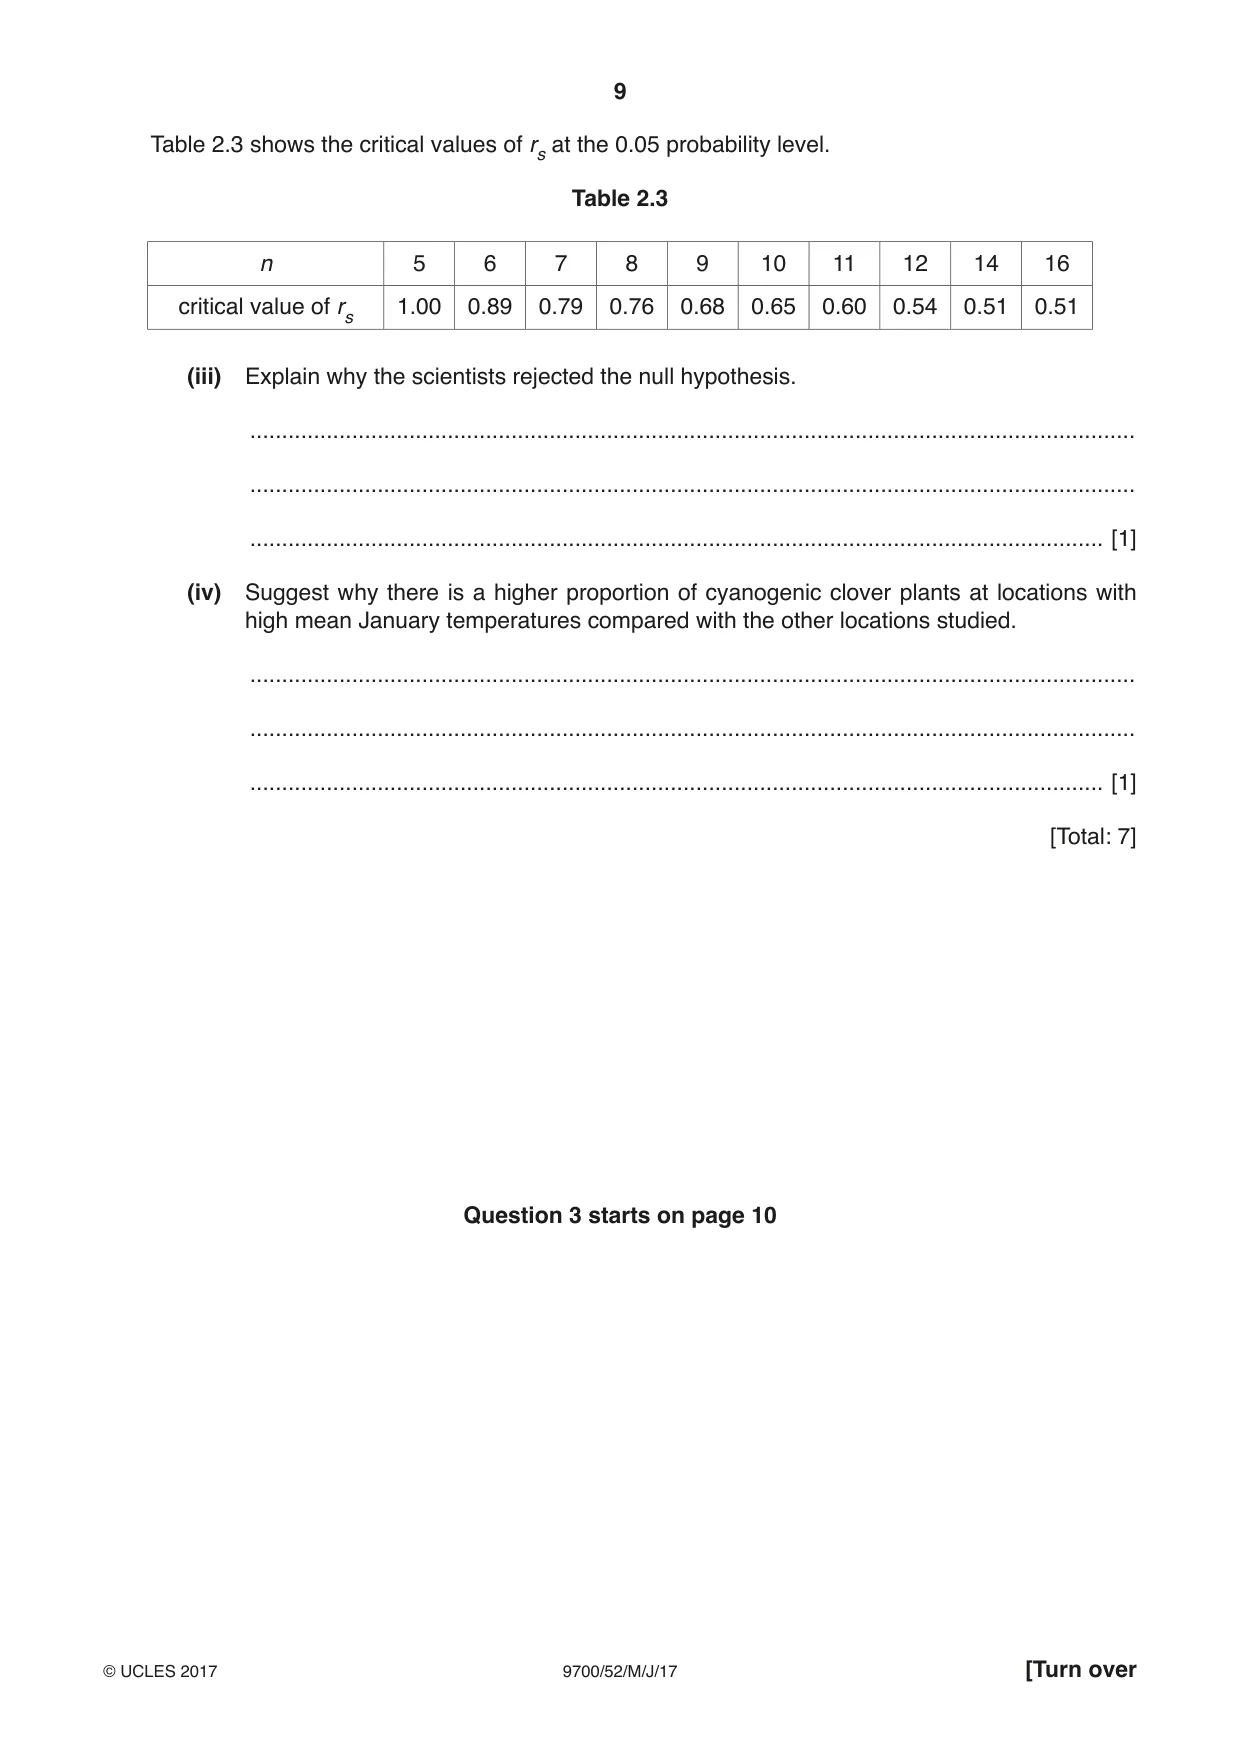
2 Some populations of white clover, Trifolium repens, are described as cyanogenic because they produce hydrogen cyanide. Hydrogen cyanide is a poison which inhibits respiration and reduces grazing by herbivores. A group of scientists investigated the percentage of cyanogenic plants in populations of T. repens growing in different locations. The mean January temperature was also recorded. Table 2.1 shows the results of their investigation. Table 2.1 percentage of cyanogenic mean January temperature location T. repens / °C Almora, India 85 12.2 Fairbanks, Alaska, USA 5 − 23.9 Karaj River, Iran 64 4.4 Konosu, Japan 50 4.2 Lennoxville, Quebec, Canada 71 − 10.0 Mandan, North Dakota, USA 33 − 12.8 Novosibirsk, Russia 0 − 19.4 Pretoria, South Africa 68 10.0 Rabat, Morocco 100 12.5 The scientists calculated the Spearman’s rank correlation coefficient to test the hypothesis: The proportion of cyanogenic plants in populations of T.repensincreases as the mean January temperature increases. (a) State a null hypothesis for this test. ................................................................................................................................................... ................................................................................................................................................... .............................................................................................................................................. [1] (b) The formula for Spearman’s rank correlation is 6 × !D2 rs = 1 − n3 − n n = number of pairs of items in the sample D = difference between each pair of ranked measurements (i) Complete Table 2.2 to show how the values for D2 were calculated. [2] Table 2.2 location percentage rank of mean rank of mean difference D2 of percentage January January in rank, D cyanogenic of temperature temperature T. repens cyanogenic / °C plants T. repens plants Almora 85 12.2 8 0 Fairbanks 5 −23.9 1 1 Karaj River 64 4.4 6 1 Konosu 50 4.2 5 1 Lennoxville 71 −10.0 4 9 Mandan 33 −12.8 3 0 Novosibirsk 0 −19.4 2 1 Pretoria 68 10.0 7 1 Rabat 100 12.5 9 0 !D2 = 14 (ii) Complete the steps of the calculation to find the value of rs. Give your answer to two decimal places. 6 × 14 rs = 1 − 3 ........n − n........ 84 rs = 1 − ........ rs = 1 − ........ rs = ............................................ (2 d.p.) [2] Table 2.3 shows the critical values of rs at the 0.05 probability level. Table 2.3 n 5 6 7 8 9 10 11 12 14 16 critical value of rs 1.00 0.89 0.79 0.76 0.68 0.65 0.60 0.54 0.51 0.51 (iii) Explain why the scientists rejected the null hypothesis. ........................................................................................................................................... ........................................................................................................................................... ...................................................................................................................................... [1] (iv) Suggest why there is a higher proportion of cyanogenic clover plants at locations with high mean January temperatures compared with the other locations studied. ........................................................................................................................................... ........................................................................................................................................... ...................................................................................................................................... [1] [Total: 7] Question 3 starts on page 10
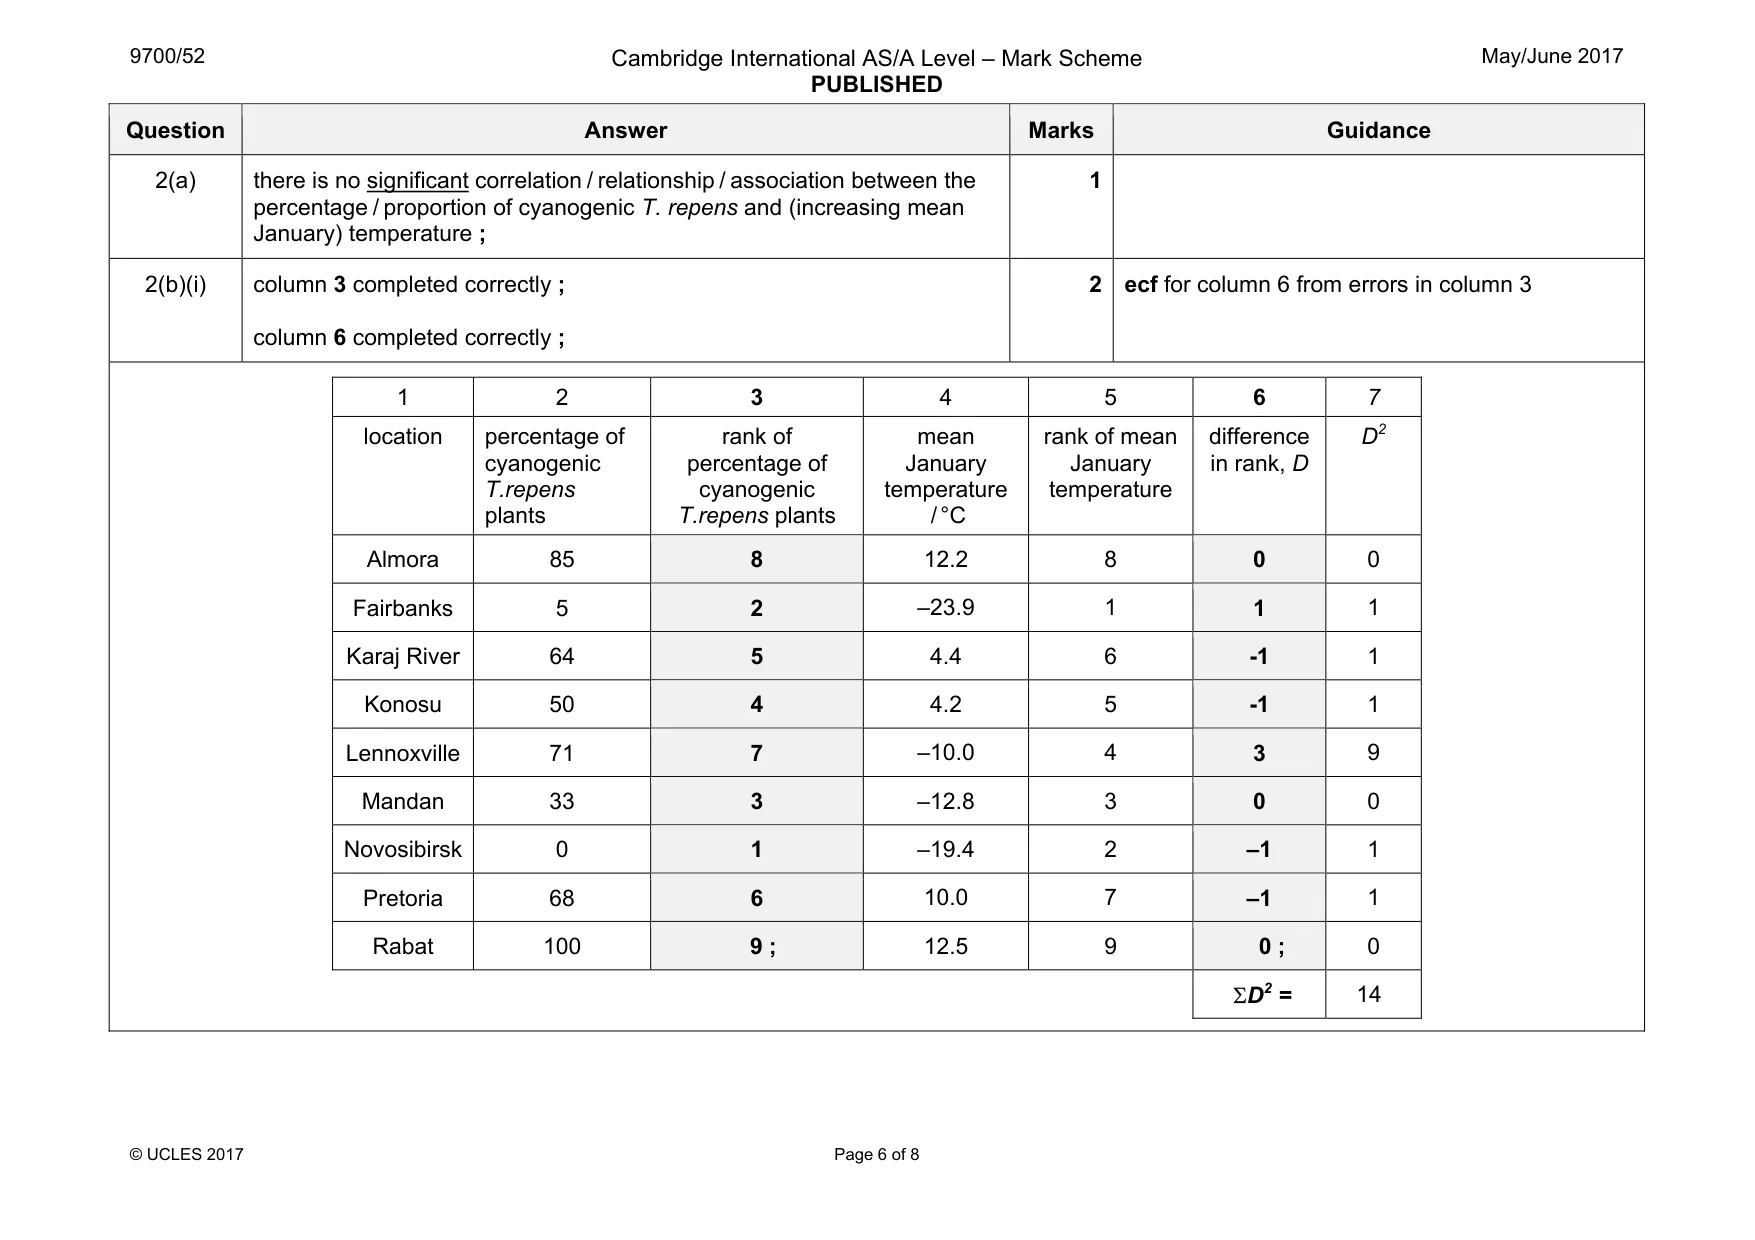
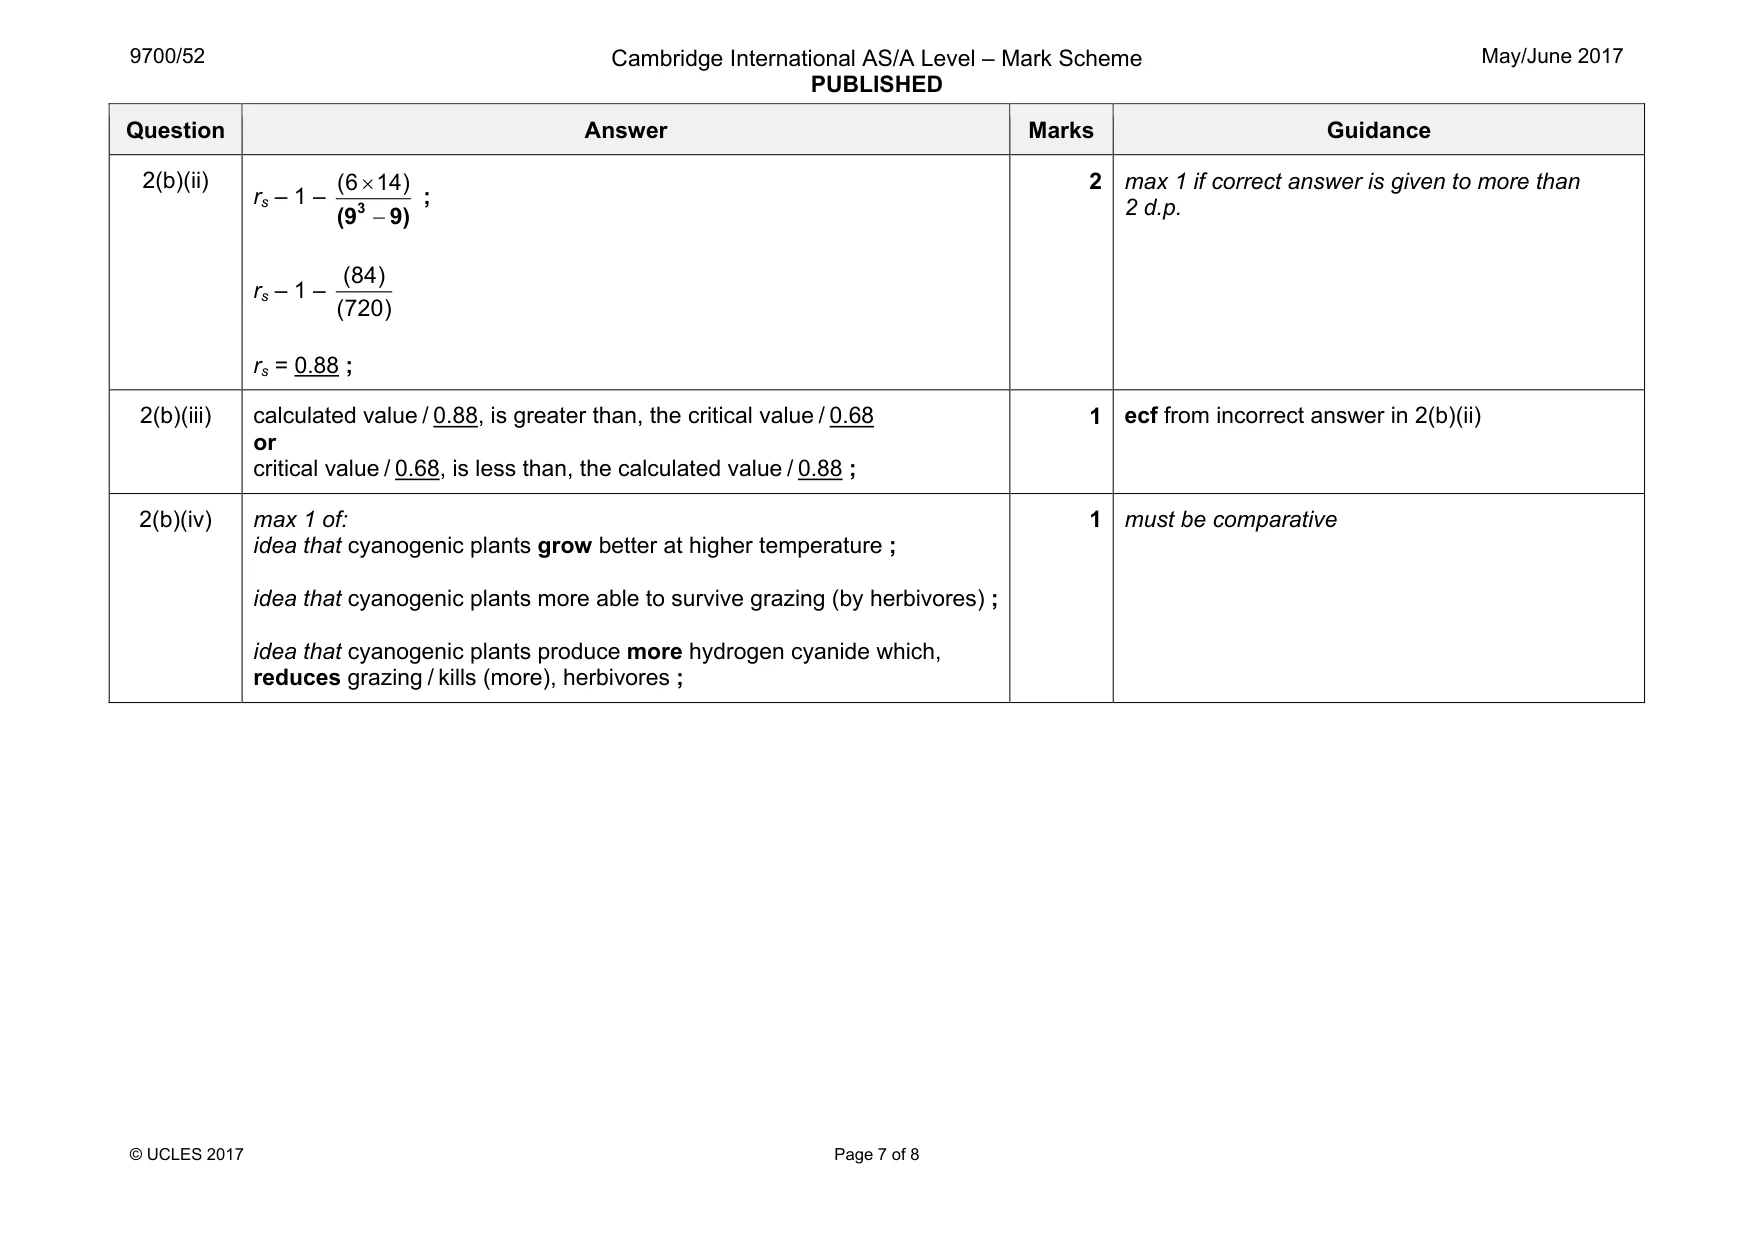
Mark scheme: 2(a) there is no significant correlation / relationship / association between the percentage / proportion of cyanogenic T. repens and (increasing mean January) temperature ; 1 2(b)(i) column 3 completed correctly ; column 6 completed correctly ; 2 ecf for column 6 from errors in column 3 1 2 3 4 5 6 7 location percentage of cyanogenic T.repens plants rank of percentage of cyanogenic T.repens plants mean January temperature / °C rank of mean January temperature difference in rank, D D2 Almora 85 8 12.2 8 0 0 Fairbanks 5 2 –23.9 1 1 1 Karaj River 64 5 4.4 6 -1 1 Konosu 50 4 4.2 5 -1 1 Lennoxville 71 7 –10.0 4 3 9 Mandan 33 3 –12.8 3 0 0 Novosibirsk 0 1 –19.4 2 –1 1 Pretoria 68 6 10.0 7 –1 1 Rabat 100 9 ; 12.5 9 0 ; 0 ΣD2 = 14 Question Answer Marks Guidance 2(b)(ii) rs – 1 – × − (6 14) 3 (9 9) ; rs – 1 – (84) (720) rs = 0.88 ; 2 max 1 if correct answer is given to more than 2 d.p. 2(b)(iii) calculated value / 0.88, is greater than, the critical value / 0.68 or critical value / 0.68, is less than, the calculated value / 0.88 ; 1 ecf from incorrect answer in 2(b)(ii) 2(b)(iv) max 1 of: idea that cyanogenic plants grow better at higher temperature ; idea that cyanogenic plants more able to survive grazing (by herbivores) ; idea that cyanogenic plants produce more hydrogen cyanide which, reduces grazing / kills (more), herbivores ; 1 must be comparative
Q3 · An investigation was carried out into the population of a species of vole in one area of…
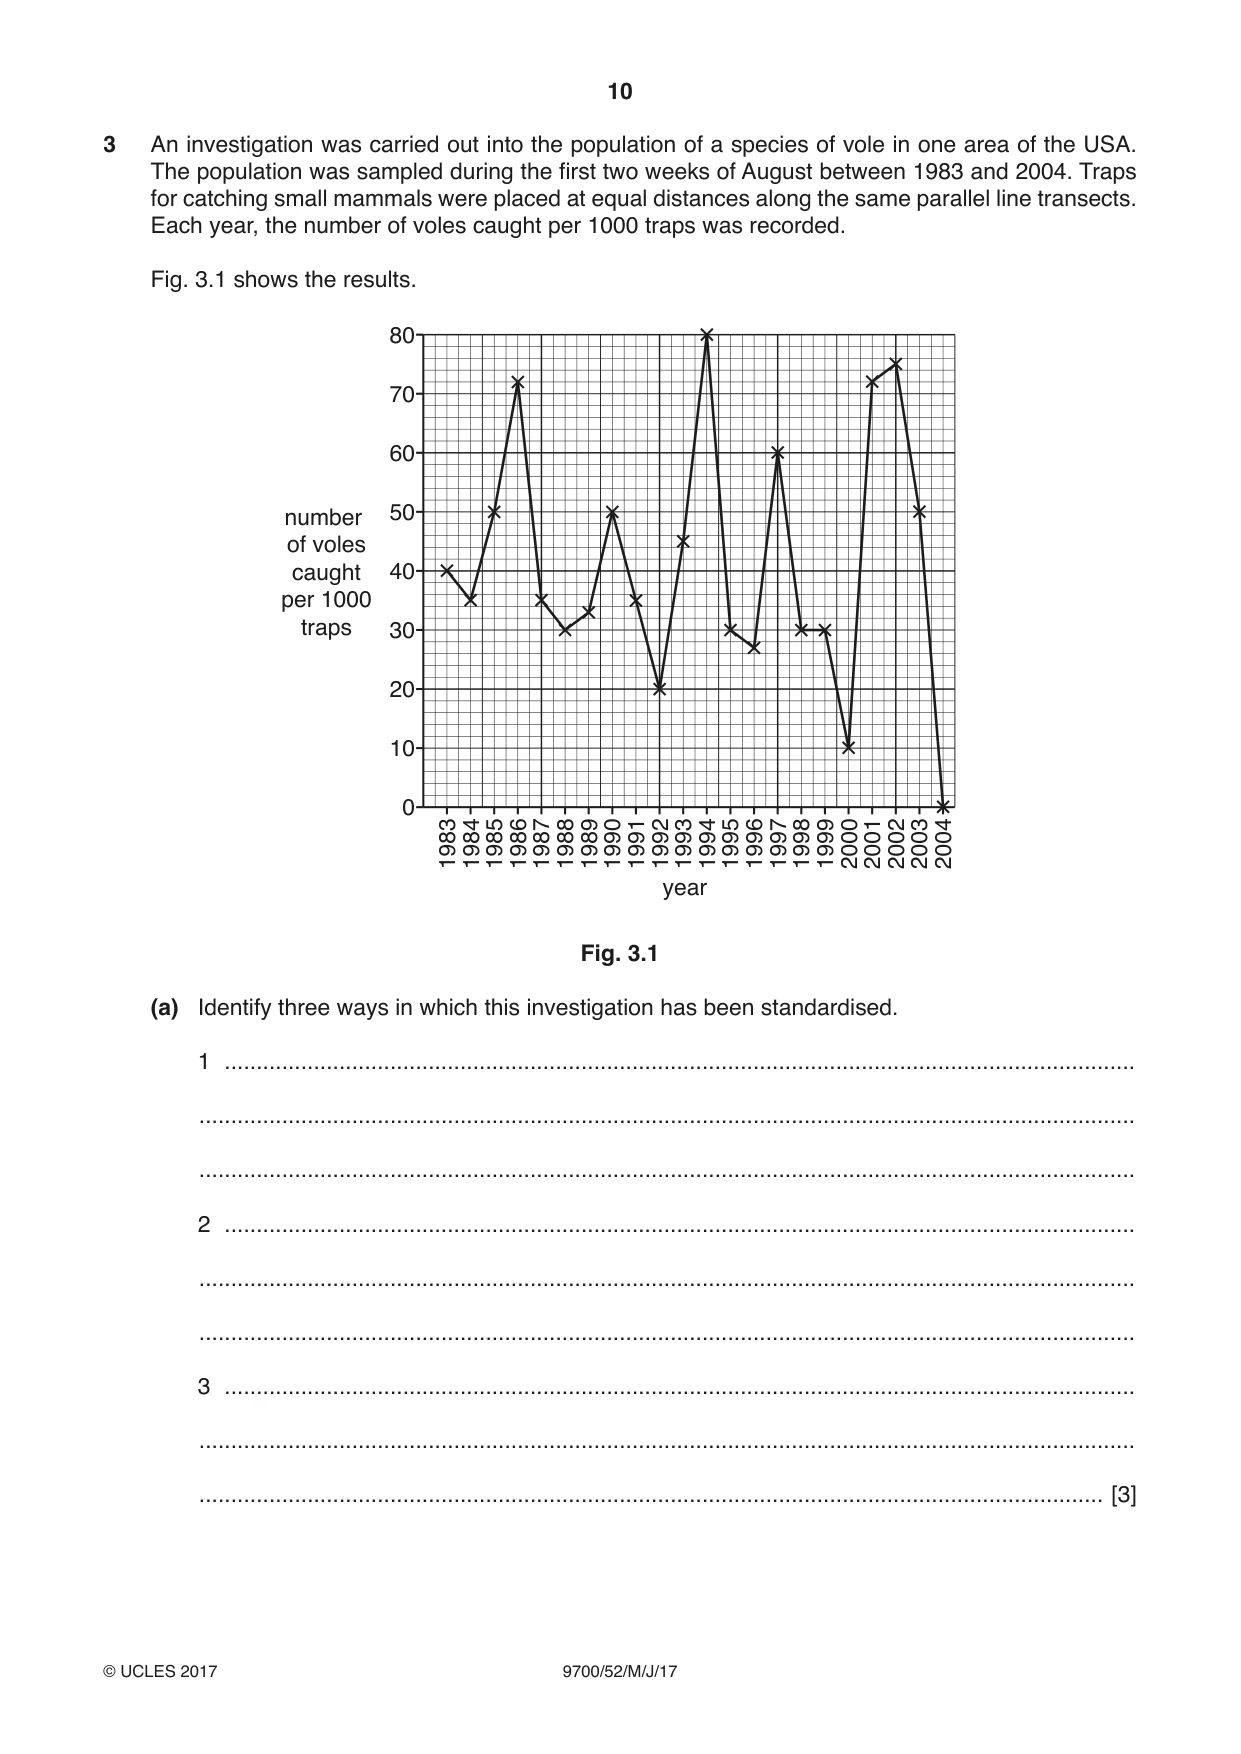
3 An investigation was carried out into the population of a species of vole in one area of the USA. The population was sampled during the first two weeks of August between 1983 and 2004. Traps for catching small mammals were placed at equal distances along the same parallel line transects. Each year, the number of voles caught per 1000 traps was recorded. Fig. 3.1 shows the results. 80 70 60 number 50 of voles caught 40 per 1000 traps 30 20 10 0 1983198419851986198719881989199019911992199319941995199619971998199920002001200220032004 year Fig. 3.1 (a) Identify three ways in which this investigation has been standardised. 1 ............................................................................................................................................... ................................................................................................................................................... ................................................................................................................................................... 2 ............................................................................................................................................... ................................................................................................................................................... ................................................................................................................................................... 3 ............................................................................................................................................... ................................................................................................................................................... .............................................................................................................................................. [3] (b) Over the period of the study, it was found that 8 out of every 50 voles in this population had black fur, whilst all the other voles had brown fur. Fur colour in voles is controlled by a single gene, A/a. Voles with black fur have the genotype aa. The Hardy-Weinberg principle states that: p + q = 1 p2 + 2pq + q2 = 1 p = the frequency of the dominant allele q = the frequency of the recessive allele Use the Hardy-Weinberg principle to calculate the expected number of voles heterozygous for fur colour that were recorded in 1997. Give your answer to the nearest whole number. number of voles per 1000 traps which are heterozygous for brown fur in 1997 = ..................[3] [Total: 6]
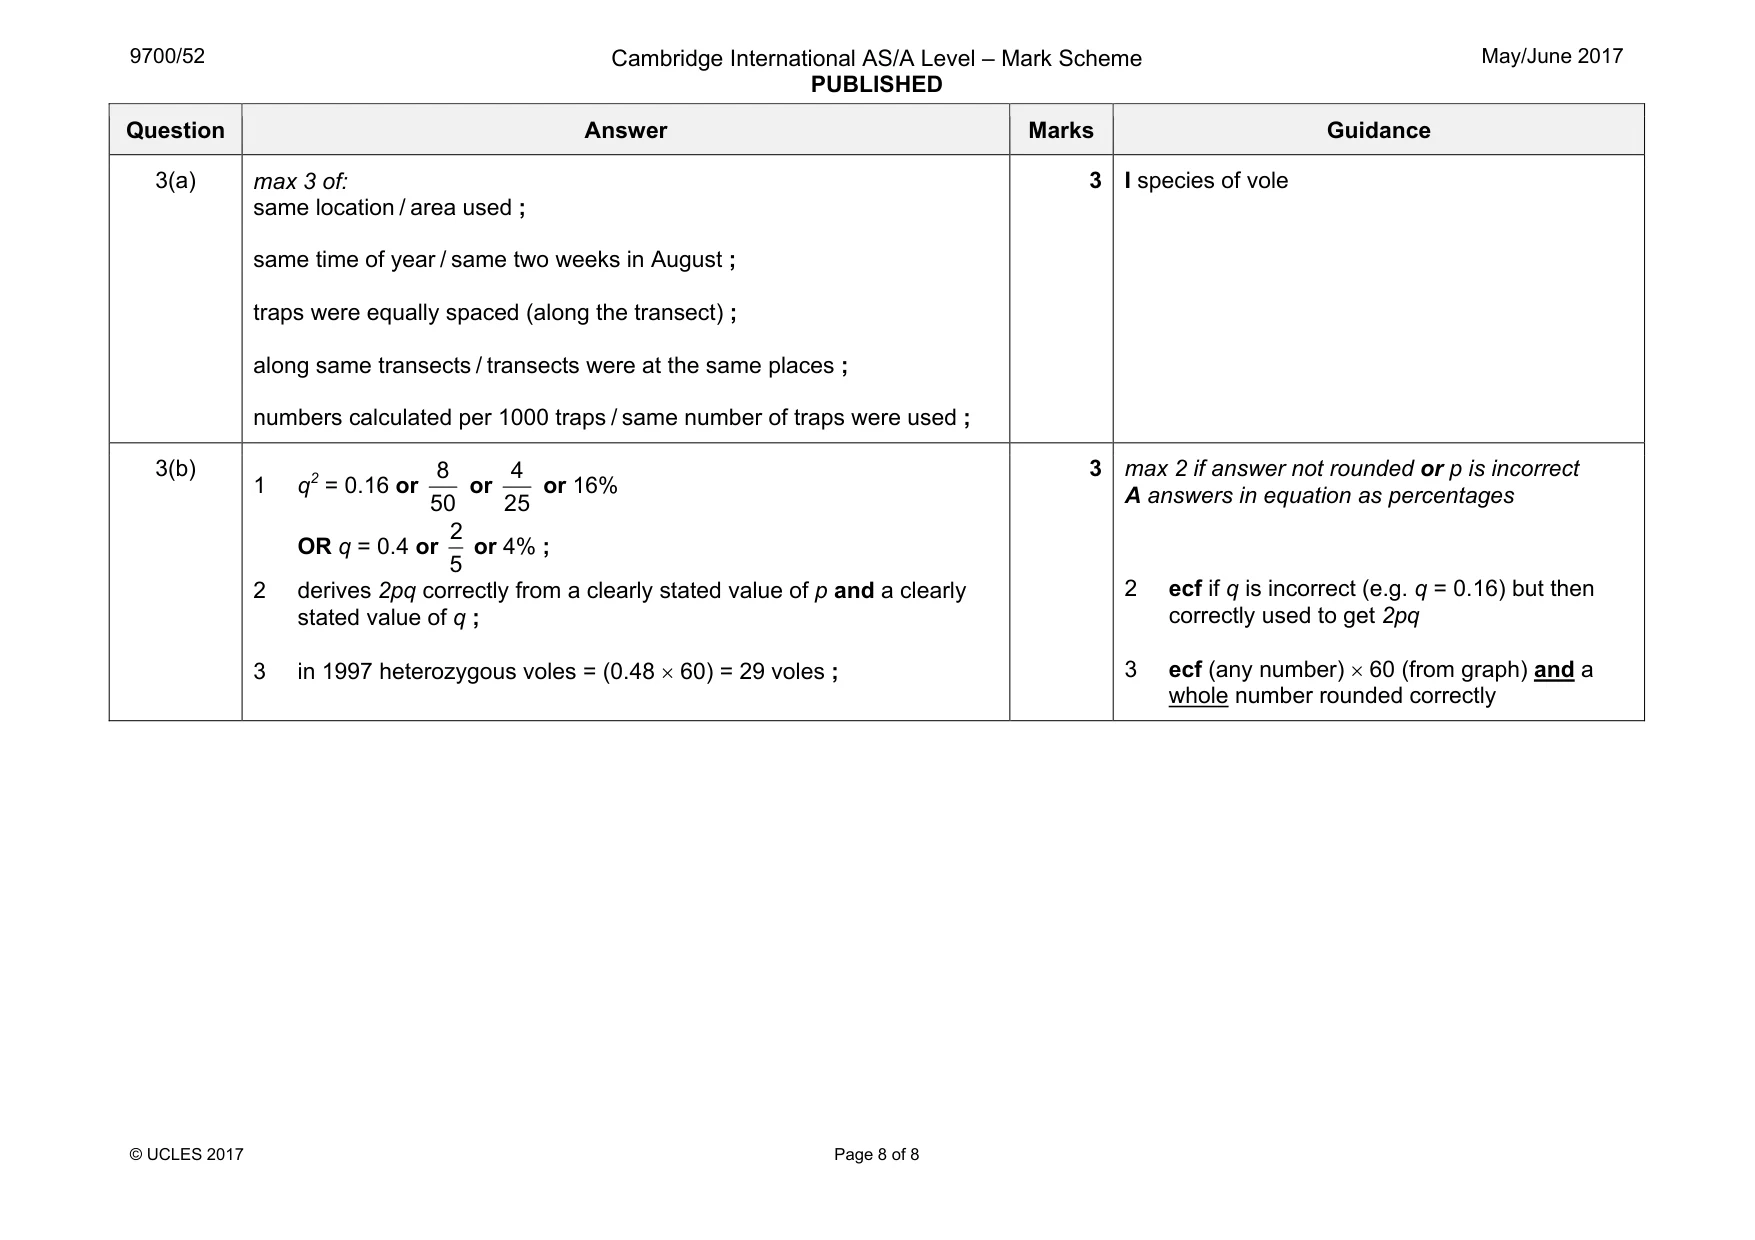
Mark scheme: 3(a) max 3 of: same location / area used ; same time of year / same two weeks in August ; traps were equally spaced (along the transect) ; along same transects / transects were at the same places ; numbers calculated per 1000 traps / same number of traps were used ; 3 3(b) 1 q2 = 0.16 or 8 50 or 4 25 or 16% OR q = 0.4 or 2 5 or 4% ; 2 derives 2pq correctly from a clearly stated value of p and a clearly stated value of q ; 3 in 1997 heterozygous voles = (0.48 × 60) = 29 voles ; 3 max 2 if answer not rounded or p is incorrect A answers in equation as percentages 2 ecf if q is incorrect (e.g. q = 0.16) but then correctly used to get 2pq 3 ecf (any number) × 60 (from graph) and a whole number rounded correctly
What was in this paper
The subtopics covered by these 3 questions, and how many questions each got. Open one in a new tab to see every Cambridge question on it.
What you needed in this session
Cambridge’s own grade thresholds for 2017 May/June, Paper 5 · Variant 2. A higher threshold means an easier paper — the bar moves with how the cohort did.