Cambridge A Level Biology 9700 — 2017 May/June Paper 5 · Variant 3
9700/53/M/J/17 · 2 questions · 30 marks · ≈34 min
The question paper and its mark scheme, free to read here and free to download. This is Cambridge’s own paper, exactly as it was sat.
Question paper12 pages





Mark scheme8 pages
Answers below. Sit the paper first if you are practising.
Questions as text
Q1 · A student used the internet to find information about caffeine and the possible effects…
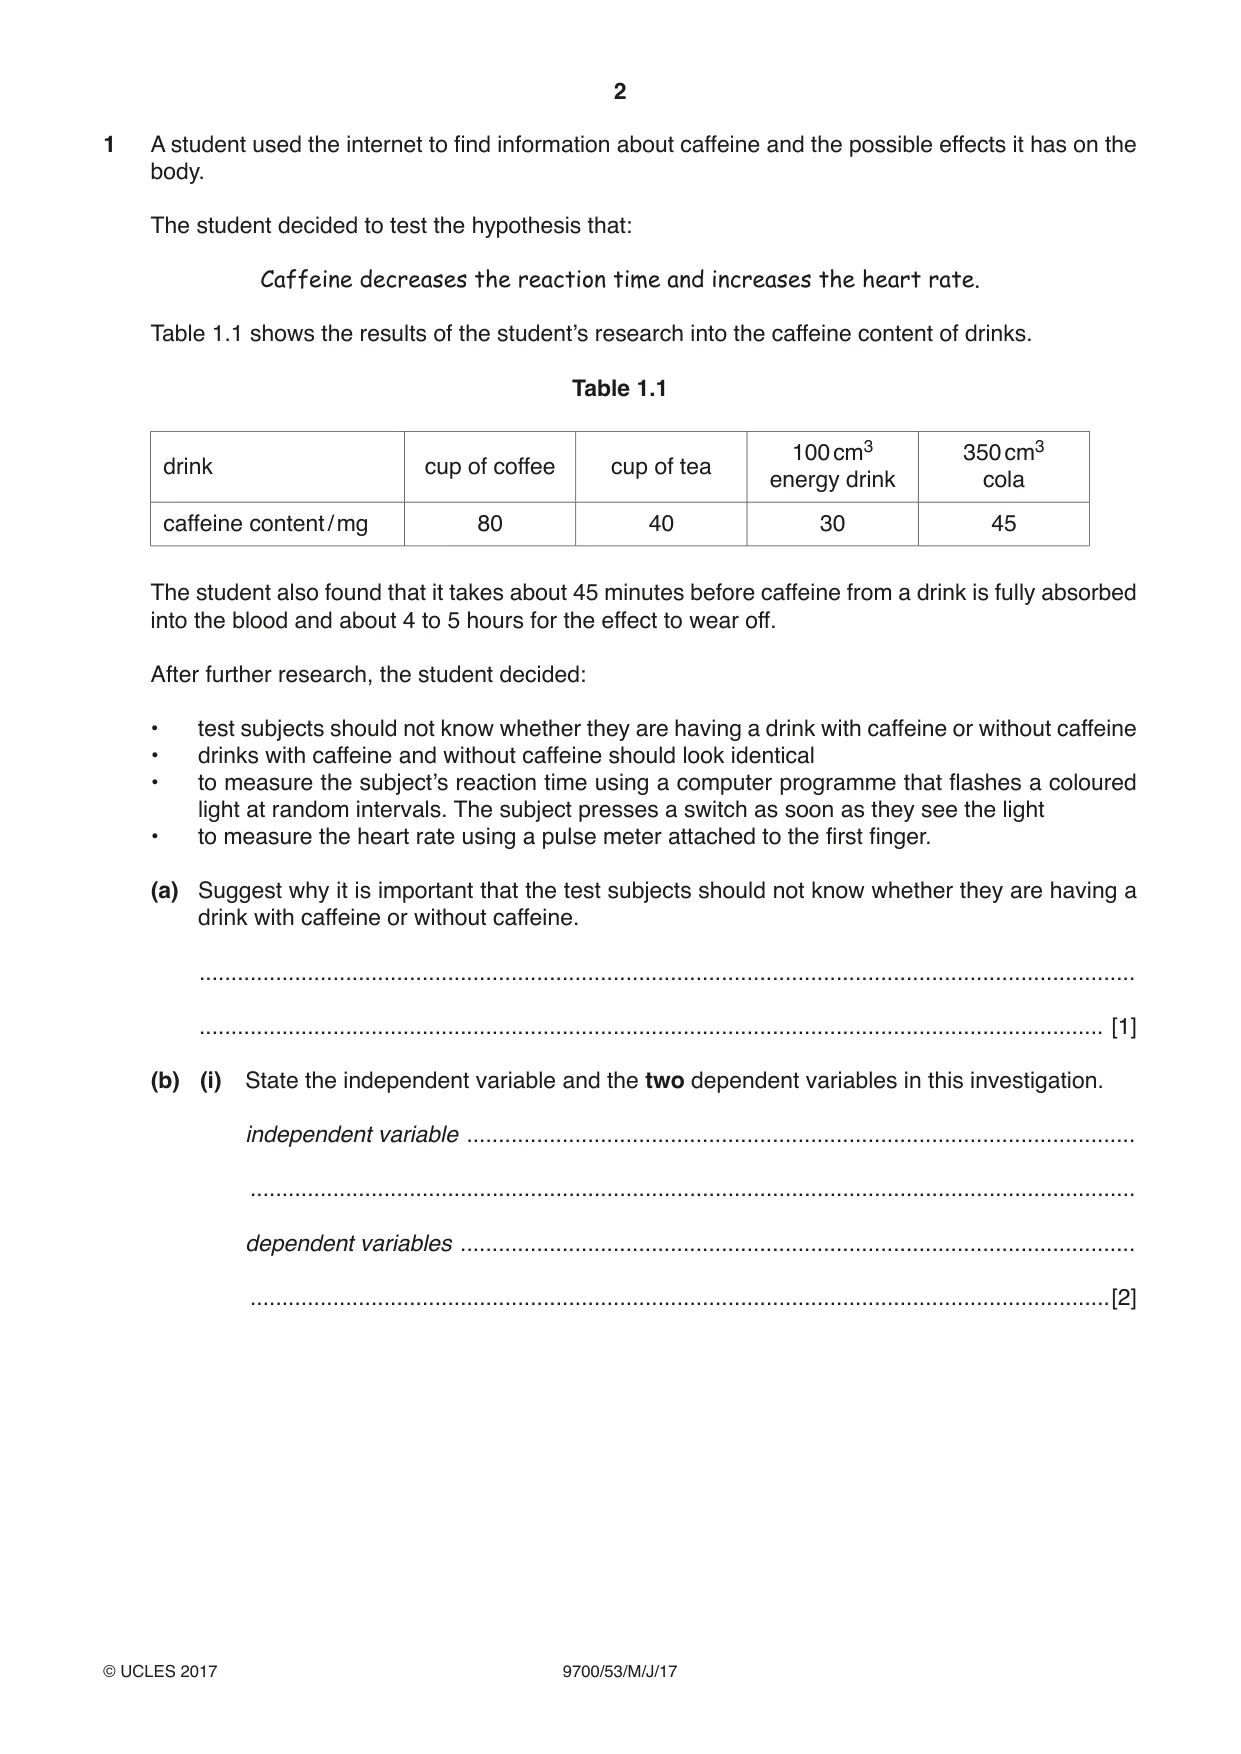
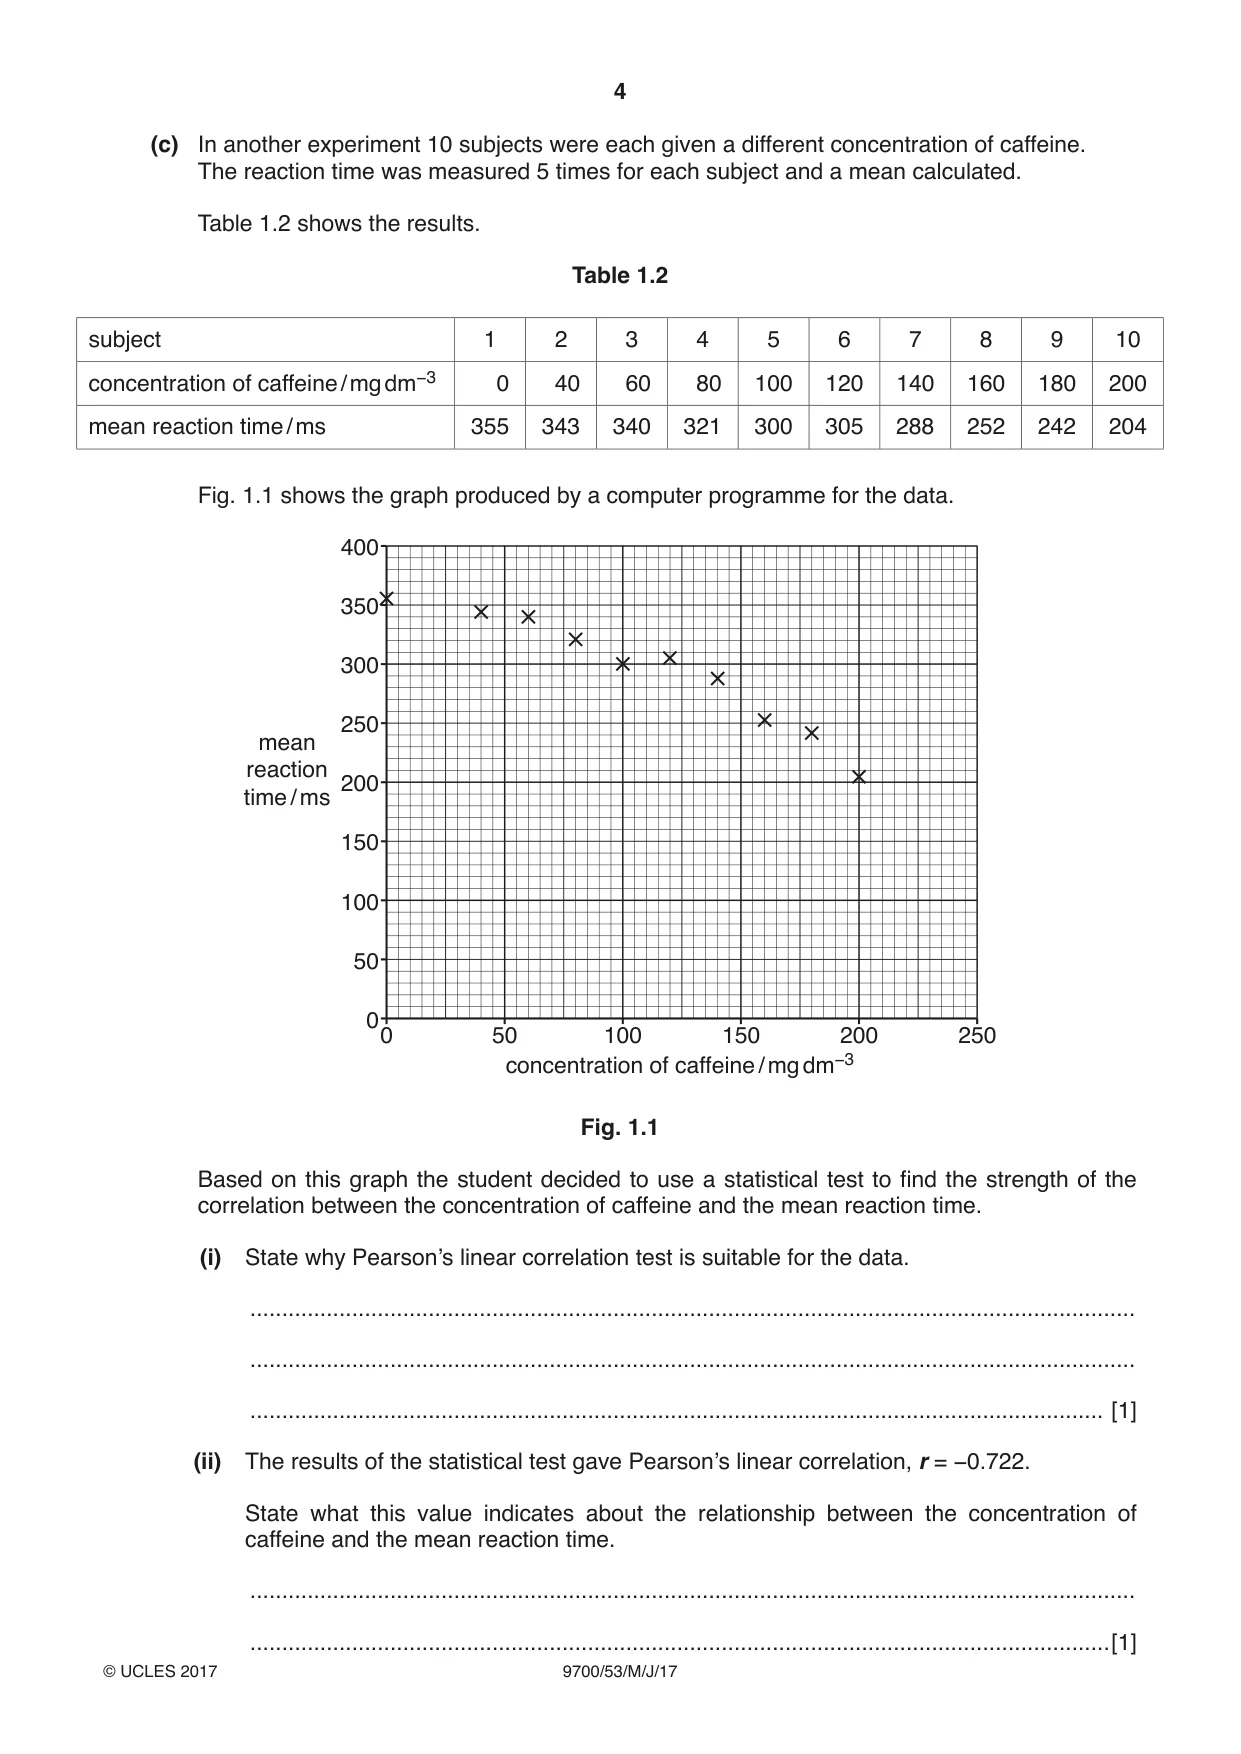
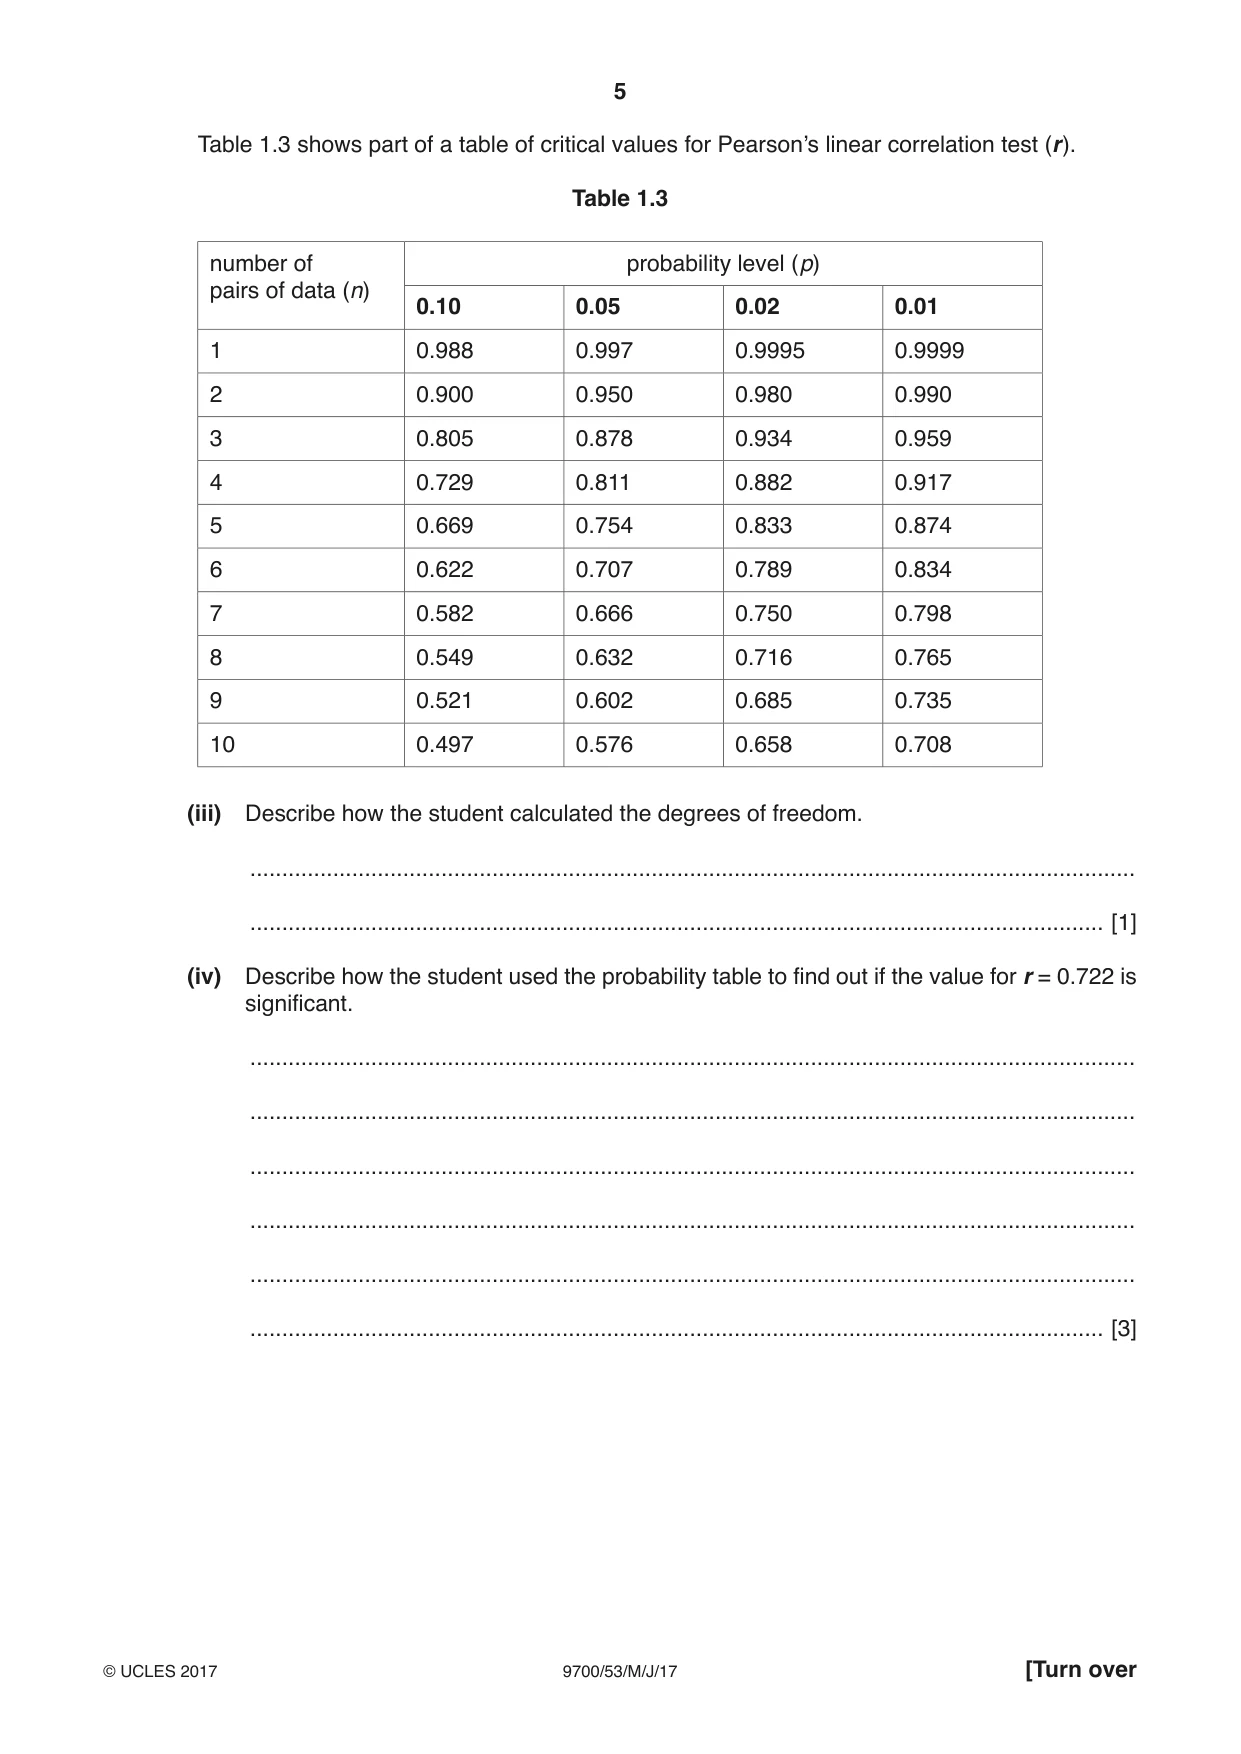
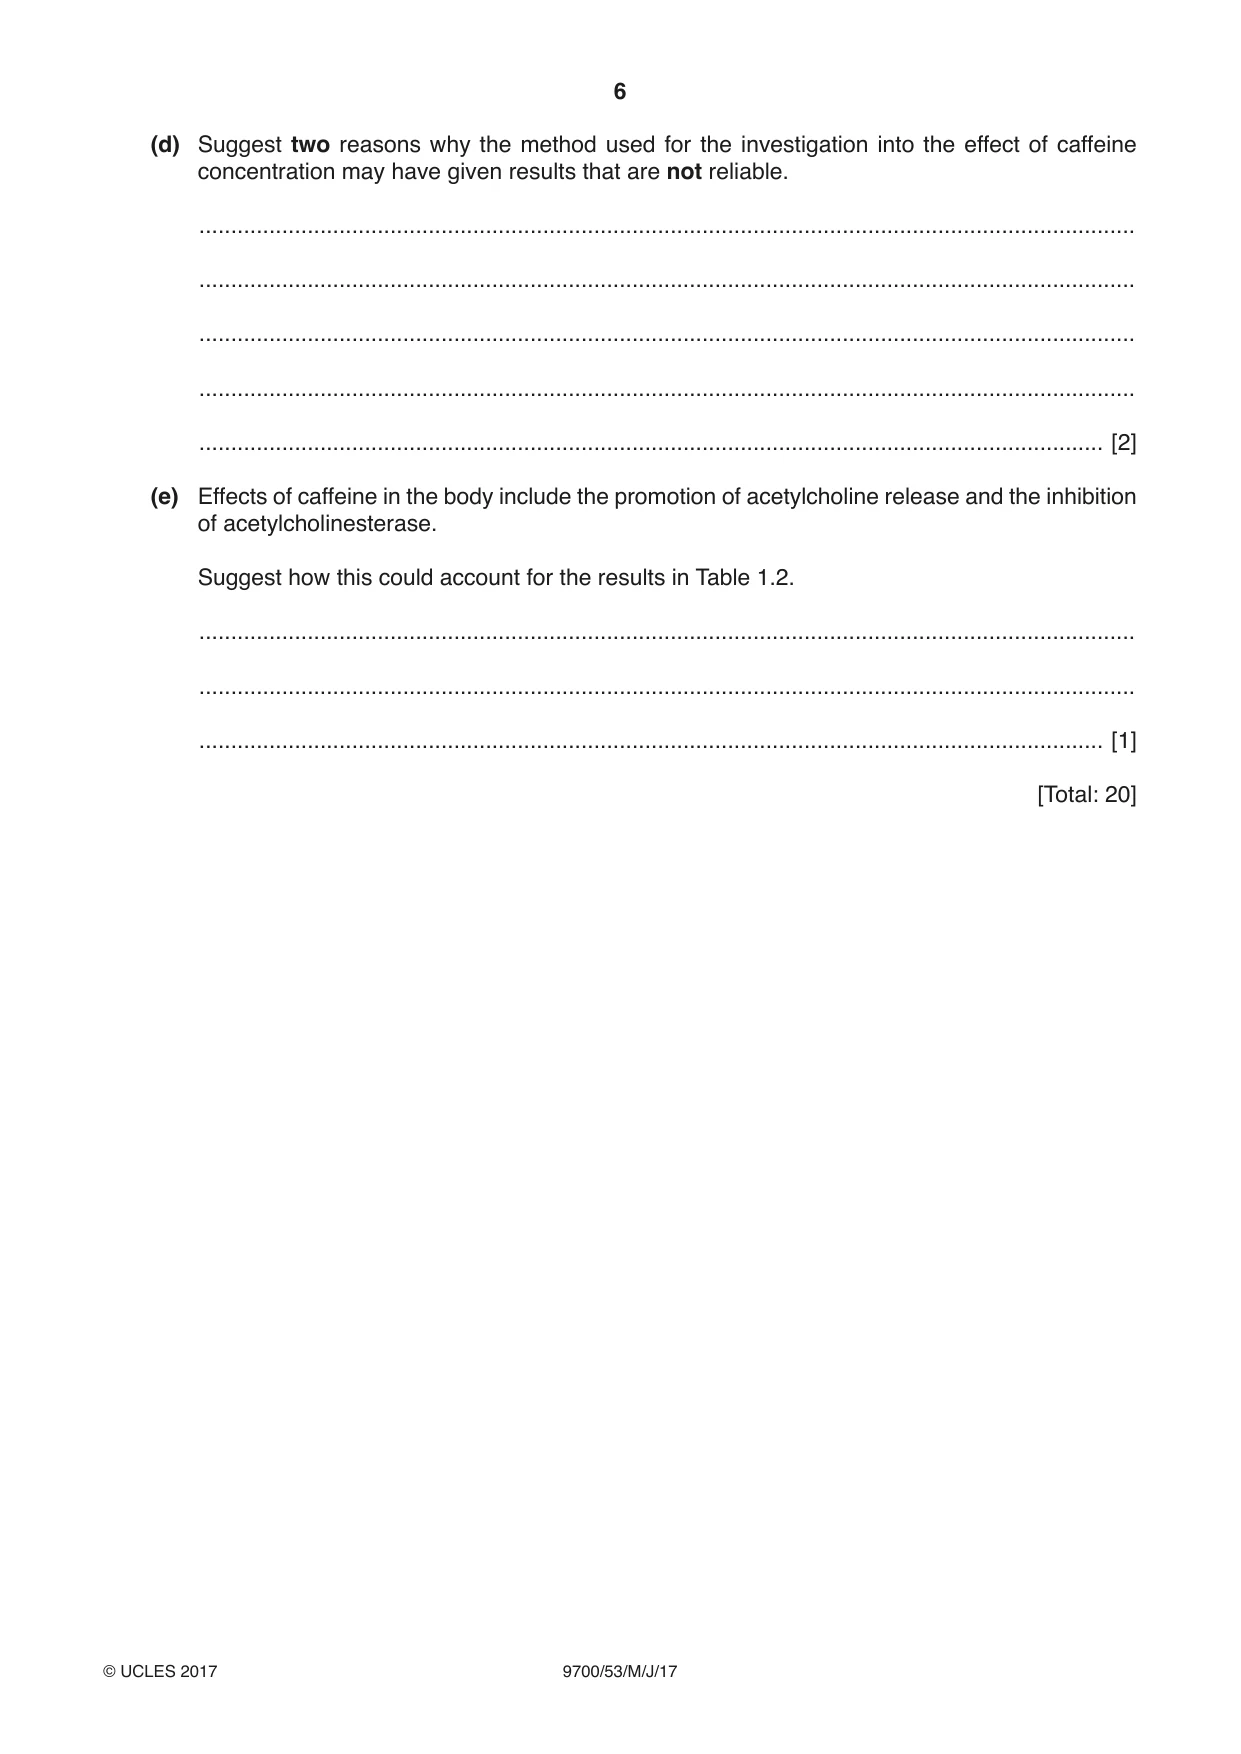
1 A student used the internet to find information about caffeine and the possible effects it has on the body. The student decided to test the hypothesis that: Caffeine decreases the reaction time and increases the heart rate. Table 1.1 shows the results of the student’s research into the caffeine content of drinks. Table 1.1 100 cm3 350 cm3 drink cup of coffee cup of tea energy drink cola caffeine content / mg 80 40 30 45 The student also found that it takes about 45 minutes before caffeine from a drink is fully absorbed into the blood and about 4 to 5 hours for the effect to wear off. After further research, the student decided: • test subjects should not know whether they are having a drink with caffeine or without caffeine • drinks with caffeine and without caffeine should look identical • to measure the subject’s reaction time using a computer programme that flashes a coloured light at random intervals. The subject presses a switch as soon as they see the light • to measure the heart rate using a pulse meter attached to the first finger. (a) Suggest why it is important that the test subjects should not know whether they are having a drink with caffeine or without caffeine. ................................................................................................................................................... .............................................................................................................................................. [1] (b) (i) State the independent variable and the two dependent variables in this investigation. independent variable ......................................................................................................... ........................................................................................................................................... dependent variables .......................................................................................................... .......................................................................................................................................[2] (ii) Use the information given to describe a method by which the student could test their hypothesis using one of the drinks. Your method should be detailed enough for another person to follow. ........................................................................................................................................... ........................................................................................................................................... ........................................................................................................................................... ........................................................................................................................................... ........................................................................................................................................... ........................................................................................................................................... ........................................................................................................................................... ........................................................................................................................................... ........................................................................................................................................... ........................................................................................................................................... ........................................................................................................................................... ........................................................................................................................................... ........................................................................................................................................... ........................................................................................................................................... ........................................................................................................................................... ........................................................................................................................................... ........................................................................................................................................... ........................................................................................................................................... ........................................................................................................................................... ........................................................................................................................................... ........................................................................................................................................... ........................................................................................................................................... ........................................................................................................................................... ........................................................................................................................................... ........................................................................................................................................... ...................................................................................................................................... [8] (c) In another experiment 10 subjects were each given a different concentration of caffeine. The reaction time was measured 5 times for each subject and a mean calculated. Table 1.2 shows the results. Table 1.2 subject 1 2 3 4 5 6 7 8 9 10 concentration of caffeine / mg dm−3 0 40 60 80 100 120 140 160 180 200 mean reaction time / ms 355 343 340 321 300 305 288 252 242 204 Fig. 1.1 shows the graph produced by a computer programme for the data. 400 350 300 250 mean reaction 200 time / ms 150 100 50 0 0 50 100 150 200 250 concentration of caffeine / mg dm−3 Fig. 1.1 Based on this graph the student decided to use a statistical test to find the strength of the correlation between the concentration of caffeine and the mean reaction time. (i) State why Pearson’s linear correlation test is suitable for the data. ........................................................................................................................................... ........................................................................................................................................... ...................................................................................................................................... [1] (ii) The results of the statistical test gave Pearson’s linear correlation, r = −0.722. State what this value indicates about the relationship between the concentration of caffeine and the mean reaction time. ........................................................................................................................................... .......................................................................................................................................[1] Table 1.3 shows part of a table of critical values for Pearson’s linear correlation test (r). Table 1.3 number of probability level (p) pairs of data (n) 0.10 0.05 0.02 0.01 1 0.988 0.997 0.9995 0.9999 2 0.900 0.950 0.980 0.990 3 0.805 0.878 0.934 0.959 4 0.729 0.811 0.882 0.917 5 0.669 0.754 0.833 0.874 6 0.622 0.707 0.789 0.834 7 0.582 0.666 0.750 0.798 8 0.549 0.632 0.716 0.765 9 0.521 0.602 0.685 0.735 10 0.497 0.576 0.658 0.708 (iii) Describe how the student calculated the degrees of freedom. ........................................................................................................................................... ...................................................................................................................................... [1] (iv) Describe how the student used the probability table to find out if the value for r = 0.722 is significant. ........................................................................................................................................... ........................................................................................................................................... ........................................................................................................................................... ........................................................................................................................................... ........................................................................................................................................... ...................................................................................................................................... [3] (d) Suggest two reasons why the method used for the investigation into the effect of caffeine concentration may have given results that are not reliable. ................................................................................................................................................... ................................................................................................................................................... ................................................................................................................................................... ................................................................................................................................................... .............................................................................................................................................. [2] (e) Effects of caffeine in the body include the promotion of acetylcholine release and the inhibition of acetylcholinesterase. Suggest how this could account for the results in Table 1.2. ................................................................................................................................................... ................................................................................................................................................... .............................................................................................................................................. [1] [Total: 20] Question 2 starts on page 8
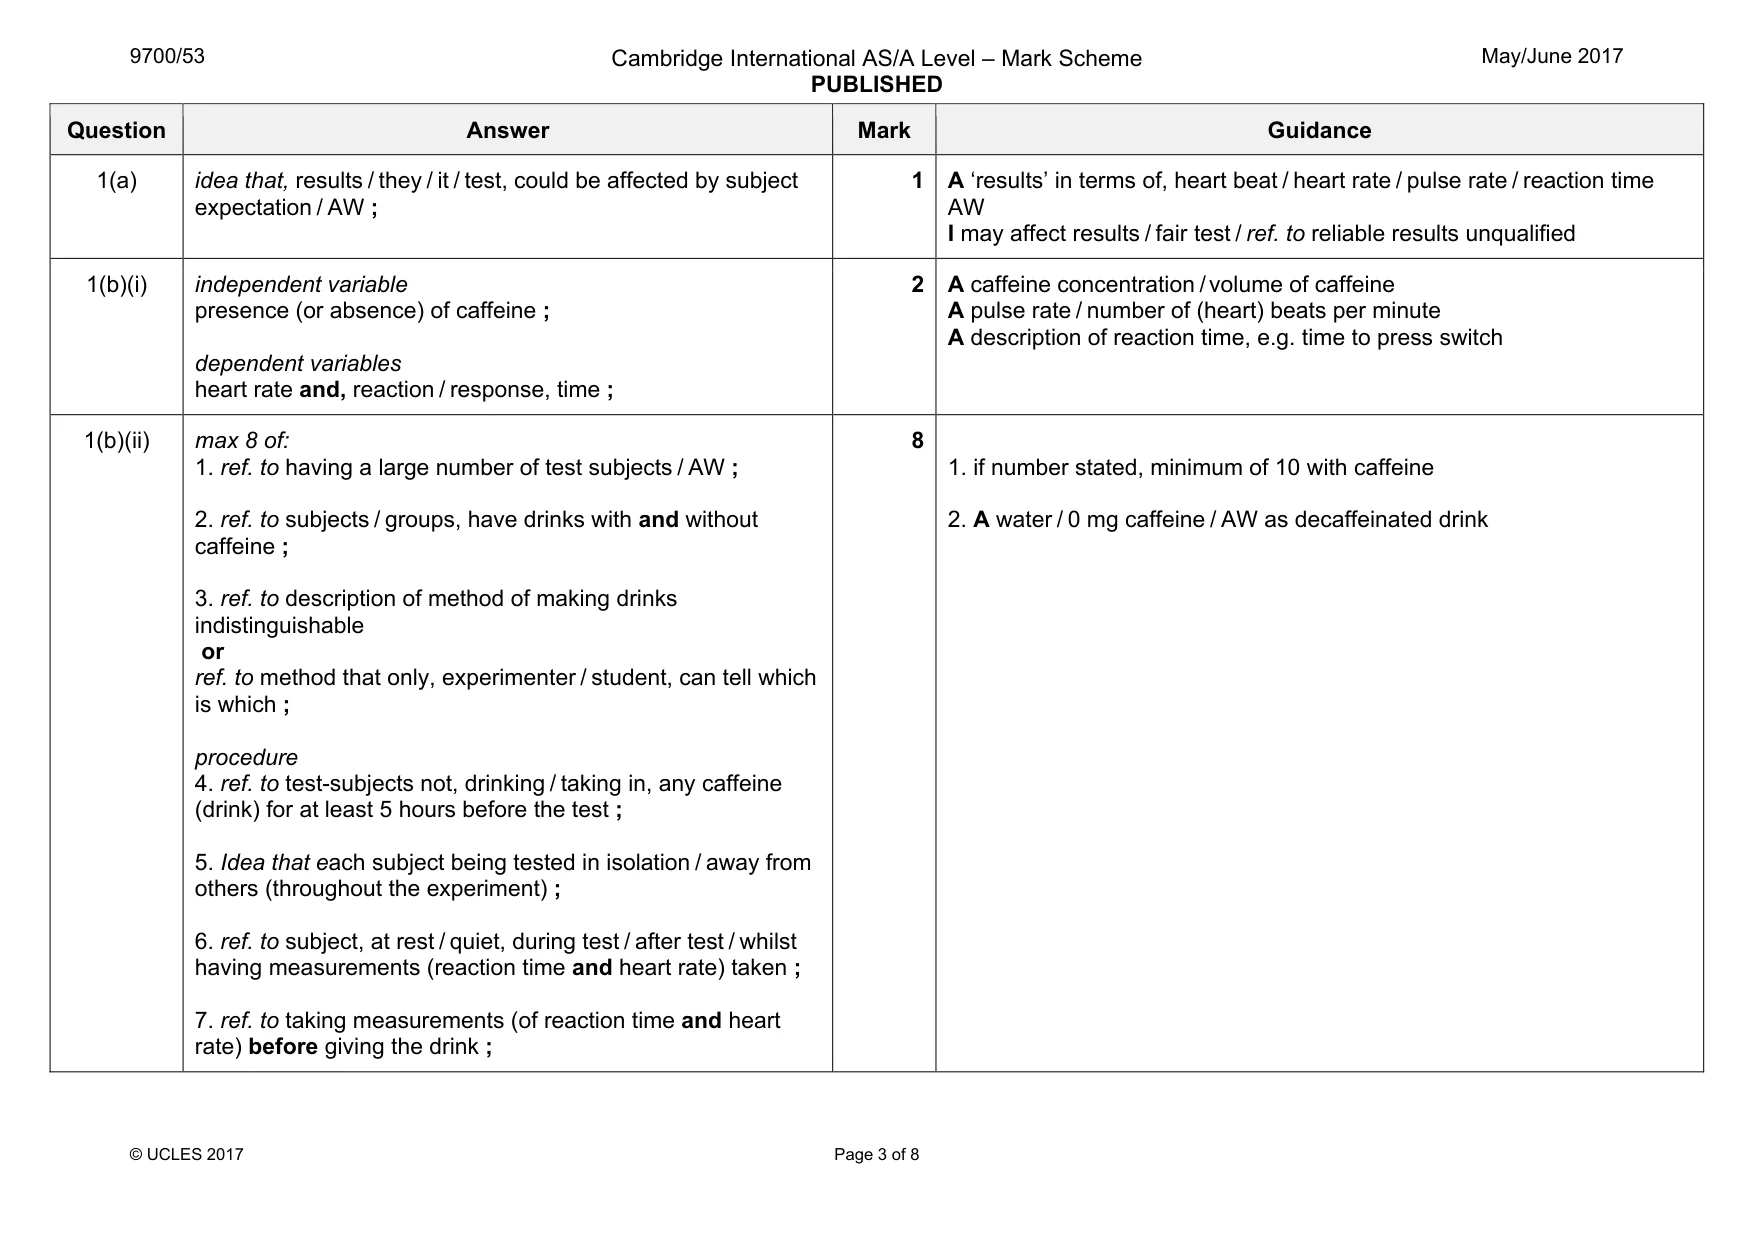
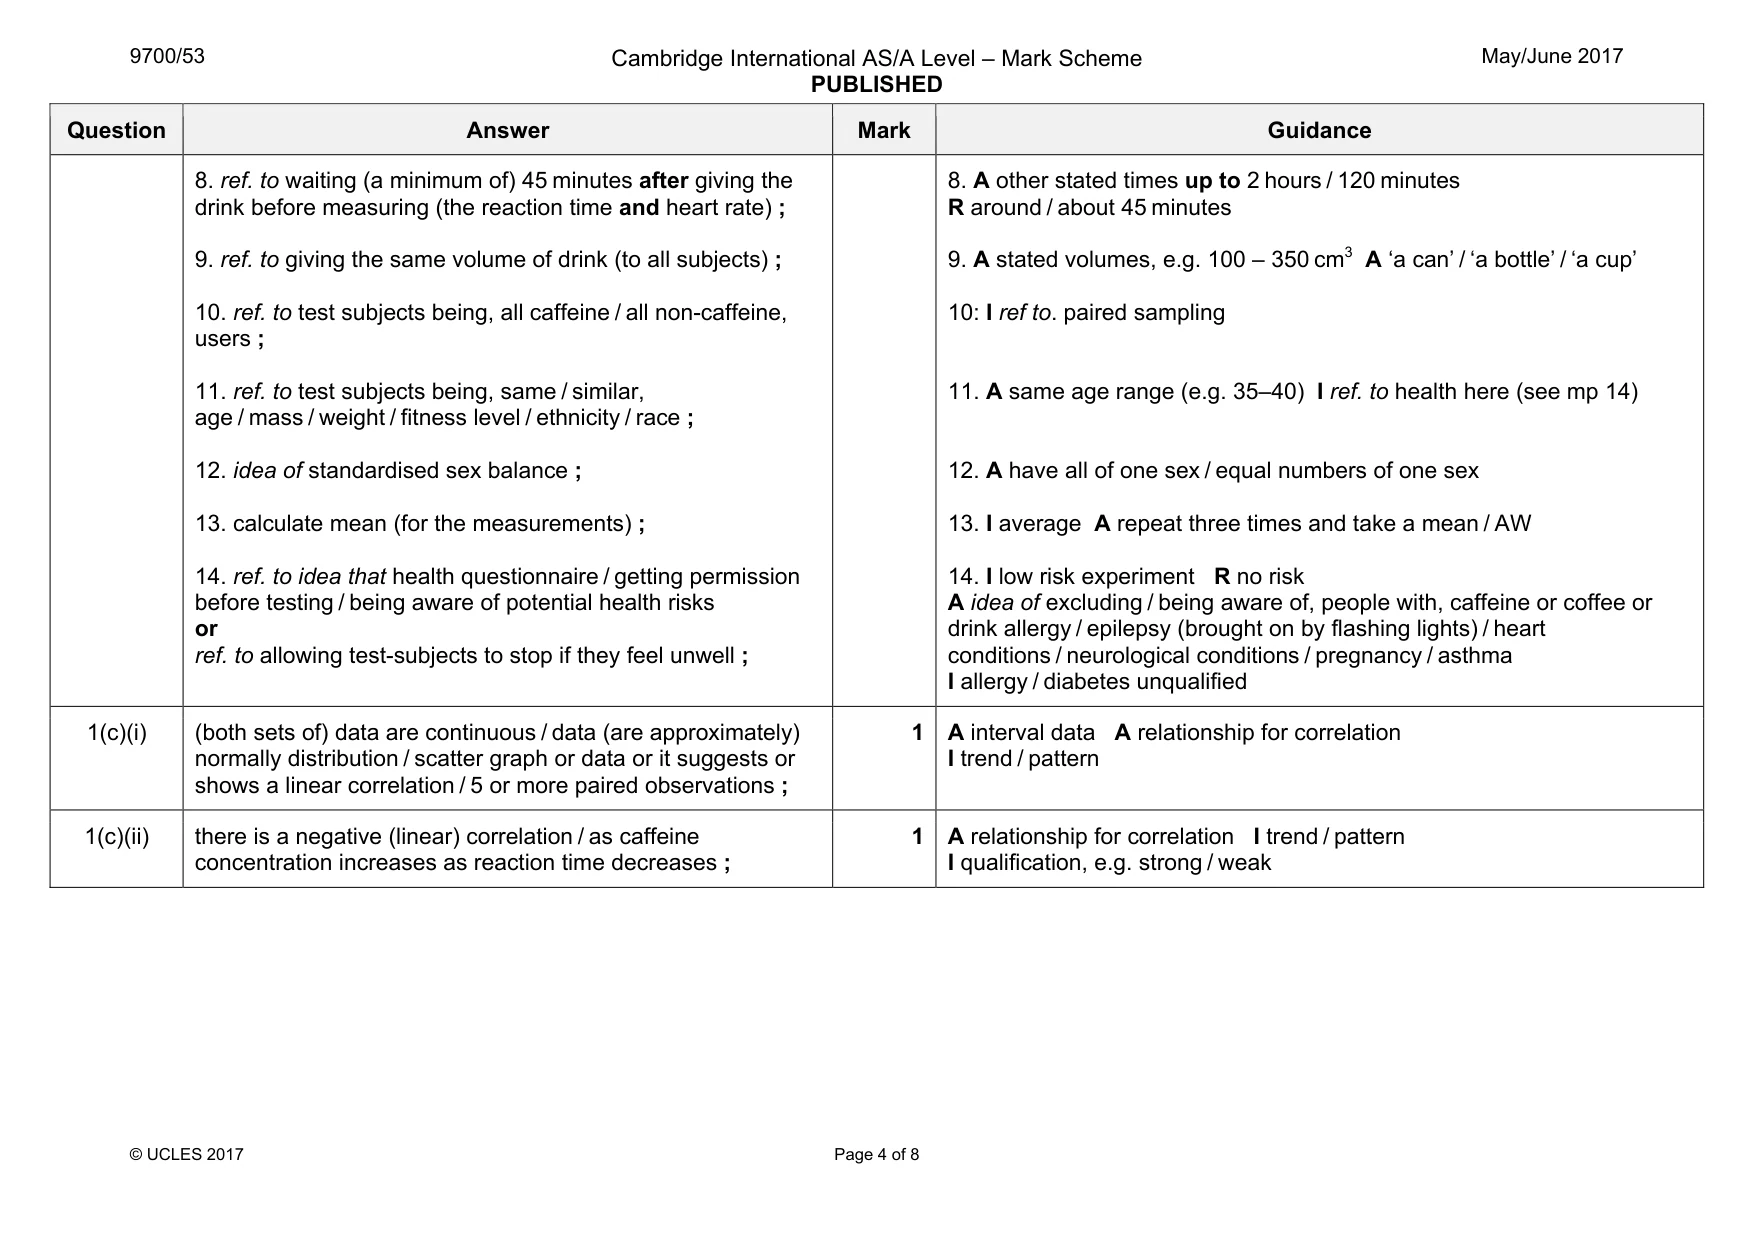
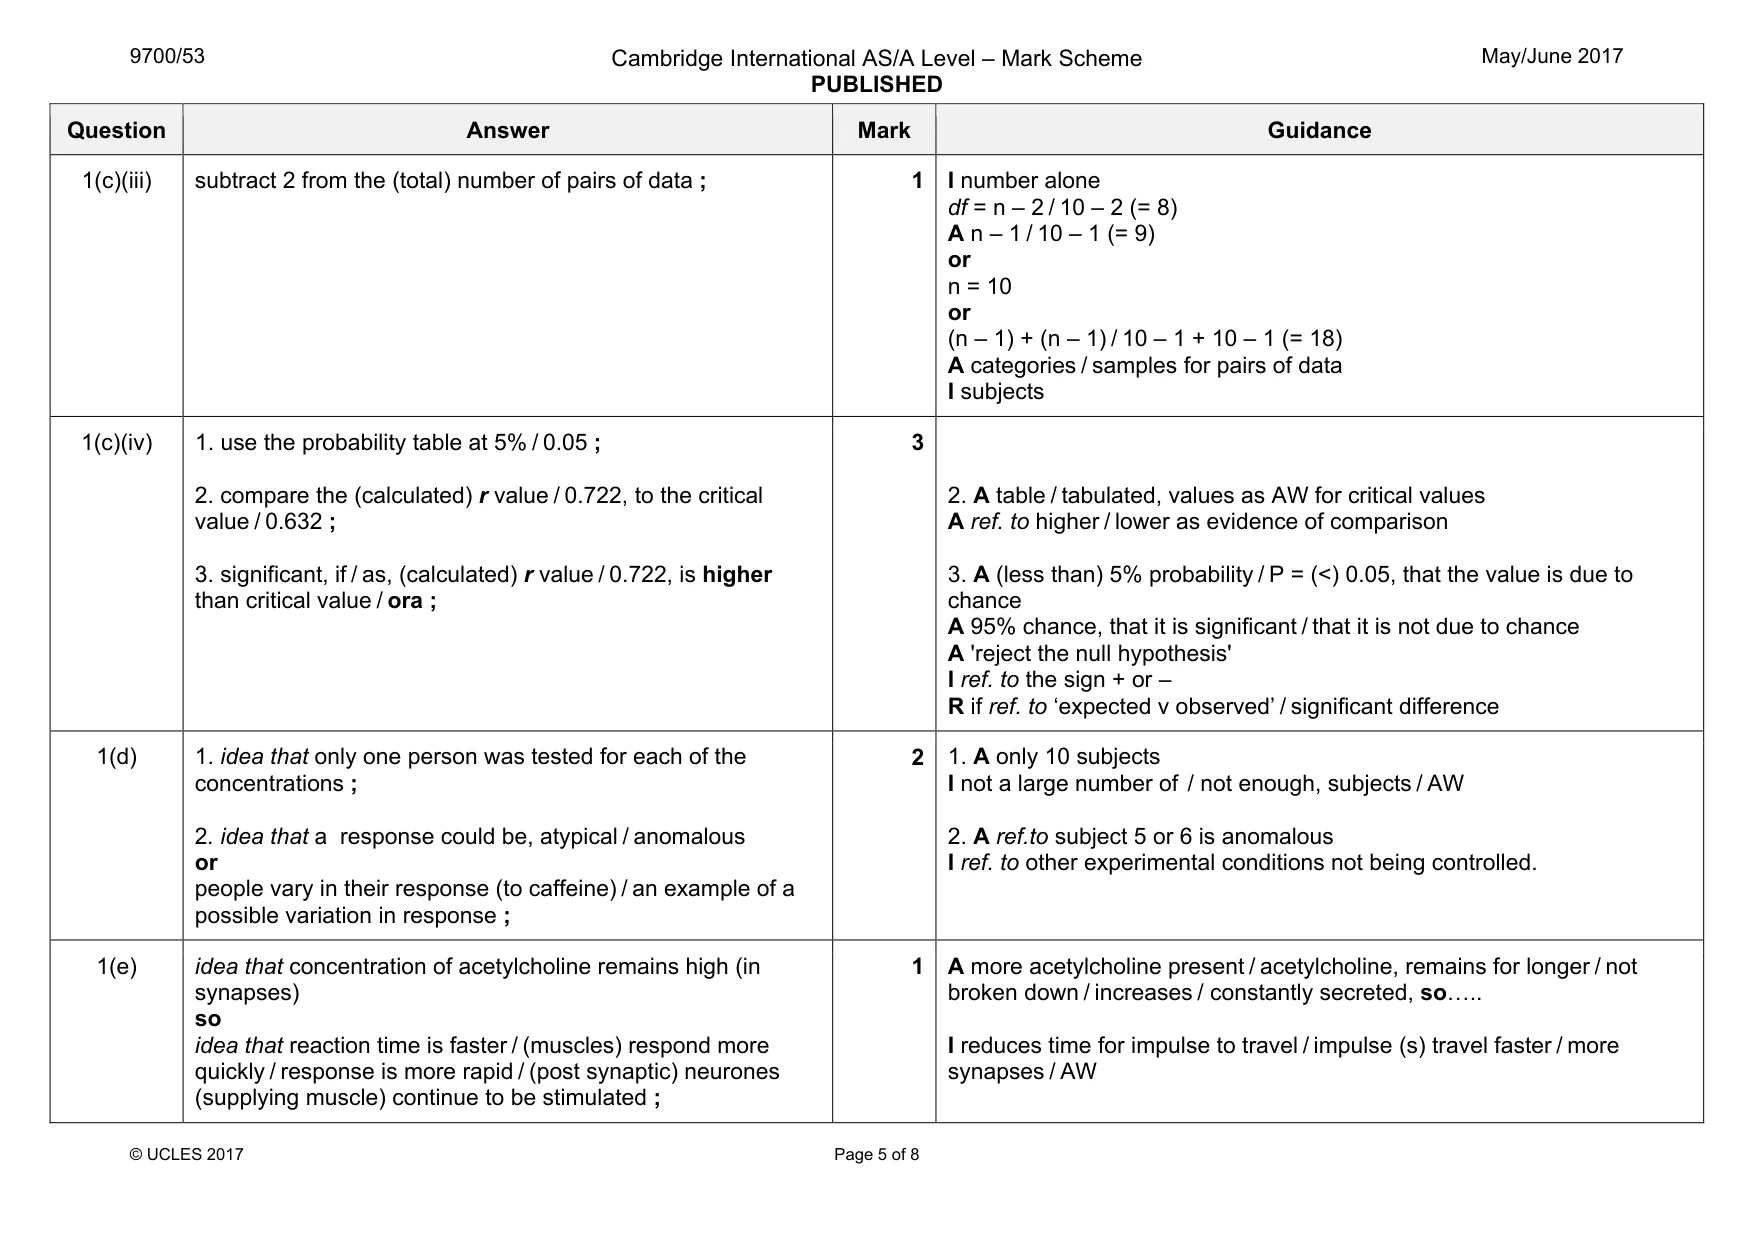
Mark scheme: 1(a) idea that, results / they / it / test, could be affected by subject expectation / AW ; 1 AW I may affect results / fair test / ref. to reliable results unqualified 1(b)(i) independent variable presence (or absence) of caffeine ; dependent variables heart rate and, reaction / response, time ; 2 A caffeine concentration / volume of caffeine A pulse rate / number of (heart) beats per minute A description of reaction time, e.g. time to press switch 1(b)(ii) max 8 of: 1. ref. to having a large number of test subjects / AW ; 2. ref. to subjects / groups, have drinks with and without caffeine ; 3. ref. to description of method of making drinks indistinguishable or ref. to method that only, experimenter / student, can tell which is which ; procedure 4. ref. to test-subjects not, drinking / taking in, any caffeine (drink) for at least 5 hours before the test ; 5. Idea that each subject being tested in isolation / away from others (throughout the experiment) ; 6. ref. to subject, at rest / quiet, during test / after test / whilst having measurements (reaction time and heart rate) taken ; 7. ref. to taking measurements (of reaction time and heart rate) before giving the drink ; 8 1. if number stated, minimum of 10 with caffeine 2. A water / 0 mg caffeine / AW as decaffeinated drink Question Answer Mark Guidance 8. ref. to waiting (a minimum of) 45 minutes after giving the drink before measuring (the reaction time and heart rate) ; 9. ref. to giving the same volume of drink (to all subjects) ; 10. ref. to test subjects being, all caffeine / all non-caffeine, users ; 11. ref. to test subjects being, same / similar, age / mass / weight / fitness level / ethnicity / race ; 12. idea of standardised sex balance ; 13. calculate mean (for the measurements) ; 14. ref. to idea that health questionnaire / getting permission before testing / being aware of potential health risks or ref. to allowing test-subjects to stop if they feel unwell ; 8. A other stated times up to 2 hours / 120 minutes R around / about 45 minutes 9. A stated volumes, e.g. 100 – 350 cm3 A ‘a can’ / ‘a bottle’ / ‘a cup’ 10: I ref to. paired sampling 11. A same age range (e.g. 35–40) I ref. to health here (see mp 14) 12. A have all of one sex / equal numbers of one sex 13. I average A repeat three times and take a mean / AW 14. I low risk experiment R no risk A idea of excluding / being aware of, people with, caffeine or coffee or drink allergy / epilepsy (brought on by flashing lights) / heart conditions / neurological conditions / pregnancy / asthma I allergy / diabetes unqualified 1(c)(i) (both sets of) data are continuous / data (are approximately) normally distribution / scatter graph or data or it suggests or shows a linear correlation / 5 or more paired observations ; 1 A interval data A relationship for correlation I trend / pattern 1(c)(ii) there is a negative (linear) correlation / as caffeine concentration increases as reaction time decreases ; 1 A relationship for correlation I trend / pattern I qualification, e.g. strong / weak Question Answer Mark Guidance 1(c)(iii) subtract 2 from the (total) number of pairs of data ; 1 I number alone df = n – 2 / 10 – 2 (= 8) A n – 1 / 10 – 1 (= 9) or n = 10 or (n – 1) + (n – 1) / 10 – 1 + 10 – 1 (= 18) A categories / samples for pairs of data I subjects 1(c)(iv) 1. use the probability table at 5% / 0.05 ; 2. compare the (calculated) r value / 0.722, to the critical value / 0.632 ; 3. significant, if / as, (calculated) r value / 0.722, is higher than critical value / ora ; 3 2. A table / tabulated, values as AW for critical values A ref. to higher / lower as evidence of comparison 3. A (less than) 5% probability / P = (<) 0.05, that the value is due to chance A 95% chance, that it is significant / that it is not due to chance A 'reject the null hypothesis' I ref. to the sign + or – R if ref. to ‘expected v observed’ / significant difference 1(d) 1. idea that only one person was tested for each of the concentrations ; 2. idea that a response could be, atypical / anomalous or people vary in their response (to caffeine) / an example of a possible variation in response ; 2 1. A only 10 subjects I not a large number of / not enough, subjects / AW 2. A ref.to subject 5 or 6 is anomalous I ref. to other experimental conditions not being controlled. 1(e) idea that concentration of acetylcholine remains high (in synapses) so idea that reaction time is faster / (muscles) respond more quickly / response is more rapid / (post synaptic) neurones (supplying muscle) continue to be stimulated ; 1 A more acetylcholine present / acetylcholine, remains for longer / not broken down / increases / constantly secreted, so«.. I reduces time for impulse to travel / impulse (s) travel faster / more synapses / AW
Q2 · An investigation was carried out into the size of individuals in a species of ground…
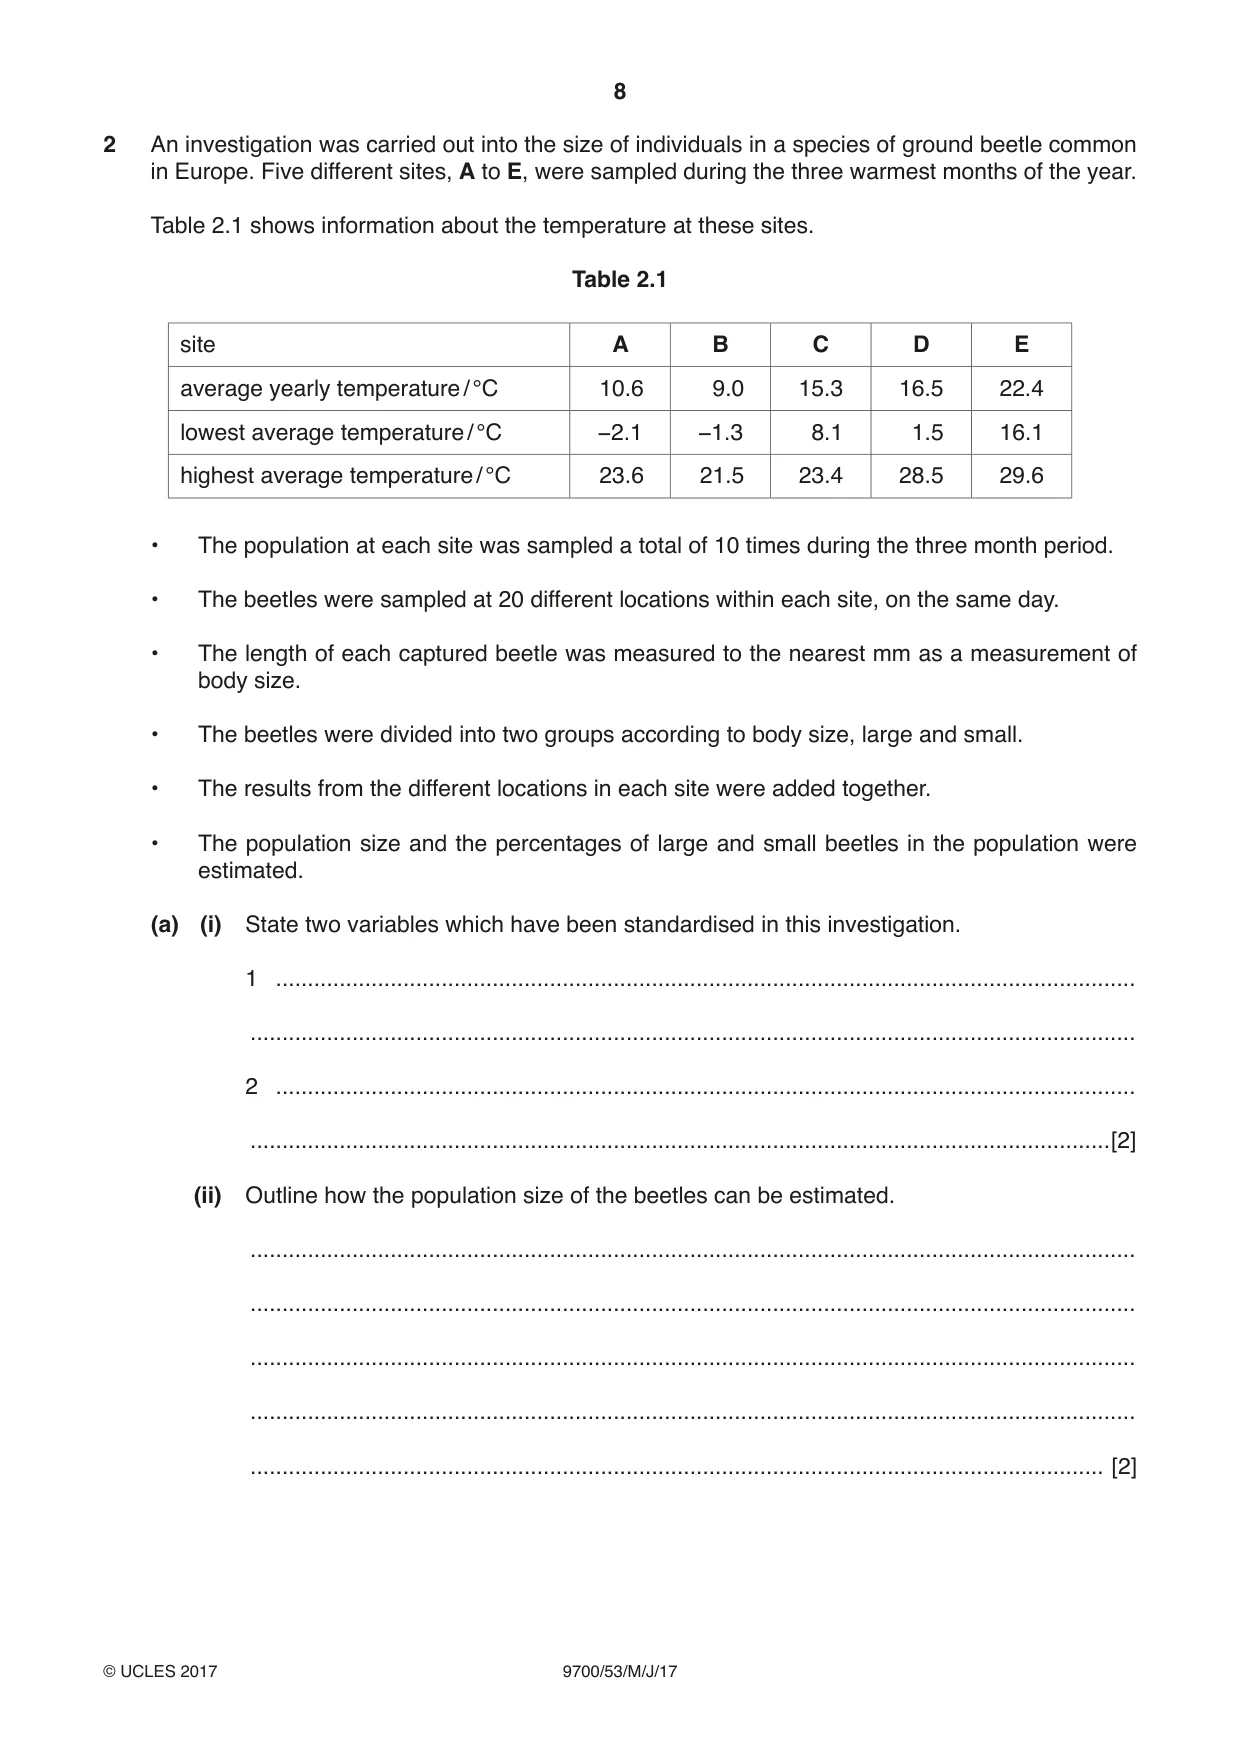
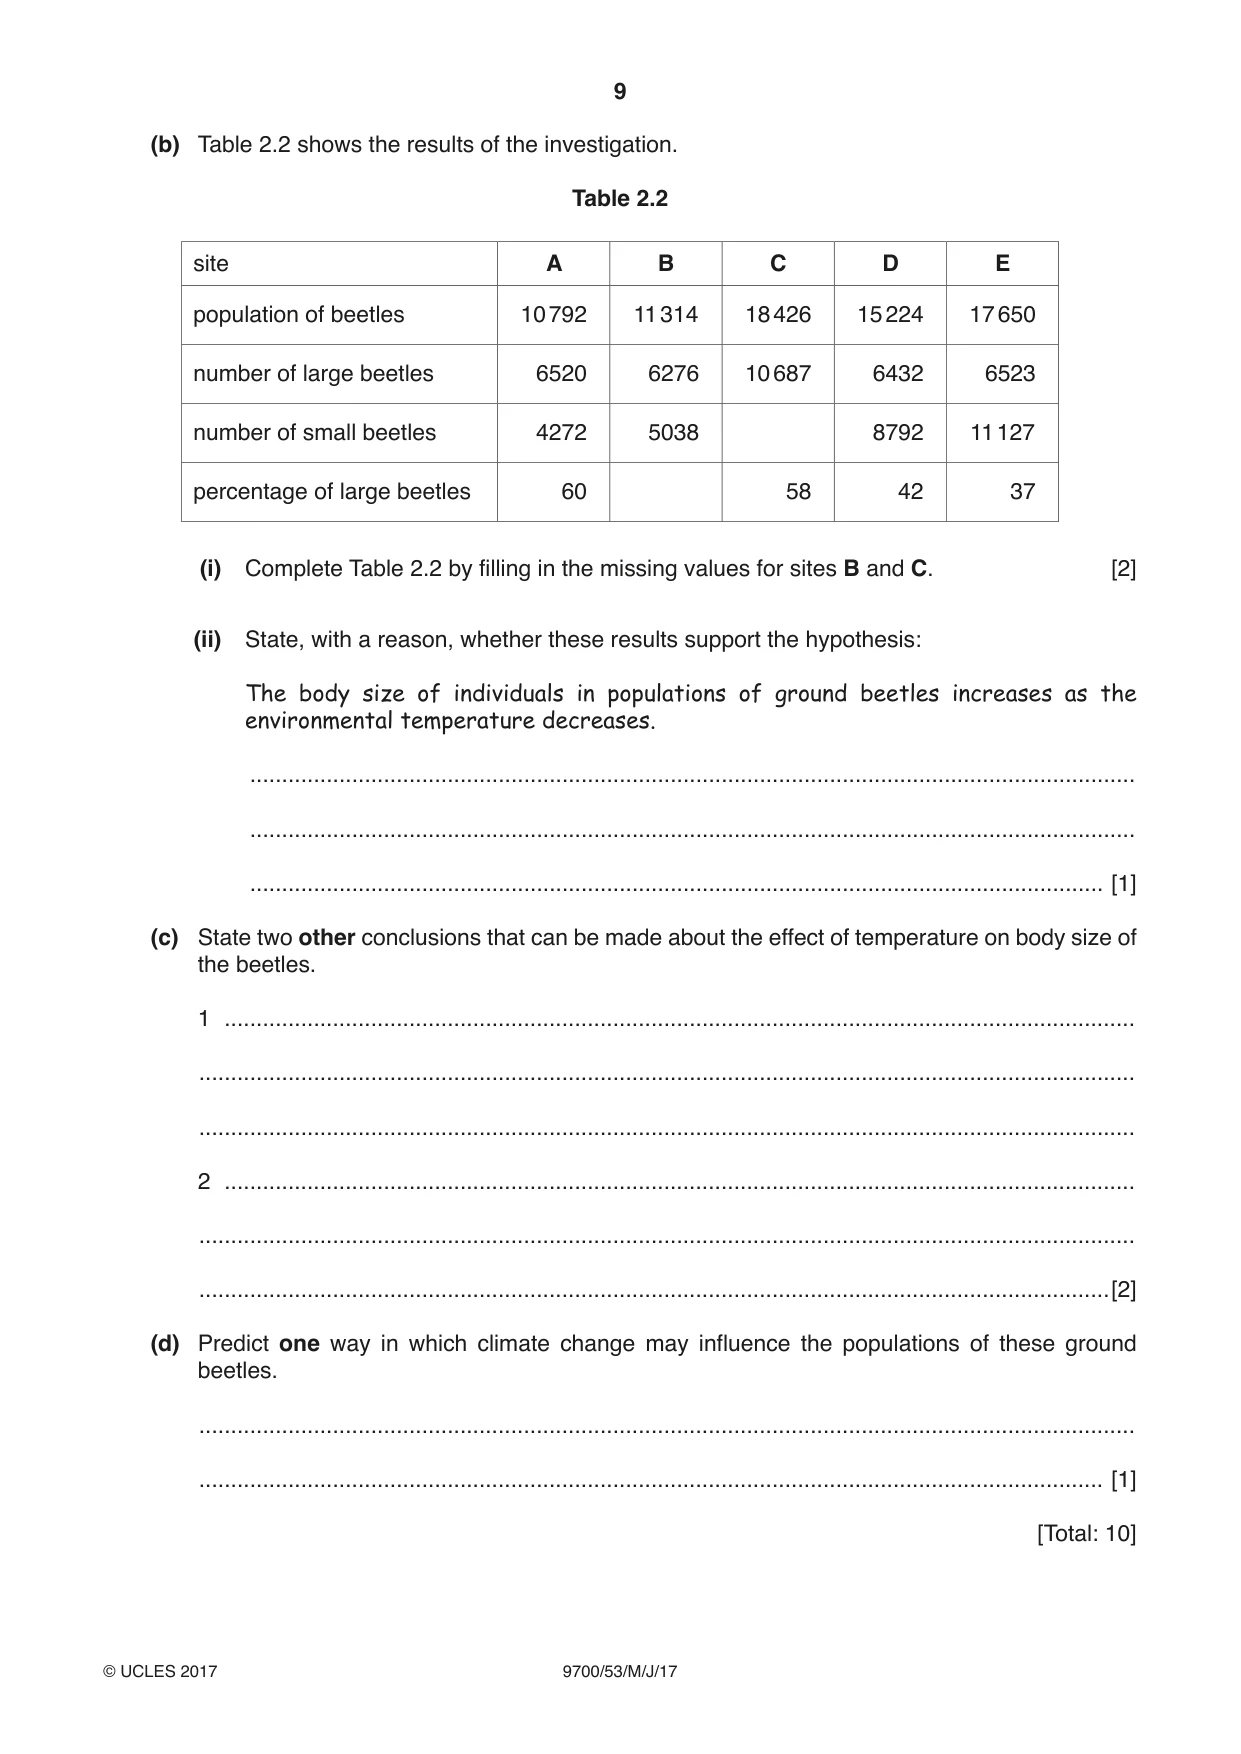
2 An investigation was carried out into the size of individuals in a species of ground beetle common in Europe. Five different sites, A to E, were sampled during the three warmest months of the year. Table 2.1 shows information about the temperature at these sites. Table 2.1 site A B C D E average yearly temperature / °C 10.6 9.0 15.3 16.5 22.4 lowest average temperature / °C −2.1 −1.3 8.1 1.5 16.1 highest average temperature / °C 23.6 21.5 23.4 28.5 29.6 • The population at each site was sampled a total of 10 times during the three month period. • The beetles were sampled at 20 different locations within each site, on the same day. • The length of each captured beetle was measured to the nearest mm as a measurement of body size. • The beetles were divided into two groups according to body size, large and small. • The results from the different locations in each site were added together. • The population size and the percentages of large and small beetles in the population were estimated. (a) (i) State two variables which have been standardised in this investigation. 1 ....................................................................................................................................... ........................................................................................................................................... 2 ....................................................................................................................................... .......................................................................................................................................[2] (ii) Outline how the population size of the beetles can be estimated. ........................................................................................................................................... ........................................................................................................................................... ........................................................................................................................................... ........................................................................................................................................... ...................................................................................................................................... [2] (b) Table 2.2 shows the results of the investigation. Table 2.2 site A B C D E population of beetles 10 792 11 314 18 426 15 224 17 650 number of large beetles 6520 6276 10 687 6432 6523 number of small beetles 4272 5038 8792 11 127 percentage of large beetles 60 58 42 37 (i) Complete Table 2.2 by filling in the missing values for sites B and C. [2] (ii) State, with a reason, whether these results support the hypothesis: The body size of individuals in populations of ground beetles increases as the environmental temperature decreases. ........................................................................................................................................... ........................................................................................................................................... ...................................................................................................................................... [1] (c) State two other conclusions that can be made about the effect of temperature on body size of the beetles. 1 ............................................................................................................................................... ................................................................................................................................................... ................................................................................................................................................... 2 ............................................................................................................................................... ................................................................................................................................................... ...............................................................................................................................................[2] (d) Predict one way in which climate change may influence the populations of these ground beetles. ................................................................................................................................................... .............................................................................................................................................. [1] [Total: 10]
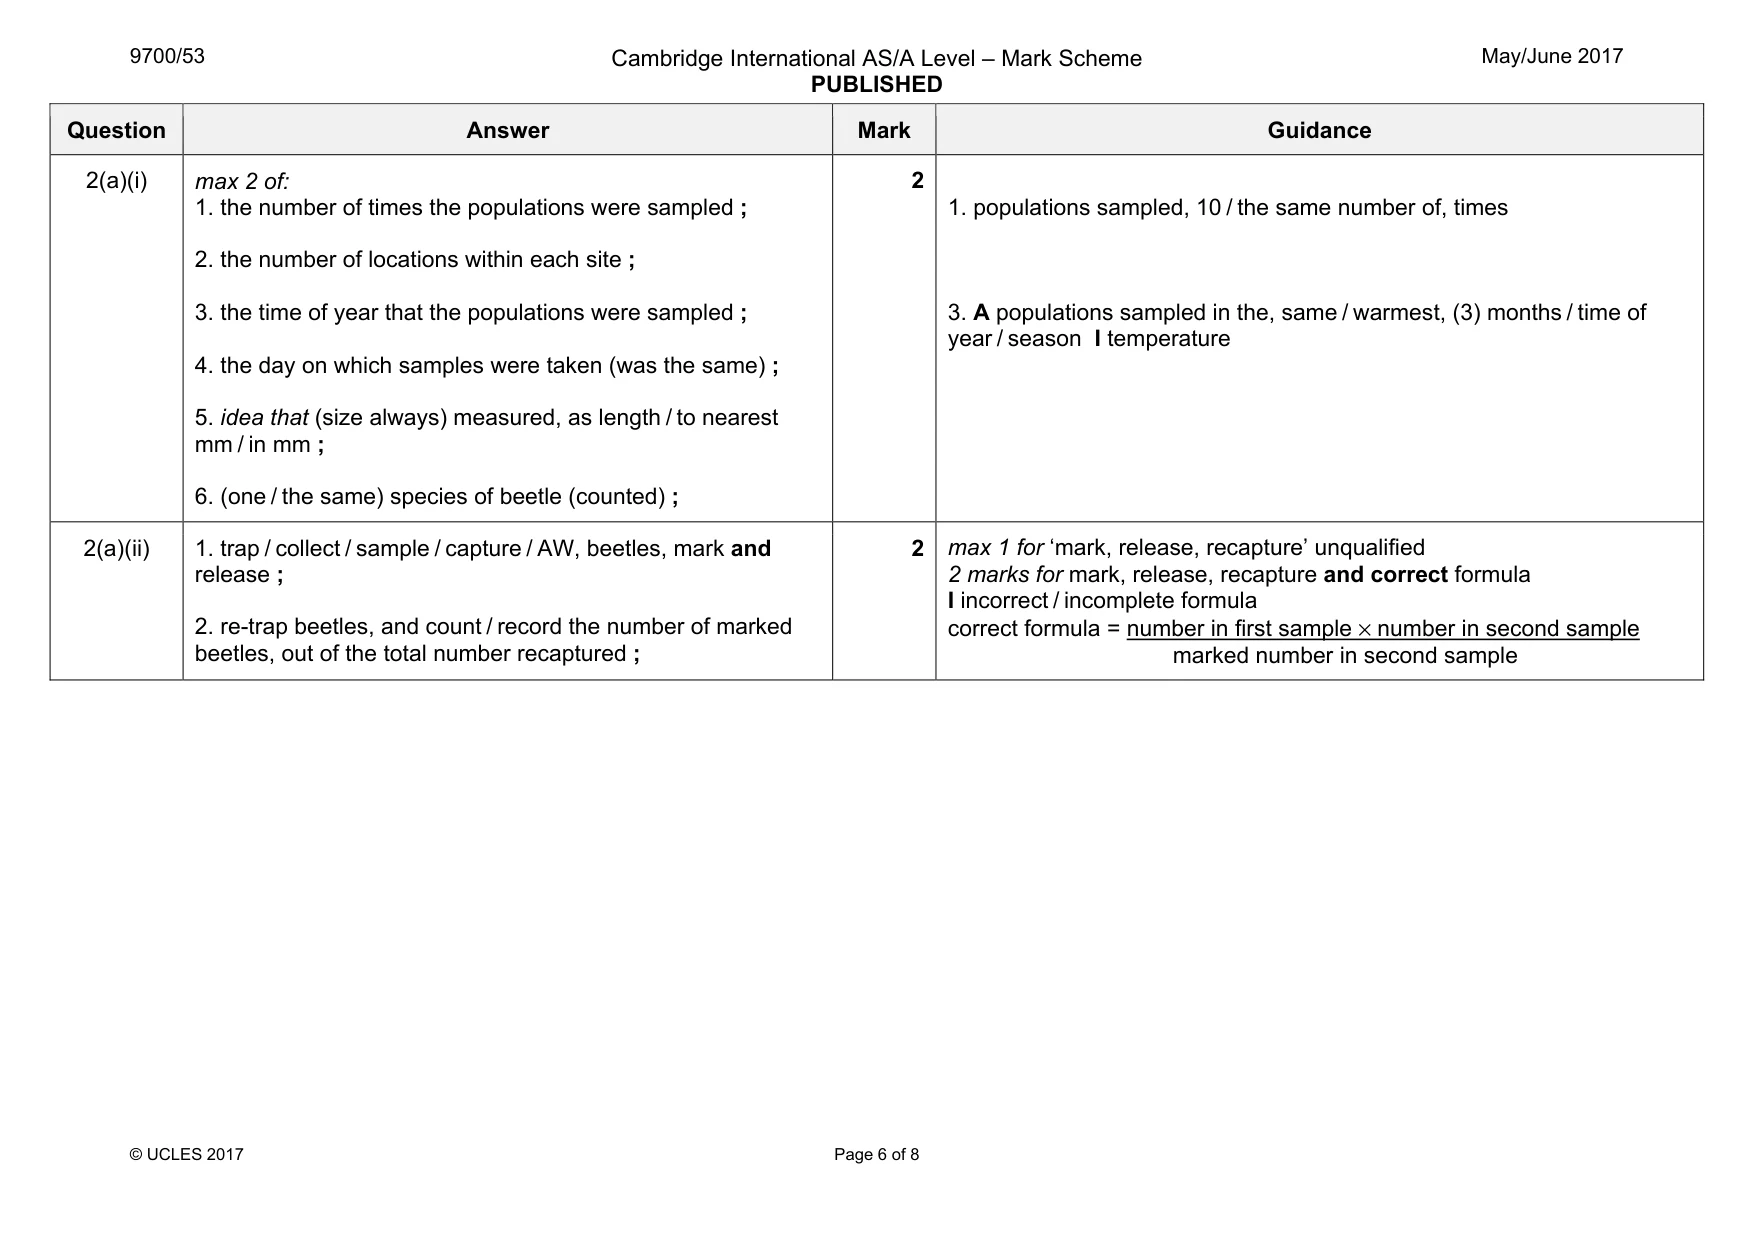
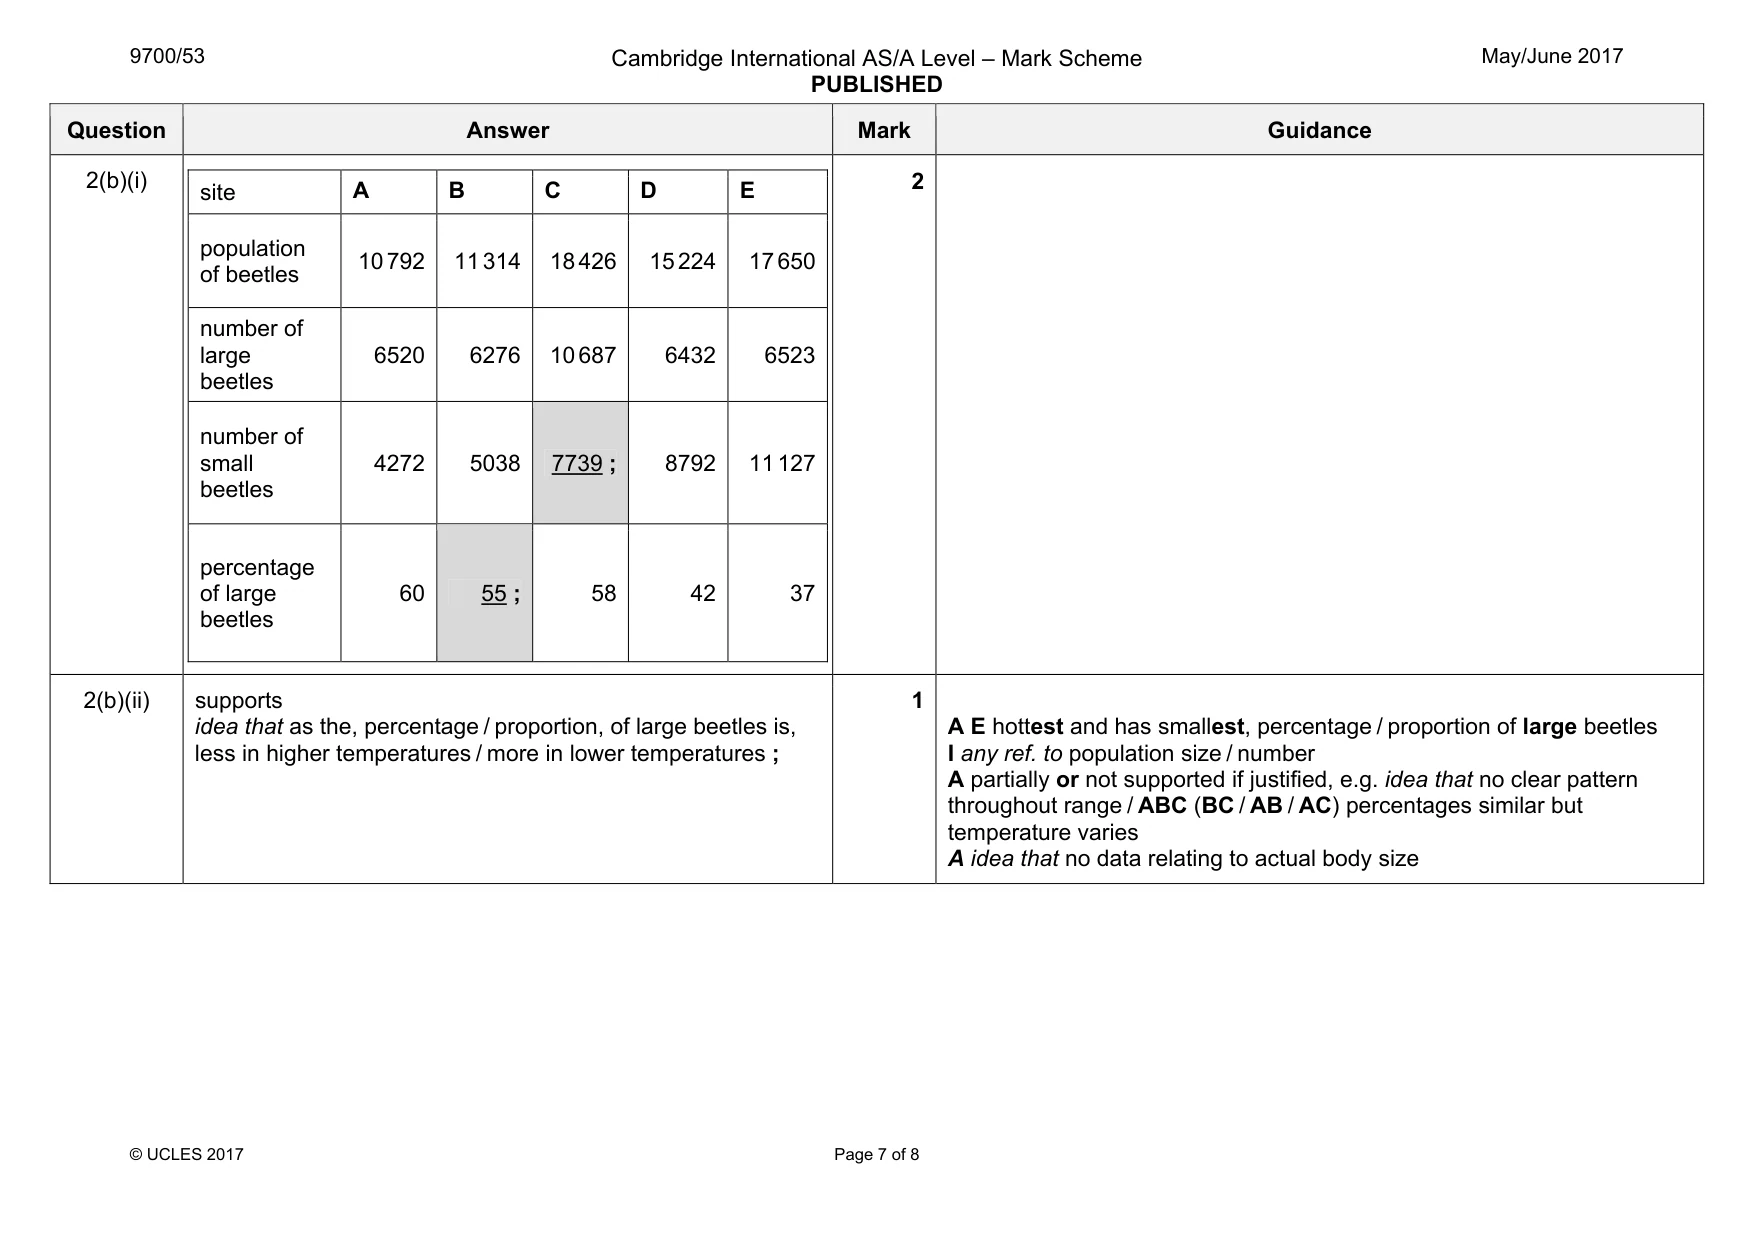
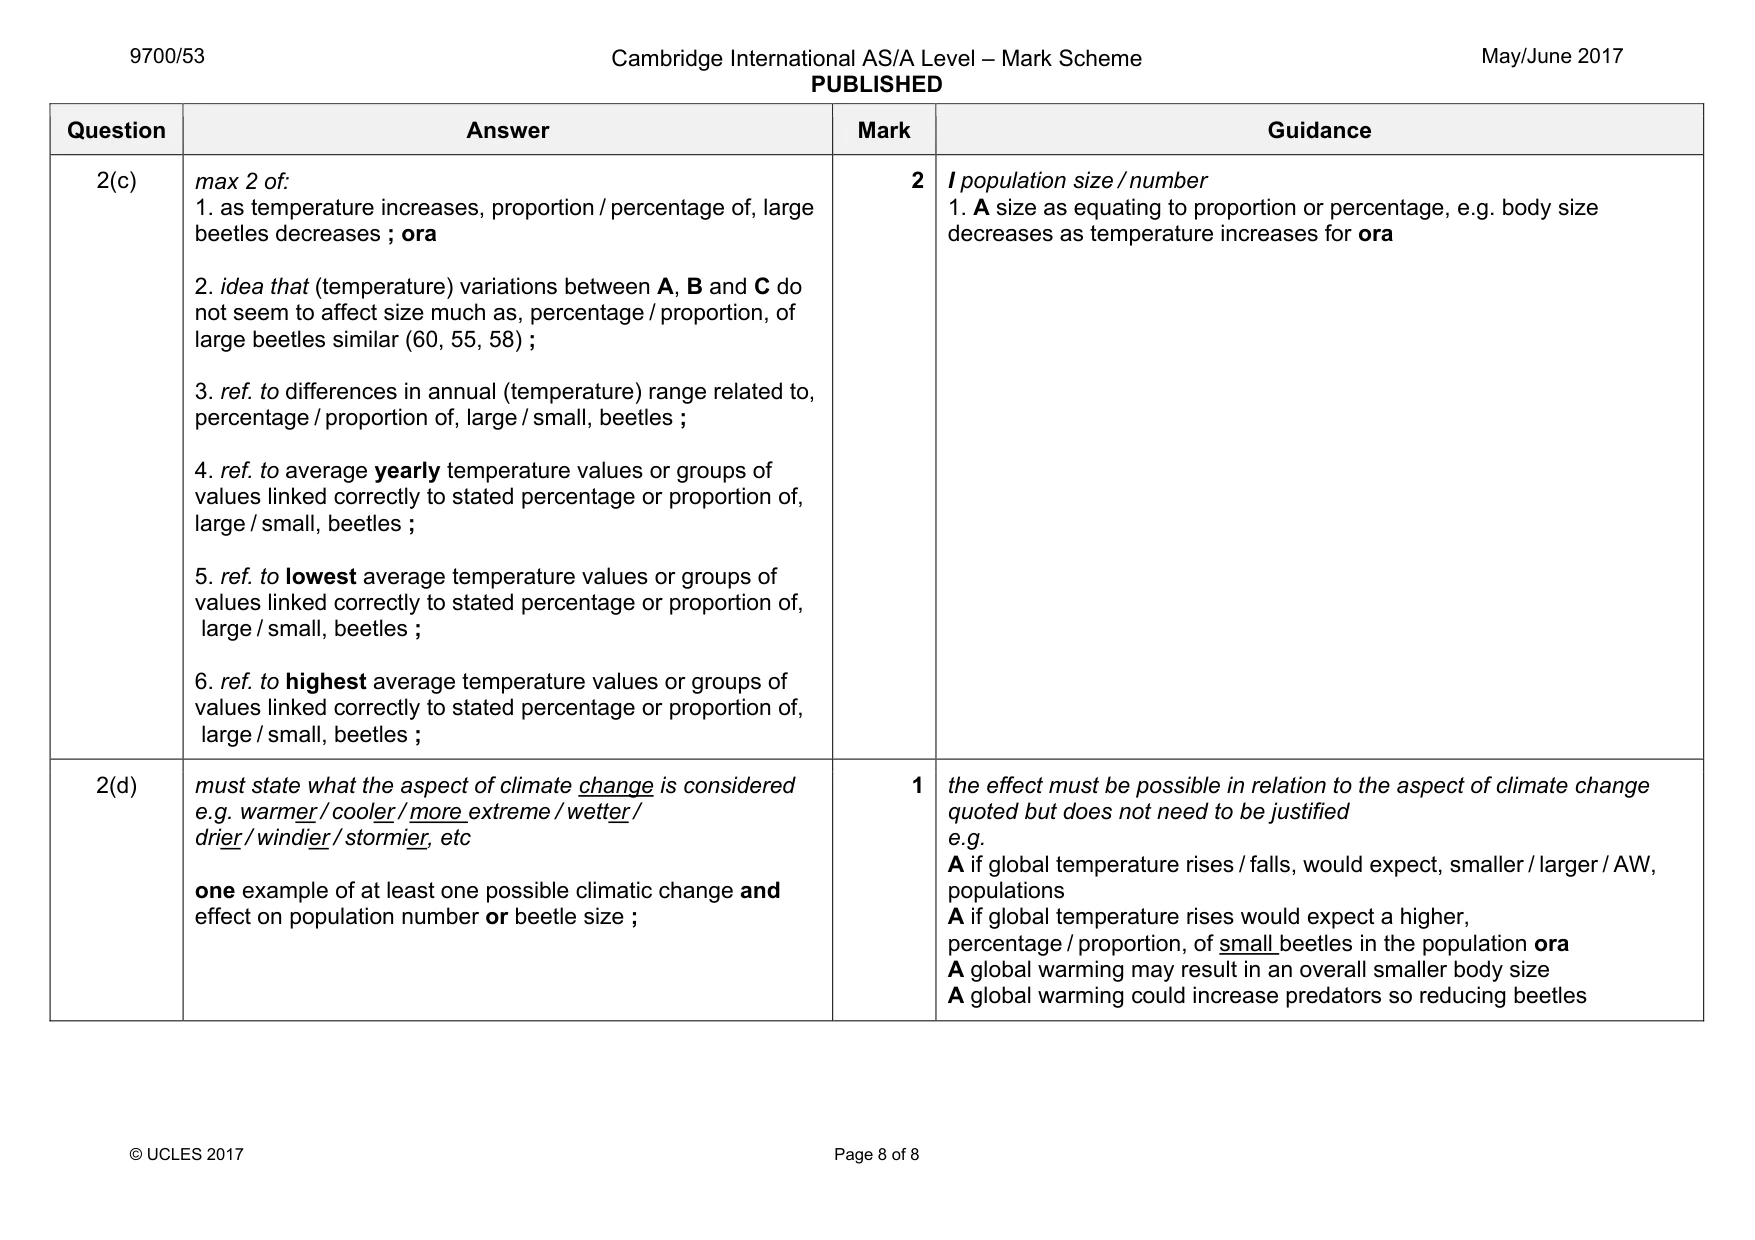
Mark scheme: 2(a)(i) max 2 of: 1. the number of times the populations were sampled ; 2. the number of locations within each site ; 3. the time of year that the populations were sampled ; 4. the day on which samples were taken (was the same) ; 5. idea that (size always) measured, as length / to nearest mm / in mm ; 6. (one / the same) species of beetle (counted) ; 2 1. populations sampled, 10 / the same number of, times 3. A populations sampled in the, same / warmest, (3) months / time of year / season I temperature 2(a)(ii) 1. trap / collect / sample / capture / AW, beetles, mark and release ; 2. re-trap beetles, and count / record the number of marked beetles, out of the total number recaptured ; 2 max 1 for ‘mark, release, recapture’ unqualified 2 marks for mark, release, recapture and correct formula I incorrect / incomplete formula correct formula = number in first sample × number in second sample marked number in second sample Question Answer Mark Guidance 2(b)(i) site A B C D E population of beetles 10 792 11 314 18 426 15 224 17 650 number of large beetles 6520 6276 10 687 6432 6523 number of small beetles 4272 5038 7739 ; 8792 11 127 percentage of large beetles 60 55 ; 58 42 37 2 2(b)(ii) supports idea that as the, percentage / proportion, of large beetles is, less in higher temperatures / more in lower temperatures ; 1 A E hottest and has smallest, percentage / proportion of large beetles I any ref. to population size / number A partially or not supported if justified, e.g. idea that no clear pattern throughout range / ABC (BC / AB / AC) percentages similar but temperature varies A idea that no data relating to actual body size Question Answer Mark Guidance 2(c) max 2 of: 1. as temperature increases, proportion / percentage of, large beetles decreases ; ora 2. idea that (temperature) variations between A, B and C do not seem to affect size much as, percentage / proportion, of large beetles similar (60, 55, 58) ; 3. ref. to differences in annual (temperature) range related to, percentage / proportion of, large / small, beetles ; 4. ref. to average yearly temperature values or groups of values linked correctly to stated percentage or proportion of, large / small, beetles ; 5. ref. to lowest average temperature values or groups of values linked correctly to stated percentage or proportion of, large / small, beetles ; 6. ref. to highest average temperature values or groups of values linked correctly to stated percentage or proportion of, large / small, beetles ; 2 I population size / number 1. A size as equating to proportion or percentage, e.g. body size decreases as temperature increases for ora 2(d) must state what the aspect of climate change is considered e.g. warmer / cooler / more extreme / wetter / drier / windier / stormier, etc one example of at least one possible climatic change and effect on population number or beetle size ; 1 the effect must be possible in relation to the aspect of climate change quoted but does not need to be justified e.g. A if global temperature rises / falls, would expect, smaller / larger / AW, populations A if global temperature rises would expect a higher, percentage / proportion, of small beetles in the population ora A global warming may result in an overall smaller body size A global warming could increase predators so reducing beetles
What was in this paper
The subtopics covered by these 2 questions, and how many questions each got. Open one in a new tab to see every Cambridge question on it.
What you needed in this session
Cambridge’s own grade thresholds for 2017 May/June, Paper 5 · Variant 3. A higher threshold means an easier paper — the bar moves with how the cohort did.