Cambridge A Level Biology 9700 — 2017 May/June Paper 4 · Variant 2
9700/42/M/J/17 · 10 questions · 100 marks · ≈113 min
The question paper and its mark scheme, free to read here and free to download. This is Cambridge’s own paper, exactly as it was sat.
Question paper24 pages


Mark scheme19 pages
Answers below. Sit the paper first if you are practising.
Questions as text
Question 1
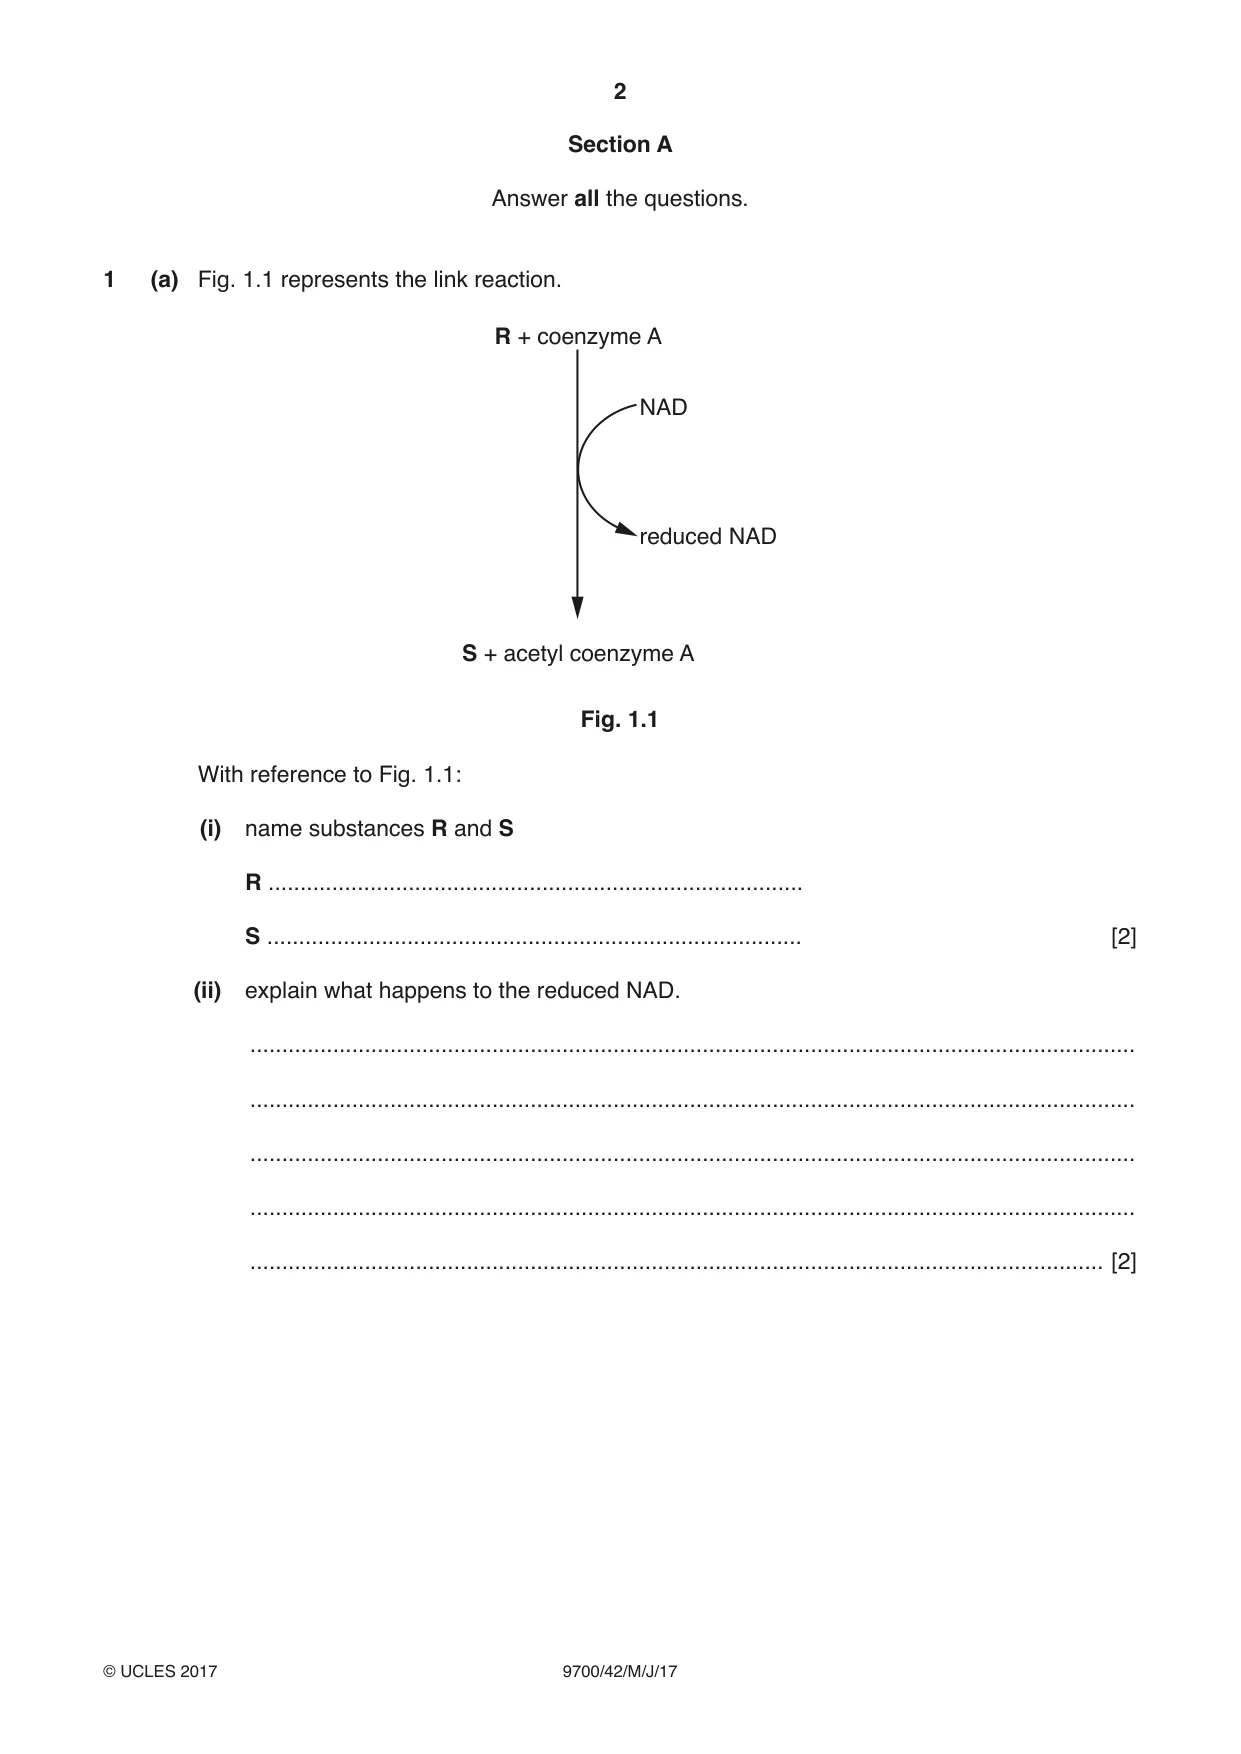
1 (a) Fig. 1.1 represents the link reaction. R + coenzyme A NAD reduced NAD S + acetyl coenzyme A Fig. 1.1 With reference to Fig. 1.1: (i) name substances R and S R .................................................................................... S .................................................................................... [2] (ii) explain what happens to the reduced NAD. ........................................................................................................................................... ........................................................................................................................................... ........................................................................................................................................... ........................................................................................................................................... ...................................................................................................................................... [2] (b) The pH of the blood of an athlete decreases during a race and returns to its normal level after the race. The decrease in the pH of the blood is caused by the presence of waste products that have been excreted by cells during respiration. Name the waste products that are excreted and describe what occurs to these products to help return the pH of the blood back to a normal level. ................................................................................................................................................... ................................................................................................................................................... ................................................................................................................................................... ................................................................................................................................................... ................................................................................................................................................... ................................................................................................................................................... ................................................................................................................................................... ................................................................................................................................................... ................................................................................................................................................... ................................................................................................................................................... .............................................................................................................................................. [5] [Total: 9]
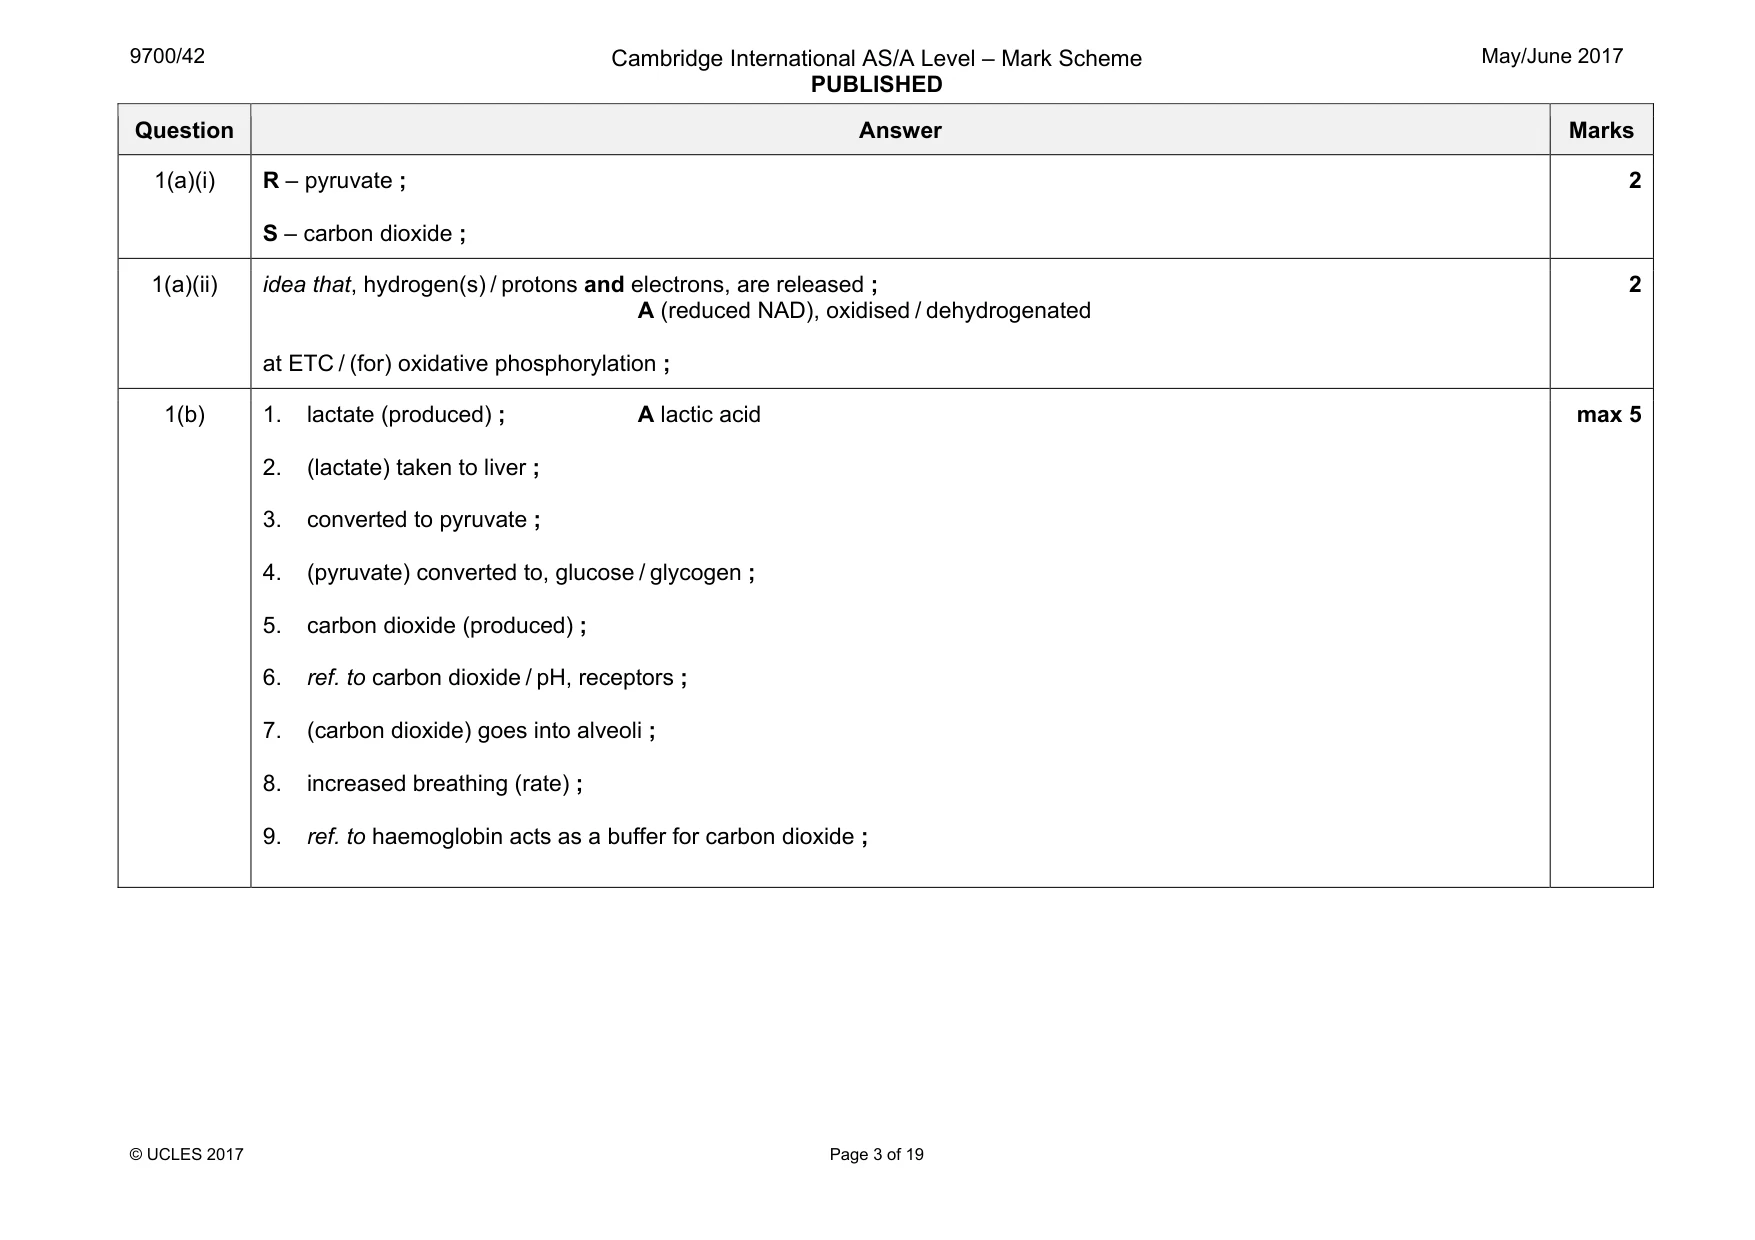
Mark scheme: 1(a)(i) R – pyruvate ; S – carbon dioxide ; 2 1(a)(ii) idea that, hydrogen(s) / protons and electrons, are released ; A (reduced NAD), oxidised / dehydrogenated at ETC / (for) oxidative phosphorylation ; 2 1(b) 1. lactate (produced) ; A lactic acid 2. (lactate) taken to liver ; 3. converted to pyruvate ; 4. (pyruvate) converted to, glucose / glycogen ; 5. carbon dioxide (produced) ; 6. ref. to carbon dioxide / pH, receptors ; 7. (carbon dioxide) goes into alveoli ; 8. increased breathing (rate) ; 9. ref. to haemoglobin acts as a buffer for carbon dioxide ; max 5
Q2 · Chloroplasts belong to a group of organelles called plastids
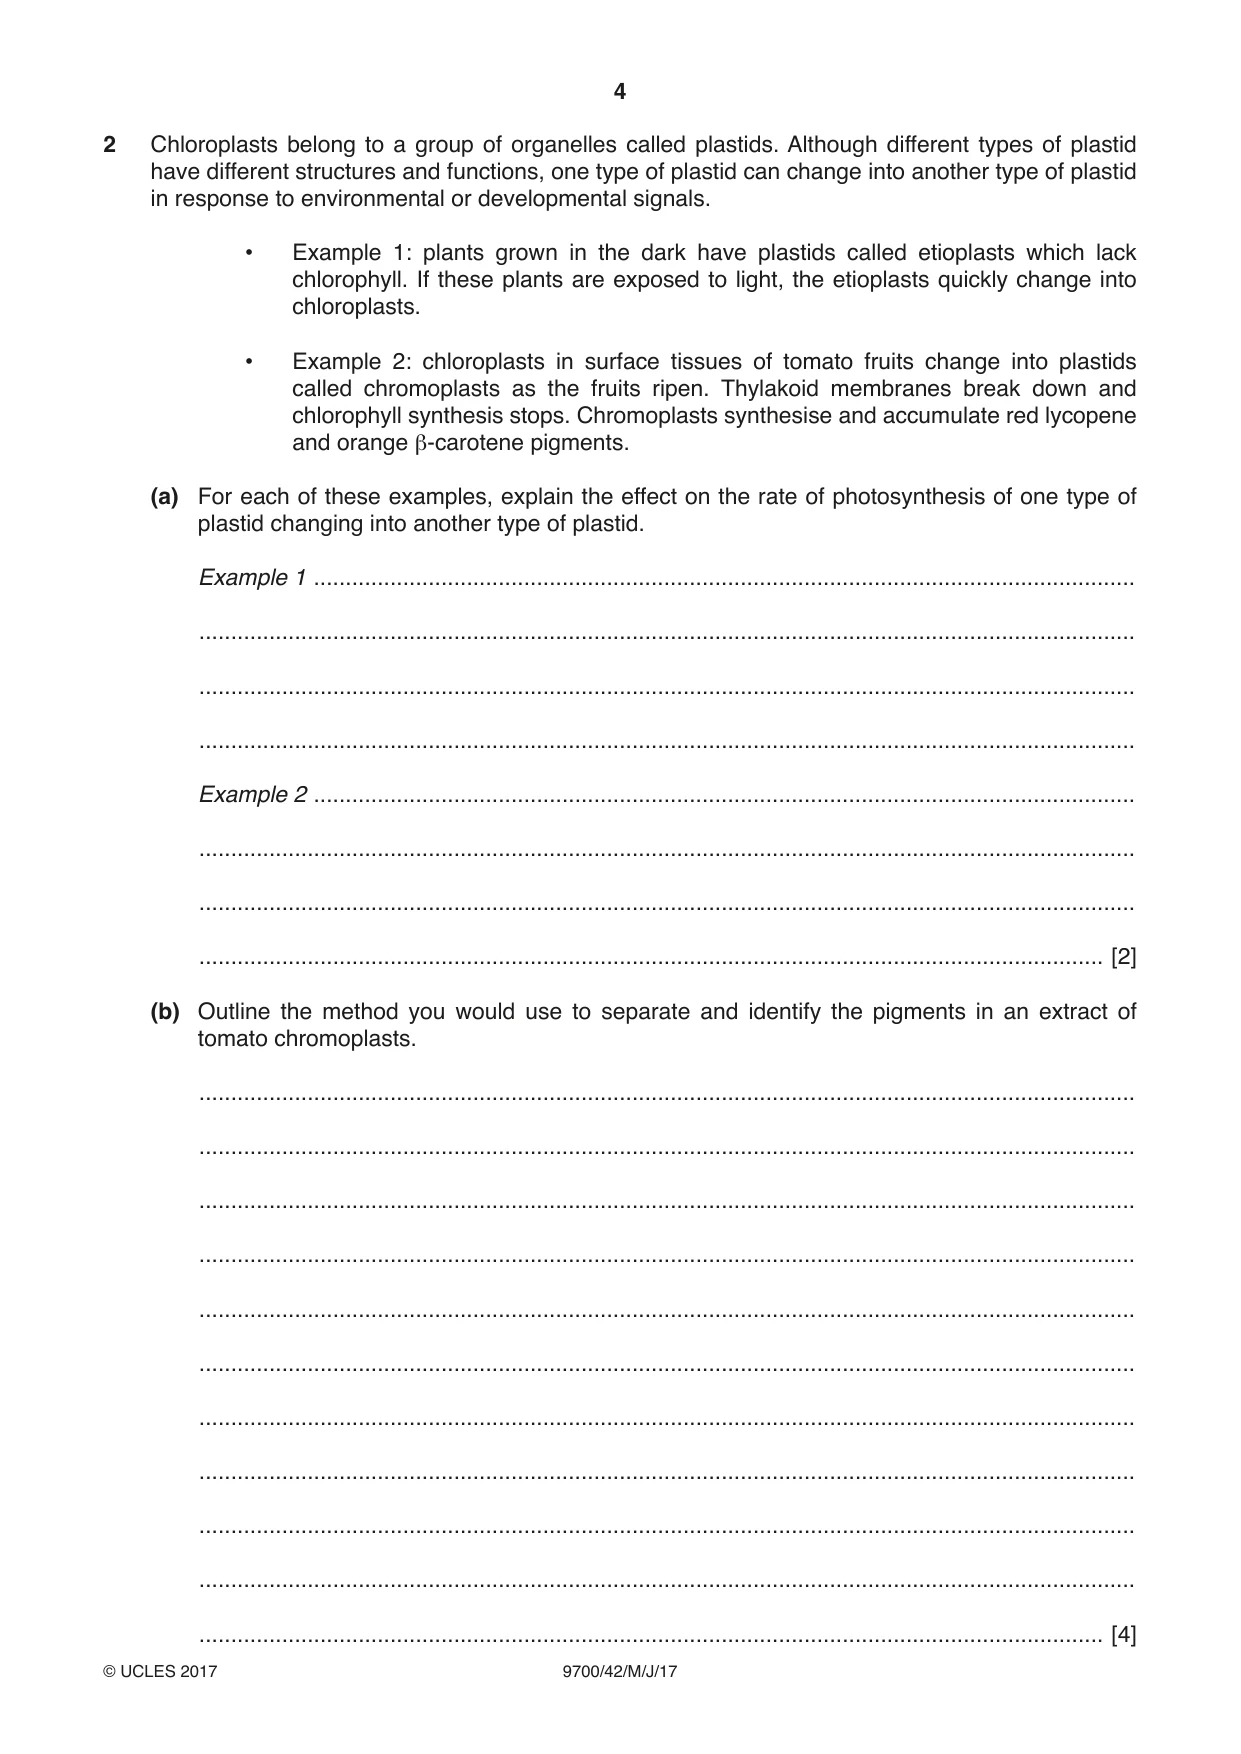
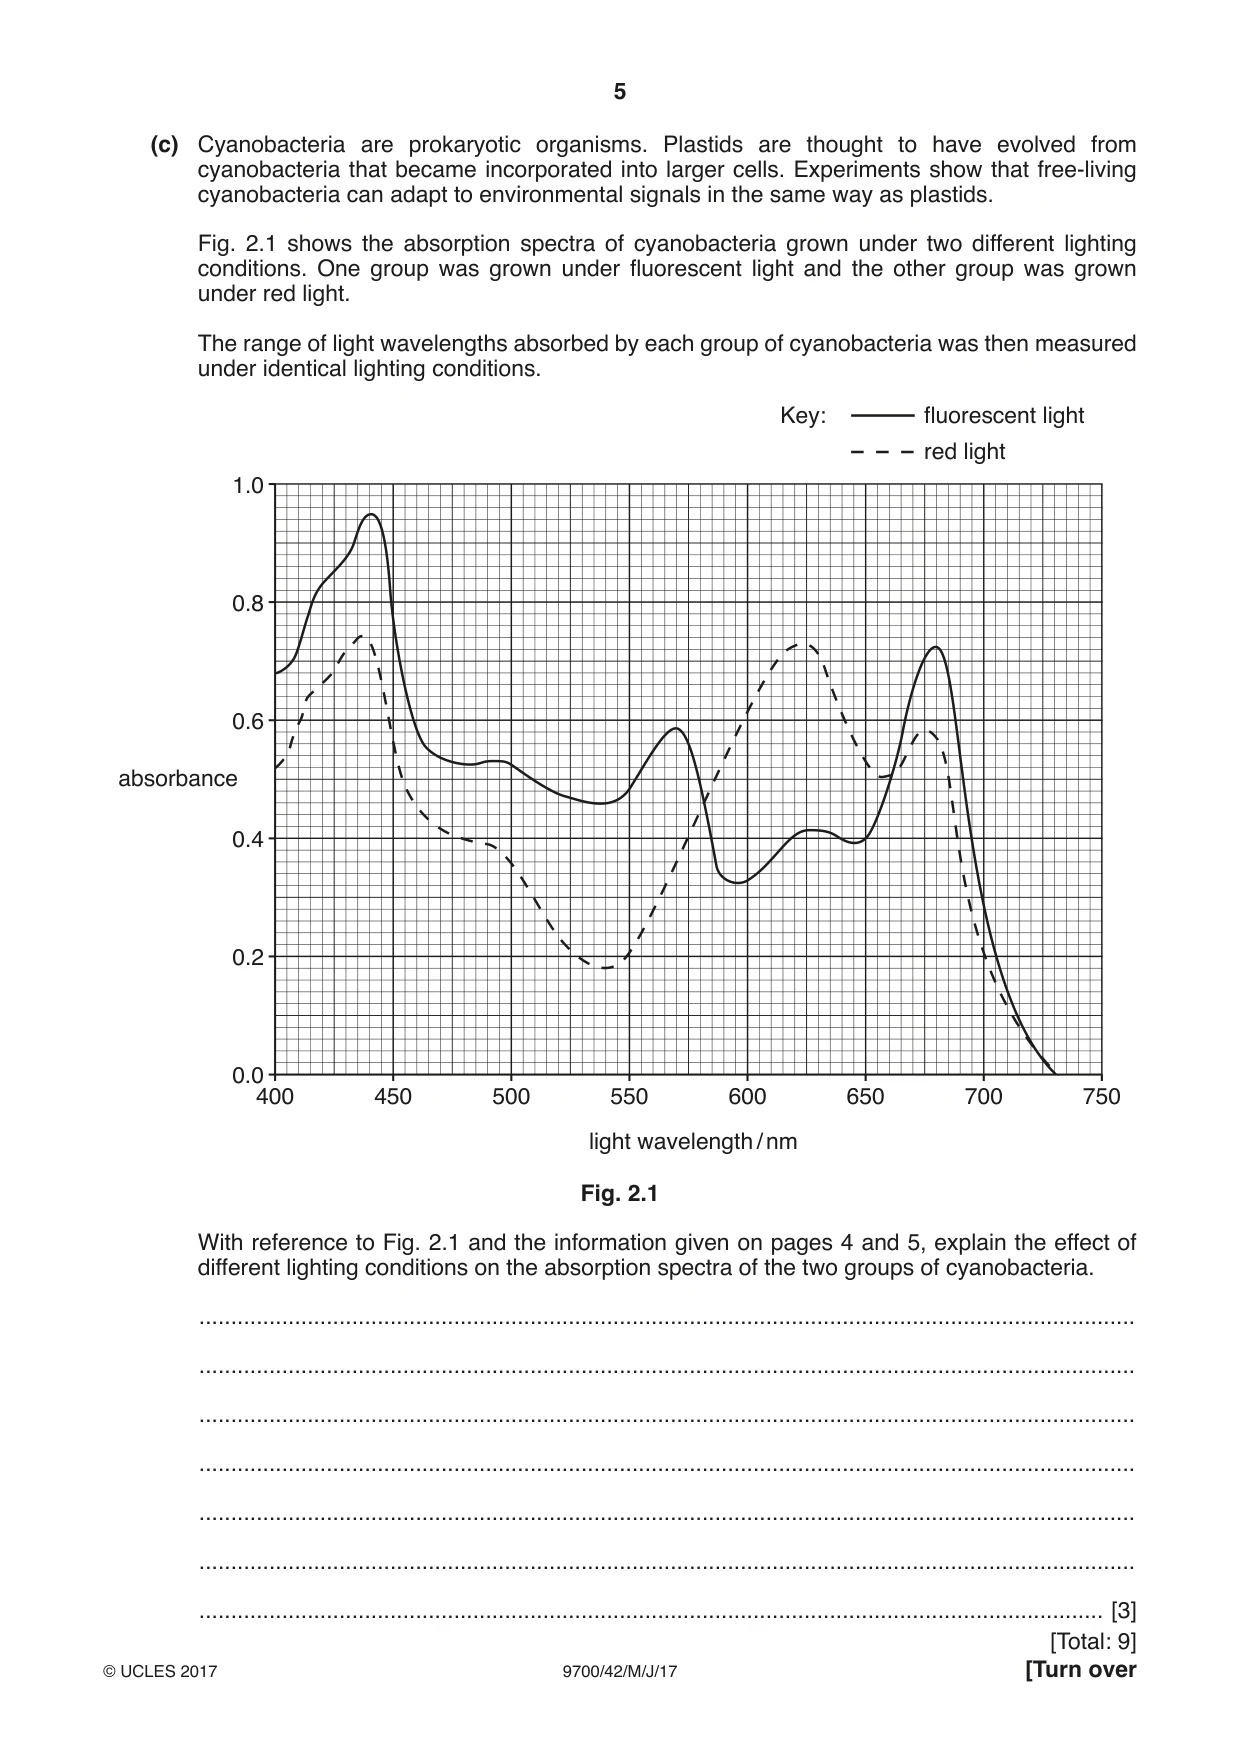
2 Chloroplasts belong to a group of organelles called plastids. Although different types of plastid have different structures and functions, one type of plastid can change into another type of plastid in response to environmental or developmental signals. • Example 1: plants grown in the dark have plastids called etioplasts which lack chlorophyll. If these plants are exposed to light, the etioplasts quickly change into chloroplasts. • Example 2: chloroplasts in surface tissues of tomato fruits change into plastids called chromoplasts as the fruits ripen. Thylakoid membranes break down and chlorophyll synthesis stops. Chromoplasts synthesise and accumulate red lycopene and orange β-carotene pigments. (a) For each of these examples, explain the effect on the rate of photosynthesis of one type of plastid changing into another type of plastid. Example 1 ................................................................................................................................. ................................................................................................................................................... ................................................................................................................................................... ................................................................................................................................................... Example 2 ................................................................................................................................. ................................................................................................................................................... ................................................................................................................................................... .............................................................................................................................................. [2] (b) Outline the method you would use to separate and identify the pigments in an extract of tomato chromoplasts. ................................................................................................................................................... ................................................................................................................................................... ................................................................................................................................................... ................................................................................................................................................... ................................................................................................................................................... ................................................................................................................................................... ................................................................................................................................................... ................................................................................................................................................... ................................................................................................................................................... ................................................................................................................................................... .............................................................................................................................................. [4] (c) Cyanobacteria are prokaryotic organisms. Plastids are thought to have evolved from cyanobacteria that became incorporated into larger cells. Experiments show that free-living cyanobacteria can adapt to environmental signals in the same way as plastids. Fig. 2.1 shows the absorption spectra of cyanobacteria grown under two different lighting conditions. One group was grown under fluorescent light and the other group was grown under red light. The range of light wavelengths absorbed by each group of cyanobacteria was then measured under identical lighting conditions. Key: fluorescent light red light 1.0 0.8 0.6 absorbance 0.4 0.2 0.0 400 450 500 550 600 650 700 750 light wavelength / nm Fig. 2.1 With reference to Fig. 2.1 and the information given on pages 4 and 5, explain the effect of different lighting conditions on the absorption spectra of the two groups of cyanobacteria. ................................................................................................................................................... ................................................................................................................................................... ................................................................................................................................................... ................................................................................................................................................... ................................................................................................................................................... ................................................................................................................................................... .............................................................................................................................................. [3]
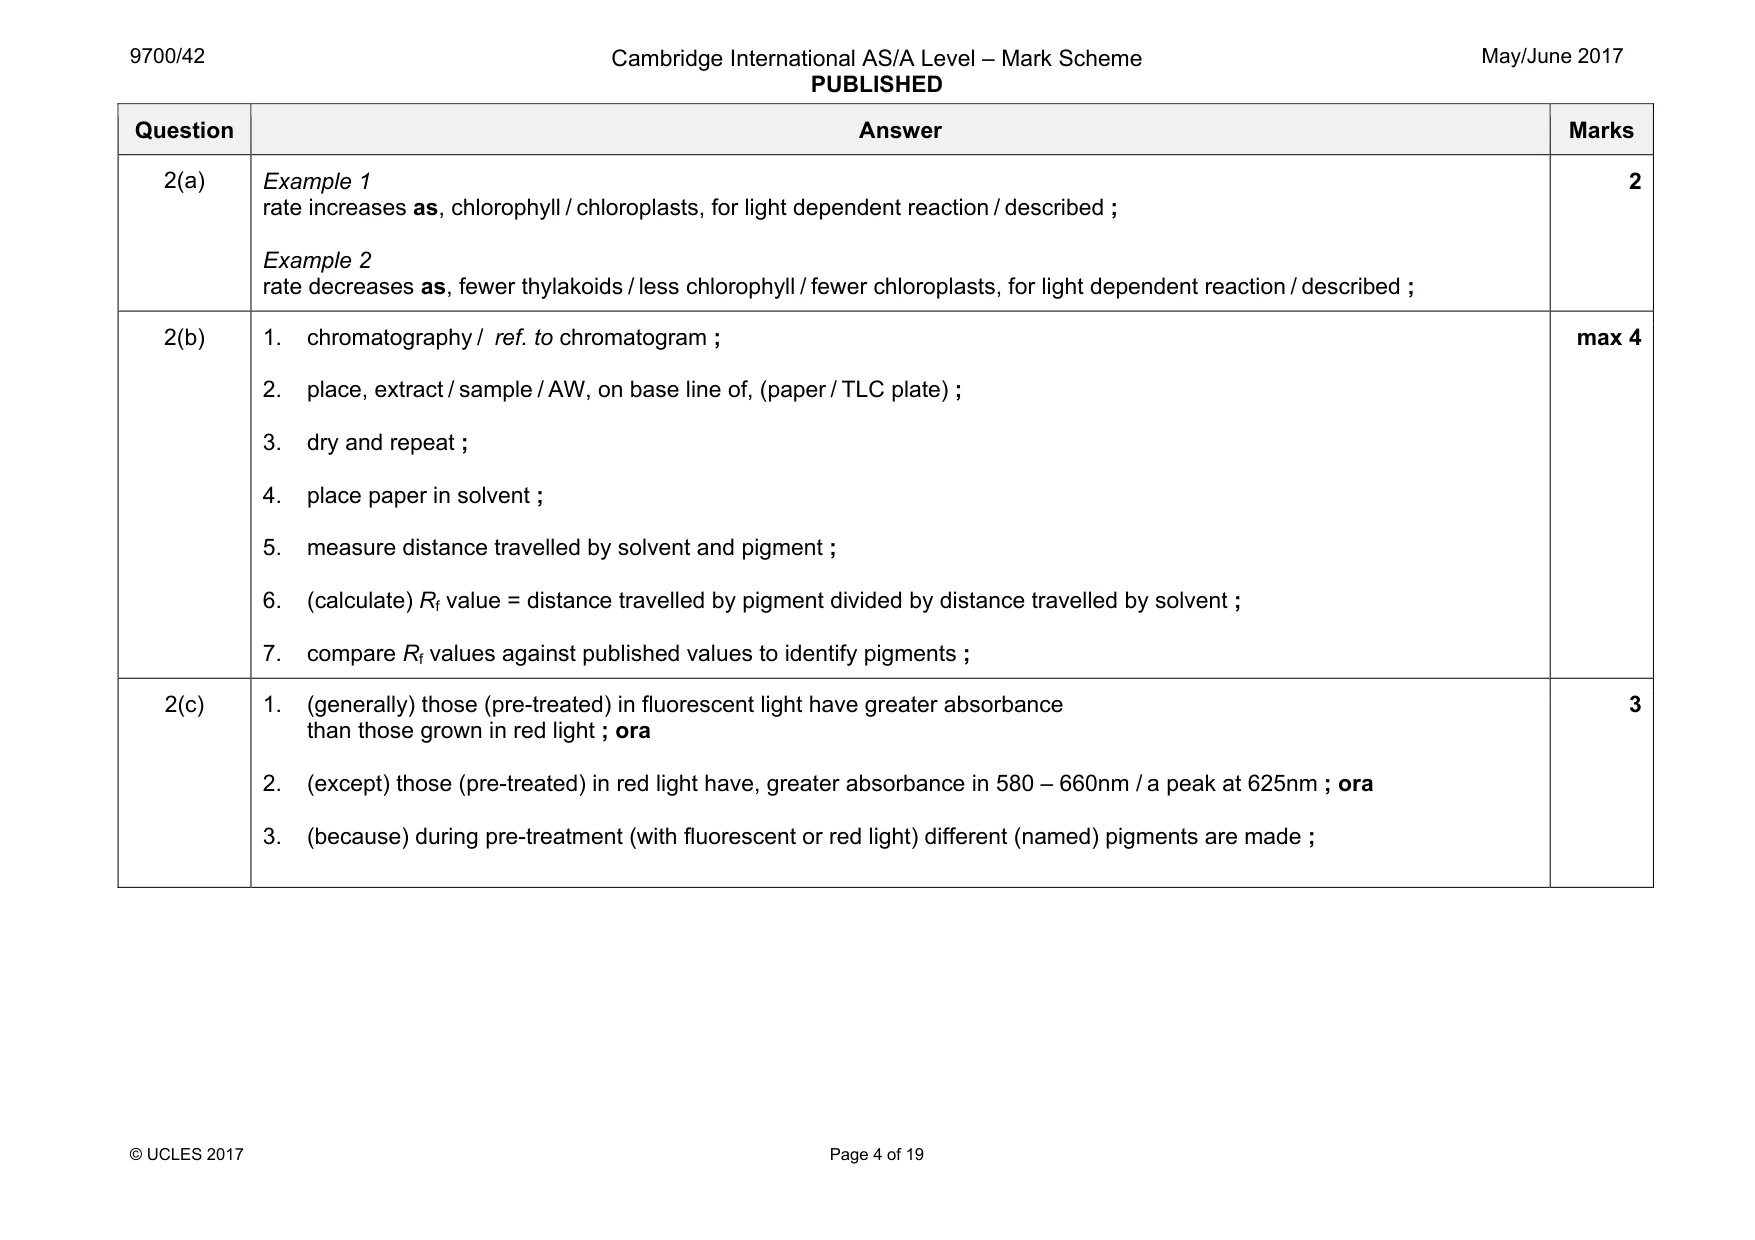
Mark scheme: 2(a) Example 1 rate increases as, chlorophyll / chloroplasts, for light dependent reaction / described ; Example 2 rate decreases as, fewer thylakoids / less chlorophyll / fewer chloroplasts, for light dependent reaction / described ; 2 2(b) 1. chromatography / ref. to chromatogram ; 2. place, extract / sample / AW, on base line of, (paper / TLC plate) ; 3. dry and repeat ; 4. place paper in solvent ; 5. measure distance travelled by solvent and pigment ; 6. (calculate) Rf value = distance travelled by pigment divided by distance travelled by solvent ; 7. compare Rf values against published values to identify pigments ; max 4 2(c) 1. (generally) those (pre-treated) in fluorescent light have greater absorbance than those grown in red light ; ora 2. (except) those (pre-treated) in red light have, greater absorbance in 580 – 660nm / a peak at 625nm ; ora 3. (because) during pre-treatment (with fluorescent or red light) different (named) pigments are made ; 3
More questions on Photosynthesis as an energy transfer process
Q3 · A diagram of two sarcomeres of relaxed striated muscle
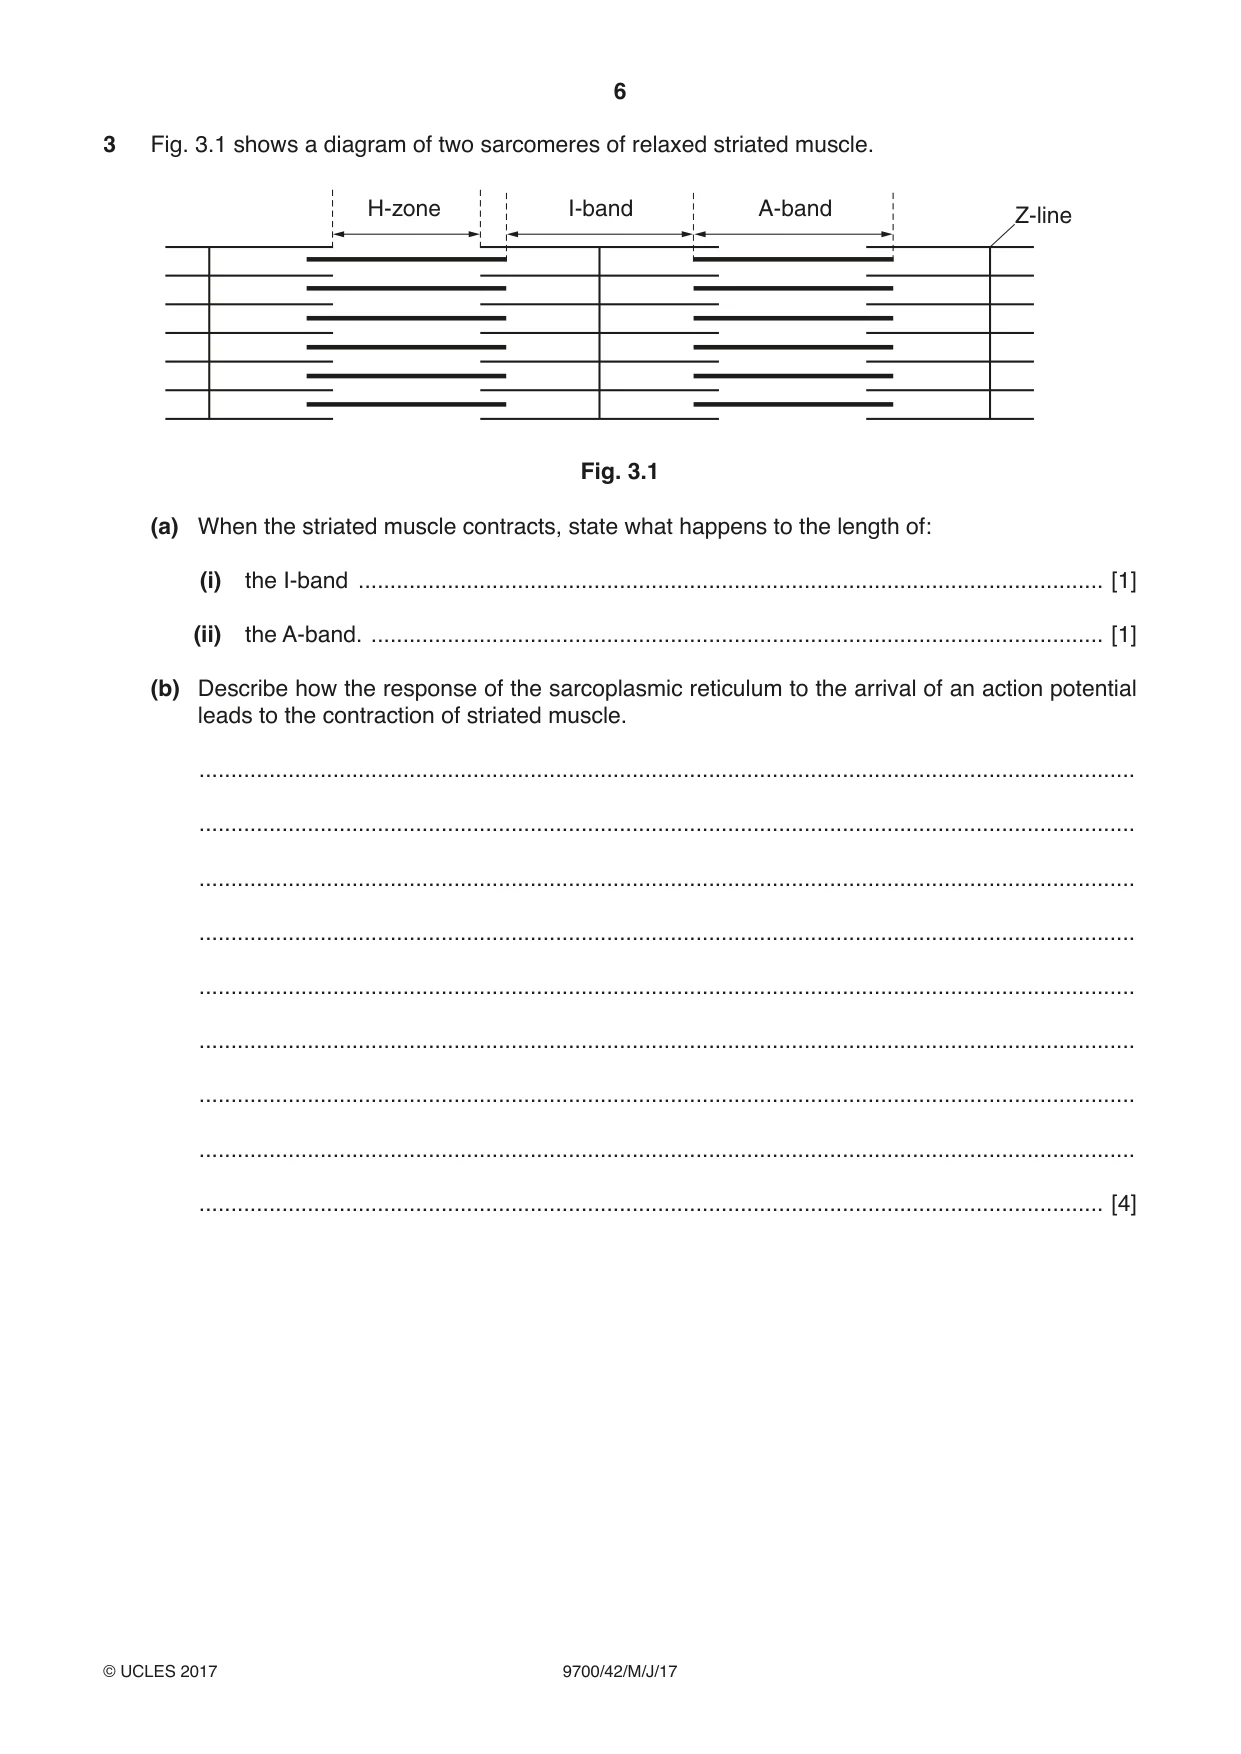
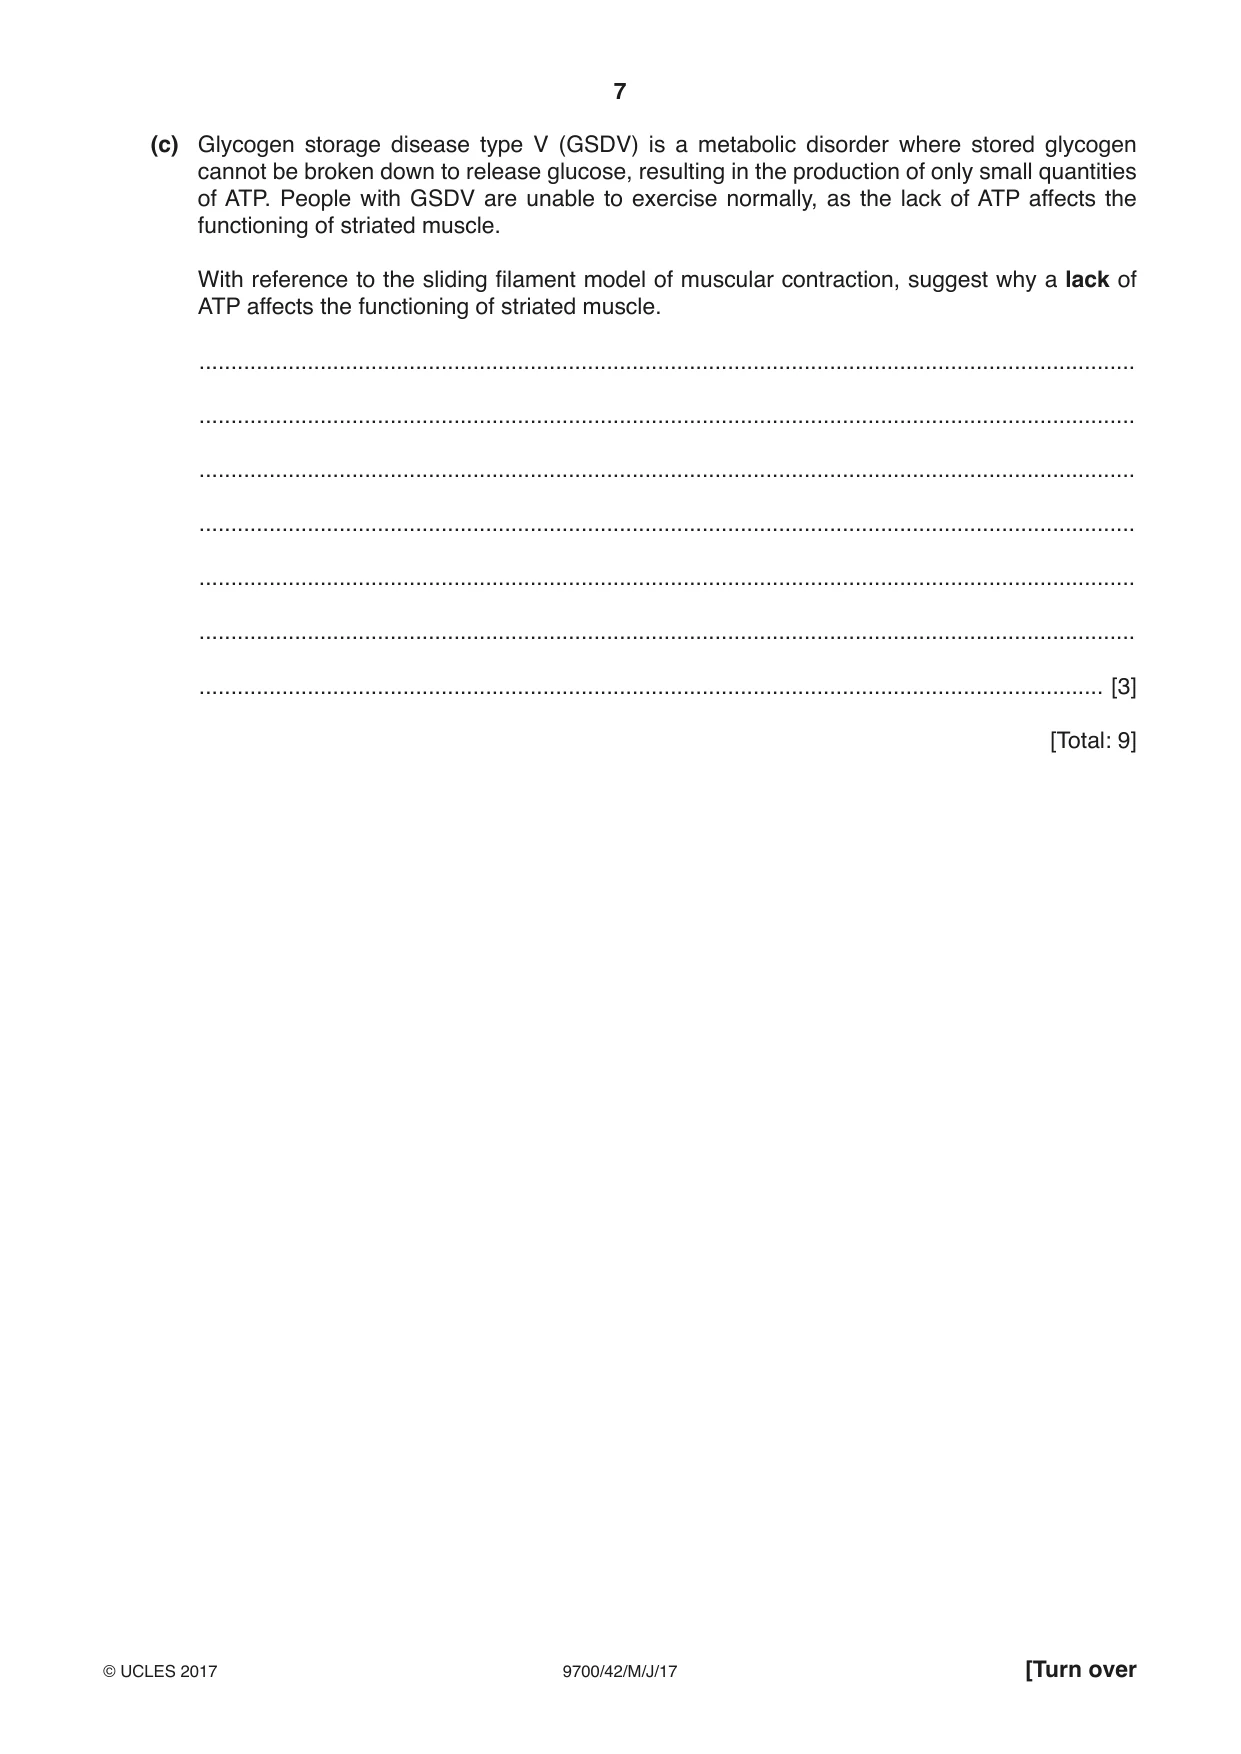
3 Fig. 3.1 shows a diagram of two sarcomeres of relaxed striated muscle. H-zone I-band A-band Z-line Fig. 3.1 (a) When the striated muscle contracts, state what happens to the length of: (i) the I-band ..................................................................................................................... [1] (ii) the A-band. ................................................................................................................... [1] (b) Describe how the response of the sarcoplasmic reticulum to the arrival of an action potential leads to the contraction of striated muscle. ................................................................................................................................................... ................................................................................................................................................... ................................................................................................................................................... ................................................................................................................................................... ................................................................................................................................................... ................................................................................................................................................... ................................................................................................................................................... ................................................................................................................................................... .............................................................................................................................................. [4] (c) Glycogen storage disease type V (GSDV) is a metabolic disorder where stored glycogen cannot be broken down to release glucose, resulting in the production of only small quantities of ATP. People with GSDV are unable to exercise normally, as the lack of ATP affects the functioning of striated muscle. With reference to the sliding filament model of muscular contraction, suggest why a lack of ATP affects the functioning of striated muscle. ................................................................................................................................................... ................................................................................................................................................... ................................................................................................................................................... ................................................................................................................................................... ................................................................................................................................................... ................................................................................................................................................... .............................................................................................................................................. [3] [Total: 9]
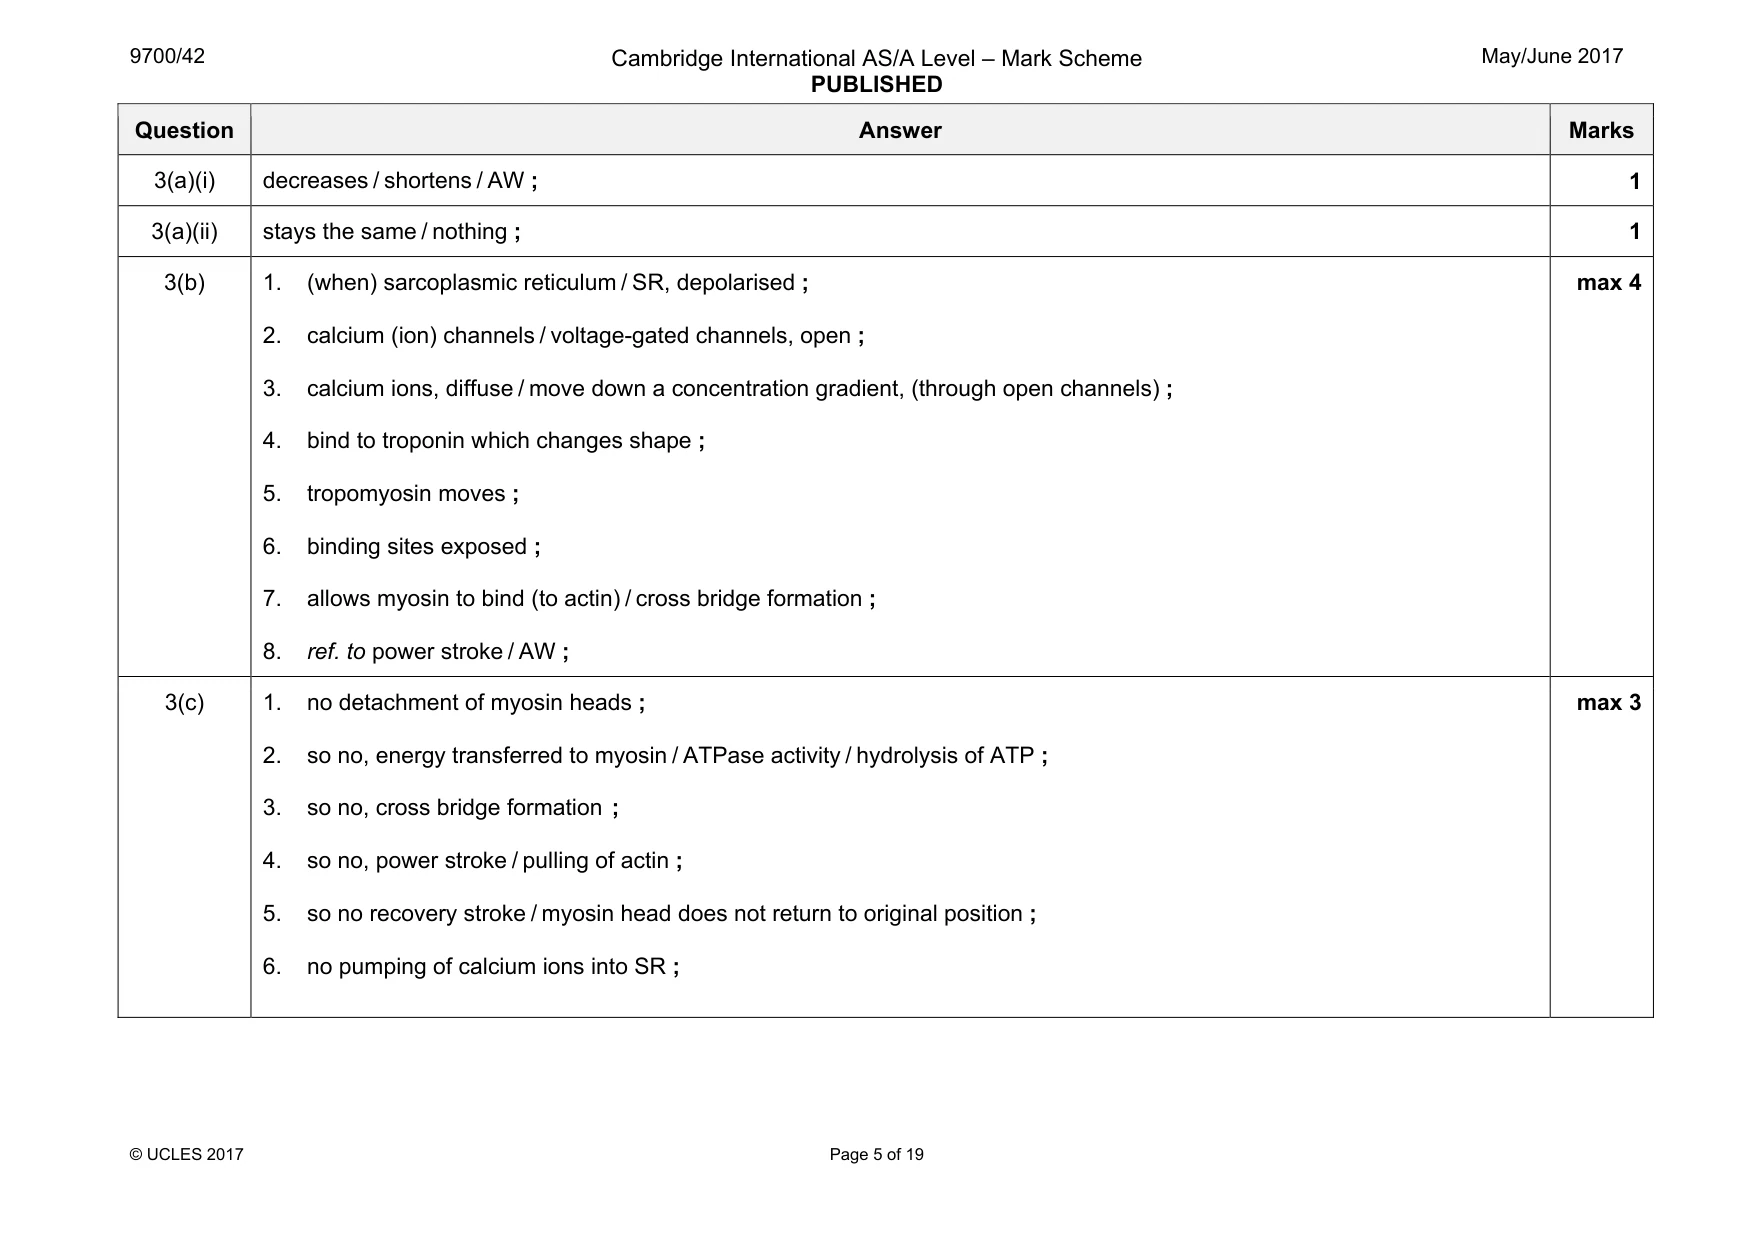
Mark scheme: 3(a)(i) decreases / shortens / AW ; 1 3(a)(ii) stays the same / nothing ; 1 3(b) 1. (when) sarcoplasmic reticulum / SR, depolarised ; 2. calcium (ion) channels / voltage-gated channels, open ; 3. calcium ions, diffuse / move down a concentration gradient, (through open channels) ; 4. bind to troponin which changes shape ; 5. tropomyosin moves ; 6. binding sites exposed ; 7. allows myosin to bind (to actin) / cross bridge formation ; 8. ref. to power stroke / AW ; max 4 3(c) 1. no detachment of myosin heads ; 2. so no, energy transferred to myosin / ATPase activity / hydrolysis of ATP ; 3. so no, cross bridge formation ; 4. so no, power stroke / pulling of actin ; 5. so no recovery stroke / myosin head does not return to original position ; 6. no pumping of calcium ions into SR ; max 3
Q4 · Weeds reduce crop yields by competing with crop plants for space, light, water and…
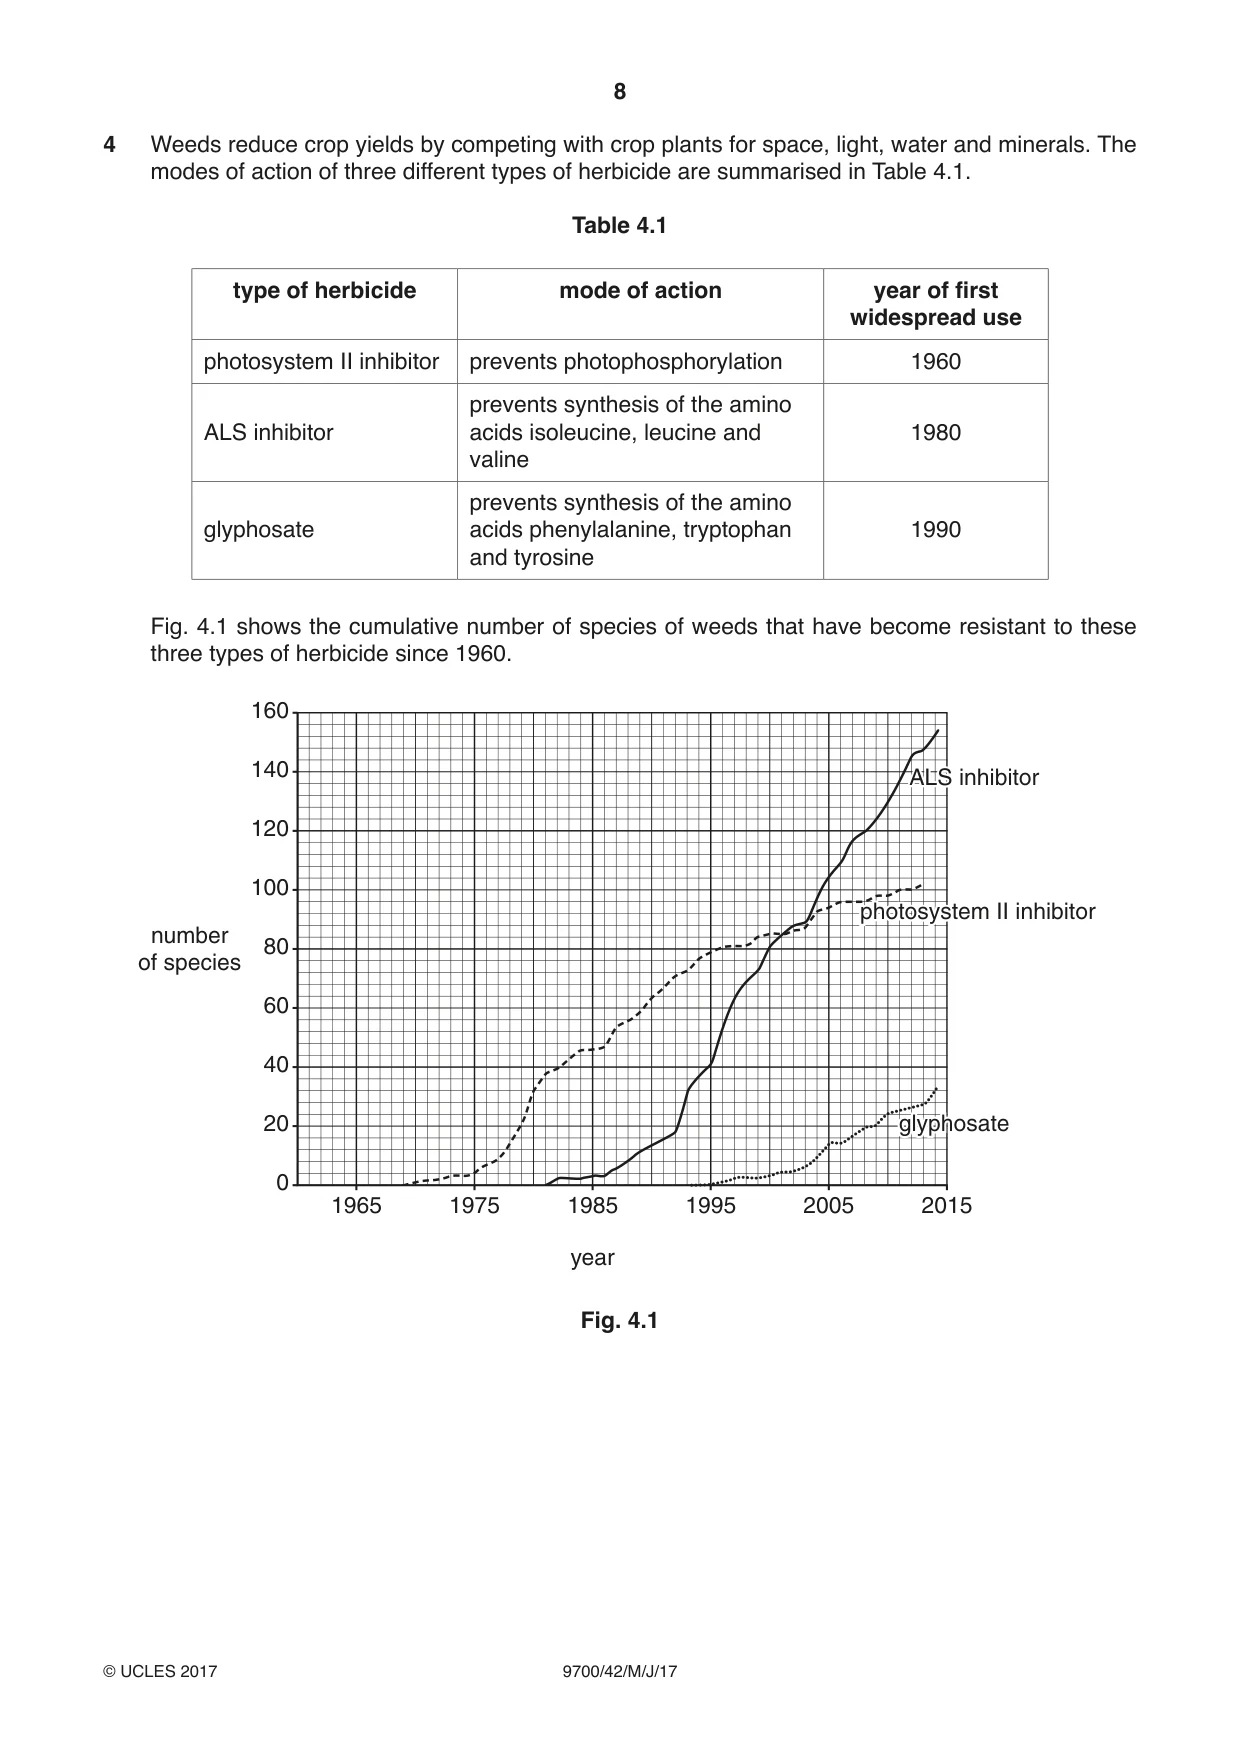
4 Weeds reduce crop yields by competing with crop plants for space, light, water and minerals. The modes of action of three different types of herbicide are summarised in Table 4.1. Table 4.1 type of herbicide mode of action year of first widespread use photosystem II inhibitor prevents photophosphorylation 1960 prevents synthesis of the amino ALS inhibitor acids isoleucine, leucine and 1980 valine prevents synthesis of the amino glyphosate acids phenylalanine, tryptophan 1990 and tyrosine Fig. 4.1 shows the cumulative number of species of weeds that have become resistant to these three types of herbicide since 1960. 160 140 ALSALS inhibitorinhibitor 120 100 photosystemphotosystem IIII inhibitorinhibitor number 80 of species 60 40 20 glyphosateglyphosate 0 1965 1975 1985 1995 2005 2015 year Fig. 4.1 (a) (i) Describe how the number of weed species resistant to herbicides has changed since 1960. ........................................................................................................................................... ........................................................................................................................................... ........................................................................................................................................... ........................................................................................................................................... ........................................................................................................................................... ........................................................................................................................................... ...................................................................................................................................... [3] (ii) Explain how a weed species becomes resistant to a herbicide. ........................................................................................................................................... ........................................................................................................................................... ........................................................................................................................................... ........................................................................................................................................... ........................................................................................................................................... ........................................................................................................................................... ........................................................................................................................................... ........................................................................................................................................... ...................................................................................................................................... [4] (b) ALS inhibitor herbicides work by binding to an enzyme present in chloroplasts called acetolactate synthetase (ALS). ALS is a globular protein consisting of four identical polypeptides each composed of 668 amino acids. The primary structure of the ALS polypeptide of each weed species resistant to ALS inhibitor herbicides has been sequenced. Amino acid substitutions at positions as far apart as position 122 and position 574 can result in resistance. (i) The gene that codes for the ALS polypeptide does not contain any non-coding sections (introns). The first amino acid in the final polypeptide is methionine. State the number of base pairs in the gene that codes for an ALS polypeptide. ...................................................................................................................................... [1] (ii) Explain why resistance to ALS inhibitor herbicide can result from substitutions of amino acids that are far apart in the primary sequence. ........................................................................................................................................... ........................................................................................................................................... ........................................................................................................................................... ........................................................................................................................................... ........................................................................................................................................... ...................................................................................................................................... [2] (c) Genetic modification is one method used to develop herbicide resistance in crop plants. Other methods include: method 1: crossing a crop plant with a herbicide-resistant wild plant belonging to the same genus and then applying the herbicide method 2: causing mutations in the crop plants and then applying the herbicide. State two benefits of using method 1 and two benefits of using method 2 to develop herbicide resistance in crop plants. method 1 ................................................................................................................................... ................................................................................................................................................... ................................................................................................................................................... ................................................................................................................................................... ................................................................................................................................................... ................................................................................................................................................... method 2 ................................................................................................................................... ................................................................................................................................................... ................................................................................................................................................... ................................................................................................................................................... ................................................................................................................................................... .............................................................................................................................................. [4] [Total: 14]
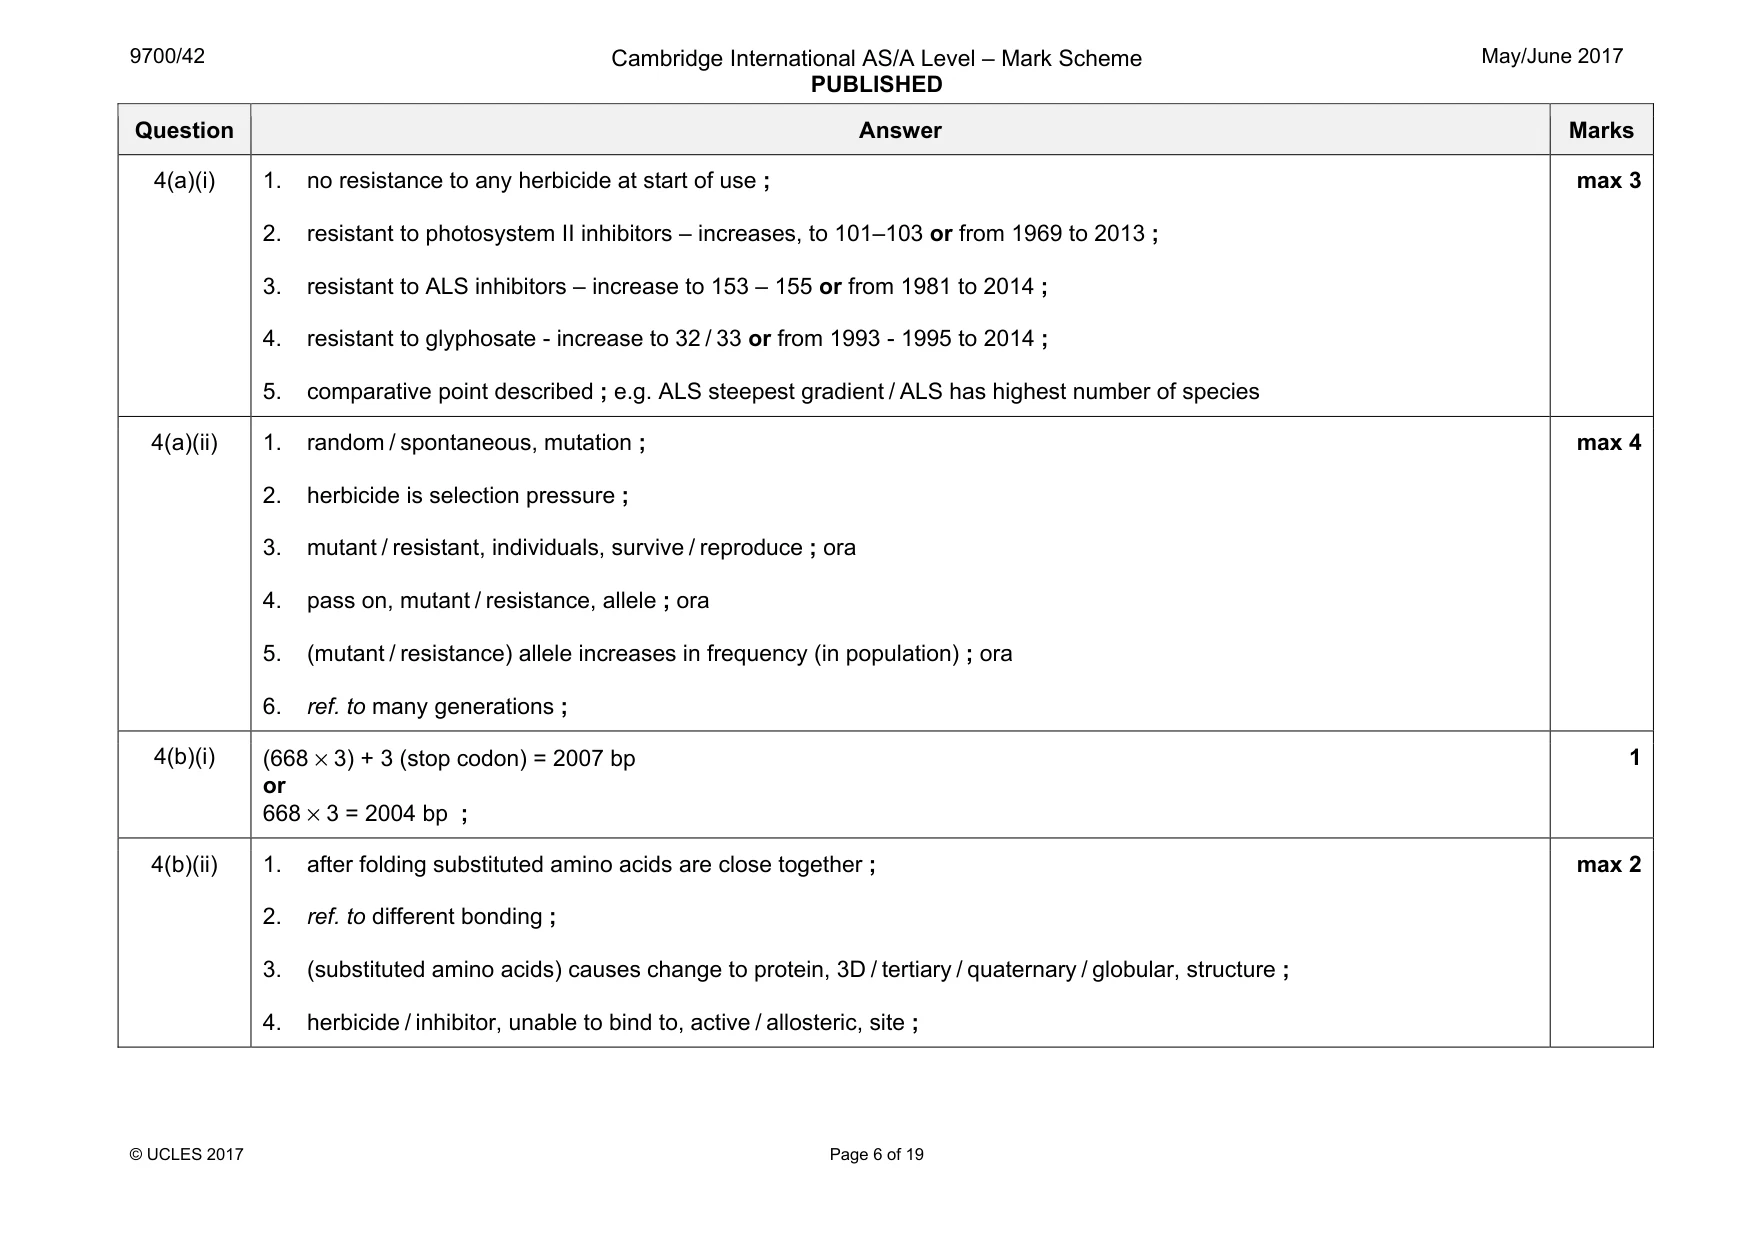
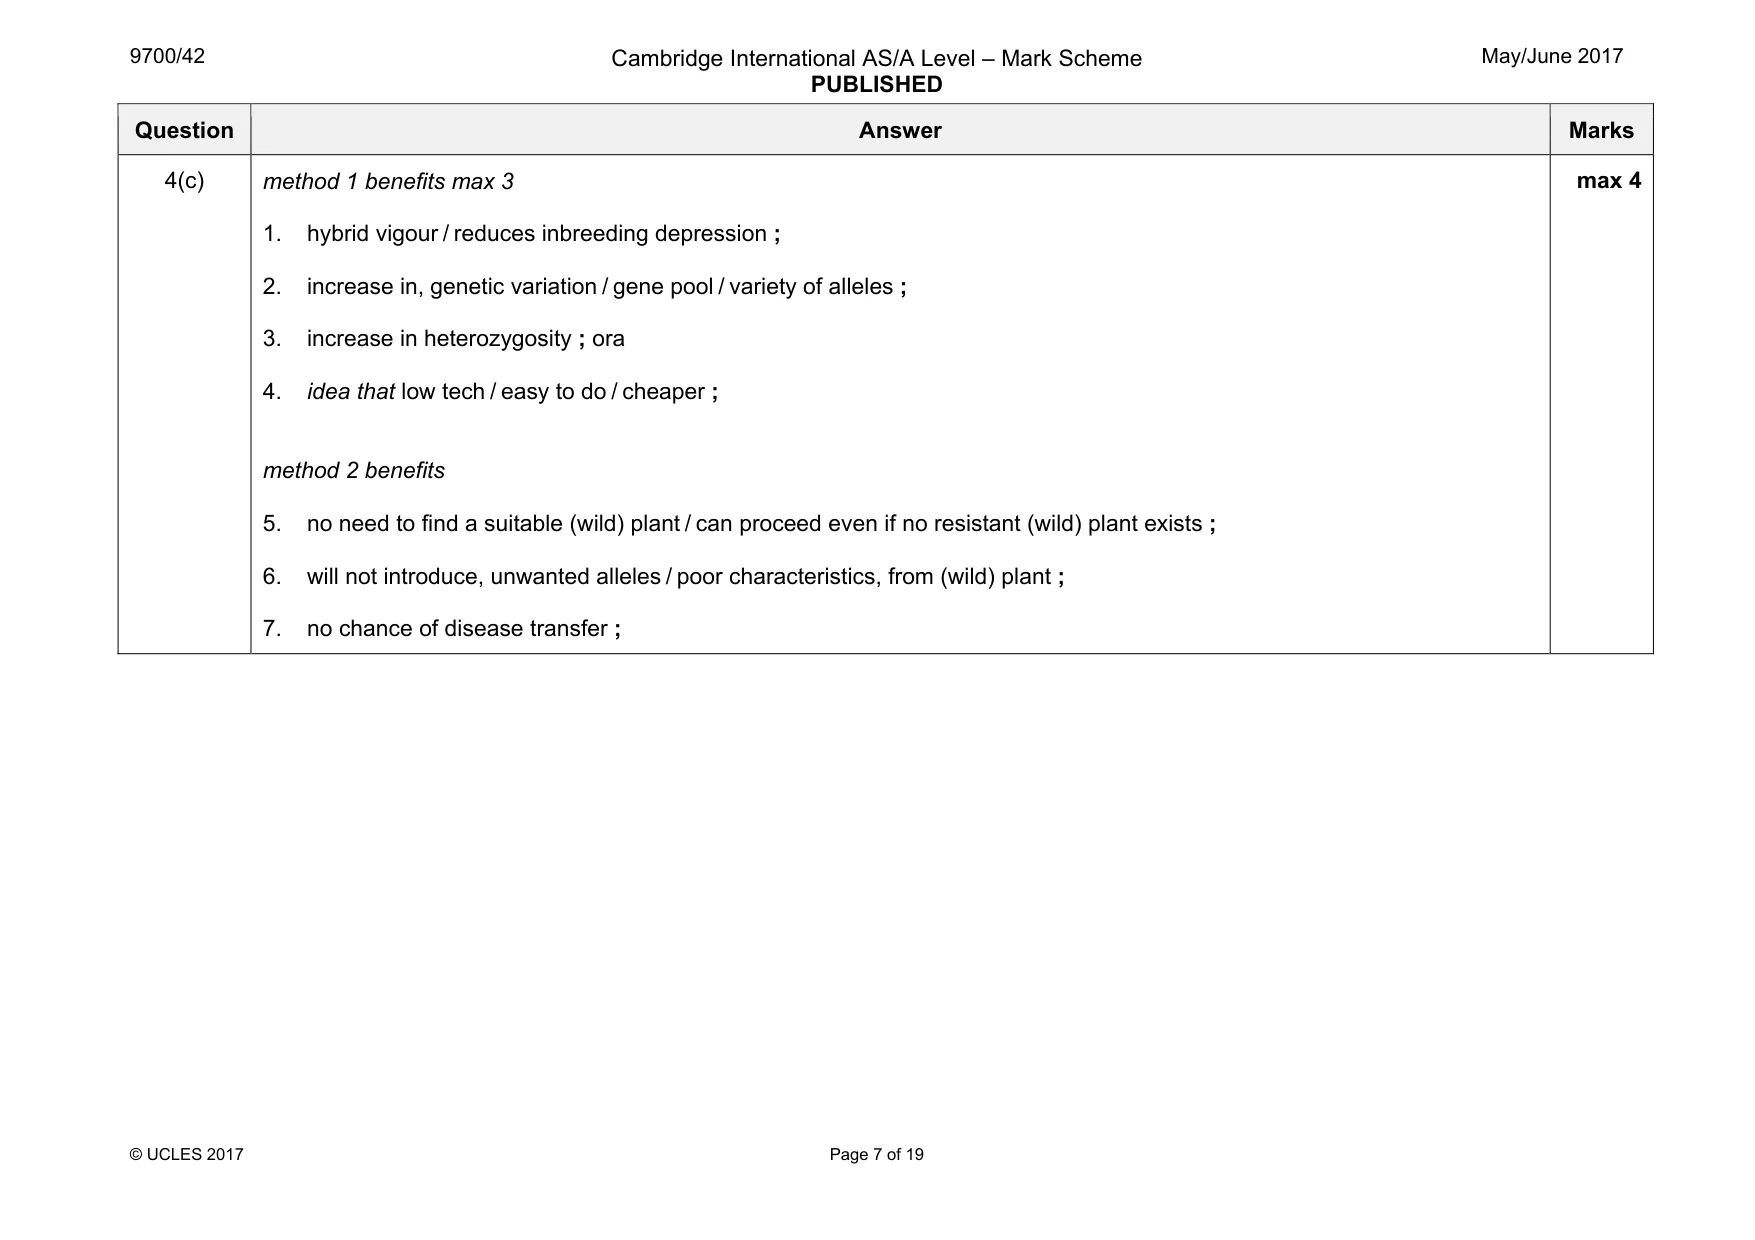
Mark scheme: 4(a)(i) 1. no resistance to any herbicide at start of use ; 2. resistant to photosystem II inhibitors – increases, to 101–103 or from 1969 to 2013 ; 3. resistant to ALS inhibitors – increase to 153 – 155 or from 1981 to 2014 ; 4. resistant to glyphosate - increase to 32 / 33 or from 1993 - 1995 to 2014 ; 5. comparative point described ; e.g. ALS steepest gradient / ALS has highest number of species max 3 4(a)(ii) 1. random / spontaneous, mutation ; 2. herbicide is selection pressure ; 3. mutant / resistant, individuals, survive / reproduce ; ora 4. pass on, mutant / resistance, allele ; ora 5. (mutant / resistance) allele increases in frequency (in population) ; ora 6. ref. to many generations ; max 4 4(b)(i) (668 × 3) + 3 (stop codon) = 2007 bp or 668 × 3 = 2004 bp ; 1 4(b)(ii) 1. after folding substituted amino acids are close together ; 2. ref. to different bonding ; 3. (substituted amino acids) causes change to protein, 3D / tertiary / quaternary / globular, structure ; 4. herbicide / inhibitor, unable to bind to, active / allosteric, site ; max 2 Question Answer Marks 4(c) method 1 benefits max 3 1. hybrid vigour / reduces inbreeding depression ; 2. increase in, genetic variation / gene pool / variety of alleles ; 3. increase in heterozygosity ; ora 4. idea that low tech / easy to do / cheaper ; method 2 benefits 5. no need to find a suitable (wild) plant / can proceed even if no resistant (wild) plant exists ; 6. will not introduce, unwanted alleles / poor characteristics, from (wild) plant ; 7. no chance of disease transfer ; max 4
Q5 · Cancer is a disease in which normal controls over cell division are lost and malignant…
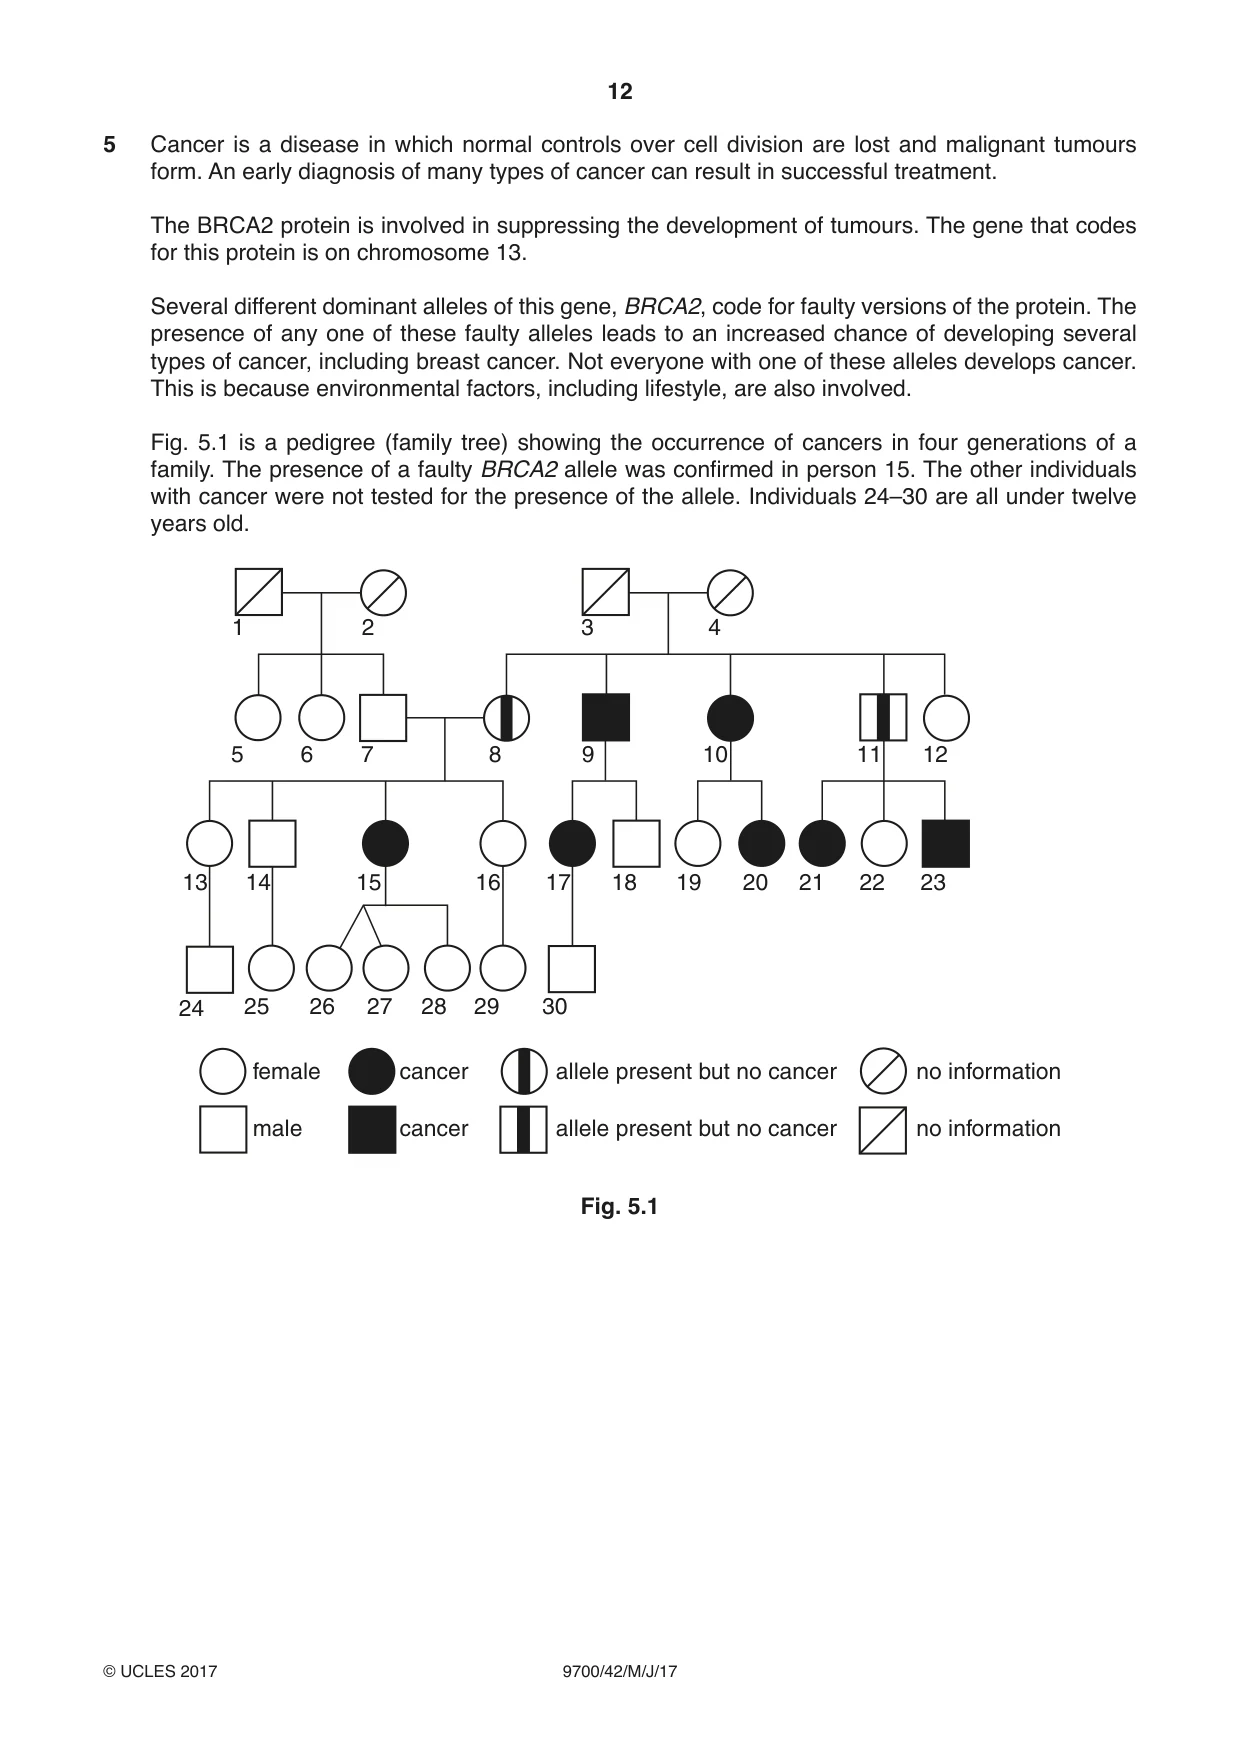
5 Cancer is a disease in which normal controls over cell division are lost and malignant tumours form. An early diagnosis of many types of cancer can result in successful treatment. The BRCA2 protein is involved in suppressing the development of tumours. The gene that codes for this protein is on chromosome 13. Several different dominant alleles of this gene, BRCA2, code for faulty versions of the protein. The presence of any one of these faulty alleles leads to an increased chance of developing several types of cancer, including breast cancer. Not everyone with one of these alleles develops cancer. This is because environmental factors, including lifestyle, are also involved. Fig. 5.1 is a pedigree (family tree) showing the occurrence of cancers in four generations of a family. The presence of a faulty BRCA2 allele was confirmed in person 15. The other individuals with cancer were not tested for the presence of the allele. Individuals 24–30 are all under twelve years old. 1 2 3 4 5 6 7 8 9 10 11 12 13 14 15 16 17 18 19 20 21 22 23 24 25 26 27 28 29 30 female cancer allele present but no cancer no information male cancer allele present but no cancer no information Fig. 5.1 (a) Discuss the extent to which Fig. 5.1 provides evidence that a faulty BRCA2 allele increases the risk of a person developing cancer. ................................................................................................................................................... ................................................................................................................................................... ................................................................................................................................................... ................................................................................................................................................... ................................................................................................................................................... ................................................................................................................................................... ................................................................................................................................................... ................................................................................................................................................... ................................................................................................................................................... ................................................................................................................................................... ................................................................................................................................................... .............................................................................................................................................. [4] (b) People whose families are suspected of having a faulty BRCA2 allele may choose to be tested for its presence in their own genome. A company based in the USA sells a microarray containing DNA probes for 20 different alleles that are associated with an increased risk of cancer, including the faulty BRCA2 alleles. This microarray can be used in a medical facility or research laboratory to test blood samples for the presence of these alleles. (i) Explain the meaning of the term genome. ........................................................................................................................................... ........................................................................................................................................... ...................................................................................................................................... [1] (ii) Suggest a type of cell from a blood sample that is suitable for testing for the presence of this allele and explain your choice. ........................................................................................................................................... ........................................................................................................................................... ...................................................................................................................................... [1] (iii) Outline how a microarray enables the detection of particular alleles. ........................................................................................................................................... ........................................................................................................................................... ........................................................................................................................................... ........................................................................................................................................... ........................................................................................................................................... ........................................................................................................................................... ........................................................................................................................................... ........................................................................................................................................... ...................................................................................................................................... [4] (iv) Suggest one advantage and one disadvantage of screening for faulty alleles of BRCA2 before any symptoms occur. advantage ......................................................................................................................... ........................................................................................................................................... ........................................................................................................................................... disadvantage ..................................................................................................................... ........................................................................................................................................... ...................................................................................................................................... [2] [Total: 12]
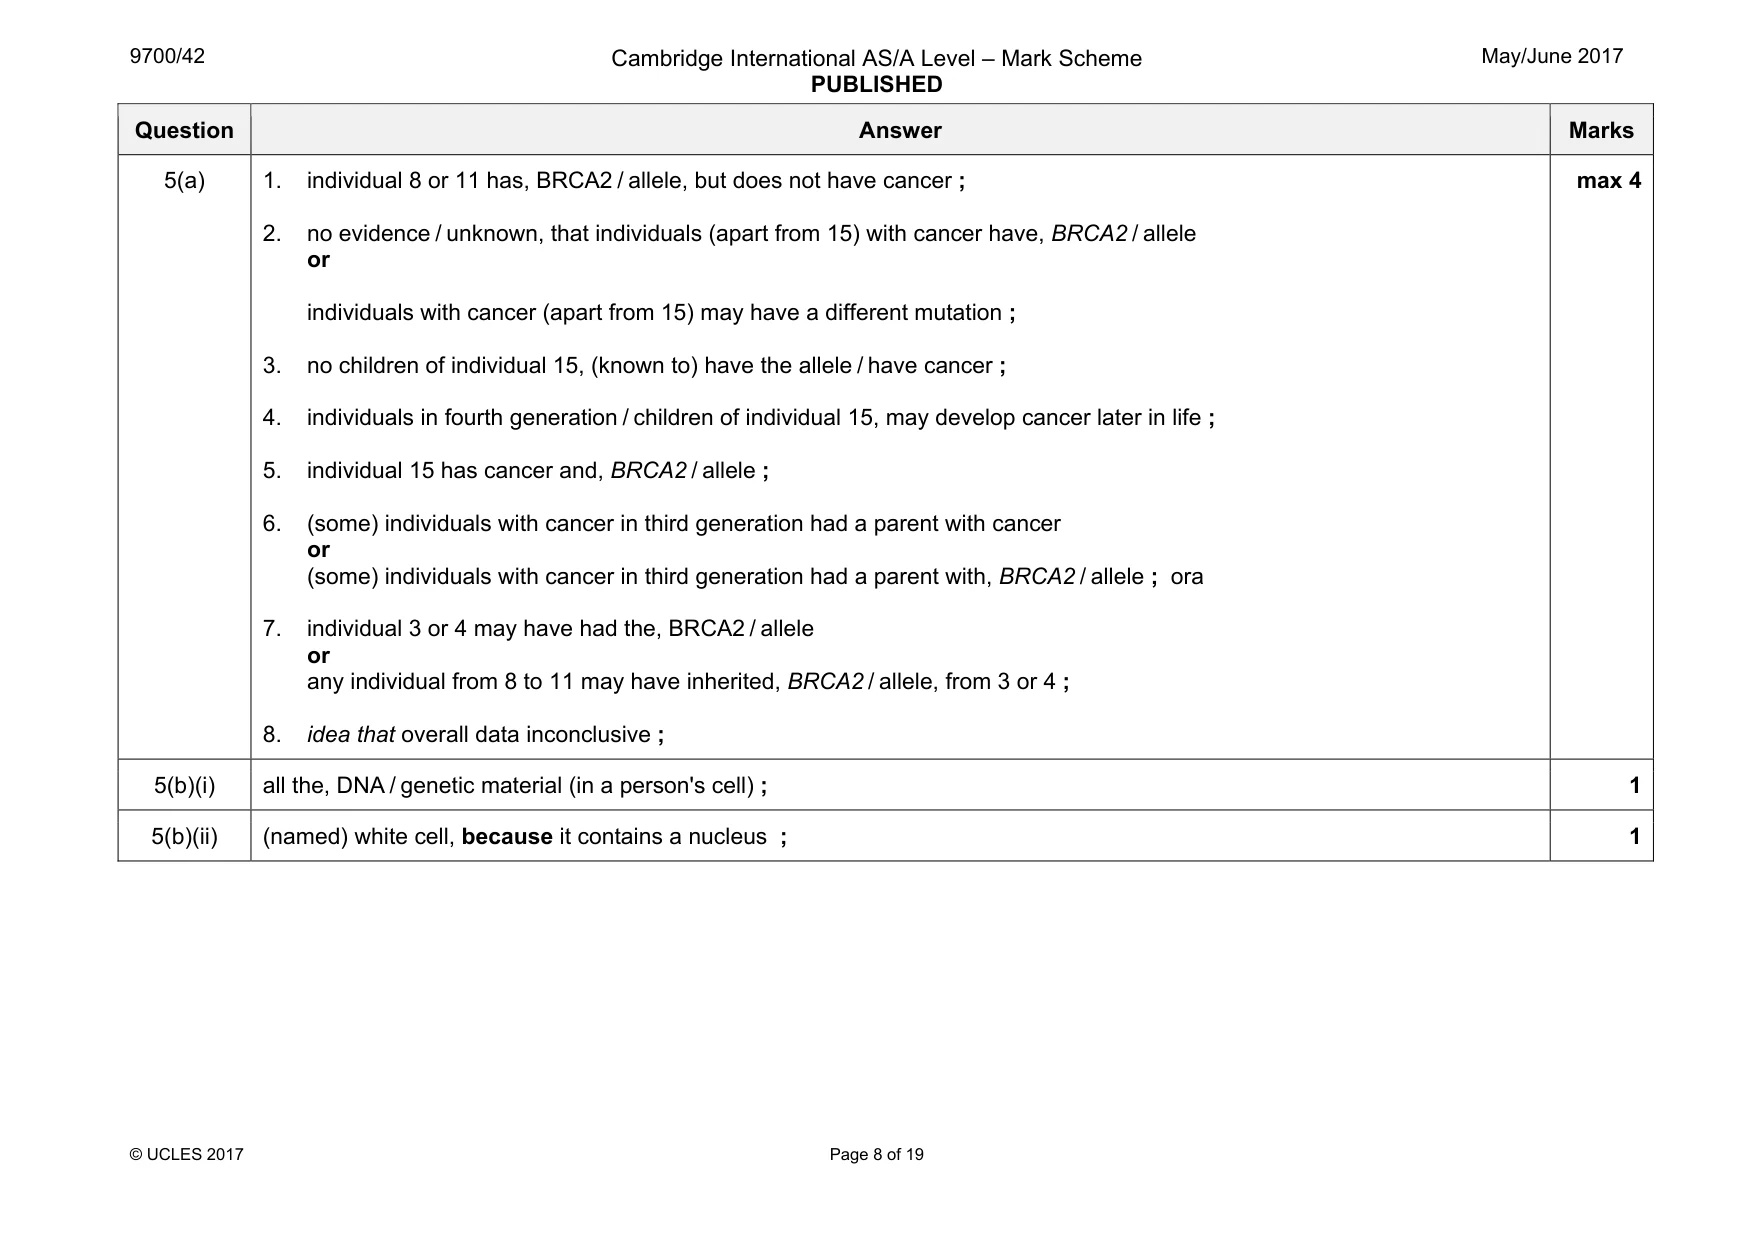
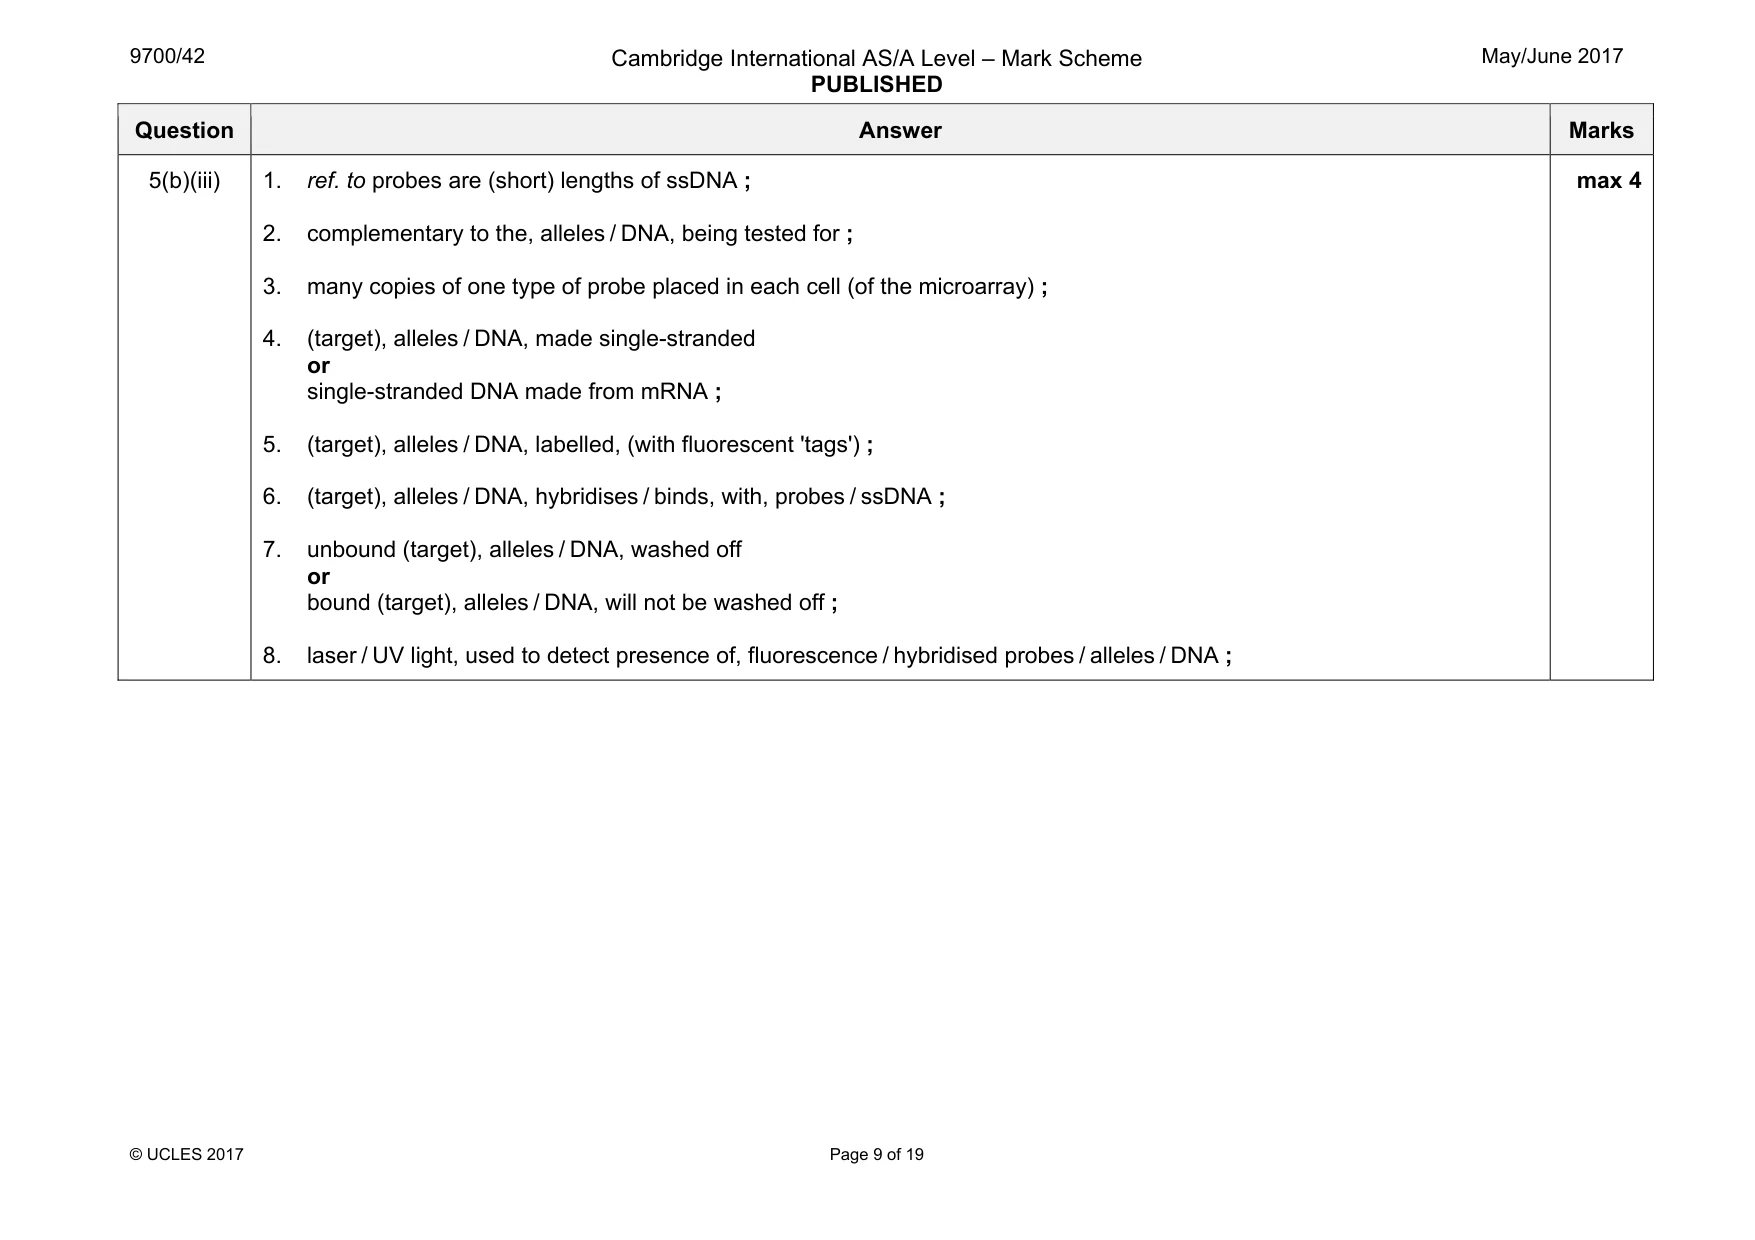
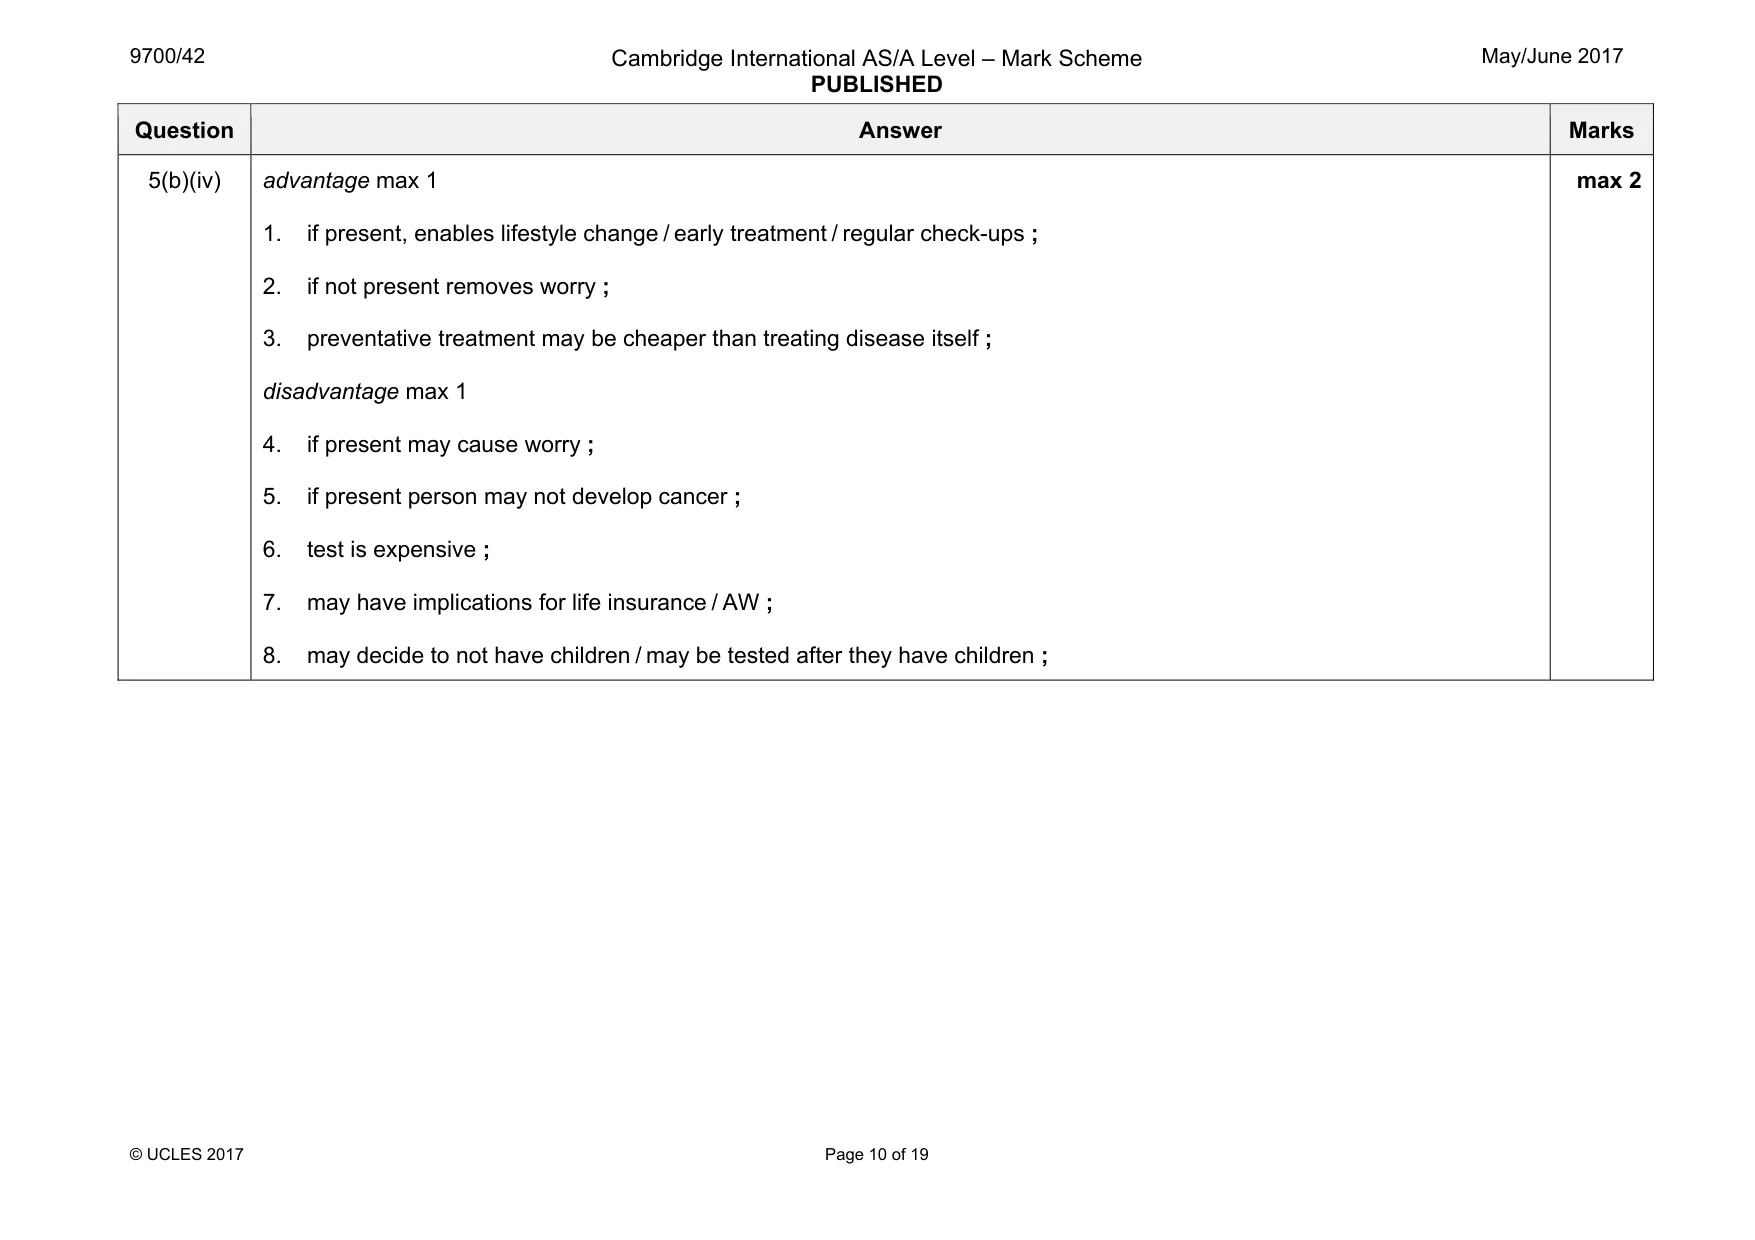
Mark scheme: 5(a) 1. individual 8 or 11 has, BRCA2 / allele, but does not have cancer ; 2. no evidence / unknown, that individuals (apart from 15) with cancer have, BRCA2 / allele or individuals with cancer (apart from 15) may have a different mutation ; 3. no children of individual 15, (known to) have the allele / have cancer ; 4. individuals in fourth generation / children of individual 15, may develop cancer later in life ; 5. individual 15 has cancer and, BRCA2 / allele ; 6. (some) individuals with cancer in third generation had a parent with cancer or (some) individuals with cancer in third generation had a parent with, BRCA2 / allele ; ora 7. individual 3 or 4 may have had the, BRCA2 / allele or any individual from 8 to 11 may have inherited, BRCA2 / allele, from 3 or 4 ; 8. idea that overall data inconclusive ; max 4 5(b)(i) all the, DNA / genetic material (in a person's cell) ; 1 5(b)(ii) (named) white cell, because it contains a nucleus ; 1 Question Answer Marks 5(b)(iii) 1. ref. to probes are (short) lengths of ssDNA ; 2. complementary to the, alleles / DNA, being tested for ; 3. many copies of one type of probe placed in each cell (of the microarray) ; 4. (target), alleles / DNA, made single-stranded or single-stranded DNA made from mRNA ; 5. (target), alleles / DNA, labelled, (with fluorescent 'tags') ; 6. (target), alleles / DNA, hybridises / binds, with, probes / ssDNA ; 7. unbound (target), alleles / DNA, washed off or bound (target), alleles / DNA, will not be washed off ; 8. laser / UV light, used to detect presence of, fluorescence / hybridised probes / alleles / DNA ; max 4 Question Answer Marks 5(b)(iv) advantage max 1 1. if present, enables lifestyle change / early treatment / regular check-ups ; 2. if not present removes worry ; 3. preventative treatment may be cheaper than treating disease itself ; disadvantage max 1 4. if present may cause worry ; 5. if present person may not develop cancer ; 6. test is expensive ; 7. may have implications for life insurance / AW ; 8. may decide to not have children / may be tested after they have children ; max 2
Q6 · A diagram of a Bowman’s (renal) capsule of a nephron from a mammalian kidney
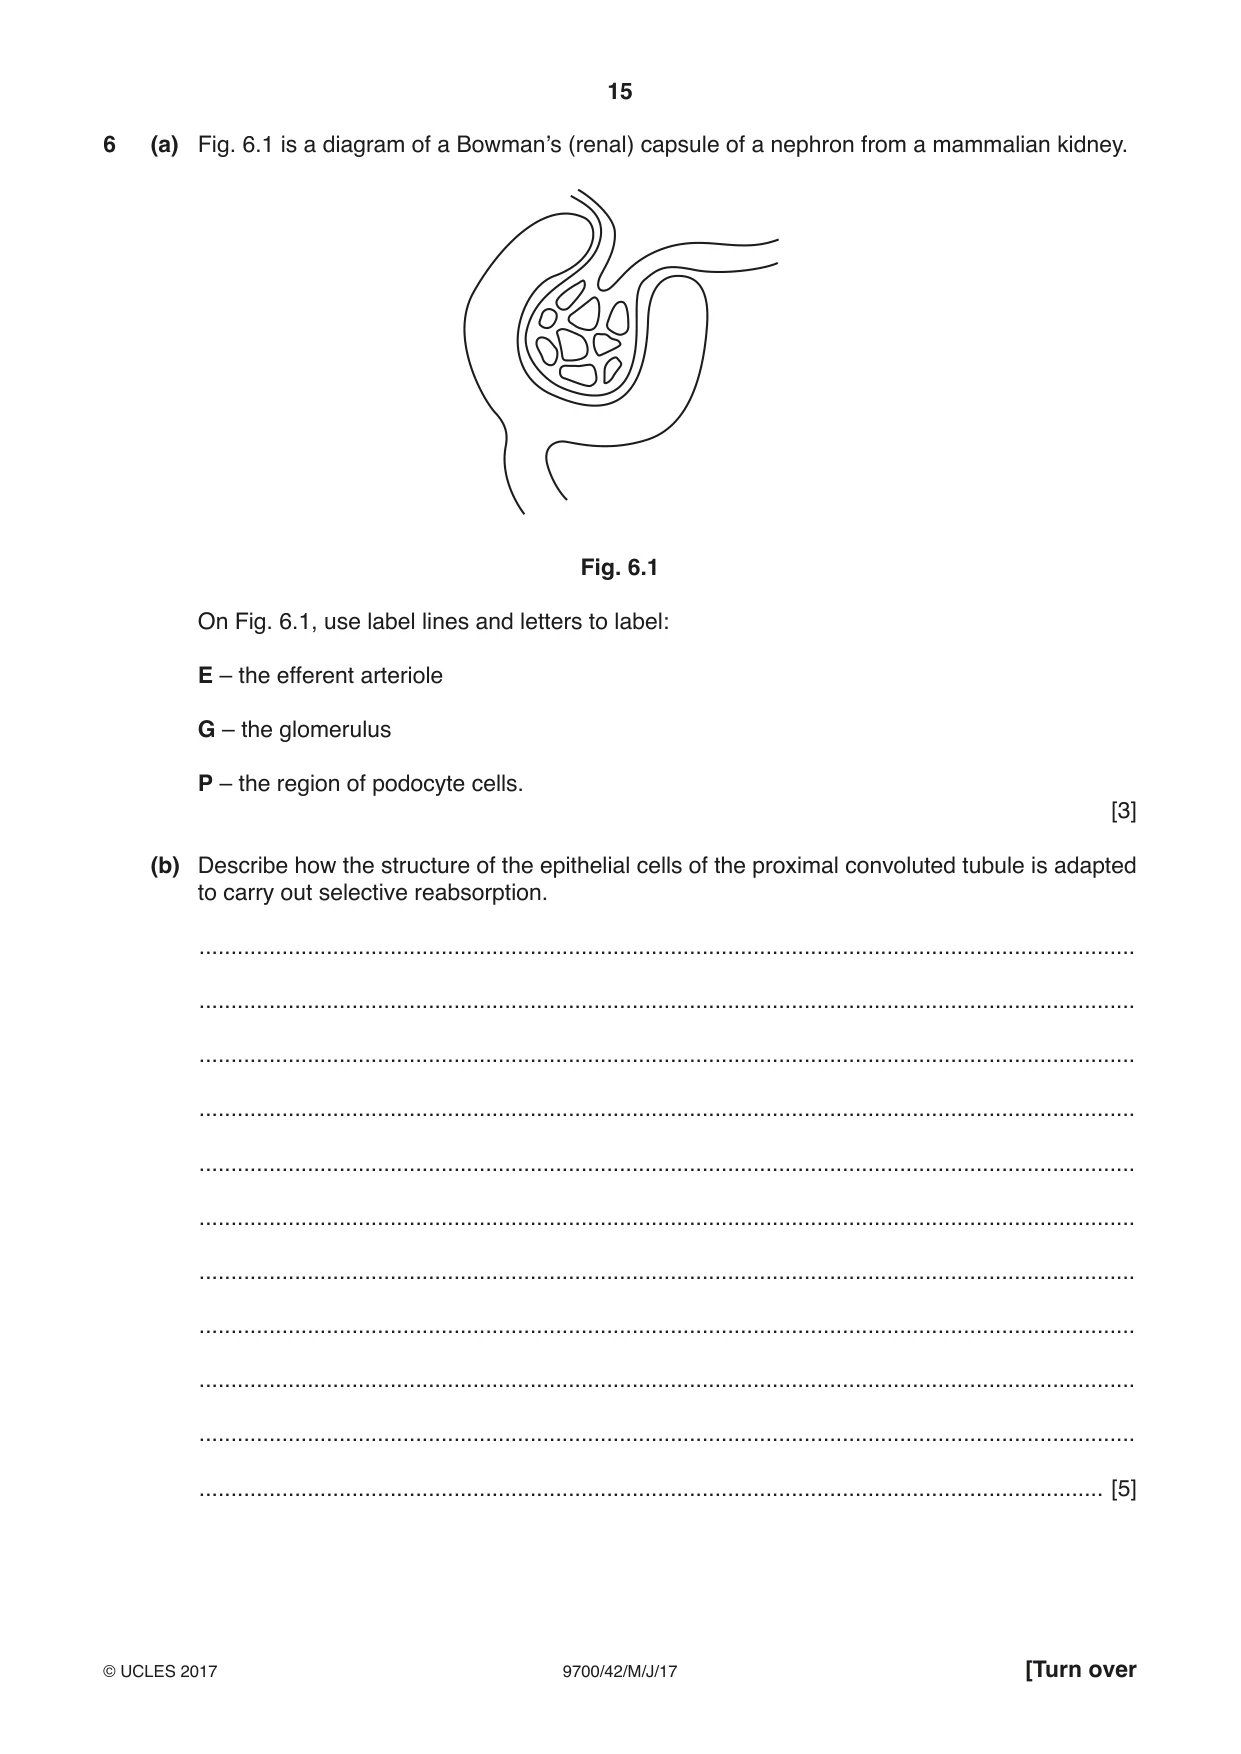
6 (a) Fig. 6.1 is a diagram of a Bowman’s (renal) capsule of a nephron from a mammalian kidney. Fig. 6.1 On Fig. 6.1, use label lines and letters to label: E – the efferent arteriole G – the glomerulus P – the region of podocyte cells. [3] (b) Describe how the structure of the epithelial cells of the proximal convoluted tubule is adapted to carry out selective reabsorption. ................................................................................................................................................... ................................................................................................................................................... ................................................................................................................................................... ................................................................................................................................................... ................................................................................................................................................... ................................................................................................................................................... ................................................................................................................................................... ................................................................................................................................................... ................................................................................................................................................... ................................................................................................................................................... .............................................................................................................................................. [5] (c) Complete the following sentences about osmoregulation. In mammals, the water potential of the blood is constantly monitored by ...................................................................................... in the hypothalamus of the brain. When the water potential of the blood decreases, the production of a hormone called ............................................................................... in the cells of the hypothalamus increases. This hormone is released into the blood via the ........................................................... This causes the kidneys to retain more water until the water potential of the blood returns to the set point. This is an example of a ..................................................................... mechanism. [4] [Total: 12]
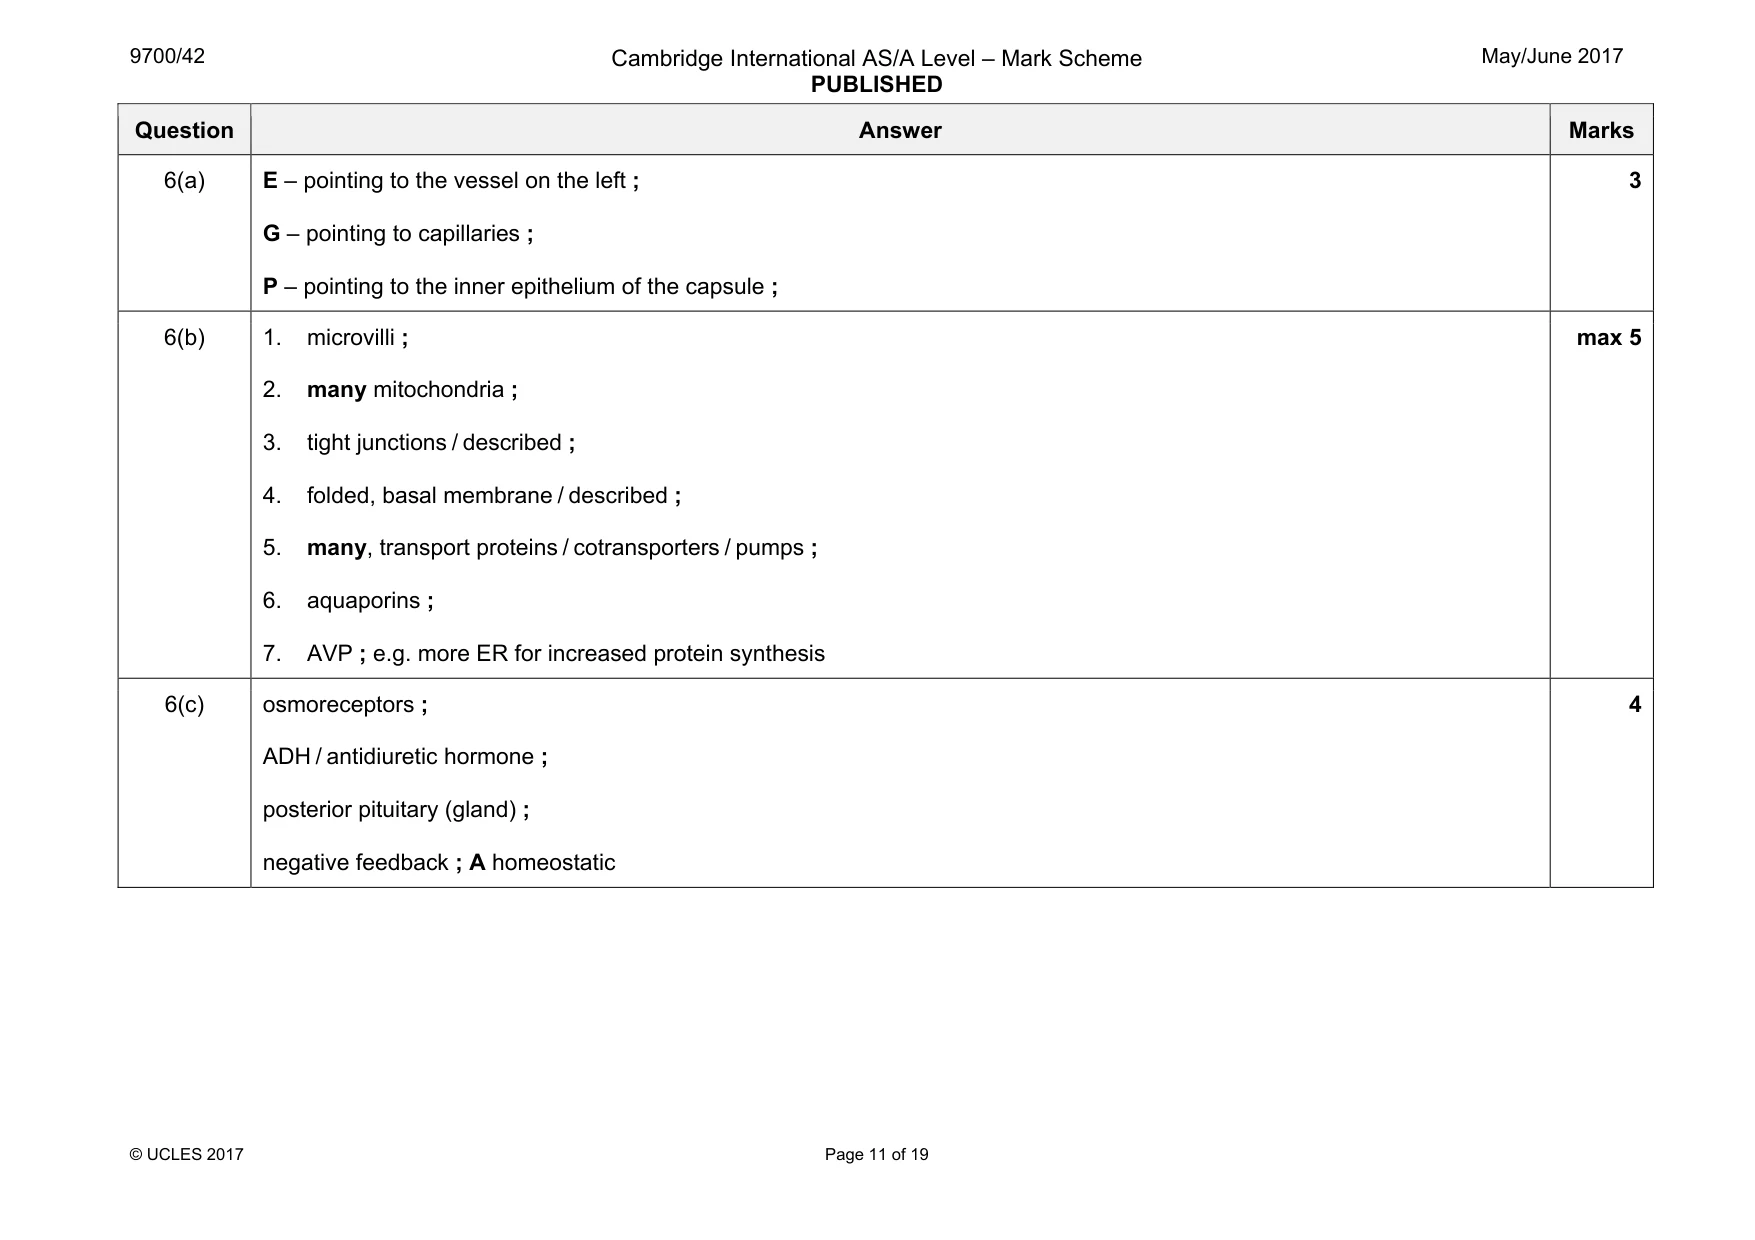
Mark scheme: 6(a) E – pointing to the vessel on the left ; G – pointing to capillaries ; P – pointing to the inner epithelium of the capsule ; 3 6(b) 1. microvilli ; 2. many mitochondria ; 3. tight junctions / described ; 4. folded, basal membrane / described ; 5. many, transport proteins / cotransporters / pumps ; 6. aquaporins ; 7. AVP ; e.g. more ER for increased protein synthesis max 5 6(c) osmoreceptors ; ADH / antidiuretic hormone ; posterior pituitary (gland) ; negative feedback ; A homeostatic 4
Q7 · Cats with either black fur or white fur are common in Europe, whereas cats with brown fur…
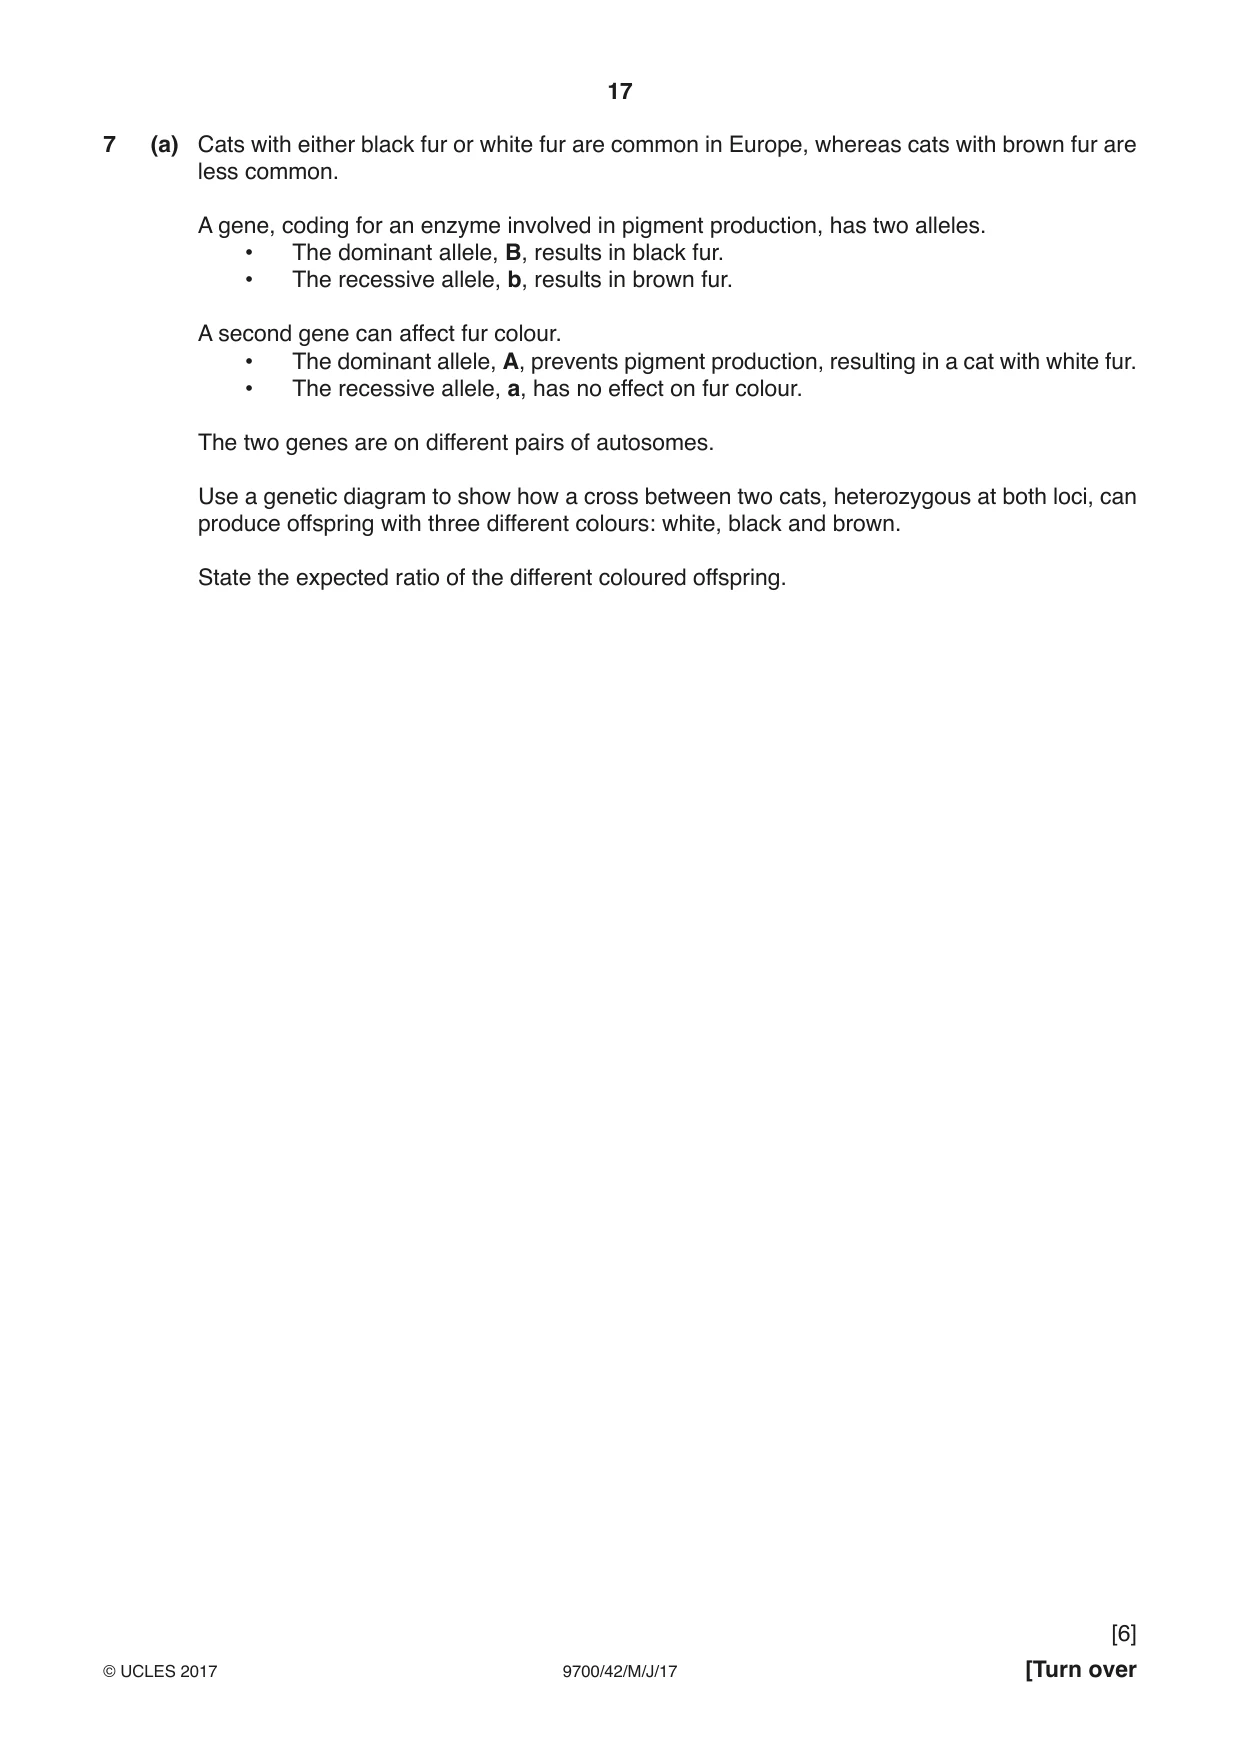
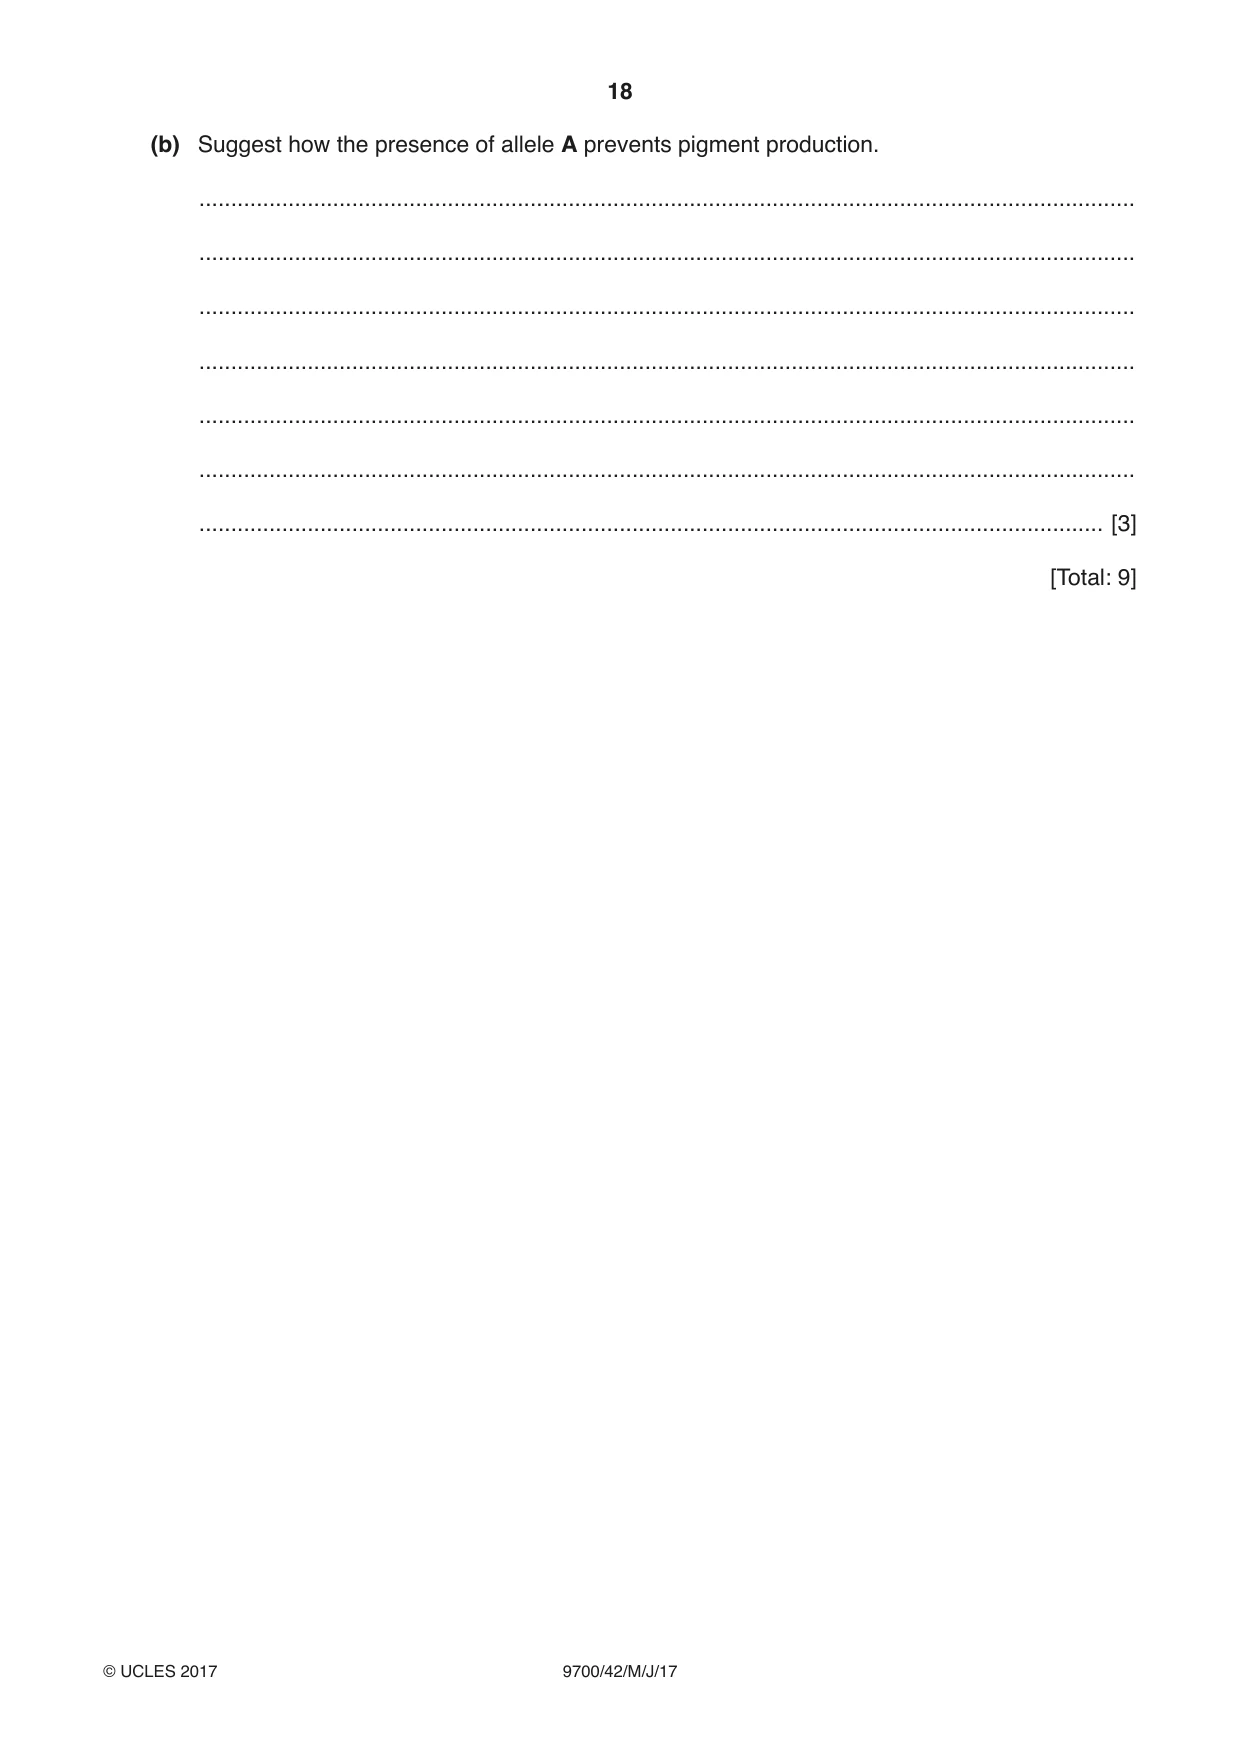
7 (a) Cats with either black fur or white fur are common in Europe, whereas cats with brown fur are less common. A gene, coding for an enzyme involved in pigment production, has two alleles. • The dominant allele, B, results in black fur. • The recessive allele, b, results in brown fur. A second gene can affect fur colour. • The dominant allele, A, prevents pigment production, resulting in a cat with white fur. • The recessive allele, a, has no effect on fur colour. The two genes are on different pairs of autosomes. Use a genetic diagram to show how a cross between two cats, heterozygous at both loci, can produce offspring with three different colours: white, black and brown. State the expected ratio of the different coloured offspring. [6] (b) Suggest how the presence of allele A prevents pigment production. ................................................................................................................................................... ................................................................................................................................................... ................................................................................................................................................... ................................................................................................................................................... ................................................................................................................................................... ................................................................................................................................................... .............................................................................................................................................. [3] [Total: 9]
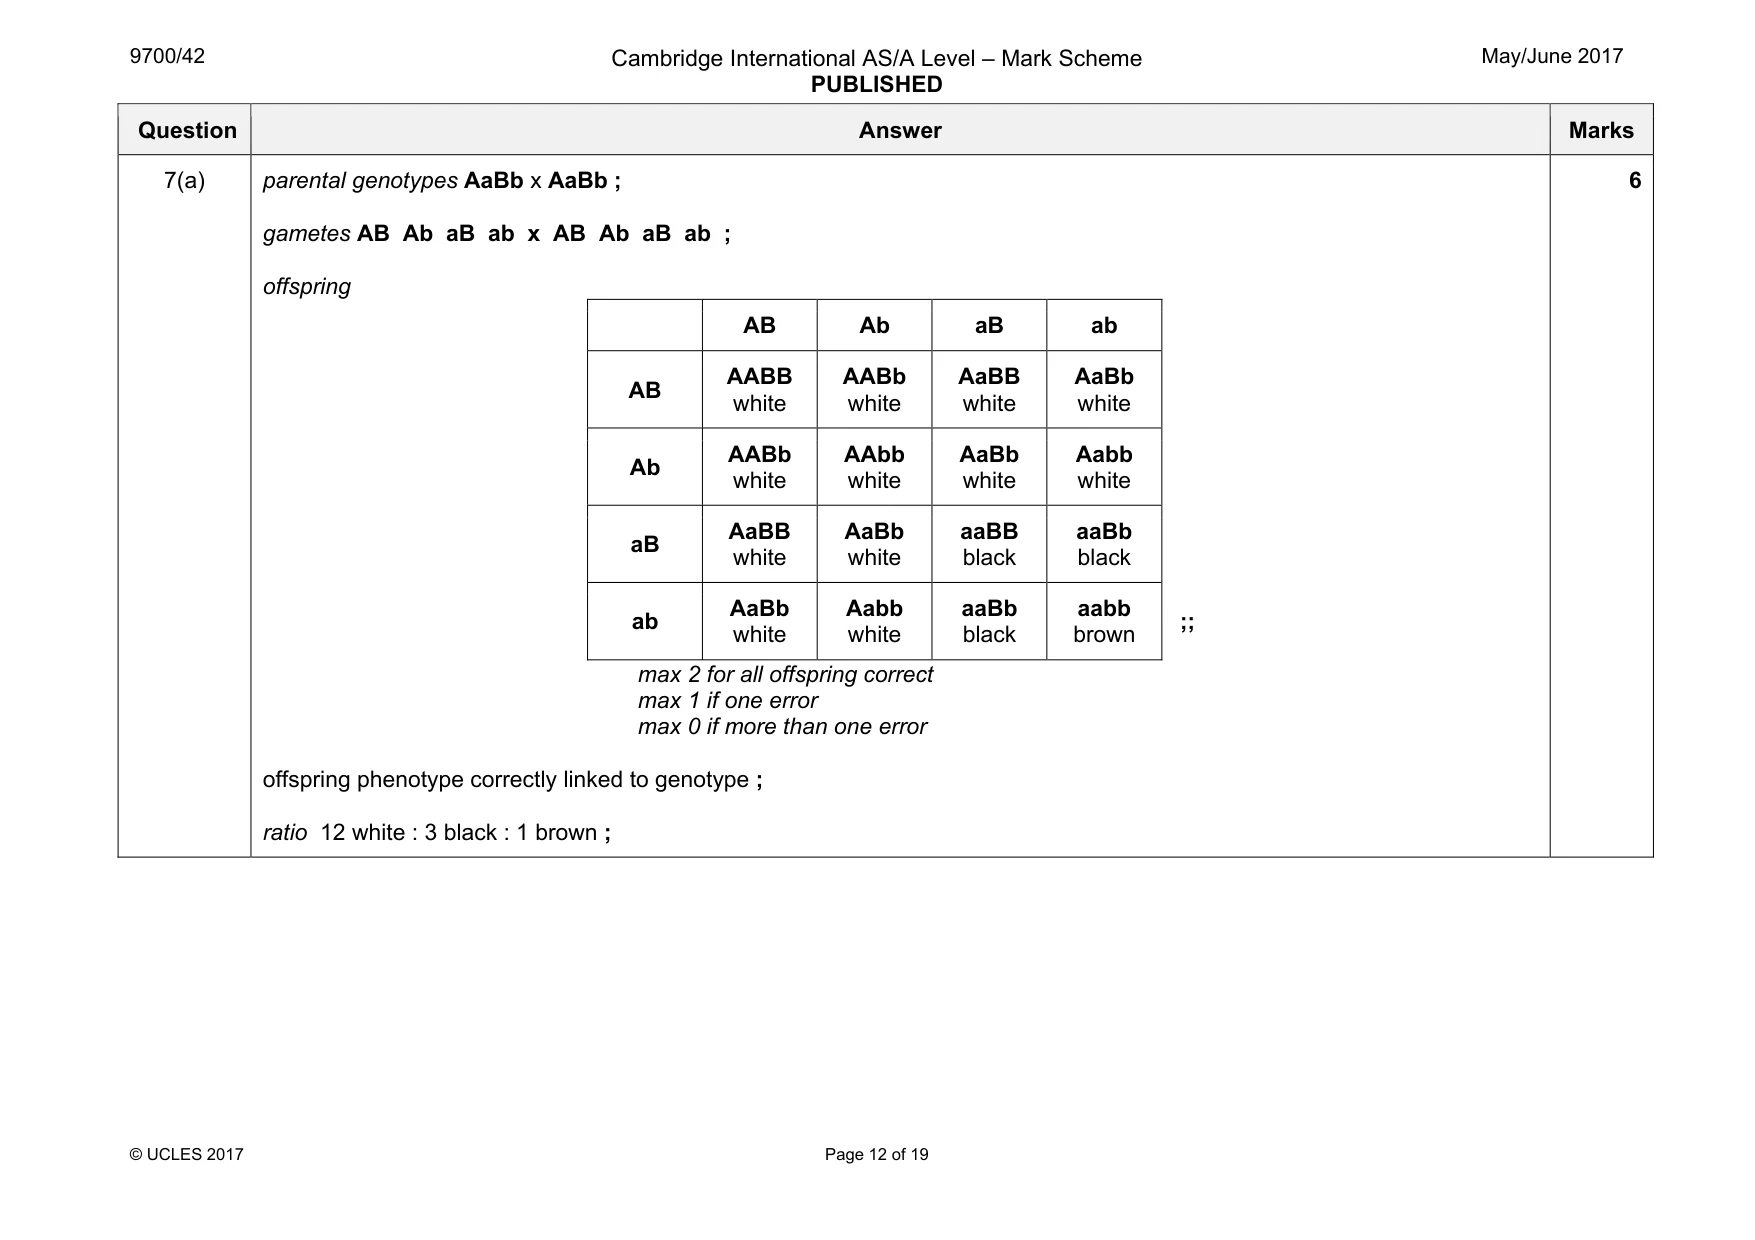
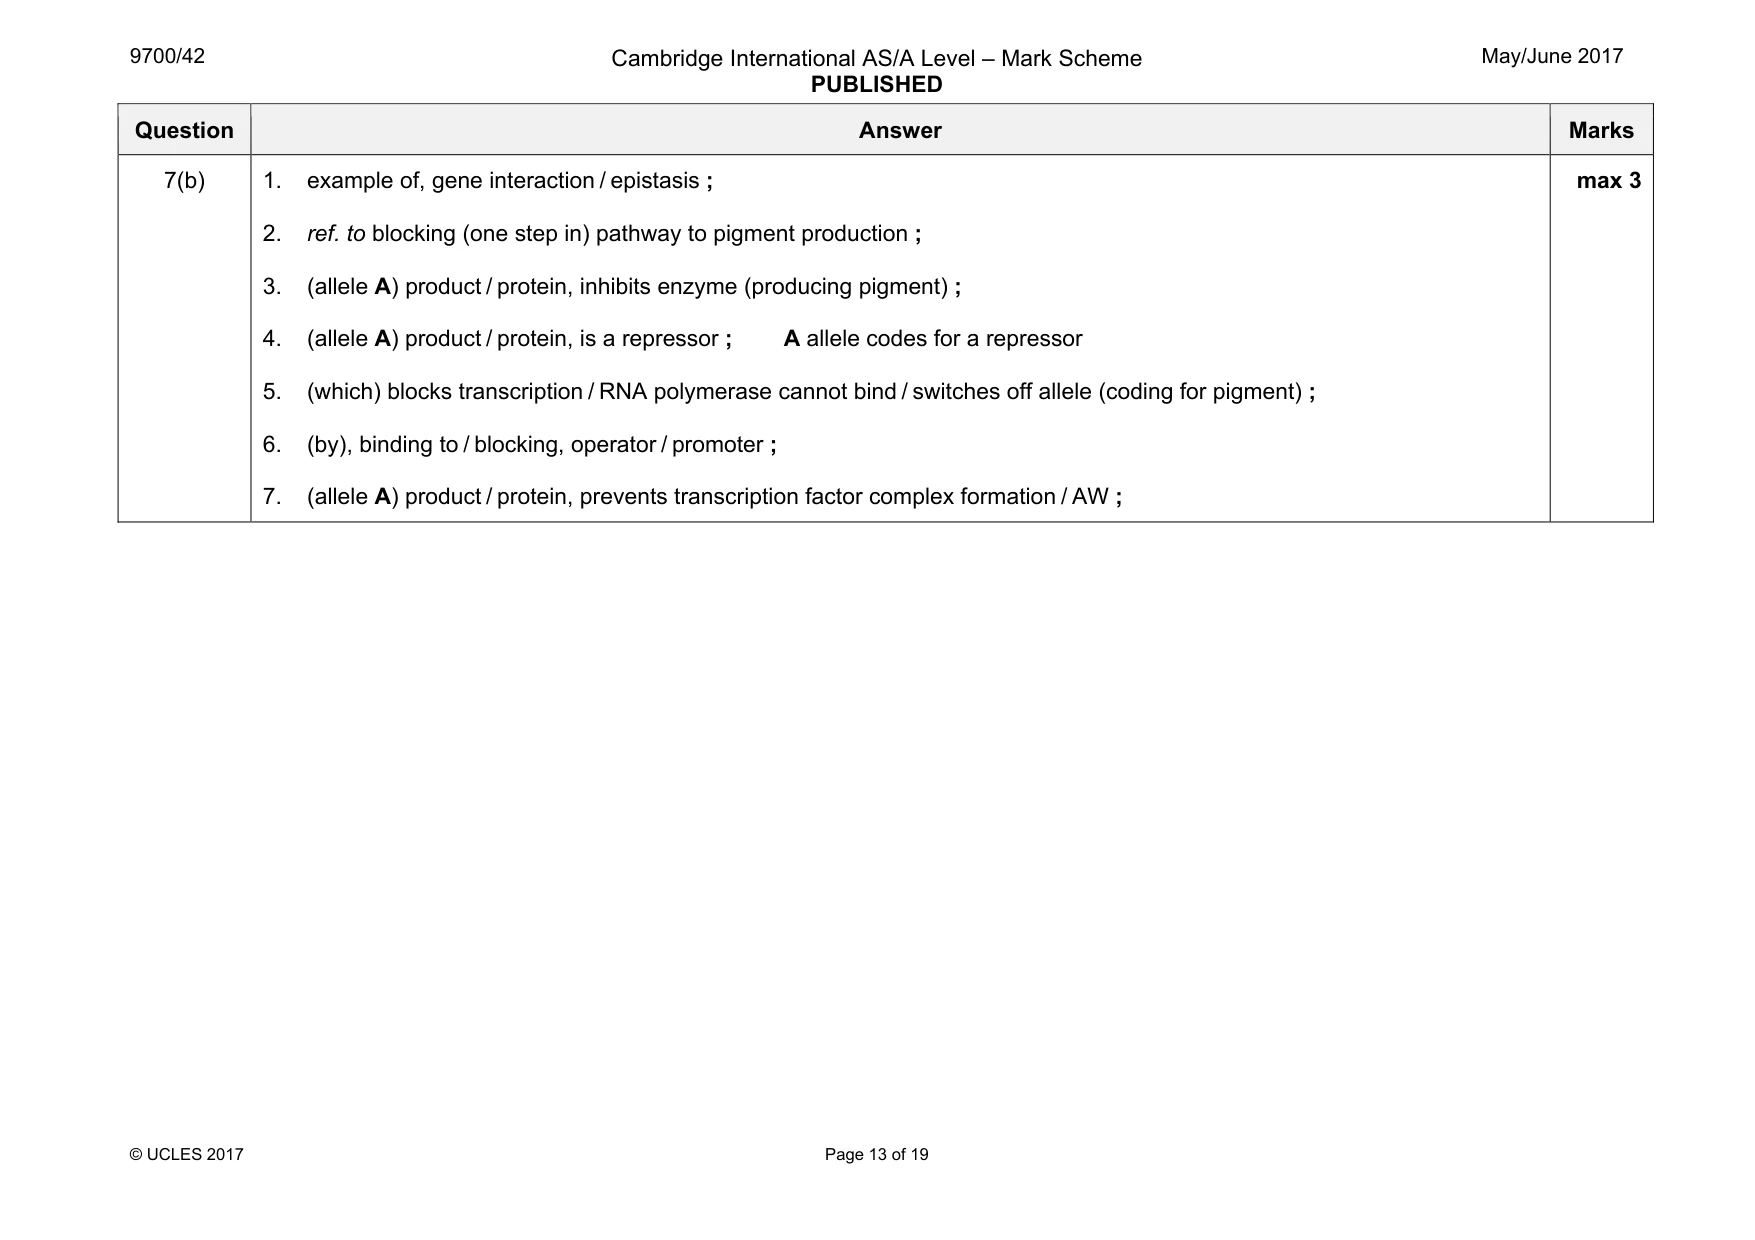
Mark scheme: 7(a) parental genotypes AaBb x AaBb ; gametes AB Ab aB ab x AB Ab aB ab ; offspring AB Ab aB ab AB AABB white AABb white AaBB white AaBb white Ab AABb white AAbb white AaBb white Aabb white aB AaBB white AaBb white aaBB black aaBb black ab AaBb white Aabb white aaBb black aabb brown ;; max 2 for all offspring correct max 1 if one error max 0 if more than one error offspring phenotype correctly linked to genotype ; ratio 12 white : 3 black : 1 brown ; 6 Question Answer Marks 7(b) 1. example of, gene interaction / epistasis ; 2. ref. to blocking (one step in) pathway to pigment production ; 3. (allele A) product / protein, inhibits enzyme (producing pigment) ; 4. (allele A) product / protein, is a repressor ; A allele codes for a repressor 5. (which) blocks transcription / RNA polymerase cannot bind / switches off allele (coding for pigment) ; 6. (by), binding to / blocking, operator / promoter ; 7. (allele A) product / protein, prevents transcription factor complex formation / AW ; max 3
More questions on Passage of information from parents to offspring
Q8 · An investigation was carried out in a temperate woodland that contained a number of areas…
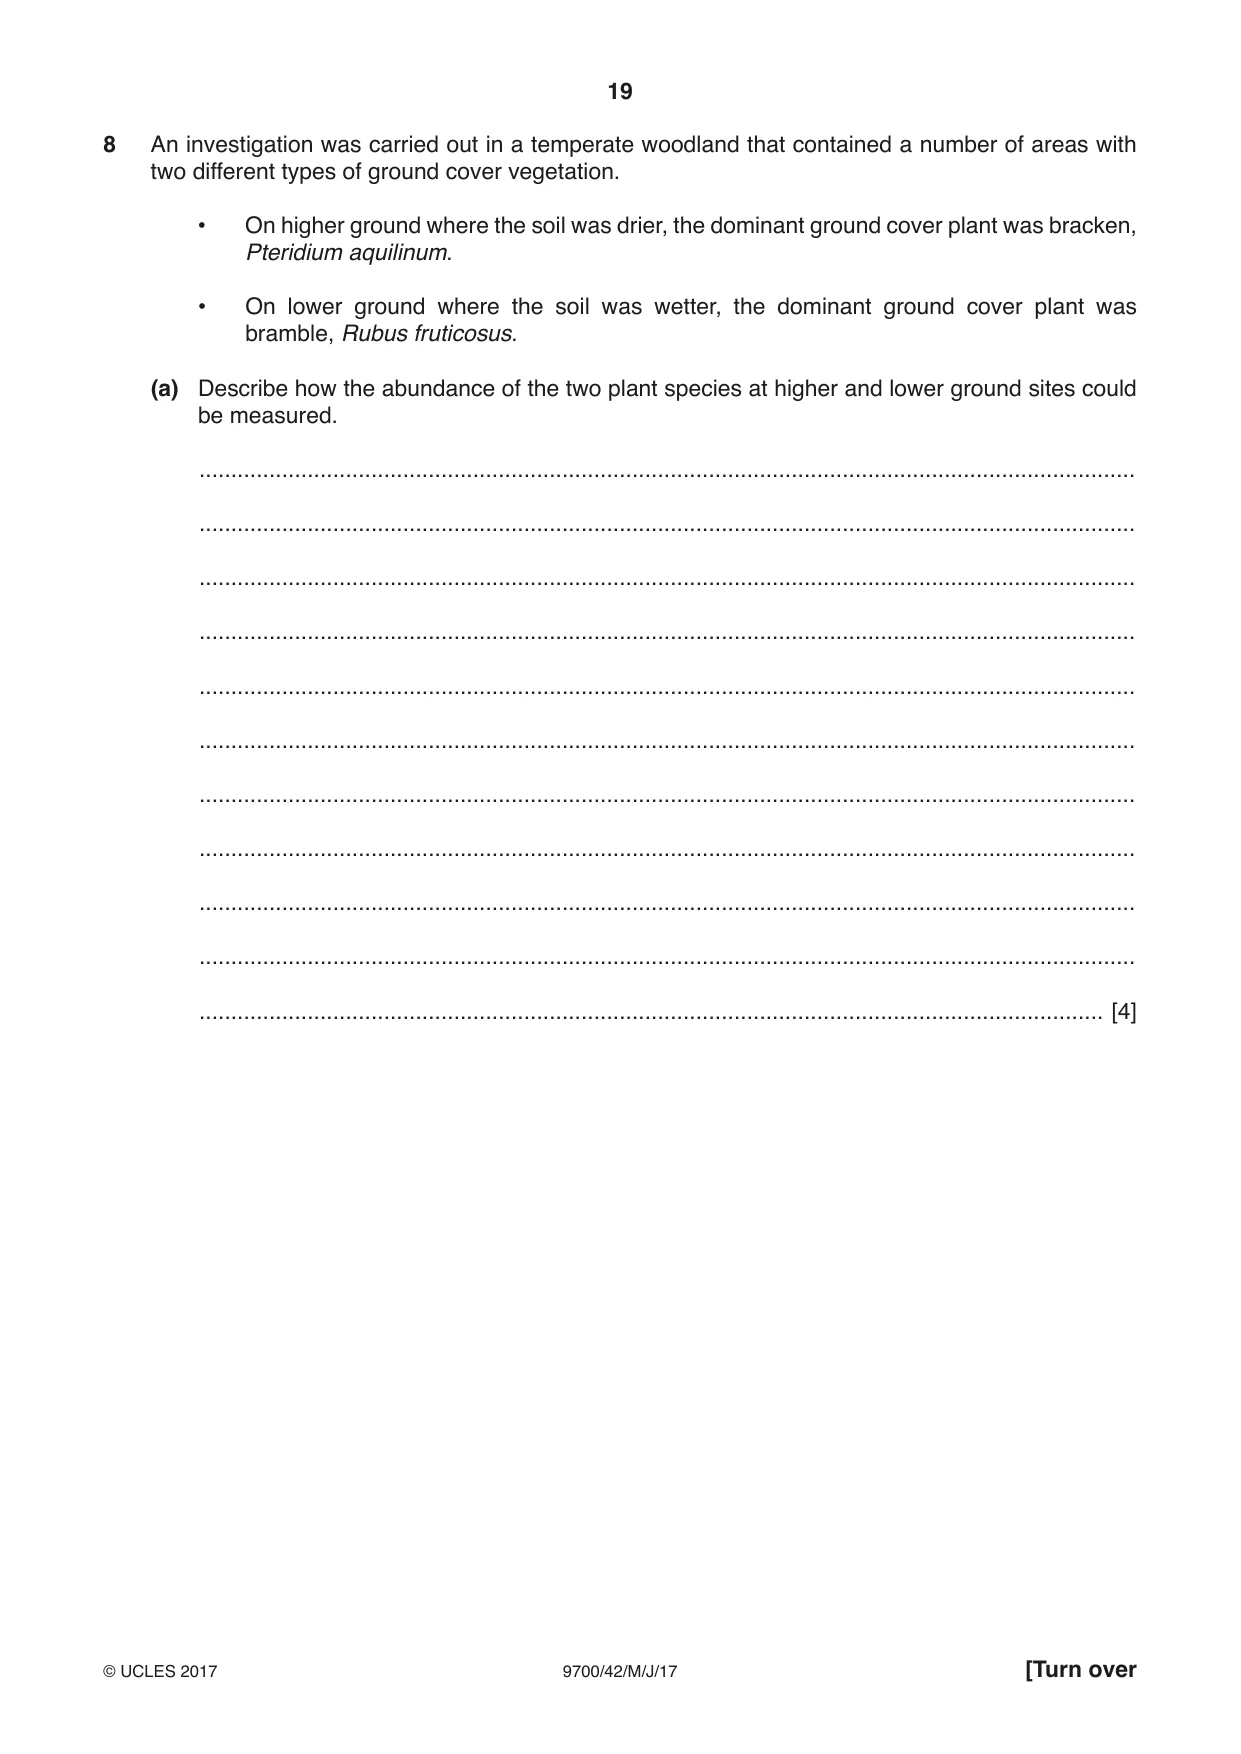
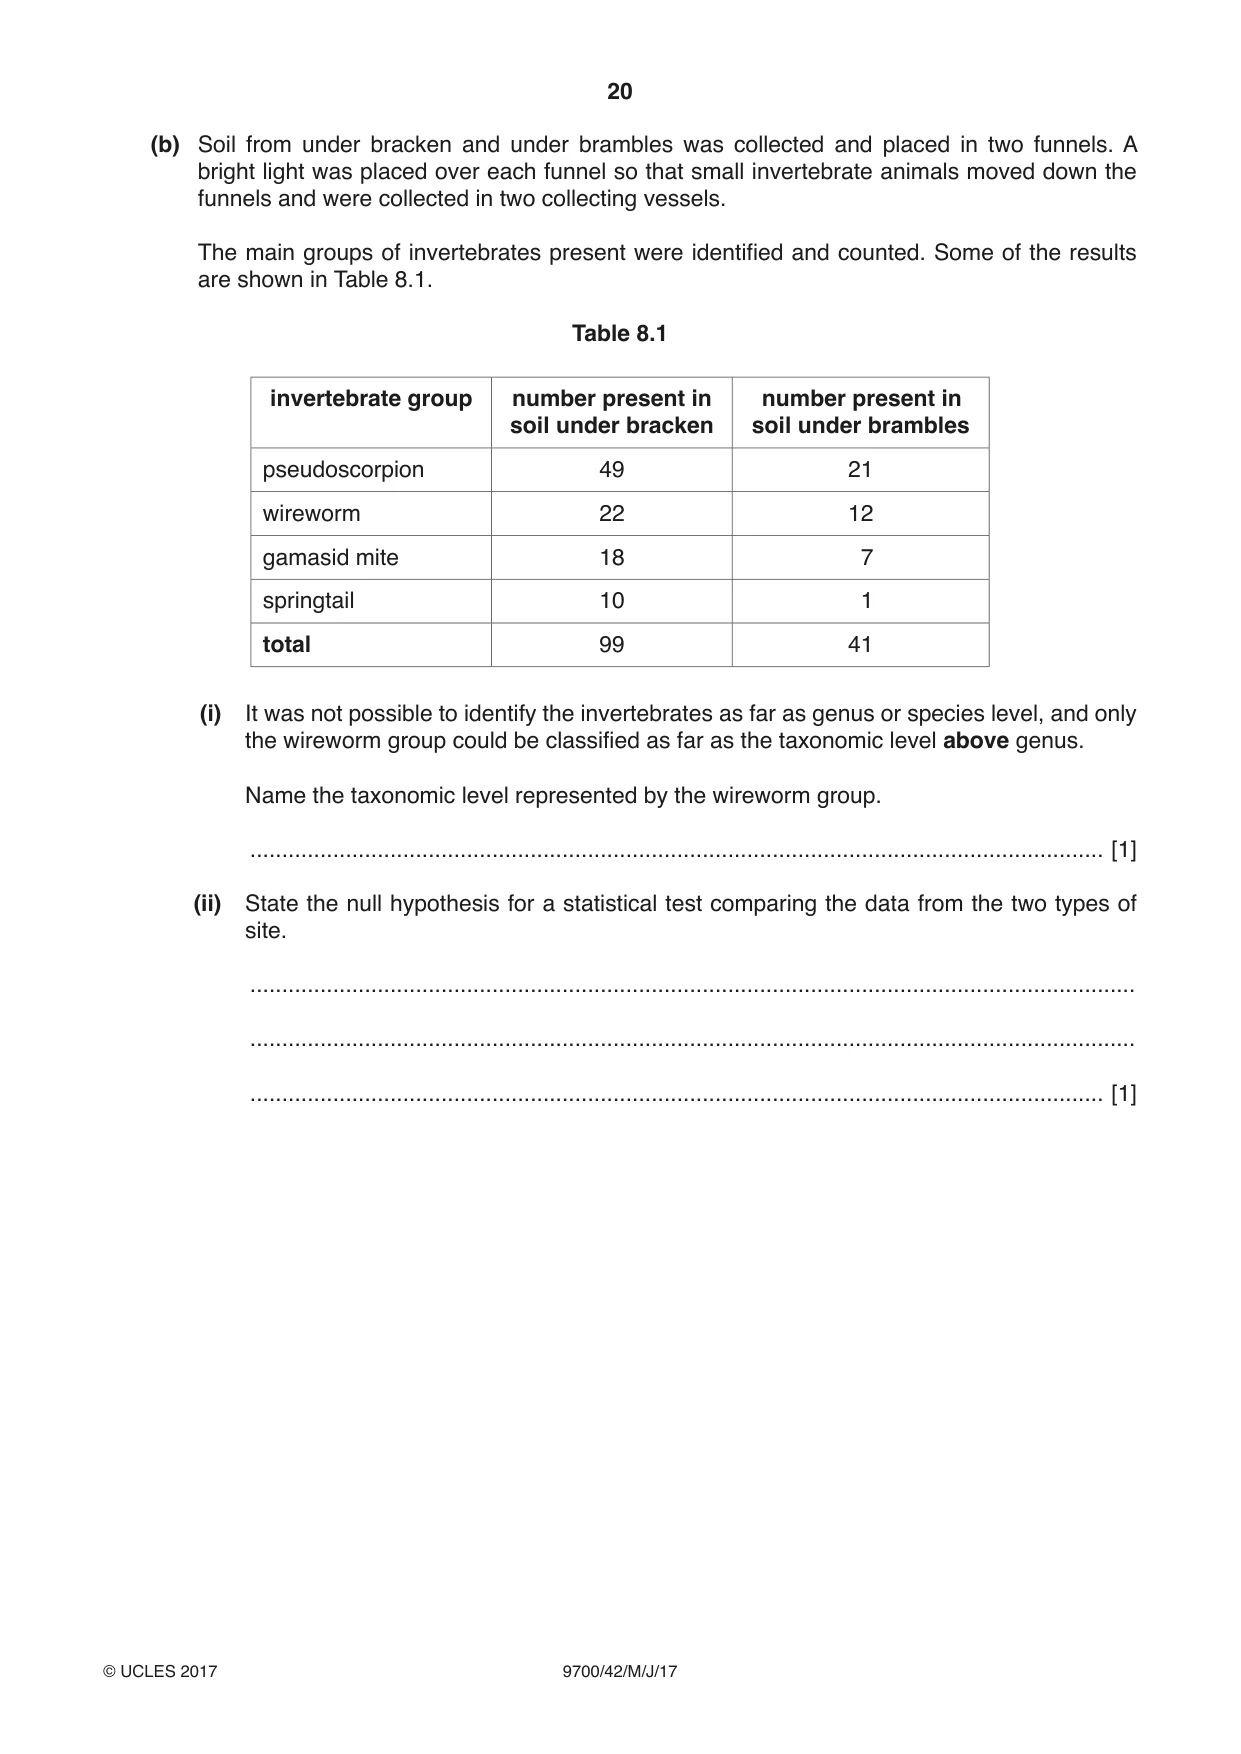
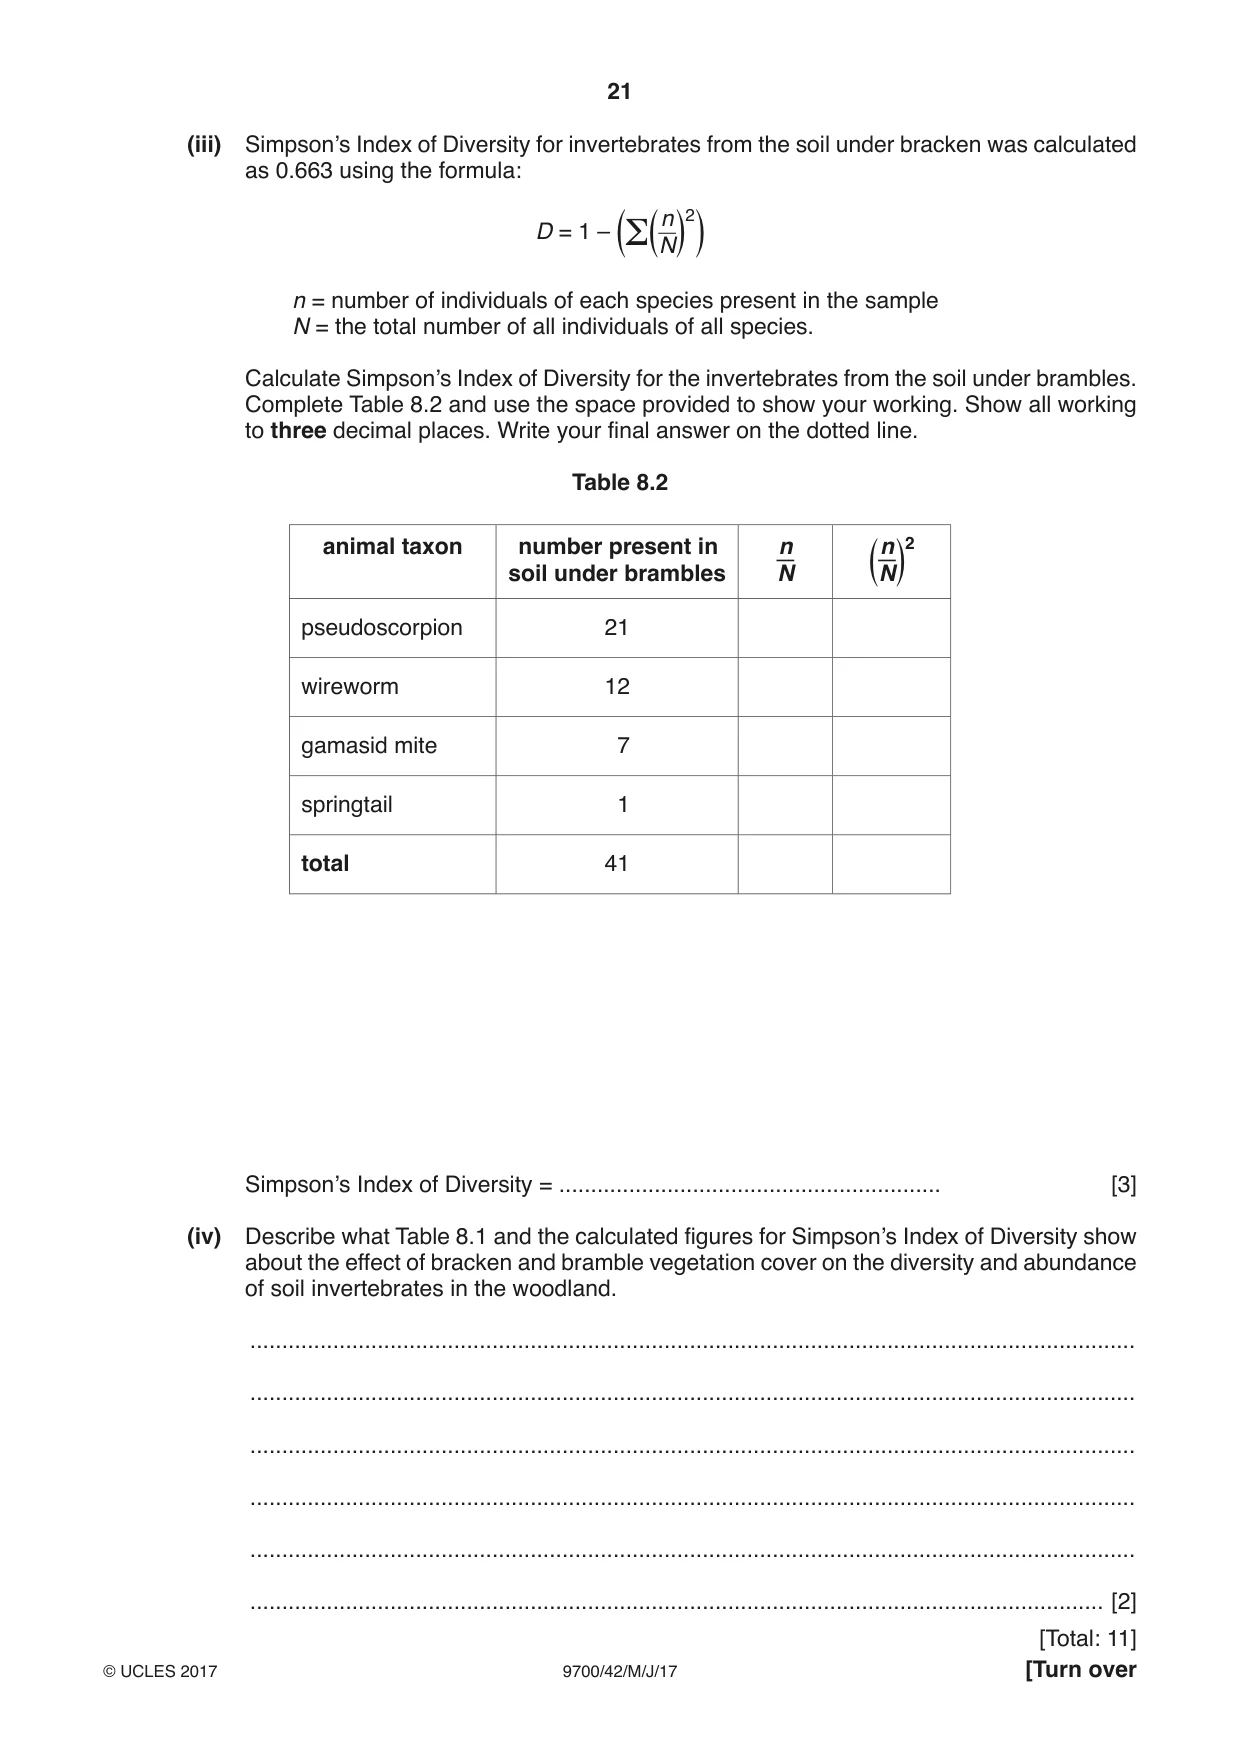
8 An investigation was carried out in a temperate woodland that contained a number of areas with two different types of ground cover vegetation. • On higher ground where the soil was drier, the dominant ground cover plant was bracken, Pteridium aquilinum. • On lower ground where the soil was wetter, the dominant ground cover plant was bramble, Rubus fruticosus. (a) Describe how the abundance of the two plant species at higher and lower ground sites could be measured. ................................................................................................................................................... ................................................................................................................................................... ................................................................................................................................................... ................................................................................................................................................... ................................................................................................................................................... ................................................................................................................................................... ................................................................................................................................................... ................................................................................................................................................... ................................................................................................................................................... ................................................................................................................................................... .............................................................................................................................................. [4] (b) Soil from under bracken and under brambles was collected and placed in two funnels. A bright light was placed over each funnel so that small invertebrate animals moved down the funnels and were collected in two collecting vessels. The main groups of invertebrates present were identified and counted. Some of the results are shown in Table 8.1. Table 8.1 invertebrate group number present in number present in soil under bracken soil under brambles pseudoscorpion 49 21 wireworm 22 12 gamasid mite 18 7 springtail 10 1 total 99 41 (i) It was not possible to identify the invertebrates as far as genus or species level, and only the wireworm group could be classified as far as the taxonomic level above genus. Name the taxonomic level represented by the wireworm group. ...................................................................................................................................... [1] (ii) State the null hypothesis for a statistical test comparing the data from the two types of site. ........................................................................................................................................... ........................................................................................................................................... ...................................................................................................................................... [1] (iii) Simpson’s Index of Diversity for invertebrates from the soil under bracken was calculated as 0.663 using the formula: n D = 1 – Σ N2 n = number of individuals of each species present in the sample N = the total number of all individuals of all species. Calculate Simpson’s Index of Diversity for the invertebrates from the soil under brambles. Complete Table 8.2 and use the space provided to show your working. Show all working to three decimal places. Write your final answer on the dotted line. Table 8.2 animal taxon number present in n n 2 soil under brambles N N pseudoscorpion 21 wireworm 12 gamasid mite 7 springtail 1 total 41 Simpson’s Index of Diversity = ............................................................ [3] (iv) Describe what Table 8.1 and the calculated figures for Simpson’s Index of Diversity show about the effect of bracken and bramble vegetation cover on the diversity and abundance of soil invertebrates in the woodland. ........................................................................................................................................... ........................................................................................................................................... ........................................................................................................................................... ........................................................................................................................................... ........................................................................................................................................... ...................................................................................................................................... [2]
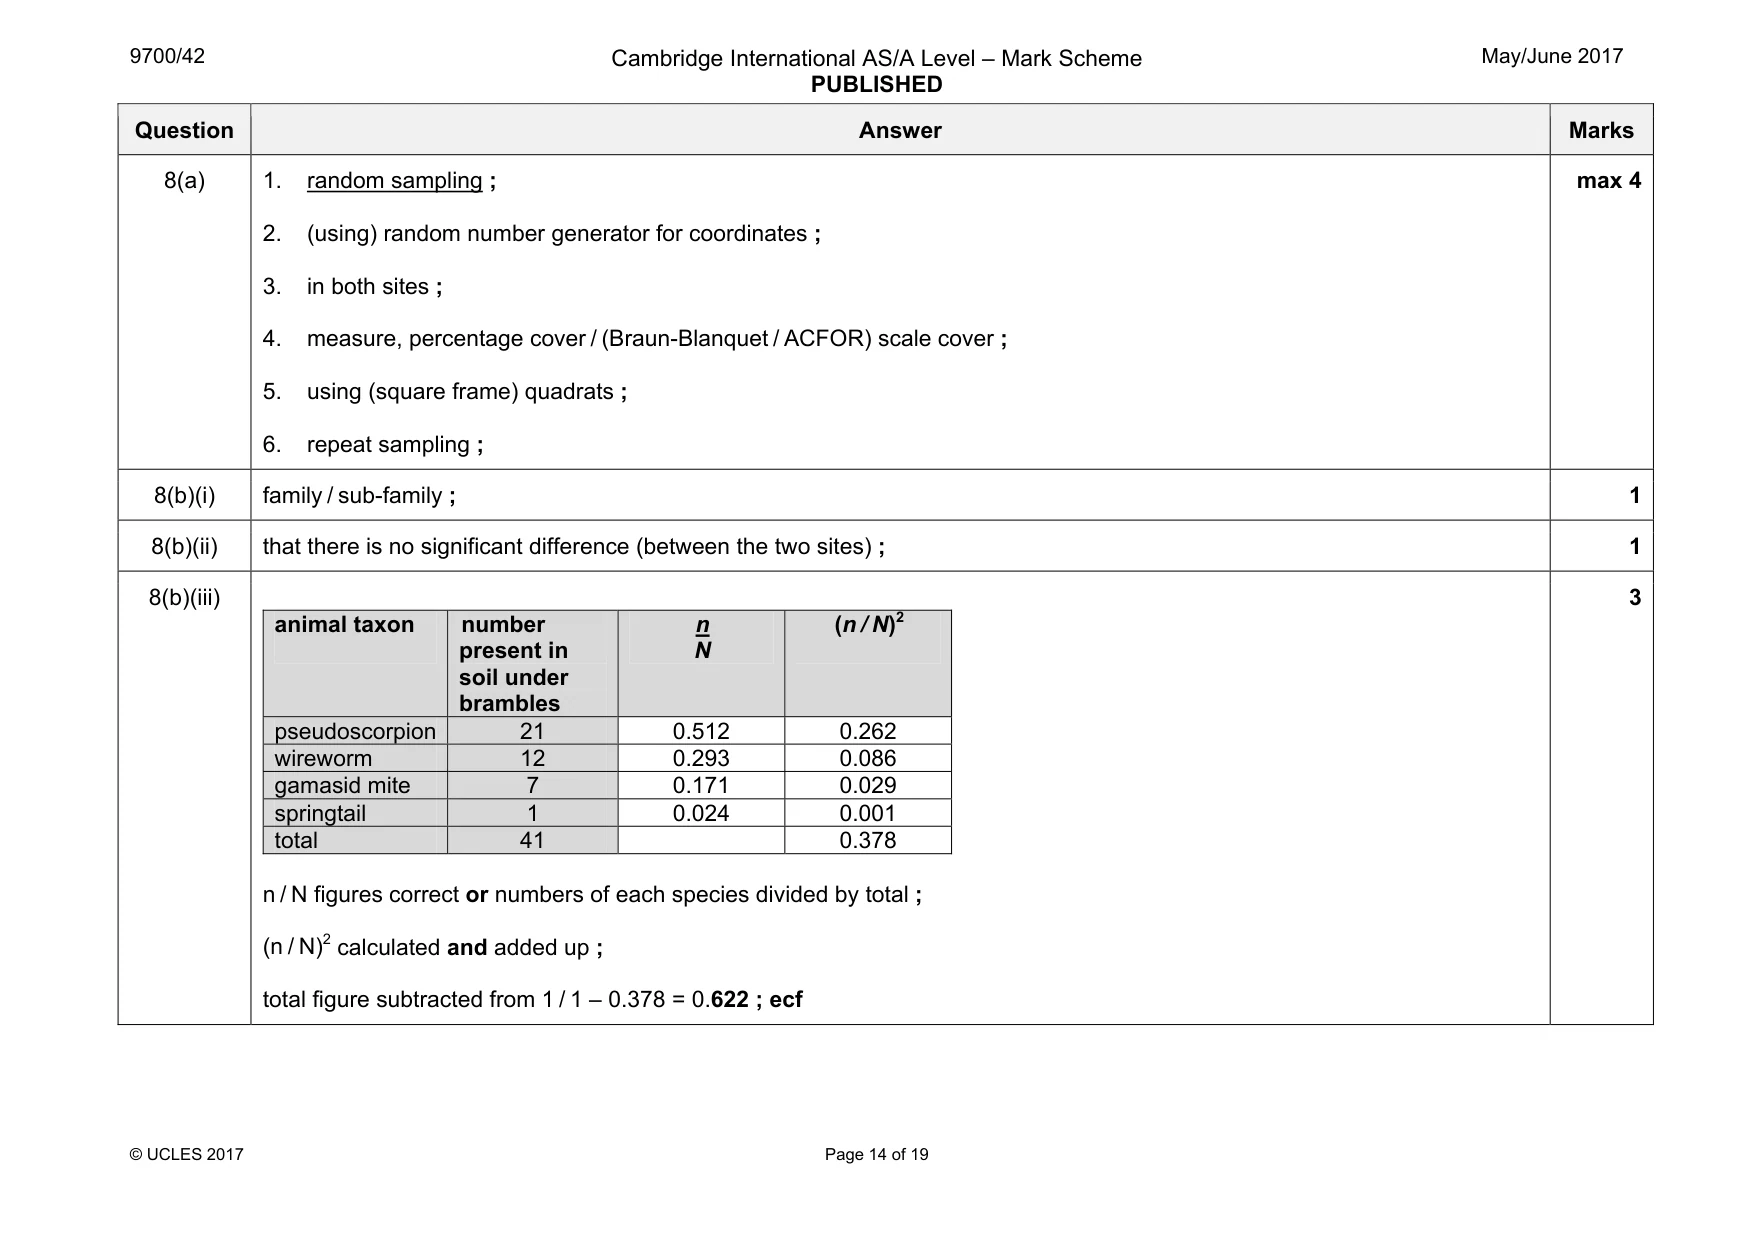
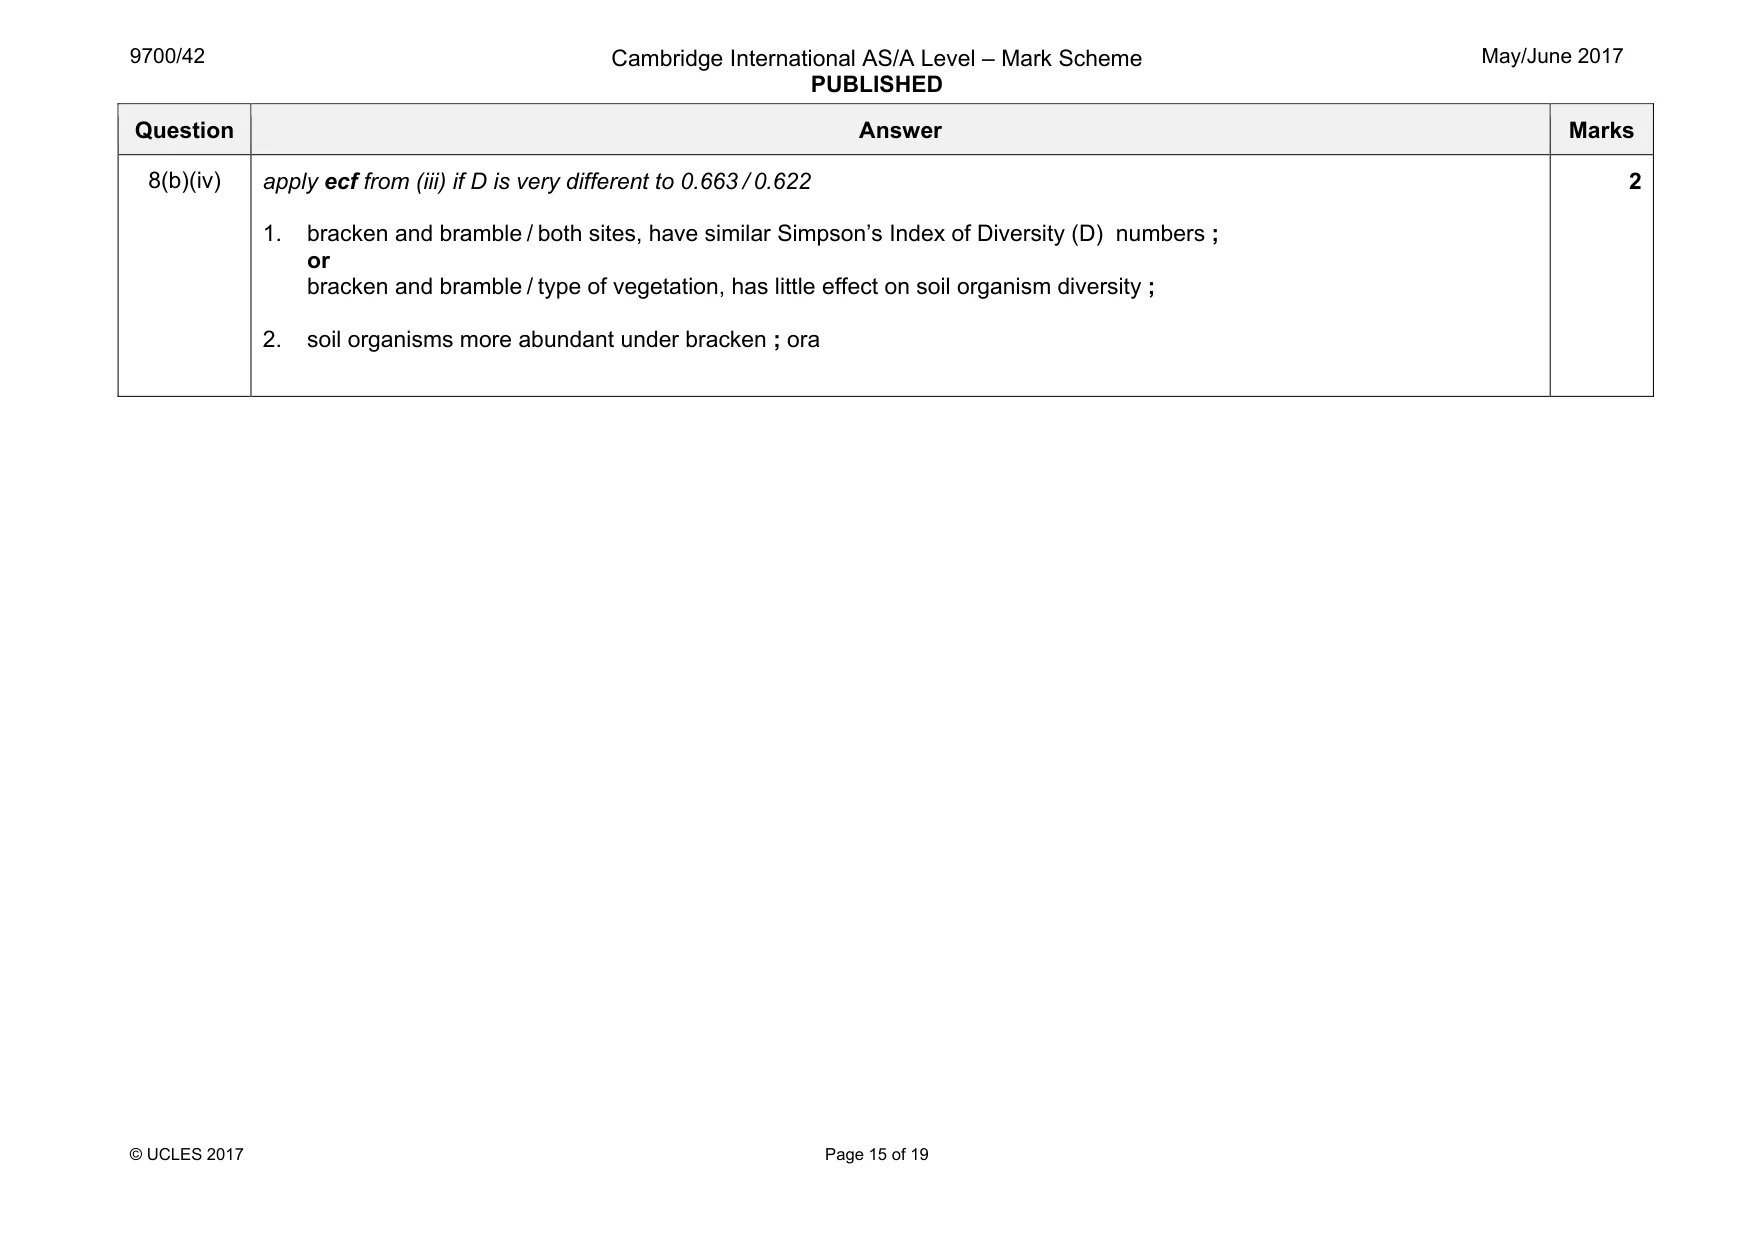
Mark scheme: 8(a) 1. random sampling ; 2. (using) random number generator for coordinates ; 3. in both sites ; 4. measure, percentage cover / (Braun-Blanquet / ACFOR) scale cover ; 5. using (square frame) quadrats ; 6. repeat sampling ; max 4 8(b)(i) family / sub-family ; 1 8(b)(ii) that there is no significant difference (between the two sites) ; 1 8(b)(iii) animal taxon number present in soil under brambles n N (n / N)2 pseudoscorpion 21 0.512 0.262 wireworm 12 0.293 0.086 gamasid mite 7 0.171 0.029 springtail 1 0.024 0.001 total 41 0.378 n / N figures correct or numbers of each species divided by total ; (n / N)2 calculated and added up ; total figure subtracted from 1 / 1 – 0.378 = 0.622 ; ecf 3 Question Answer Marks 8(b)(iv) apply ecf from (iii) if D is very different to 0.663 / 0.622 1. bracken and bramble / both sites, have similar Simpson’s Index of Diversity (D) numbers ; or bracken and bramble / type of vegetation, has little effect on soil organism diversity ; 2. soil organisms more abundant under bracken ; ora 2
Q9 · Explain the mechanism by which guard cells open stomata
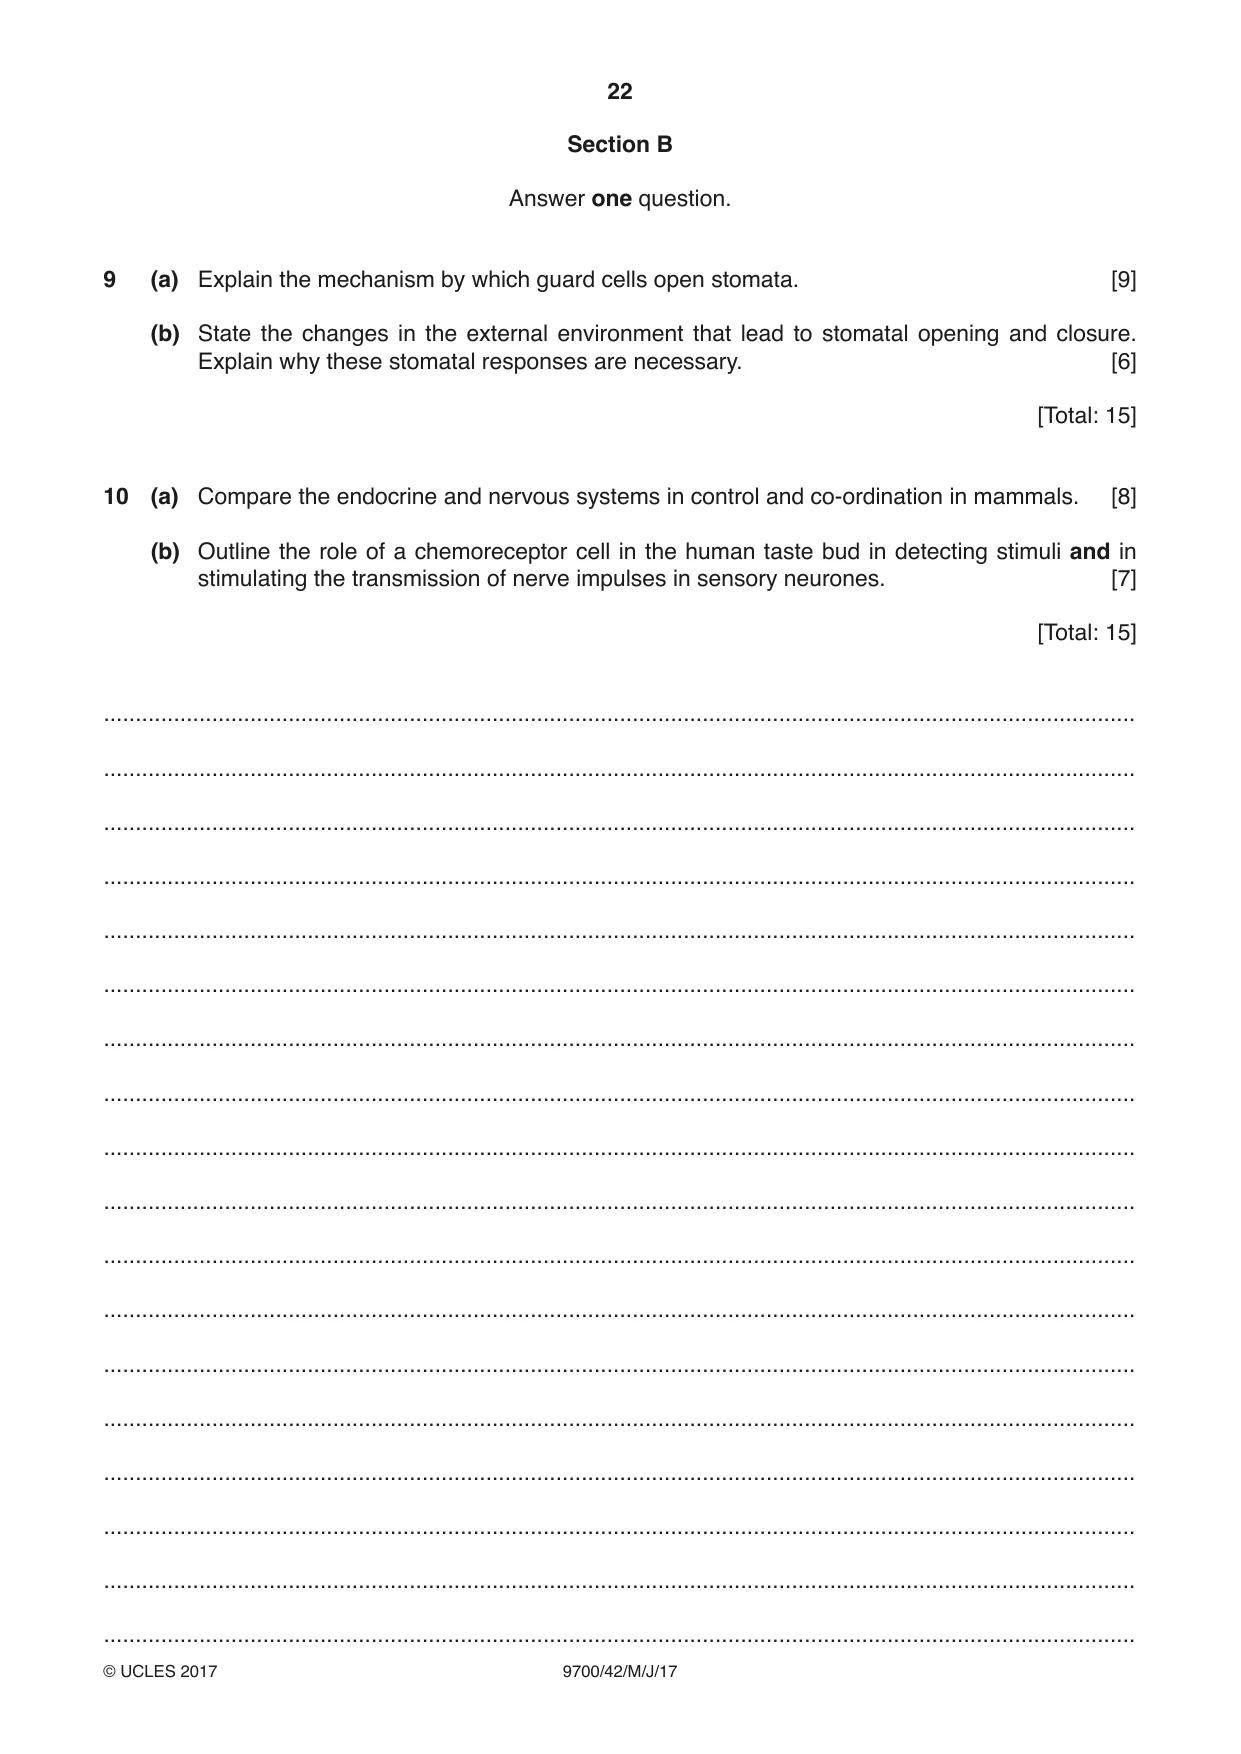
9 (a) Explain the mechanism by which guard cells open stomata. [9] (b) State the changes in the external environment that lead to stomatal opening and closure. Explain why these stomatal responses are necessary. [6] [Total: 15]
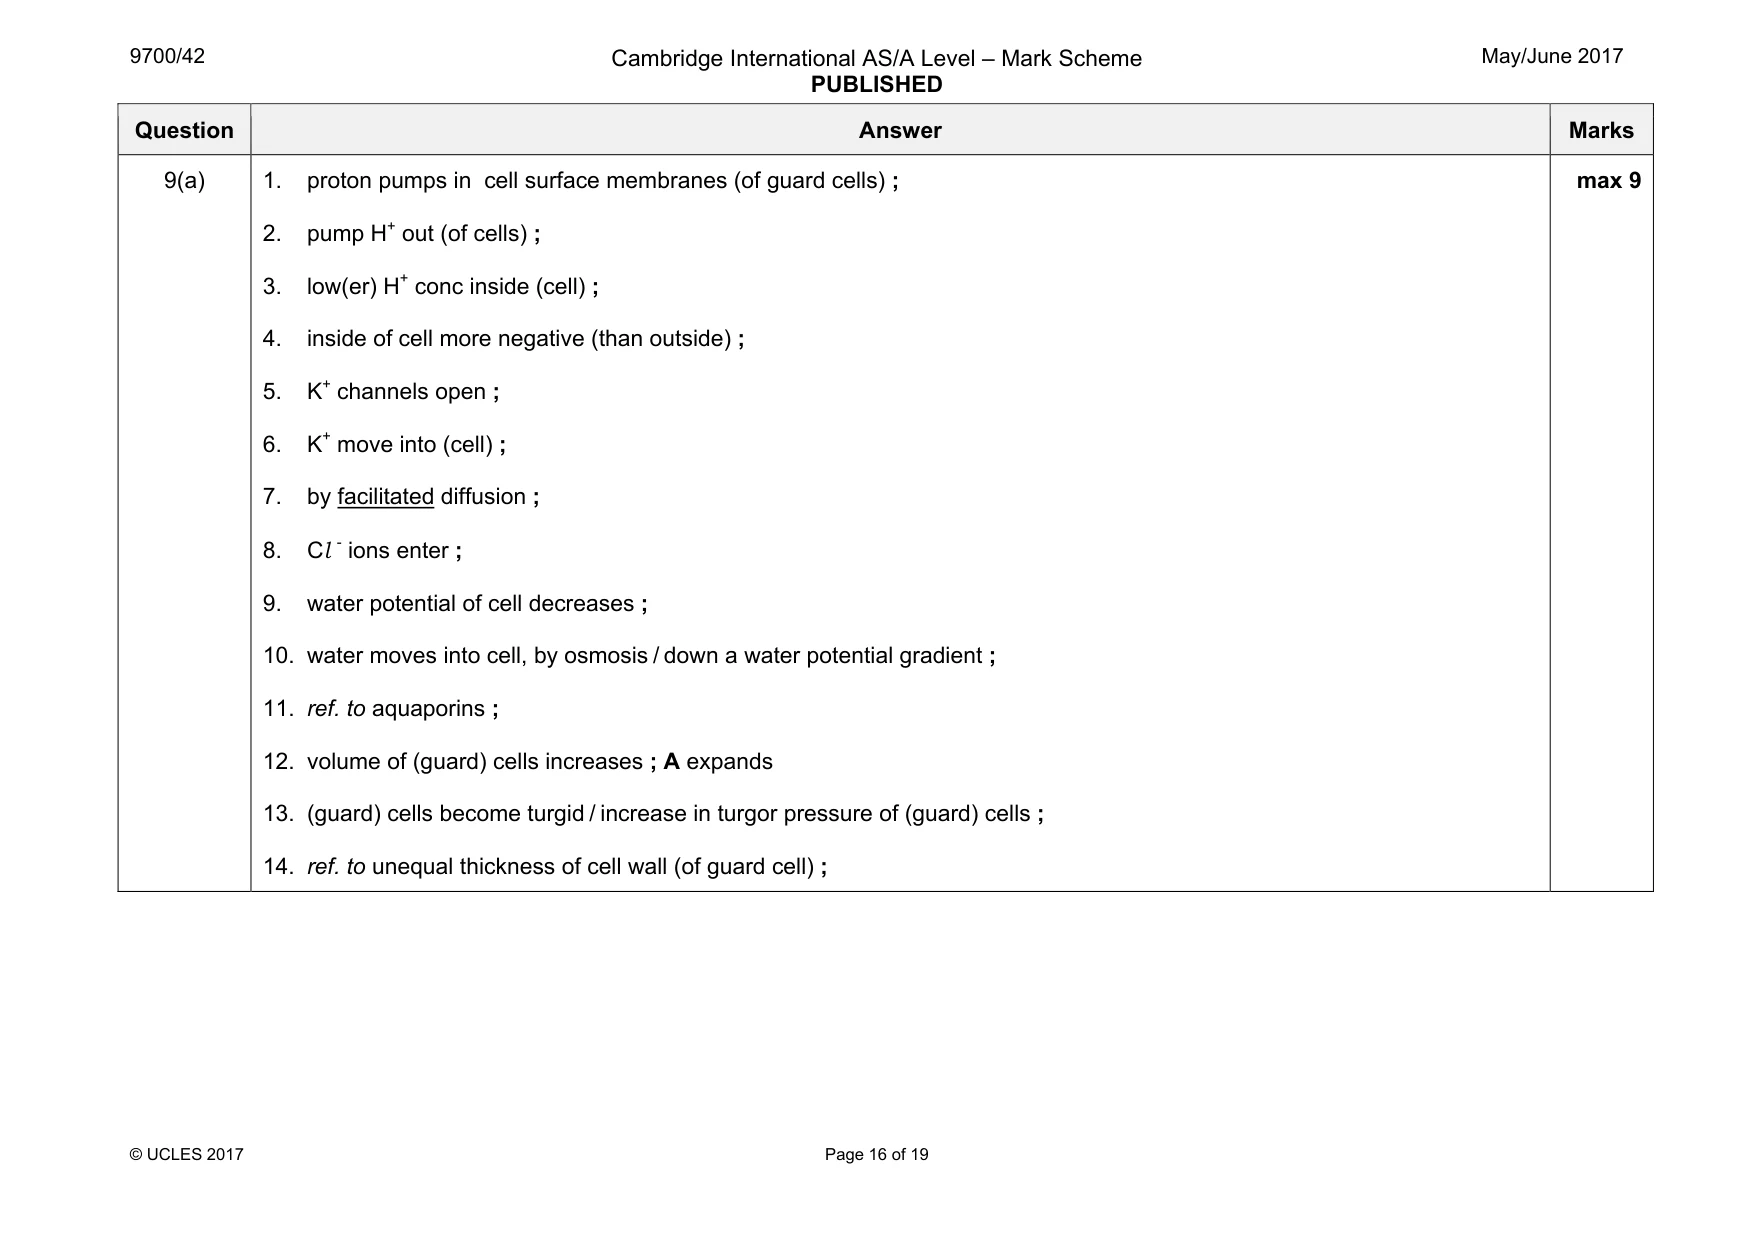
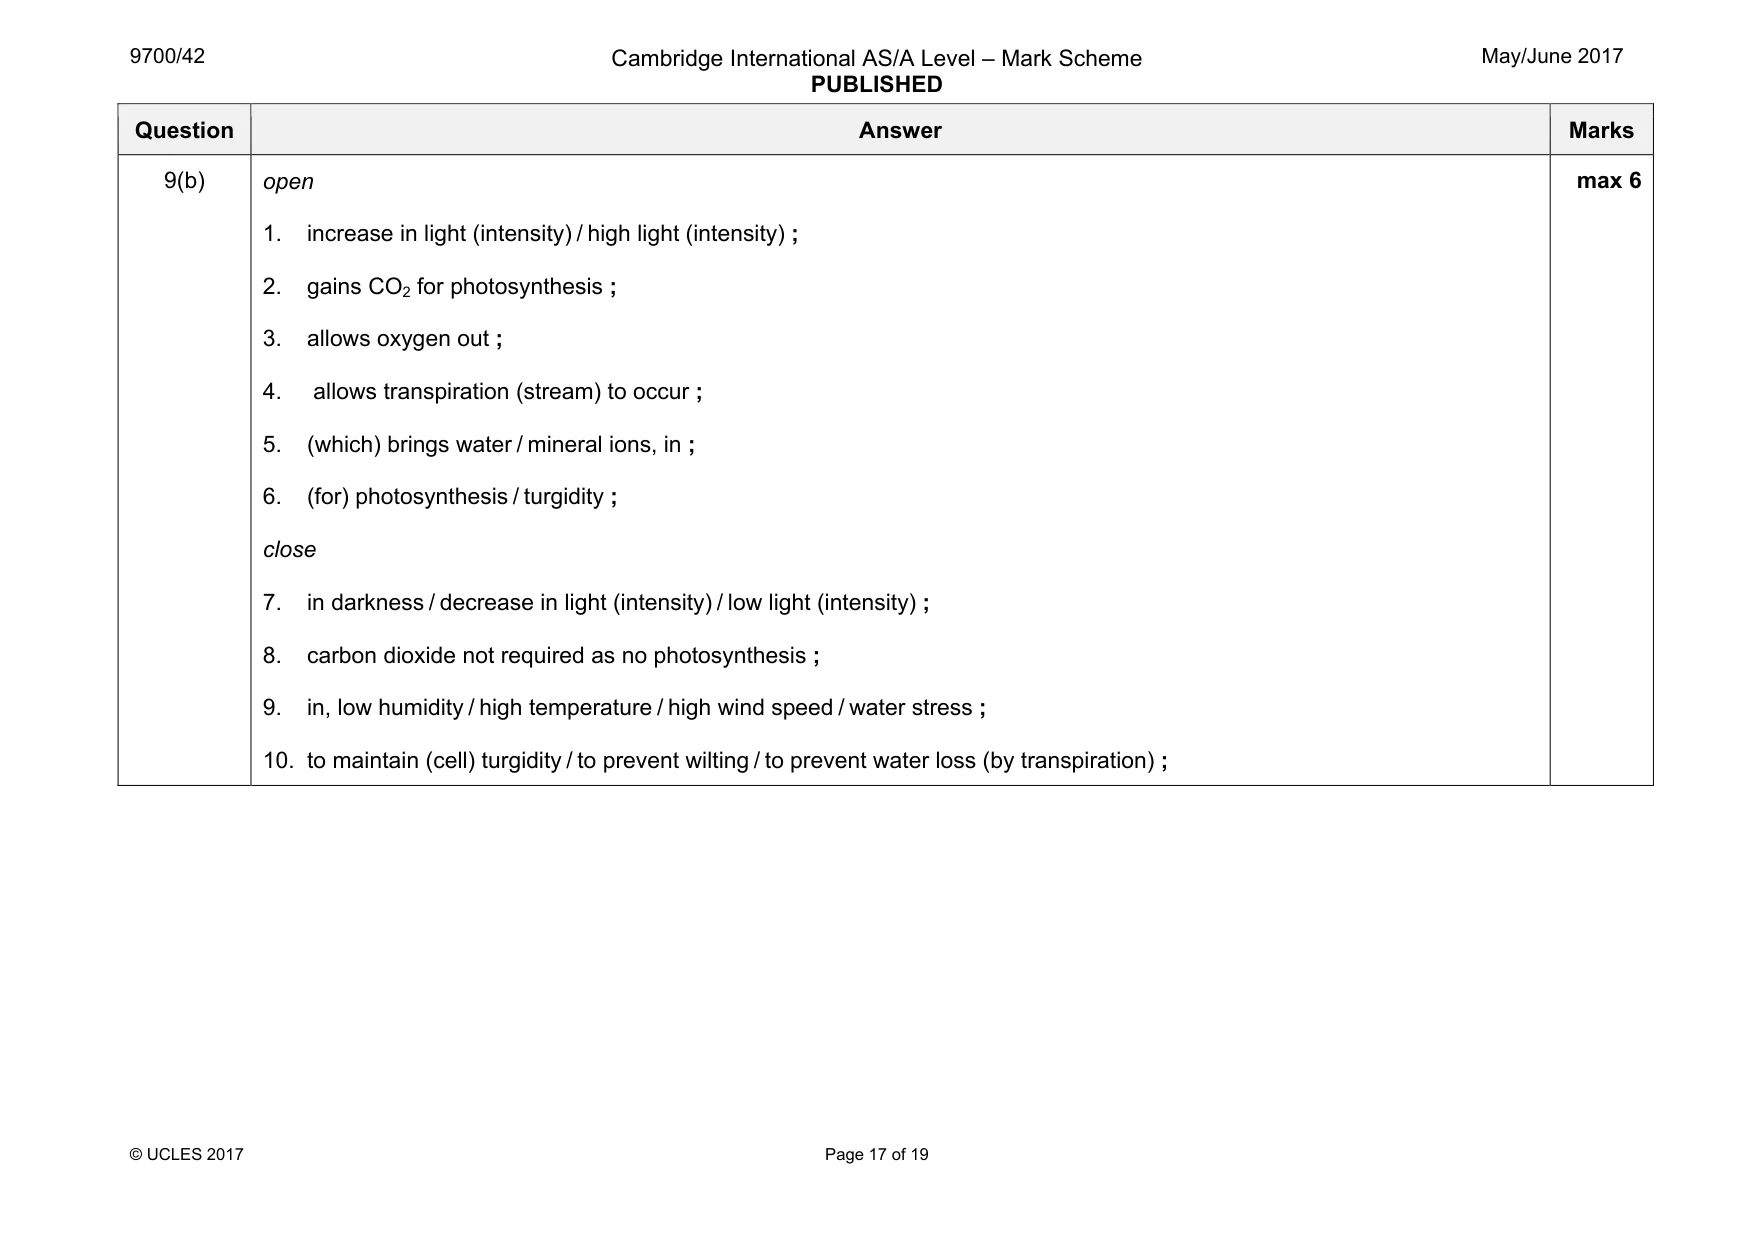
Mark scheme: 9(a) 1. proton pumps in cell surface membranes (of guard cells) ; 2. pump H+ out (of cells) ; 3. low(er) H+ conc inside (cell) ; 4. inside of cell more negative (than outside) ; 5. K+ channels open ; 6. K+ move into (cell) ; 7. by facilitated diffusion ; 8. Cl - ions enter ; 9. water potential of cell decreases ; 10. water moves into cell, by osmosis / down a water potential gradient ; 11. ref. to aquaporins ; 12. volume of (guard) cells increases ; A expands 13. (guard) cells become turgid / increase in turgor pressure of (guard) cells ; 14. ref. to unequal thickness of cell wall (of guard cell) ; max 9 Question Answer Marks 9(b) open 1. increase in light (intensity) / high light (intensity) ; 2. gains CO2 for photosynthesis ; 3. allows oxygen out ; 4. allows transpiration (stream) to occur ; 5. (which) brings water / mineral ions, in ; 6. (for) photosynthesis / turgidity ; close 7. in darkness / decrease in light (intensity) / low light (intensity) ; 8. carbon dioxide not required as no photosynthesis ; 9. in, low humidity / high temperature / high wind speed / water stress ; 10. to maintain (cell) turgidity / to prevent wilting / to prevent water loss (by transpiration) ; max 6
Q10 · Compare the endocrine and nervous systems in control and co-ordination in mammals
10 (a) Compare the endocrine and nervous systems in control and co-ordination in mammals. [8] (b) Outline the role of a chemoreceptor cell in the human taste bud in detecting stimuli and in stimulating the transmission of nerve impulses in sensory neurones. [7] [Total: 15] .................................................................................................................................................................. .................................................................................................................................................................. .................................................................................................................................................................. .................................................................................................................................................................. .................................................................................................................................................................. .................................................................................................................................................................. .................................................................................................................................................................. .................................................................................................................................................................. .................................................................................................................................................................. .................................................................................................................................................................. .................................................................................................................................................................. .................................................................................................................................................................. .................................................................................................................................................................. .................................................................................................................................................................. .................................................................................................................................................................. .................................................................................................................................................................. .................................................................................................................................................................. .................................................................................................................................................................. .................................................................................................................................................................. .................................................................................................................................................................. .................................................................................................................................................................. .................................................................................................................................................................. .................................................................................................................................................................. .................................................................................................................................................................. .................................................................................................................................................................. .................................................................................................................................................................. .................................................................................................................................................................. .................................................................................................................................................................. .................................................................................................................................................................. .................................................................................................................................................................. .................................................................................................................................................................. .................................................................................................................................................................. .................................................................................................................................................................. .................................................................................................................................................................. .................................................................................................................................................................. .................................................................................................................................................................. .................................................................................................................................................................. .................................................................................................................................................................. .................................................................................................................................................................. .................................................................................................................................................................. .................................................................................................................................................................. .................................................................................................................................................................. .................................................................................................................................................................. .................................................................................................................................................................. .................................................................................................................................................................. .................................................................................................................................................................. .................................................................................................................................................................. .................................................................................................................................................................. .................................................................................................................................................................. .................................................................................................................................................................. .................................................................................................................................................................. .................................................................................................................................................................. .................................................................................................................................................................. .................................................................................................................................................................. .................................................................................................................................................................. .................................................................................................................................................................. .................................................................................................................................................................. .................................................................................................................................................................. .................................................................................................................................................................. .................................................................................................................................................................. .................................................................................................................................................................. .................................................................................................................................................................. .................................................................................................................................................................. .................................................................................................................................................................. .................................................................................................................................................................. .................................................................................................................................................................. .................................................................................................................................................................. .................................................................................................................................................................. .................................................................................................................................................................. ..................................................................................................................................................................
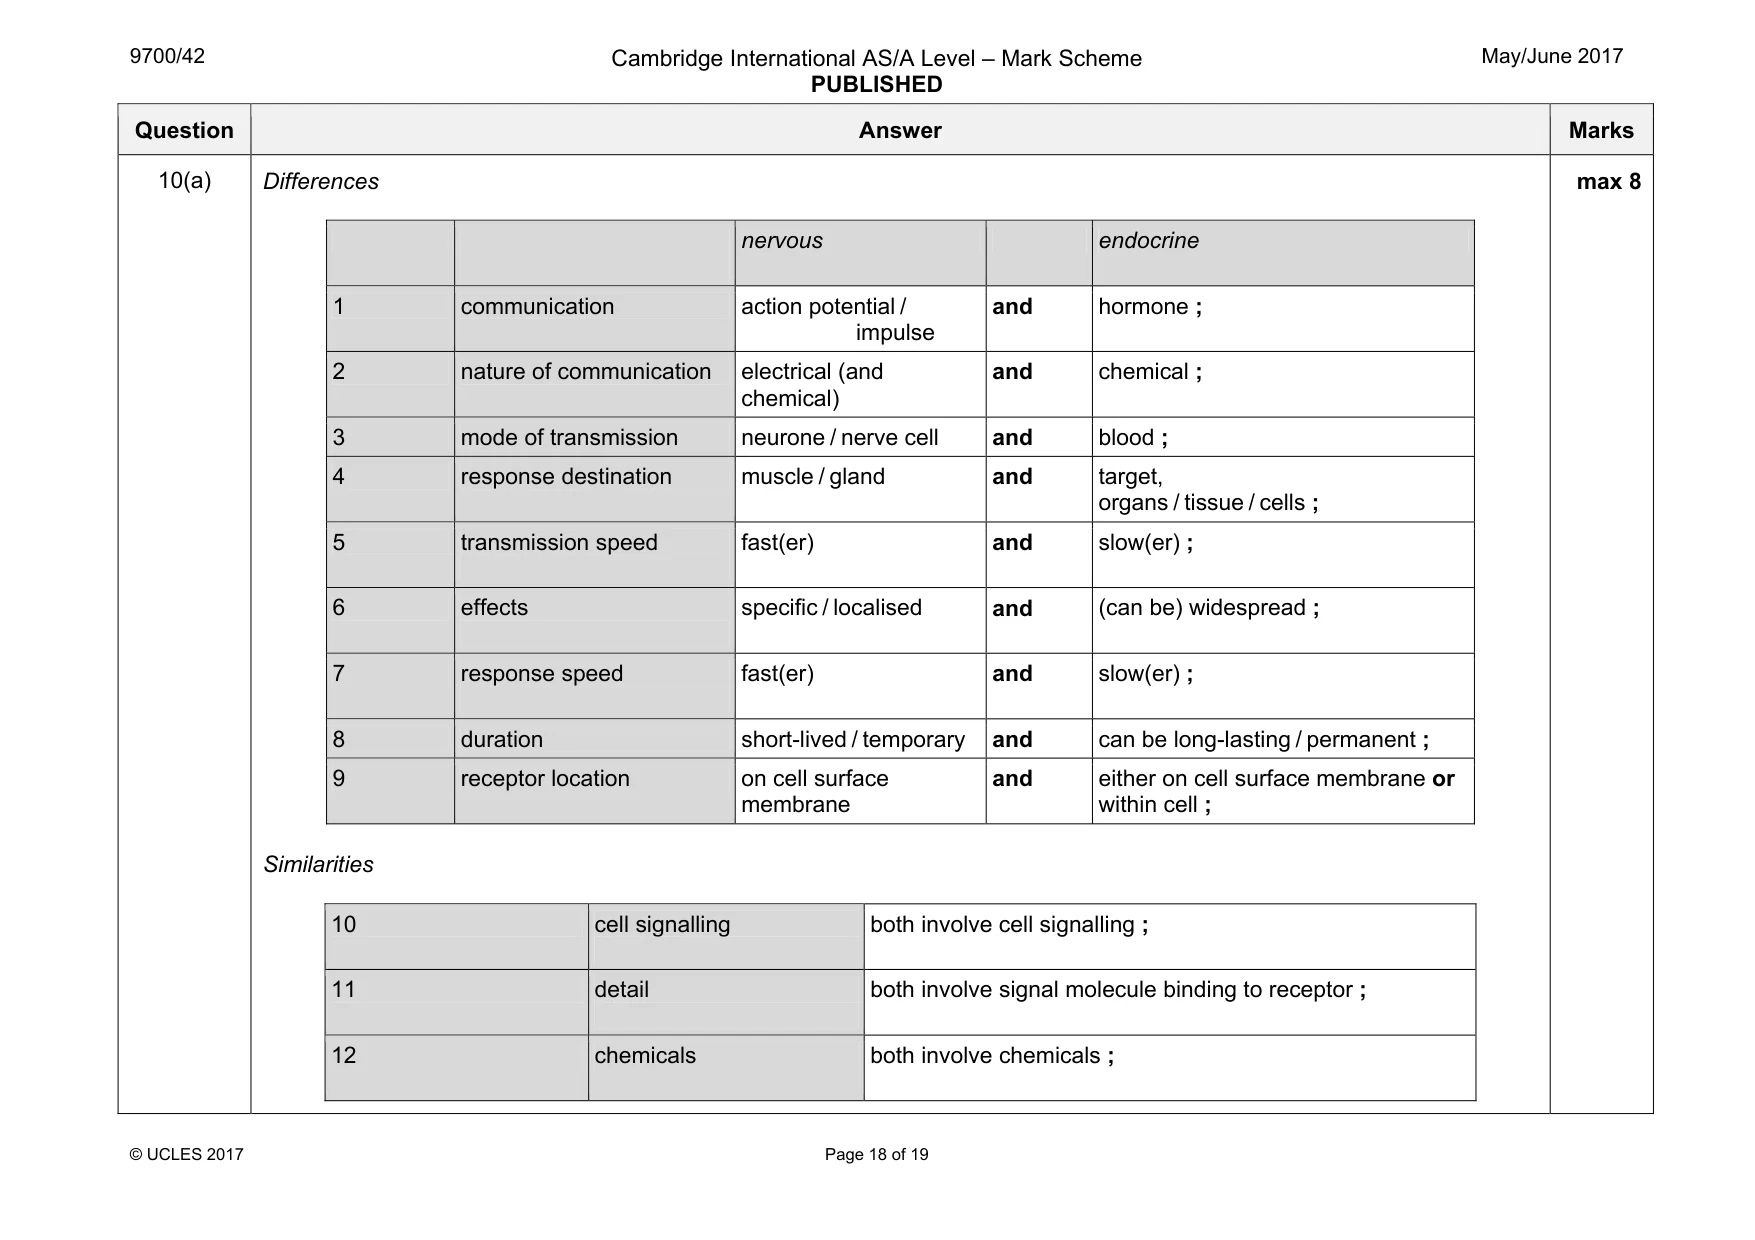
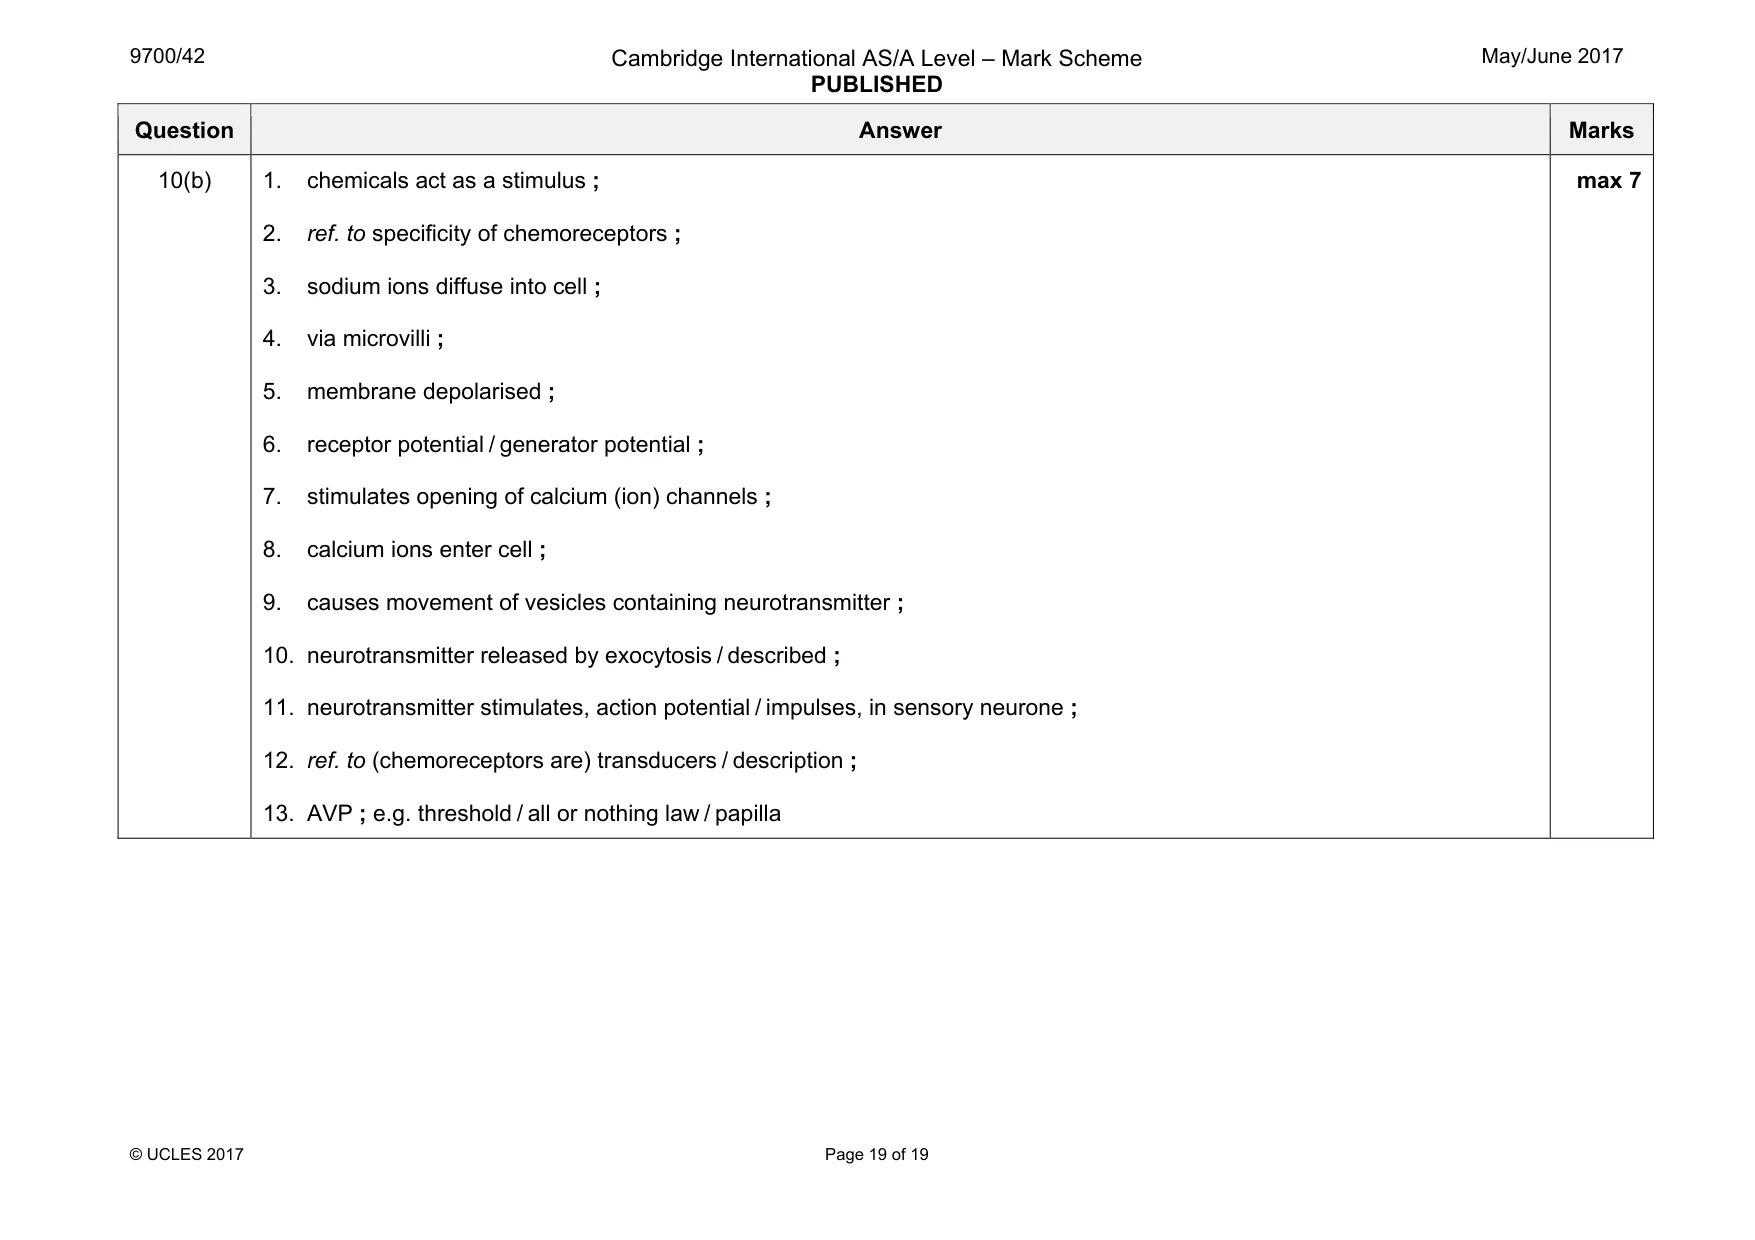
Mark scheme: 10(a) Differences nervous endocrine 1 communication action potential / impulse and hormone ; 2 nature of communication electrical (and chemical) and chemical ; 3 mode of transmission neurone / nerve cell and blood ; 4 response destination muscle / gland and target, organs / tissue / cells ; 5 transmission speed fast(er) and slow(er) ; 6 effects specific / localised and (can be) widespread ; 7 response speed fast(er) and slow(er) ; 8 duration short-lived / temporary and can be long-lasting / permanent ; 9 receptor location on cell surface membrane and either on cell surface membrane or within cell ; Similarities 10 cell signalling both involve cell signalling ; 11 detail both involve signal molecule binding to receptor ; 12 chemicals both involve chemicals ; max 8 Question Answer Marks 10(b) 1. chemicals act as a stimulus ; 2. ref. to specificity of chemoreceptors ; 3. sodium ions diffuse into cell ; 4. via microvilli ; 5. membrane depolarised ; 6. receptor potential / generator potential ; 7. stimulates opening of calcium (ion) channels ; 8. calcium ions enter cell ; 9. causes movement of vesicles containing neurotransmitter ; 10. neurotransmitter released by exocytosis / described ; 11. neurotransmitter stimulates, action potential / impulses, in sensory neurone ; 12. ref. to (chemoreceptors are) transducers / description ; 13. AVP ; e.g. threshold / all or nothing law / papilla max 7
What was in this paper
The subtopics covered by these 10 questions, and how many questions each got. Open one in a new tab to see every Cambridge question on it.
What you needed in this session
Cambridge’s own grade thresholds for 2017 May/June, Paper 4 · Variant 2. A higher threshold means an easier paper — the bar moves with how the cohort did.