Cambridge A Level Biology 9700 — 2015 May/June Paper 5 · Variant 2
9700/52/M/J/15 · 30 marks · ≈34 min
The question paper and its mark scheme, free to read here and free to download. This is Cambridge’s own paper, exactly as it was sat.
Question paper8 pages
Mark scheme8 pages
Answers below. Sit the paper first if you are practising.
Paper as text
Question paper, page 1
This document consists of 8 printed pages. DC (ST/SW) 90190/5 © UCLES 2015 [Turn over Cambridge International Examinations Cambridge International Advanced Level * 3 2 5 5 9 4 4 2 1 1 * BIOLOGY 9700/52 Paper 5 Planning, Analysis and Evaluation May/June 2015 1 hour 15 minutes Candidates answer on the Question Paper. No Additional Materials are required. READ THESE INSTRUCTIONS FIRST Write your Centre number, candidate number and name on all the work you hand in. Write in dark blue or black pen. You may use a soft pencil for any diagrams, graphs or rough working. Do not use staples, paper clips, glue or correction fluid. DO NOT WRITE IN ANY BARCODES. Answer all questions. Electronic calculators may be used. At the end of the examination, fasten all your work securely together. The number of marks is given in brackets [ ] at the end of each question or part question.
Question paper, page 2
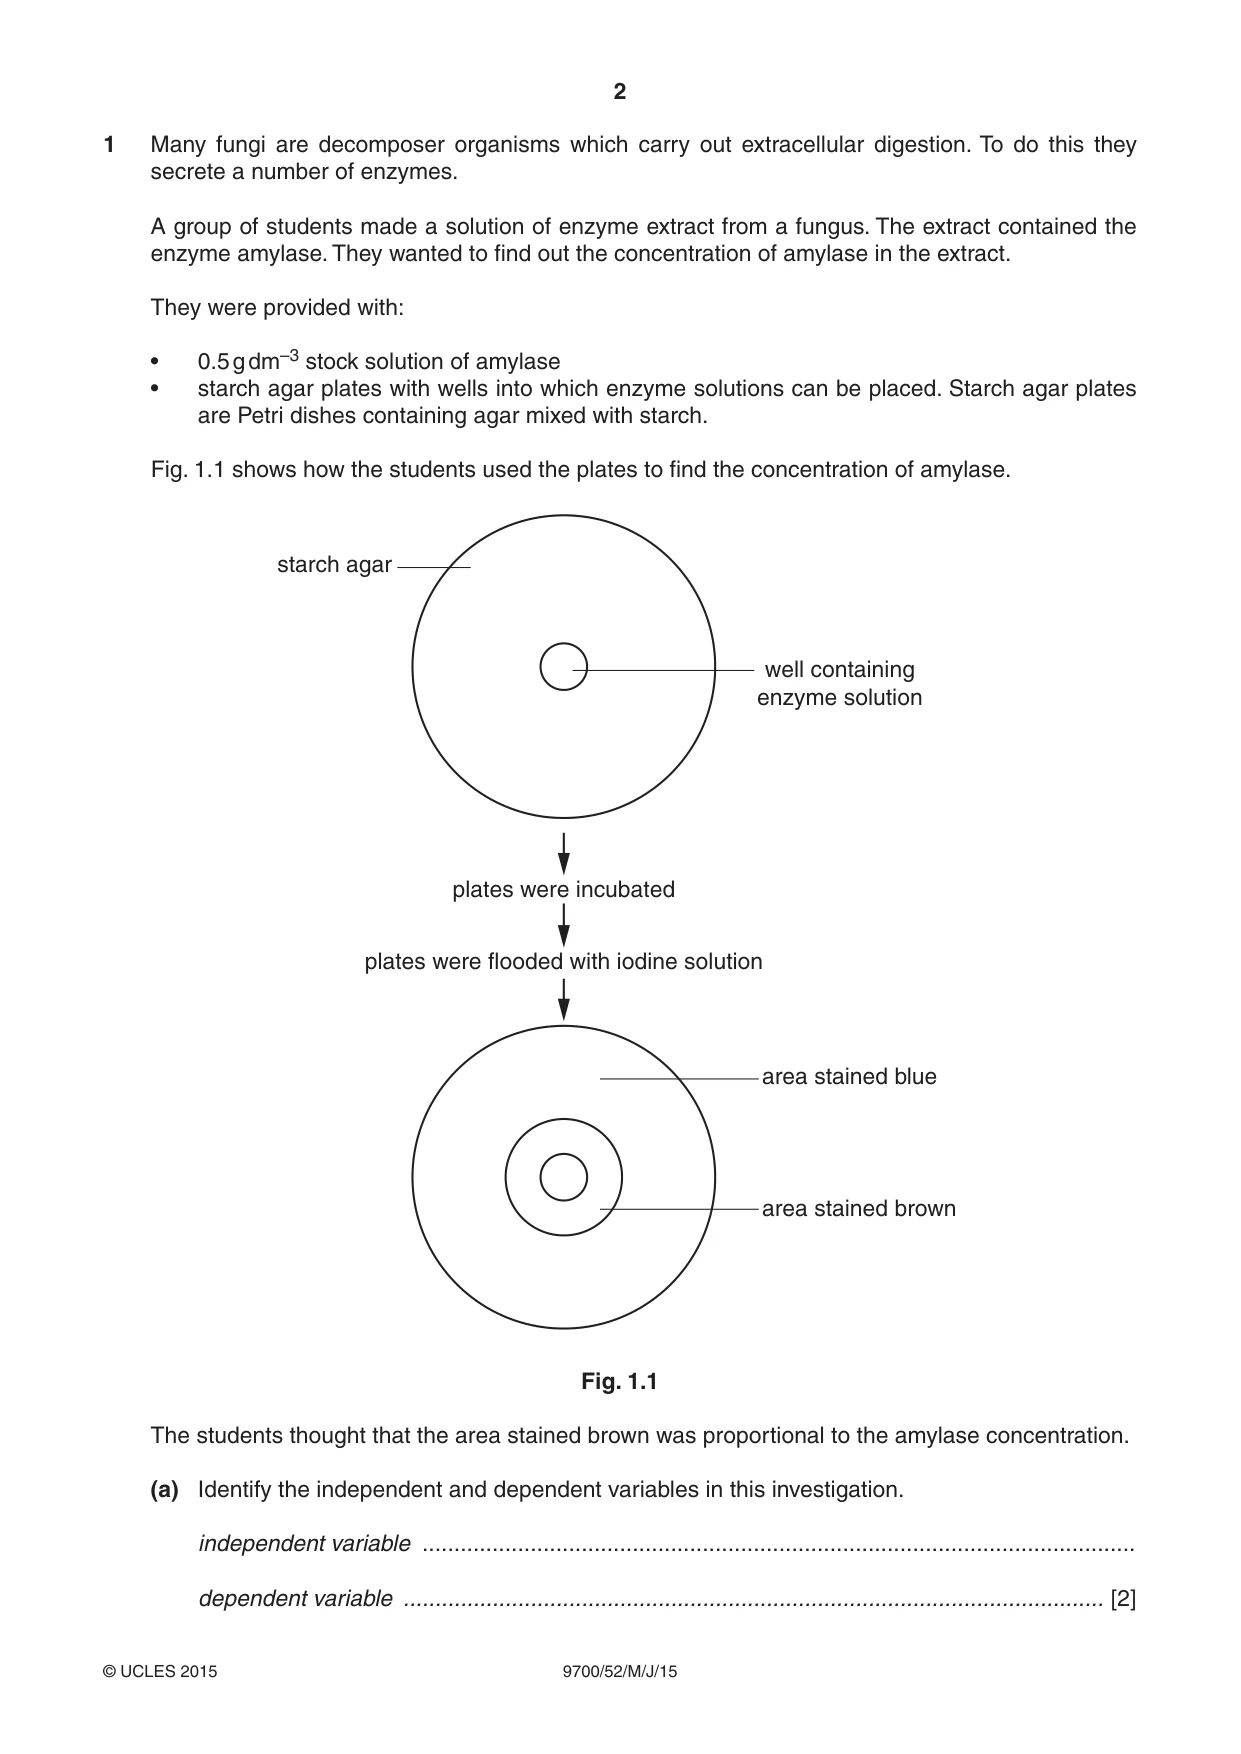
2 9700/52/M/J/15 © UCLES 2015 1 Many fungi are decomposer organisms which carry out extracellular digestion. To do this they secrete a number of enzymes. A group of students made a solution of enzyme extract from a fungus. The extract contained the enzyme amylase. They wanted to find out the concentration of amylase in the extract. They were provided with: • 0.5 g dm–3 stock solution of amylase • starch agar plates with wells into which enzyme solutions can be placed. Starch agar plates are Petri dishes containing agar mixed with starch. Fig. 1.1 shows how the students used the plates to find the concentration of amylase. plates were incubated starch agar well containing enzyme solution plates were flooded with iodine solution area stained brown area stained blue Fig. 1.1 The students thought that the area stained brown was proportional to the amylase concentration. (a) Identify the independent and dependent variables in this investigation. independent variable … dependent variable … [2]
Question paper, page 3
3 9700/52/M/J/15 © UCLES 2015 [Turn over (b) Describe how the students could use the method outlined in Fig. 1.1 to find out the concentration of the enzyme amylase in their extract. Your method should be detailed enough for another person to follow. … … … … … … … … … … … … … … … … … … … … … … … … … [8]
Question paper, page 4
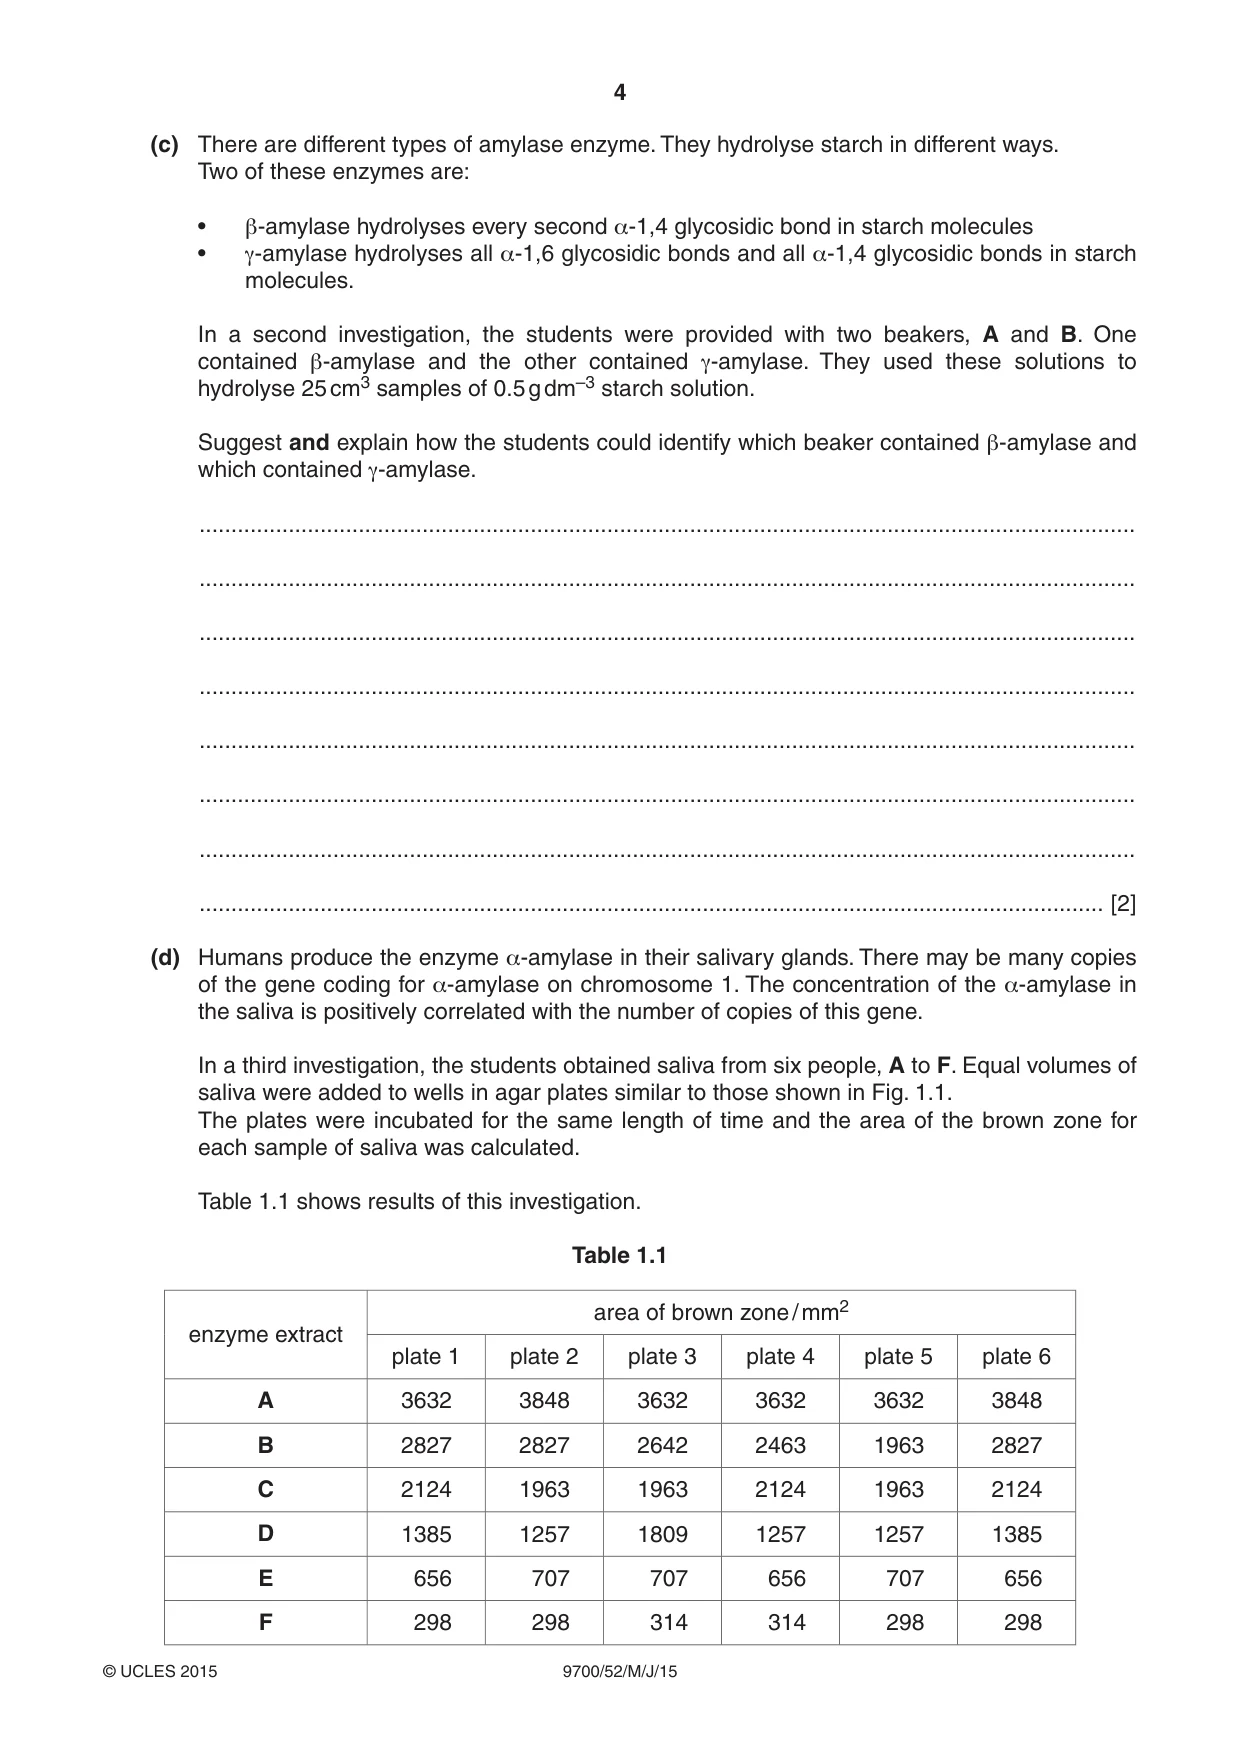
4 9700/52/M/J/15 © UCLES 2015 (c) There are different types of amylase enzyme. They hydrolyse starch in different ways. Two of these enzymes are: • β-amylase hydrolyses every second α-1,4 glycosidic bond in starch molecules • γ-amylase hydrolyses all α-1,6 glycosidic bonds and all α-1,4 glycosidic bonds in starch molecules. In a second investigation, the students were provided with two beakers, A and B. One contained β-amylase and the other contained γ-amylase. They used these solutions to hydrolyse 25 cm3 samples of 0.5 g dm–3 starch solution. Suggest and explain how the students could identify which beaker contained β-amylase and which contained γ-amylase. … … … … … … … … [2] (d) Humans produce the enzyme α-amylase in their salivary glands. There may be many copies of the gene coding for α-amylase on chromosome 1. The concentration of the α-amylase in the saliva is positively correlated with the number of copies of this gene. In a third investigation, the students obtained saliva from six people, A to F. Equal volumes of saliva were added to wells in agar plates similar to those shown in Fig. 1.1. The plates were incubated for the same length of time and the area of the brown zone for each sample of saliva was calculated. Table 1.1 shows results of this investigation. Table 1.1 enzyme extract area of brown zone / mm2 plate 1 plate 2 plate 3 plate 4 plate 5 plate 6 A 3632 3848 3632 3632 3632 3848 B 2827 2827 2642 2463 1963 2827 C 2124 1963 1963 2124 1963 2124 D 1385 1257 1809 1257 1257 1385 E 656 707 707 656 707 656 F 298 298 314 314 298 298
Question paper, page 5
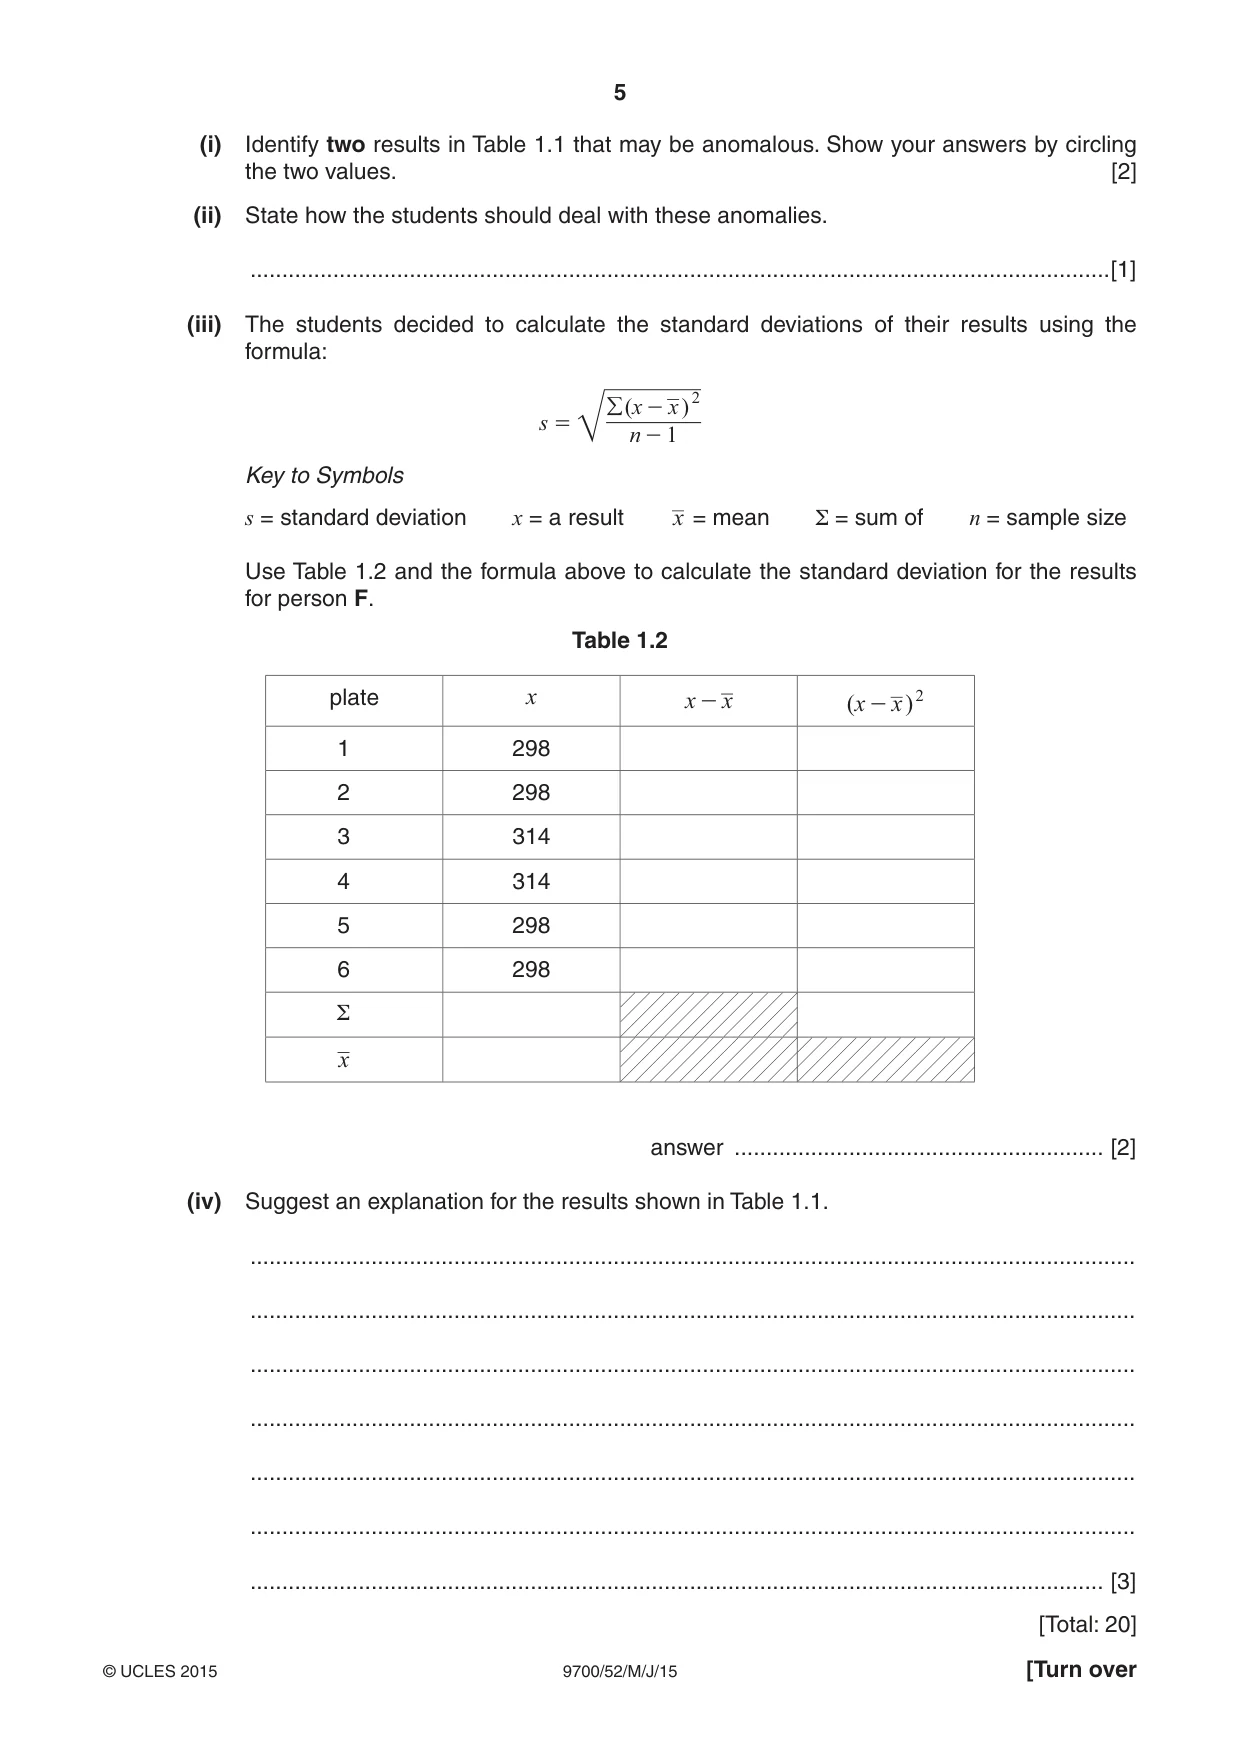
5 9700/52/M/J/15 © UCLES 2015 [Turn over (i) Identify two results in Table 1.1 that may be anomalous. Show your answers by circling the two values. [2] (ii) State how the students should deal with these anomalies. …[1] (iii) The students decided to calculate the standard deviations of their results using the formula: ( ) s n x x 1 2 = - - / Key to Symbols s = standard deviation x = a result x = mean Σ = sum of n = sample size Use Table 1.2 and the formula above to calculate the standard deviation for the results for person F. Table 1.2 plate x x x - ( ) x x 2 - 1 298 2 298 3 314 4 314 5 298 6 298 Σ x answer … [2] (iv) Suggest an explanation for the results shown in Table 1.1. … … … … … … … [3] [Total: 20]
Question paper, page 6
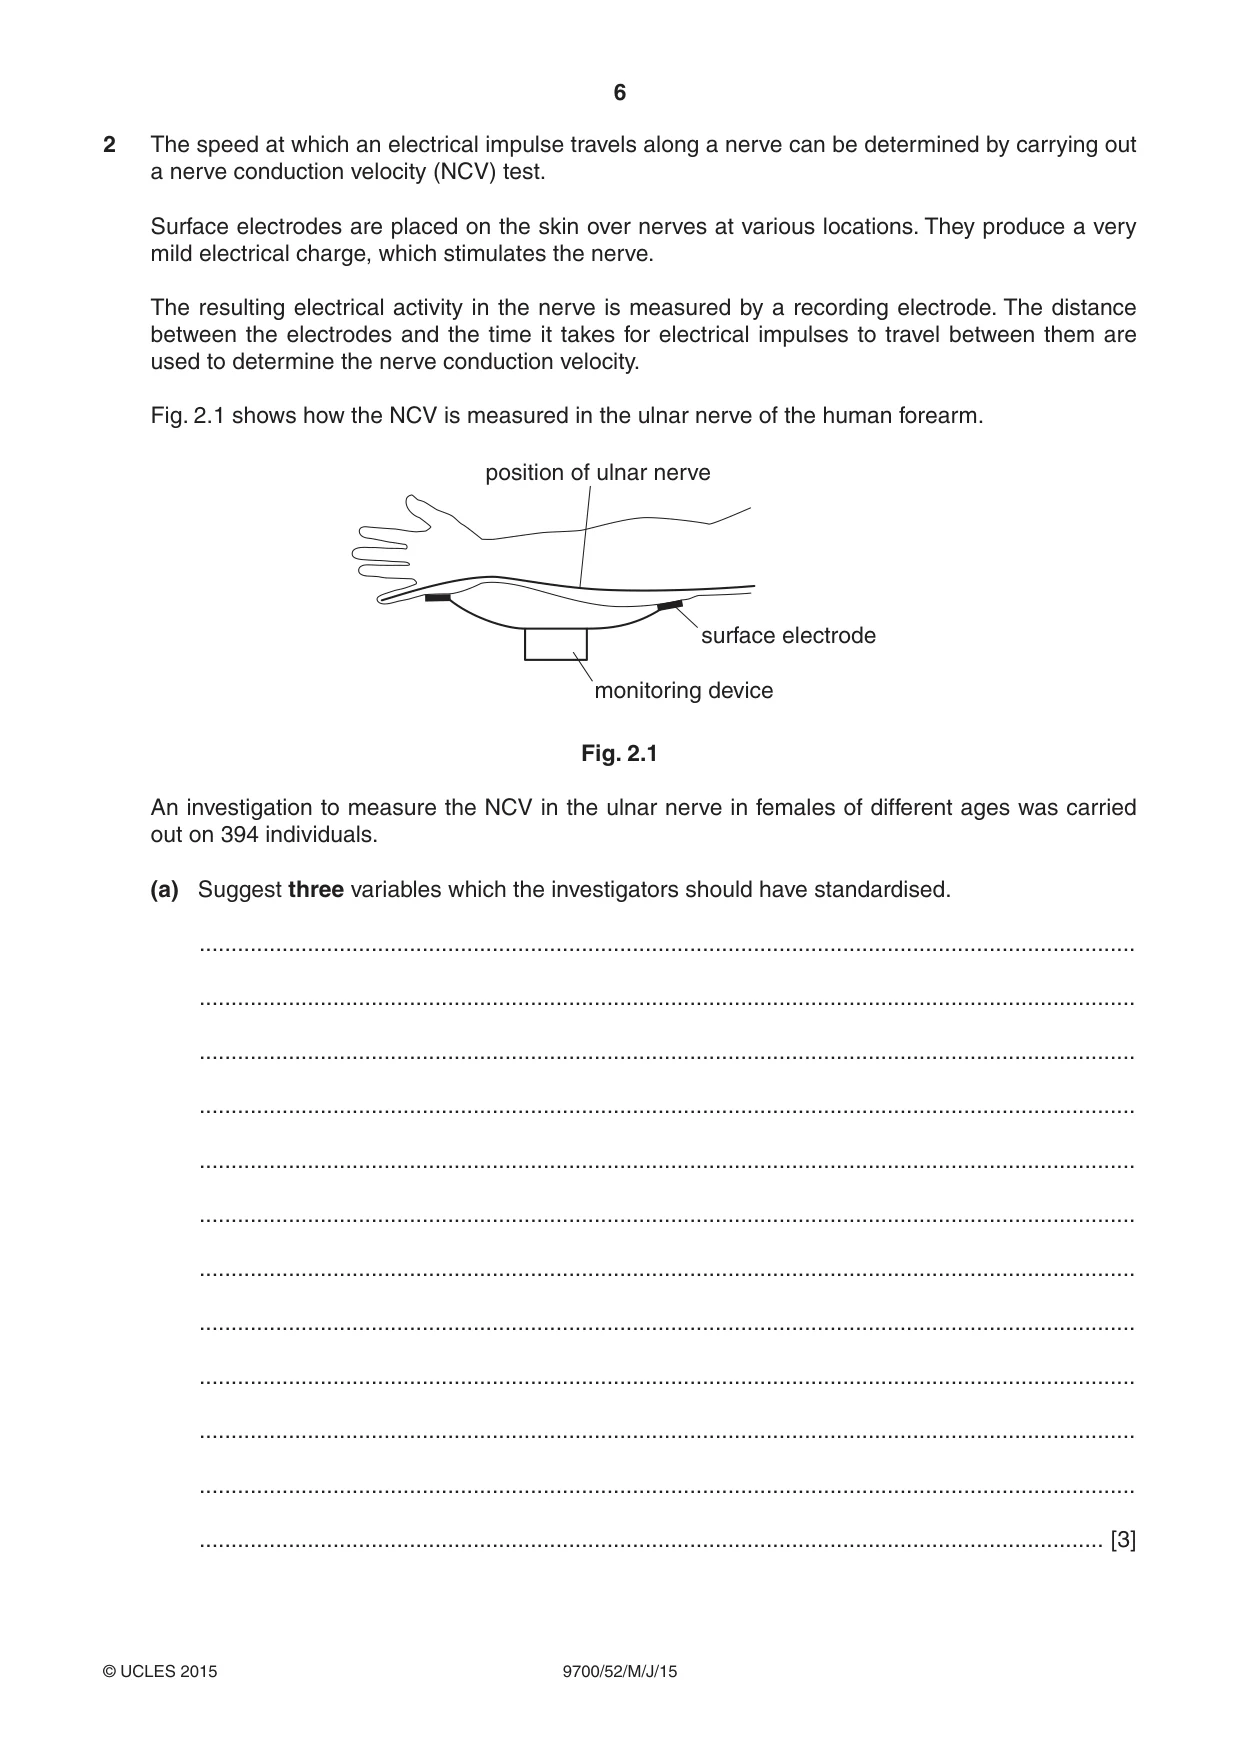
6 9700/52/M/J/15 © UCLES 2015 2 The speed at which an electrical impulse travels along a nerve can be determined by carrying out a nerve conduction velocity (NCV) test. Surface electrodes are placed on the skin over nerves at various locations. They produce a very mild electrical charge, which stimulates the nerve. The resulting electrical activity in the nerve is measured by a recording electrode. The distance between the electrodes and the time it takes for electrical impulses to travel between them are used to determine the nerve conduction velocity. Fig. 2.1 shows how the NCV is measured in the ulnar nerve of the human forearm. position of ulnar nerve surface electrode monitoring device Fig. 2.1 An investigation to measure the NCV in the ulnar nerve in females of different ages was carried out on 394 individuals. (a) Suggest three variables which the investigators should have standardised. … … … … … … … … … … … … [3]
Question paper, page 7
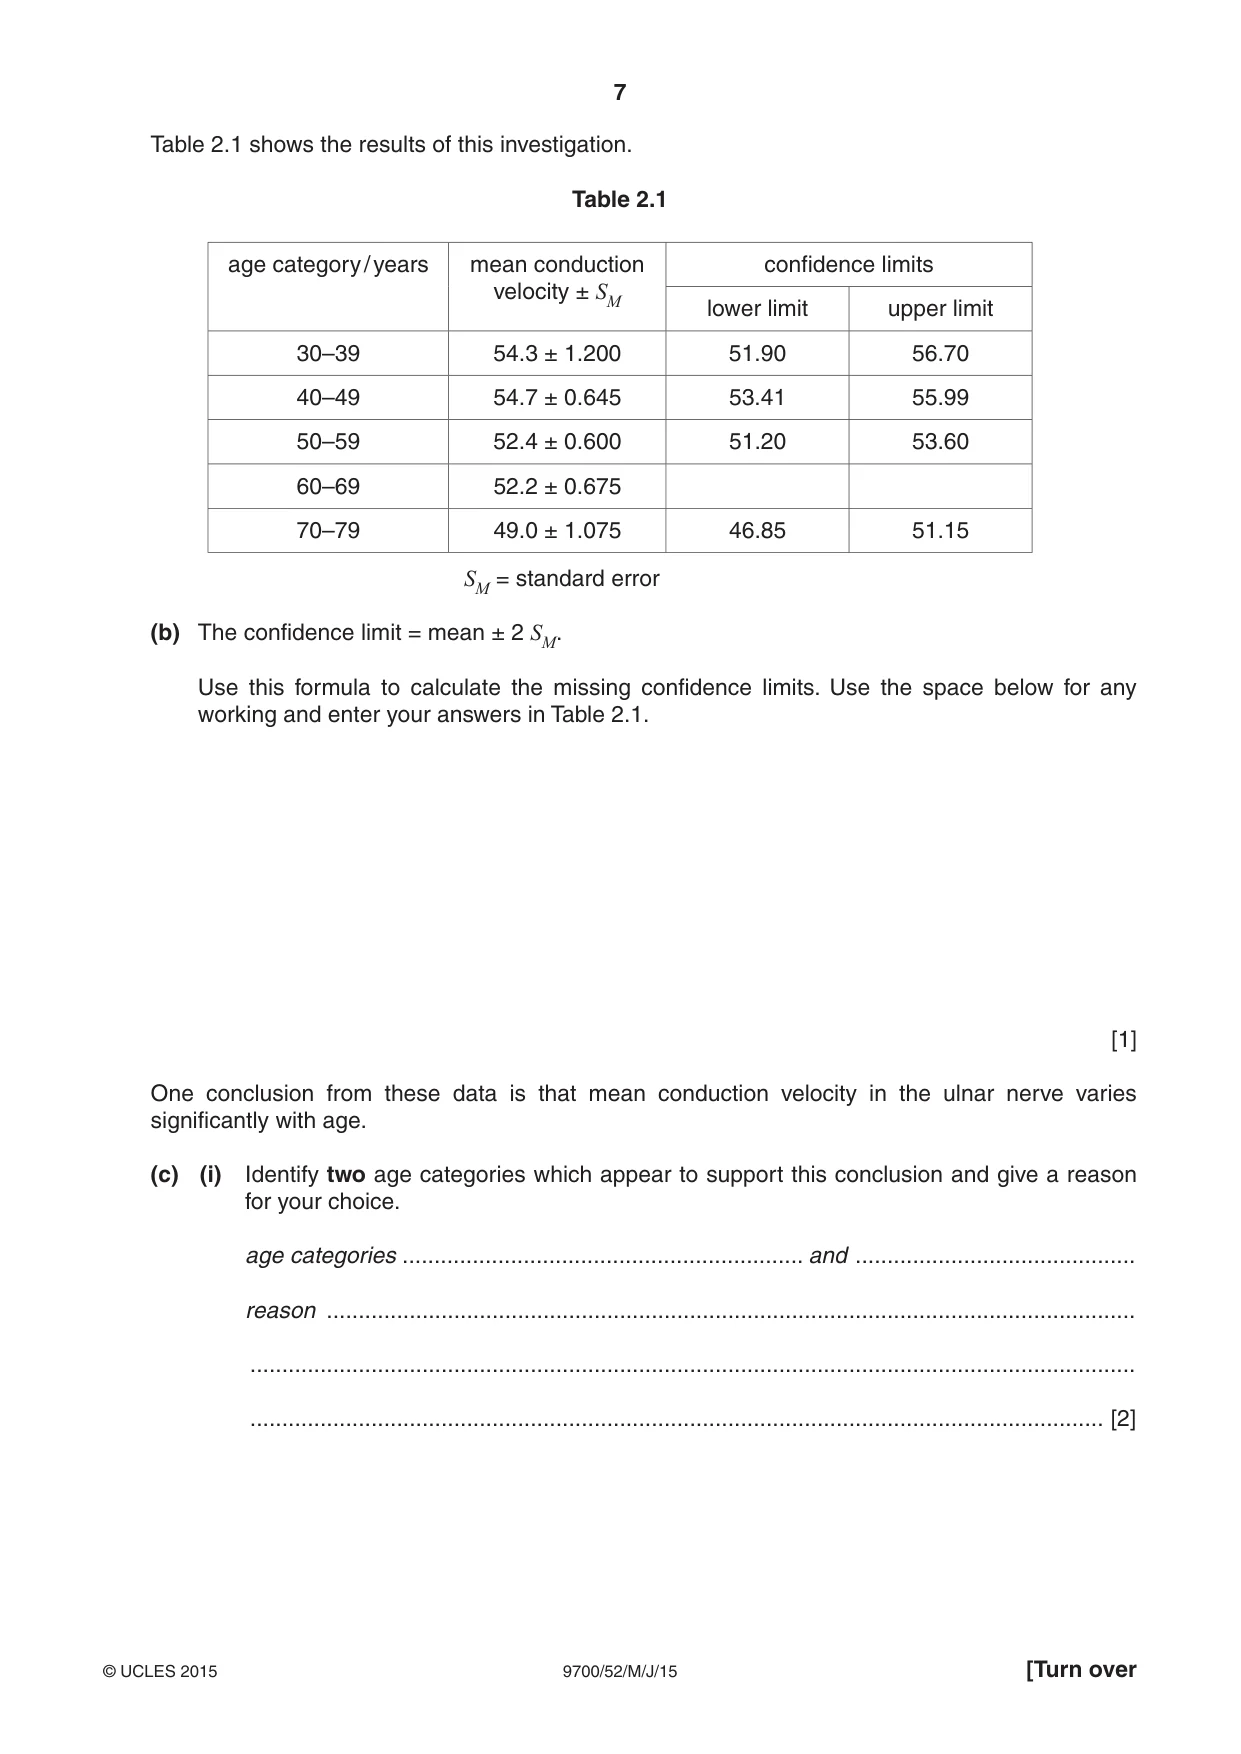
7 9700/52/M/J/15 © UCLES 2015 [Turn over Table 2.1 shows the results of this investigation. Table 2.1 age category / years mean conduction velocity ± SM confidence limits lower limit upper limit 30–39 54.3 ± 1.200 51.90 56.70 40–49 54.7 ± 0.645 53.41 55.99 50–59 52.4 ± 0.600 51.20 53.60 60–69 52.2 ± 0.675 70–79 49.0 ± 1.075 46.85 51.15 SM = standard error (b) The confidence limit = mean ± 2 SM. Use this formula to calculate the missing confidence limits. Use the space below for any working and enter your answers in Table 2.1. [1] One conclusion from these data is that mean conduction velocity in the ulnar nerve varies significantly with age. (c) (i) Identify two age categories which appear to support this conclusion and give a reason for your choice. age categories … and … reason … … … [2]
Question paper, page 8
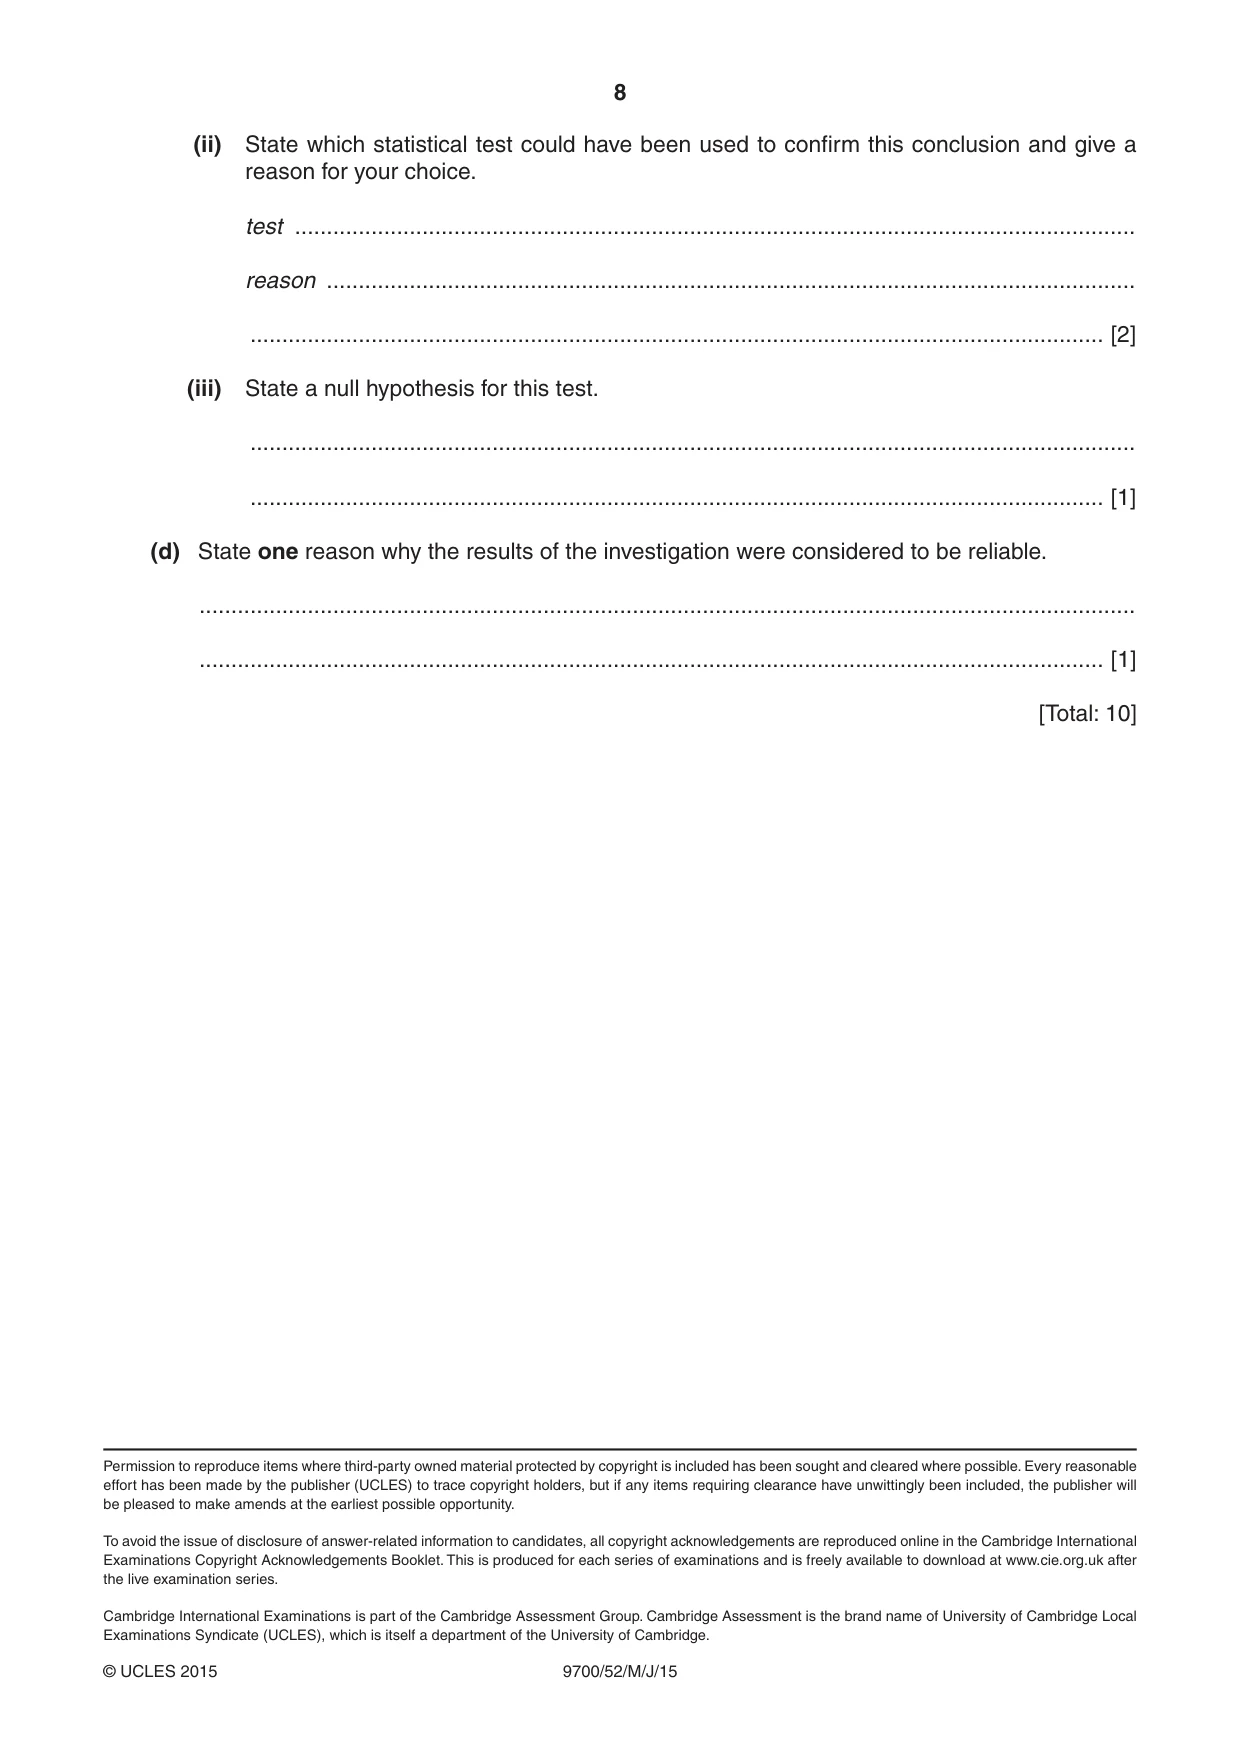
8 9700/52/M/J/15 © UCLES 2015 (ii) State which statistical test could have been used to confirm this conclusion and give a reason for your choice. test … reason … … [2] (iii) State a null hypothesis for this test. … … [1] (d) State one reason why the results of the investigation were considered to be reliable. … … [1] [Total: 10] Permission to reproduce items where third-party owned material protected by copyright is included has been sought and cleared where possible. Every reasonable effort has been made by the publisher (UCLES) to trace copyright holders, but if any items requiring clearance have unwittingly been included, the publisher will be pleased to make amends at the earliest possible opportunity. To avoid the issue of disclosure of answer-related information to candidates, all copyright acknowledgements are reproduced online in the Cambridge International Examinations Copyright Acknowledgements Booklet. This is produced for each series of examinations and is freely available to download at www.cie.org.uk after the live examination series. Cambridge International Examinations is part of the Cambridge Assessment Group. Cambridge Assessment is the brand name of University of Cambridge Local Examinations Syndicate (UCLES), which is itself a department of the University of Cambridge.
Mark scheme, page 1
® IGCSE is the registered trademark of Cambridge International Examinations. CAMBRIDGE INTERNATIONAL EXAMINATIONS Cambridge International Advanced Subsidiary and Advanced Level MARK SCHEME for the May/June 2015 series 9700 BIOLOGY 9700/52 Paper 5 (Planning, Analysis and Evaluation), maximum raw mark 30 This mark scheme is published as an aid to teachers and candidates, to indicate the requirements of the examination. It shows the basis on which Examiners were instructed to award marks. It does not indicate the details of the discussions that took place at an Examiners’ meeting before marking began, which would have considered the acceptability of alternative answers. Mark schemes should be read in conjunction with the question paper and the Principal Examiner Report for Teachers. Cambridge will not enter into discussions about these mark schemes. Cambridge is publishing the mark schemes for the May/June 2015 series for most Cambridge IGCSE®, Cambridge International A and AS Level components and some Cambridge O Level components.
Mark scheme, page 2
Page 2 Mark Scheme Syllabus Paper Cambridge International AS/A Level – May/June 2015 9700 52 © Cambridge International Examinations 2015 Mark scheme abbreviations: ; separates marking points / alternatives answers for the same point R reject A accept (for answers correctly cued by the question, or extra guidance) AW alternative wording (where responses vary more than usual) underline actual word given must be used by candidate (grammatical variants accepted) max indicates the maximum number of marks that can be given ora or reverse argument ecf error carried forward I ignore mp marking point (with relevant number)
Mark scheme, page 3
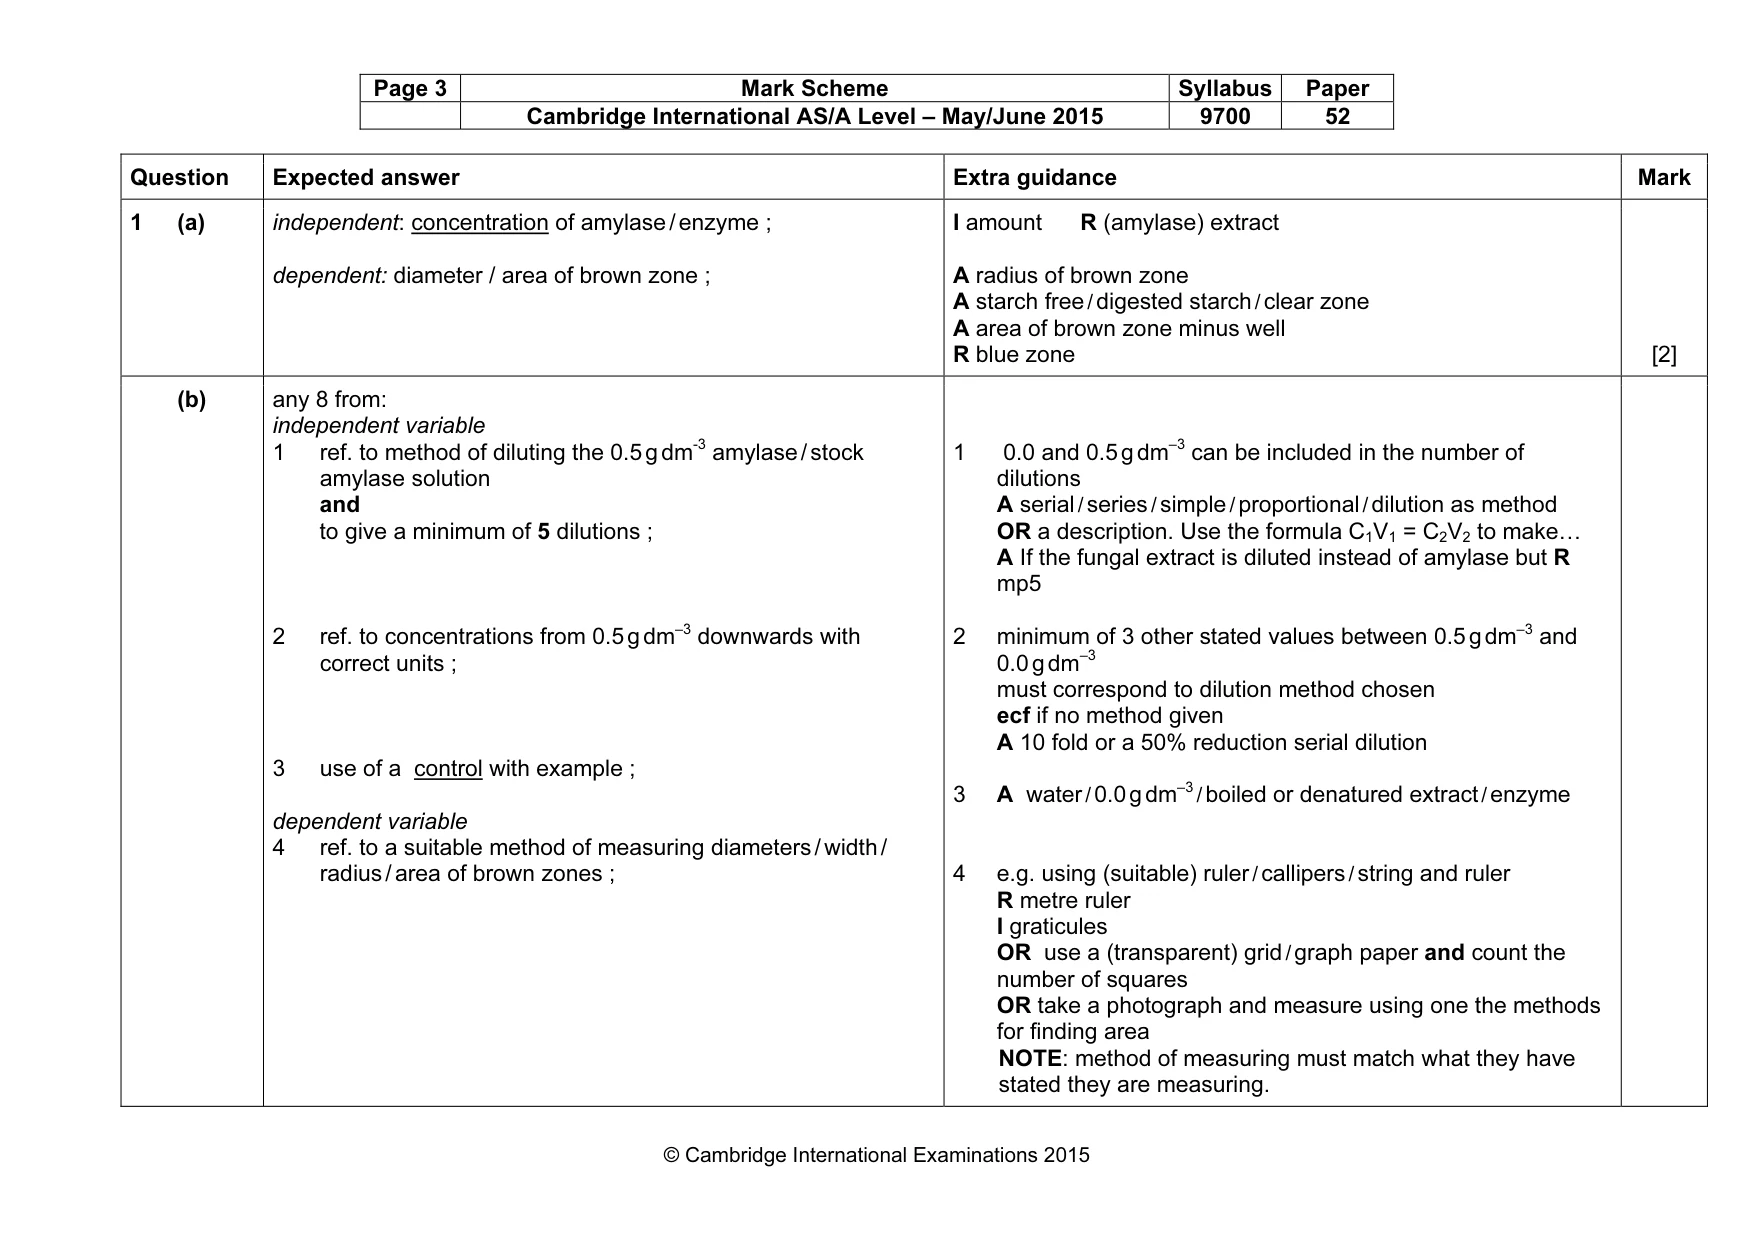
Page 3 Mark Scheme Syllabus Paper Cambridge International AS/A Level – May/June 2015 9700 52 © Cambridge International Examinations 2015 Question Expected answer Extra guidance Mark 1 (a) independent: concentration of amylase / enzyme ; dependent: diameter / area of brown zone ; I amount R (amylase) extract A radius of brown zone A starch free / digested starch / clear zone A area of brown zone minus well R blue zone [2] (b) any 8 from: independent variable 1 ref. to method of diluting the 0.5 g dm-3 amylase / stock amylase solution and to give a minimum of 5 dilutions ; 2 ref. to concentrations from 0.5 g dm–3 downwards with correct units ; 3 use of a control with example ; dependent variable 4 ref. to a suitable method of measuring diameters / width / radius / area of brown zones ; 1 0.0 and 0.5 g dm–3 can be included in the number of dilutions A serial / series / simple / proportional / dilution as method OR a description. Use the formula C1V1 = C2V2 to make… A If the fungal extract is diluted instead of amylase but R mp5 2 minimum of 3 other stated values between 0.5 g dm–3 and 0.0 g dm–3 must correspond to dilution method chosen ecf if no method given A 10 fold or a 50% reduction serial dilution 3 A water / 0.0 g dm–3 / boiled or denatured extract / enzyme 4 e.g. using (suitable) ruler / callipers / string and ruler R metre ruler I graticules OR use a (transparent) grid / graph paper and count the number of squares OR take a photograph and measure using one the methods for finding area NOTE: method of measuring must match what they have stated they are measuring.
Mark scheme, page 4
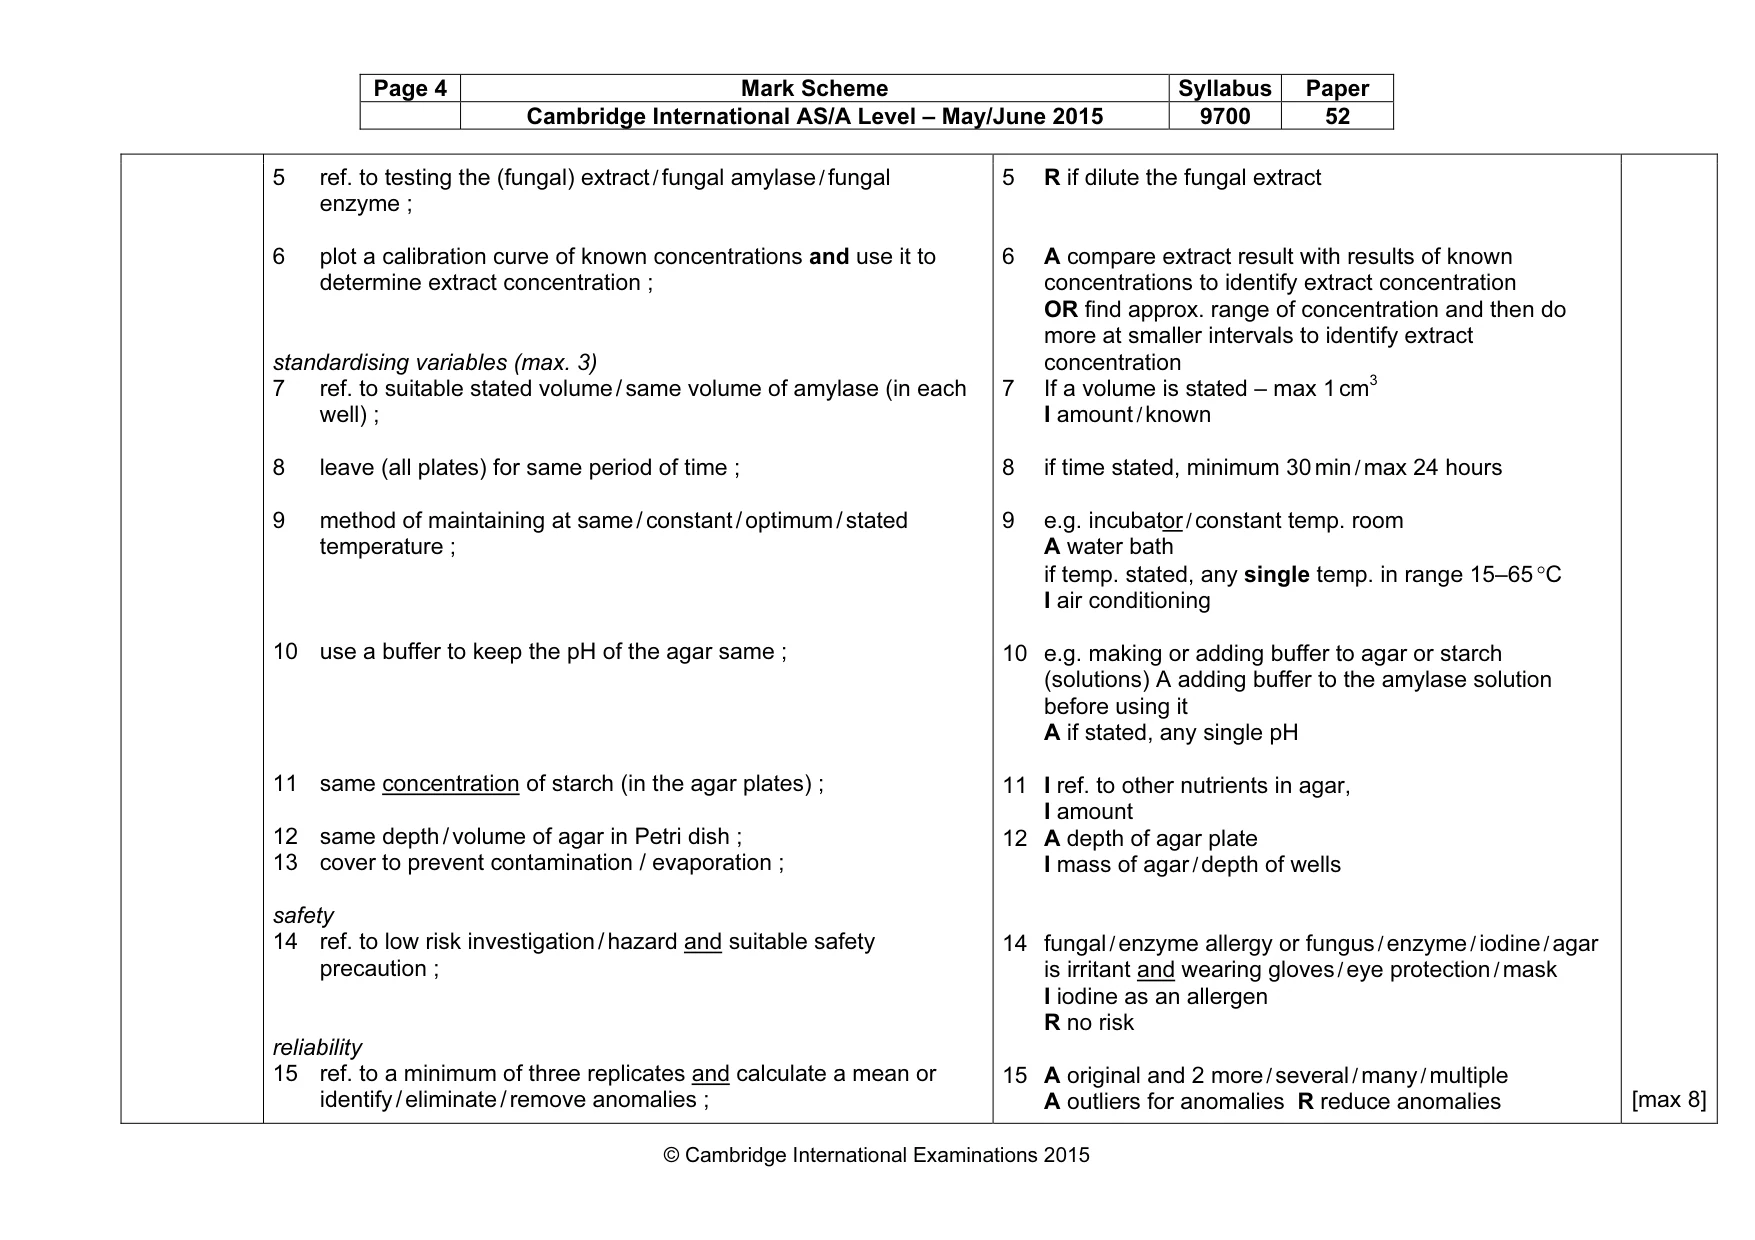
Page 4 Mark Scheme Syllabus Paper Cambridge International AS/A Level – May/June 2015 9700 52 © Cambridge International Examinations 2015 5 ref. to testing the (fungal) extract / fungal amylase / fungal enzyme ; 6 plot a calibration curve of known concentrations and use it to determine extract concentration ; standardising variables (max. 3) 7 ref. to suitable stated volume / same volume of amylase (in each well) ; 8 leave (all plates) for same period of time ; 9 method of maintaining at same / constant / optimum / stated temperature ; 10 use a buffer to keep the pH of the agar same ; 11 same concentration of starch (in the agar plates) ; 12 same depth / volume of agar in Petri dish ; 13 cover to prevent contamination / evaporation ; safety 14 ref. to low risk investigation / hazard and suitable safety precaution ; reliability 15 ref. to a minimum of three replicates and calculate a mean or identify / eliminate / remove anomalies ; 5 R if dilute the fungal extract 6 A compare extract result with results of known concentrations to identify extract concentration OR find approx. range of concentration and then do more at smaller intervals to identify extract concentration 7 If a volume is stated – max 1 cm3 I amount / known 8 if time stated, minimum 30 min / max 24 hours 9 e.g. incubator / constant temp. room A water bath if temp. stated, any single temp. in range 15–65 °C I air conditioning 10 e.g. making or adding buffer to agar or starch (solutions) A adding buffer to the amylase solution before using it A if stated, any single pH 11 I ref. to other nutrients in agar, I amount 12 A depth of agar plate I mass of agar / depth of wells 14 fungal / enzyme allergy or fungus / enzyme / iodine / agar is irritant and wearing gloves / eye protection / mask I iodine as an allergen R no risk 15 A original and 2 more / several / many / multiple A outliers for anomalies R reduce anomalies [max 8]
Mark scheme, page 5
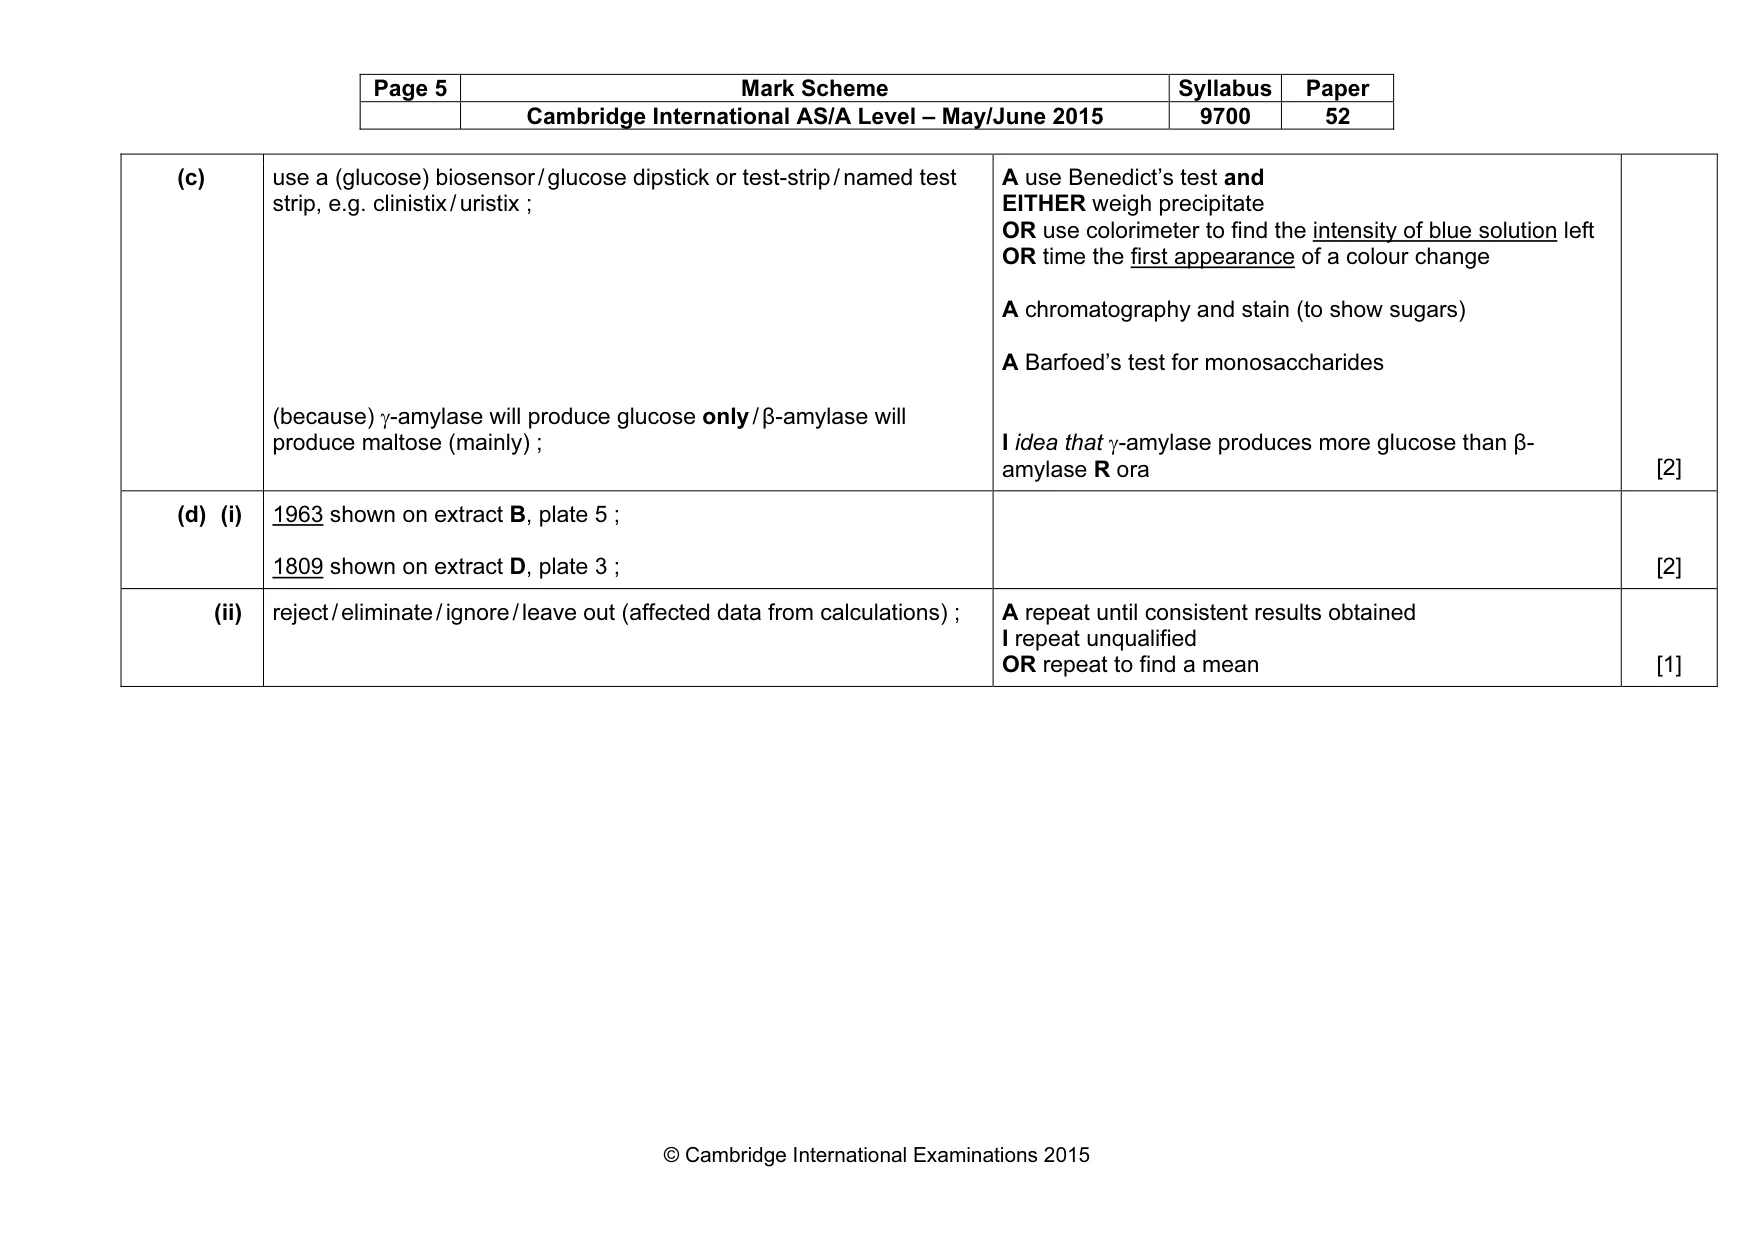
Page 5 Mark Scheme Syllabus Paper Cambridge International AS/A Level – May/June 2015 9700 52 © Cambridge International Examinations 2015 (c) use a (glucose) biosensor / glucose dipstick or test-strip / named test strip, e.g. clinistix / uristix ; (because) γ-amylase will produce glucose only / β-amylase will produce maltose (mainly) ; A use Benedict’s test and EITHER weigh precipitate OR use colorimeter to find the intensity of blue solution left OR time the first appearance of a colour change A chromatography and stain (to show sugars) A Barfoed’s test for monosaccharides I idea that γ-amylase produces more glucose than β- amylase R ora [2] (d) (i) 1963 shown on extract B, plate 5 ; 1809 shown on extract D, plate 3 ; [2] (ii) reject / eliminate / ignore / leave out (affected data from calculations) ; A repeat until consistent results obtained I repeat unqualified OR repeat to find a mean [1]
Mark scheme, page 6
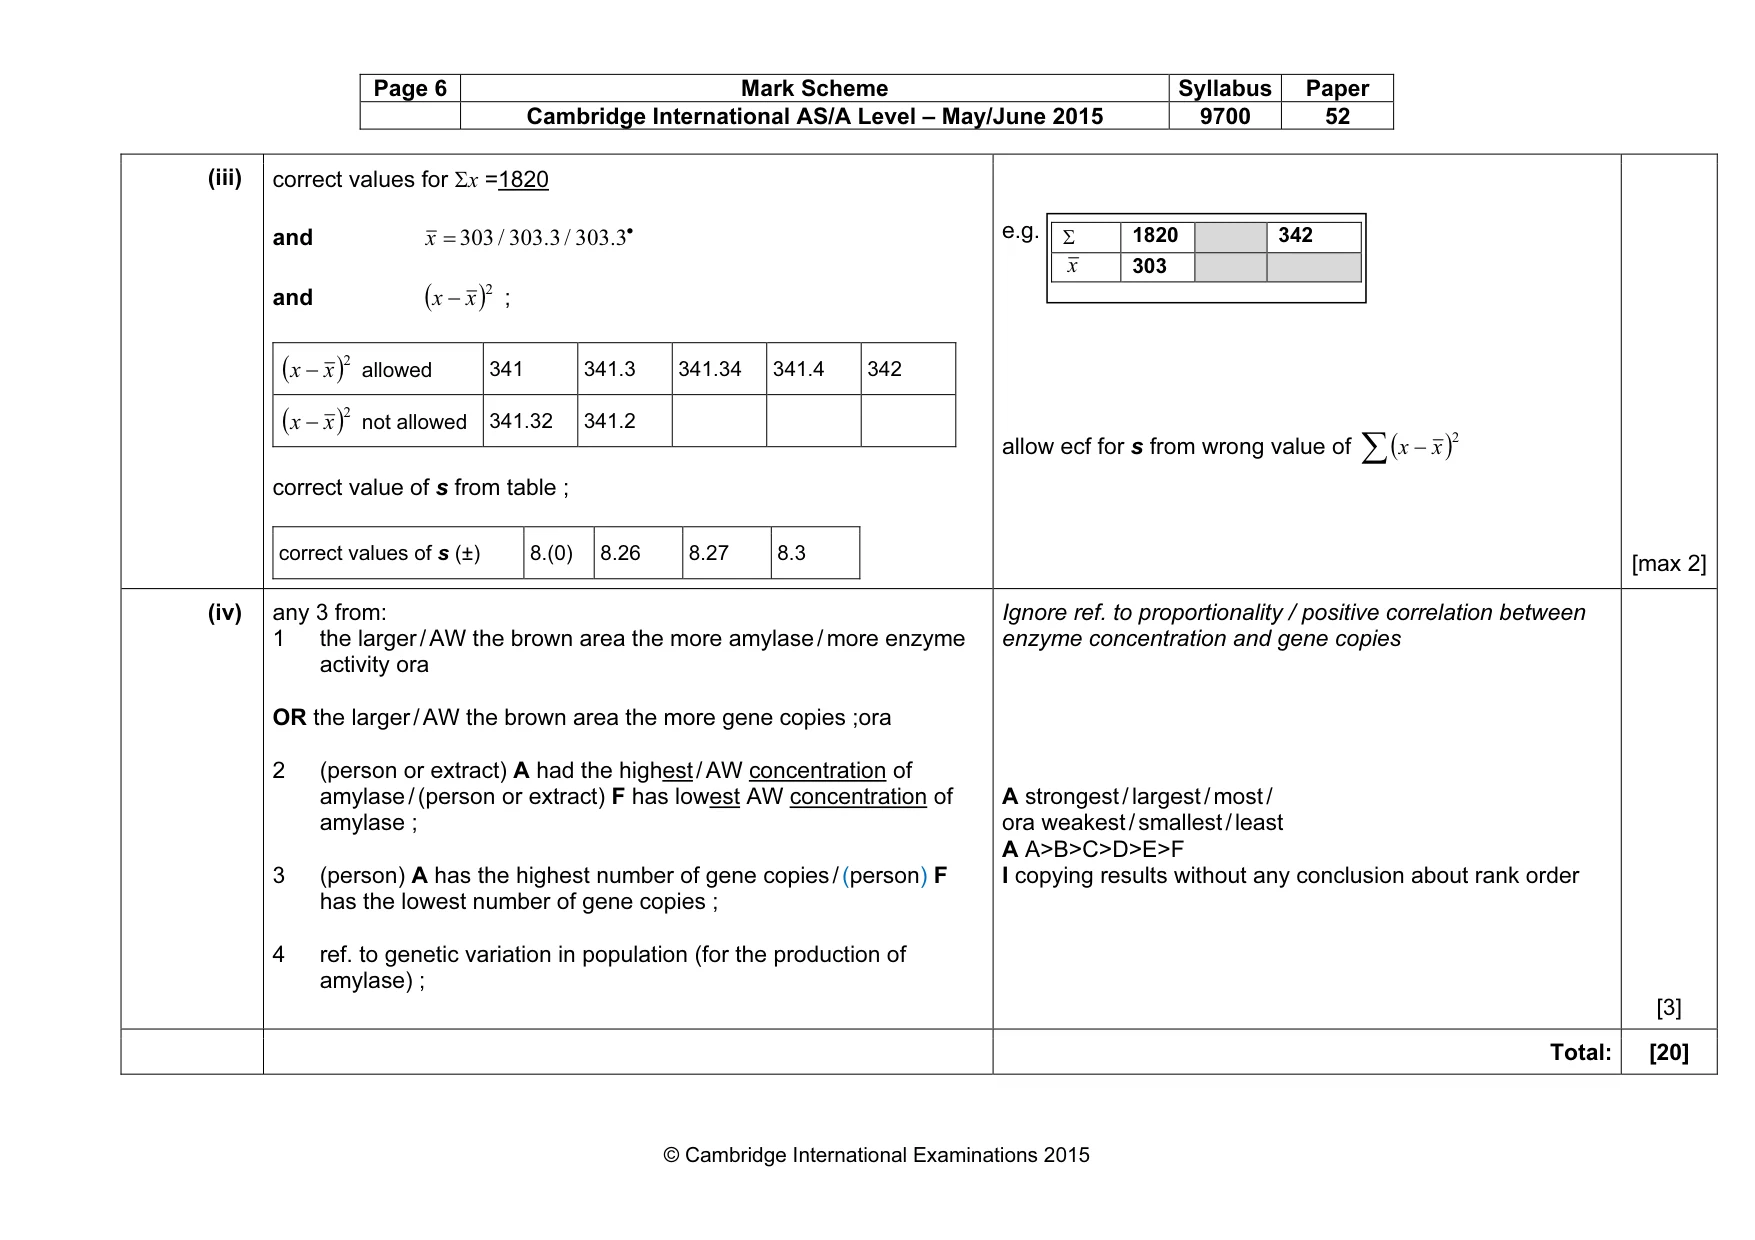
Page 6 Mark Scheme Syllabus Paper Cambridge International AS/A Level – May/June 2015 9700 52 © Cambridge International Examinations 2015 (iii) correct values for Σx =1820 and • = 303.3 / 303.3 / 303 x and ( )2 x x − ; ( )2 x x − allowed 341 341.3 341.34 341.4 342 ( )2 x x − not allowed 341.32 341.2 correct value of s from table ; correct values of s (±) 8.(0) 8.26 8.27 8.3 e.g. allow ecf for s from wrong value of ( ) ∑ − 2 x x [max 2] (iv) any 3 from: 1 the larger / AW the brown area the more amylase / more enzyme activity ora OR the larger / AW the brown area the more gene copies ;ora 2 (person or extract) A had the highest / AW concentration of amylase / (person or extract) F has lowest AW concentration of amylase ; 3 (person) A has the highest number of gene copies / (person) F has the lowest number of gene copies ; 4 ref. to genetic variation in population (for the production of amylase) ; Ignore ref. to proportionality / positive correlation between enzyme concentration and gene copies A strongest / largest / most / ora weakest / smallest / least A A>B>C>D>E>F I copying results without any conclusion about rank order [3] Total: [20] Σ 1820 342 x 303
Mark scheme, page 7
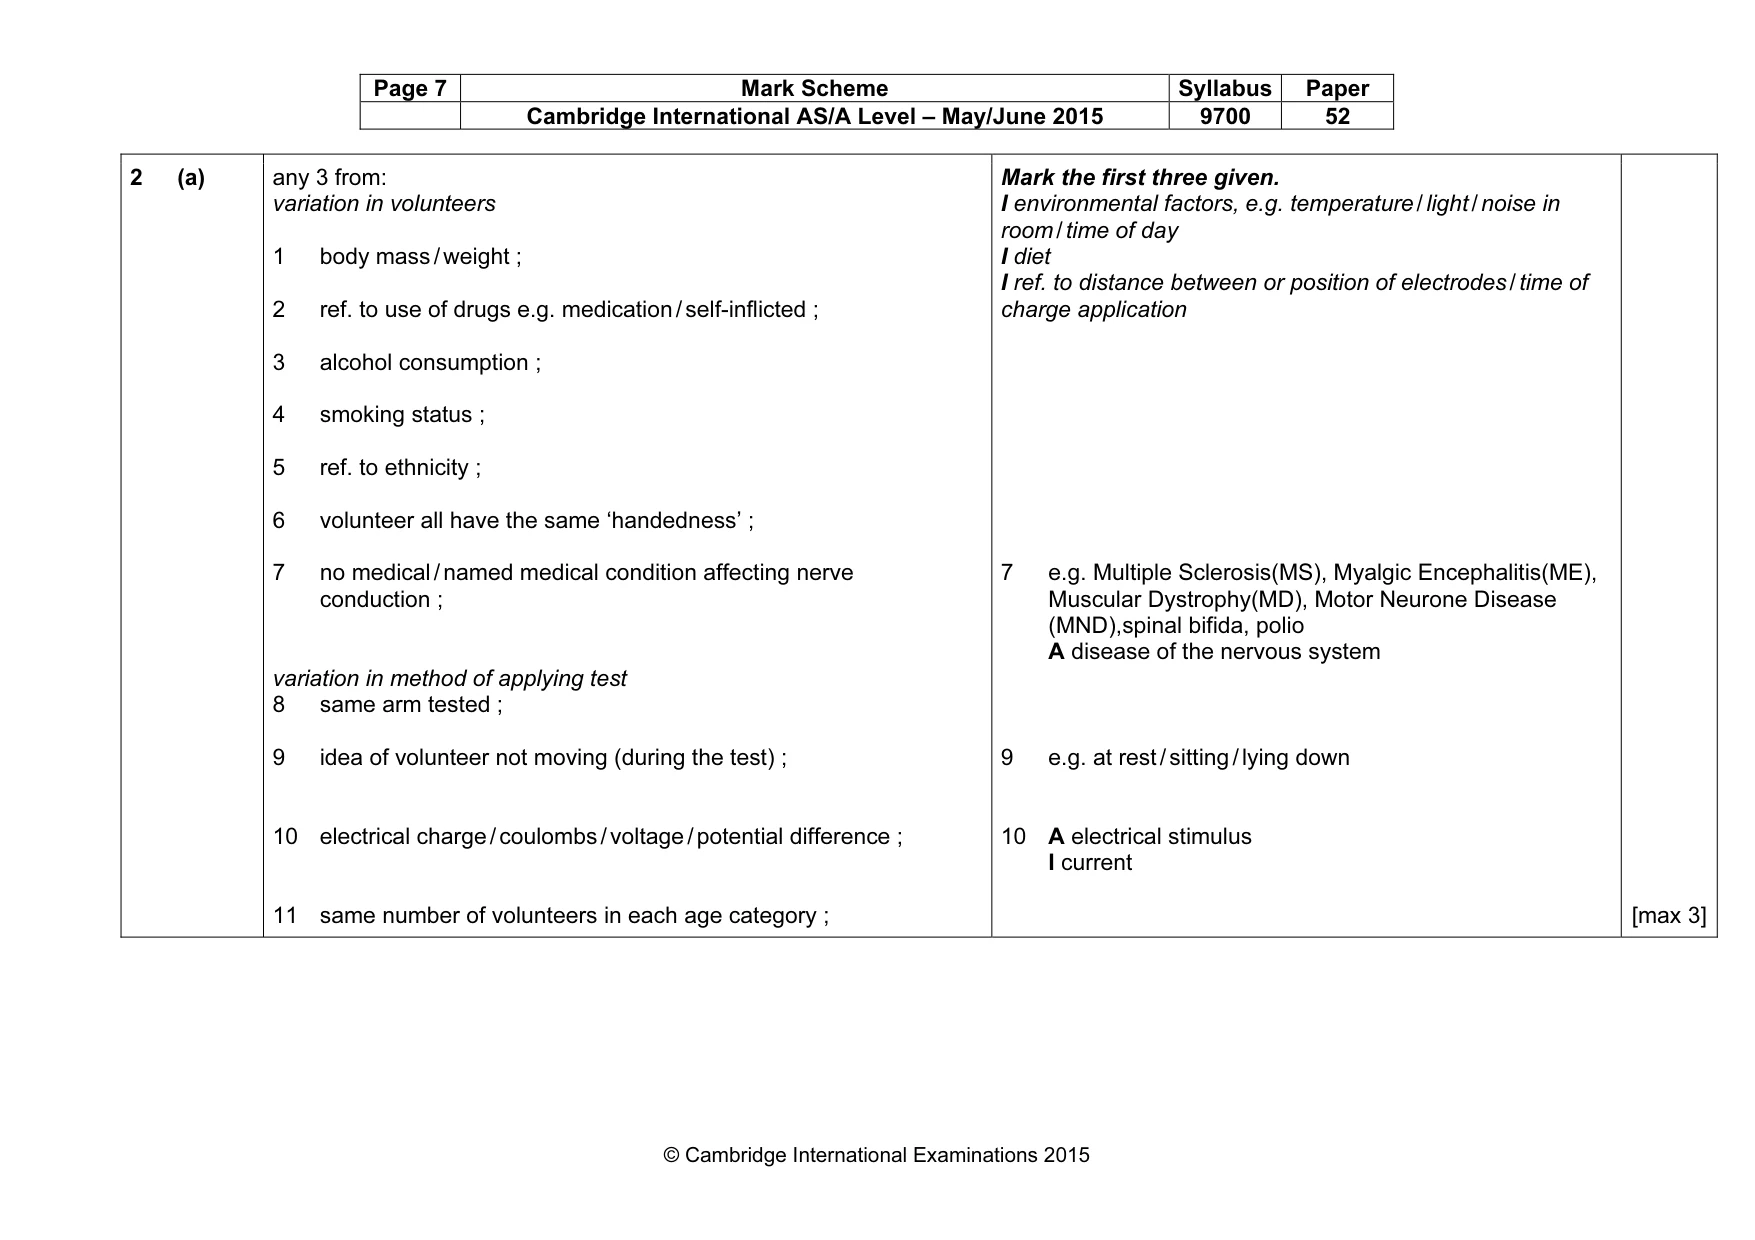
Page 7 Mark Scheme Syllabus Paper Cambridge International AS/A Level – May/June 2015 9700 52 © Cambridge International Examinations 2015 2 (a) any 3 from: variation in volunteers 1 body mass / weight ; 2 ref. to use of drugs e.g. medication / self-inflicted ; 3 alcohol consumption ; 4 smoking status ; 5 ref. to ethnicity ; 6 volunteer all have the same ‘handedness’ ; 7 no medical / named medical condition affecting nerve conduction ; variation in method of applying test 8 same arm tested ; 9 idea of volunteer not moving (during the test) ; 10 electrical charge / coulombs / voltage / potential difference ; 11 same number of volunteers in each age category ; Mark the first three given. I environmental factors, e.g. temperature / light / noise in room / time of day I diet I ref. to distance between or position of electrodes / time of charge application 7 e.g. Multiple Sclerosis(MS), Myalgic Encephalitis(ME), Muscular Dystrophy(MD), Motor Neurone Disease (MND),spinal bifida, polio A disease of the nervous system 9 e.g. at rest / sitting / lying down 10 A electrical stimulus I current [max 3]
Mark scheme, page 8
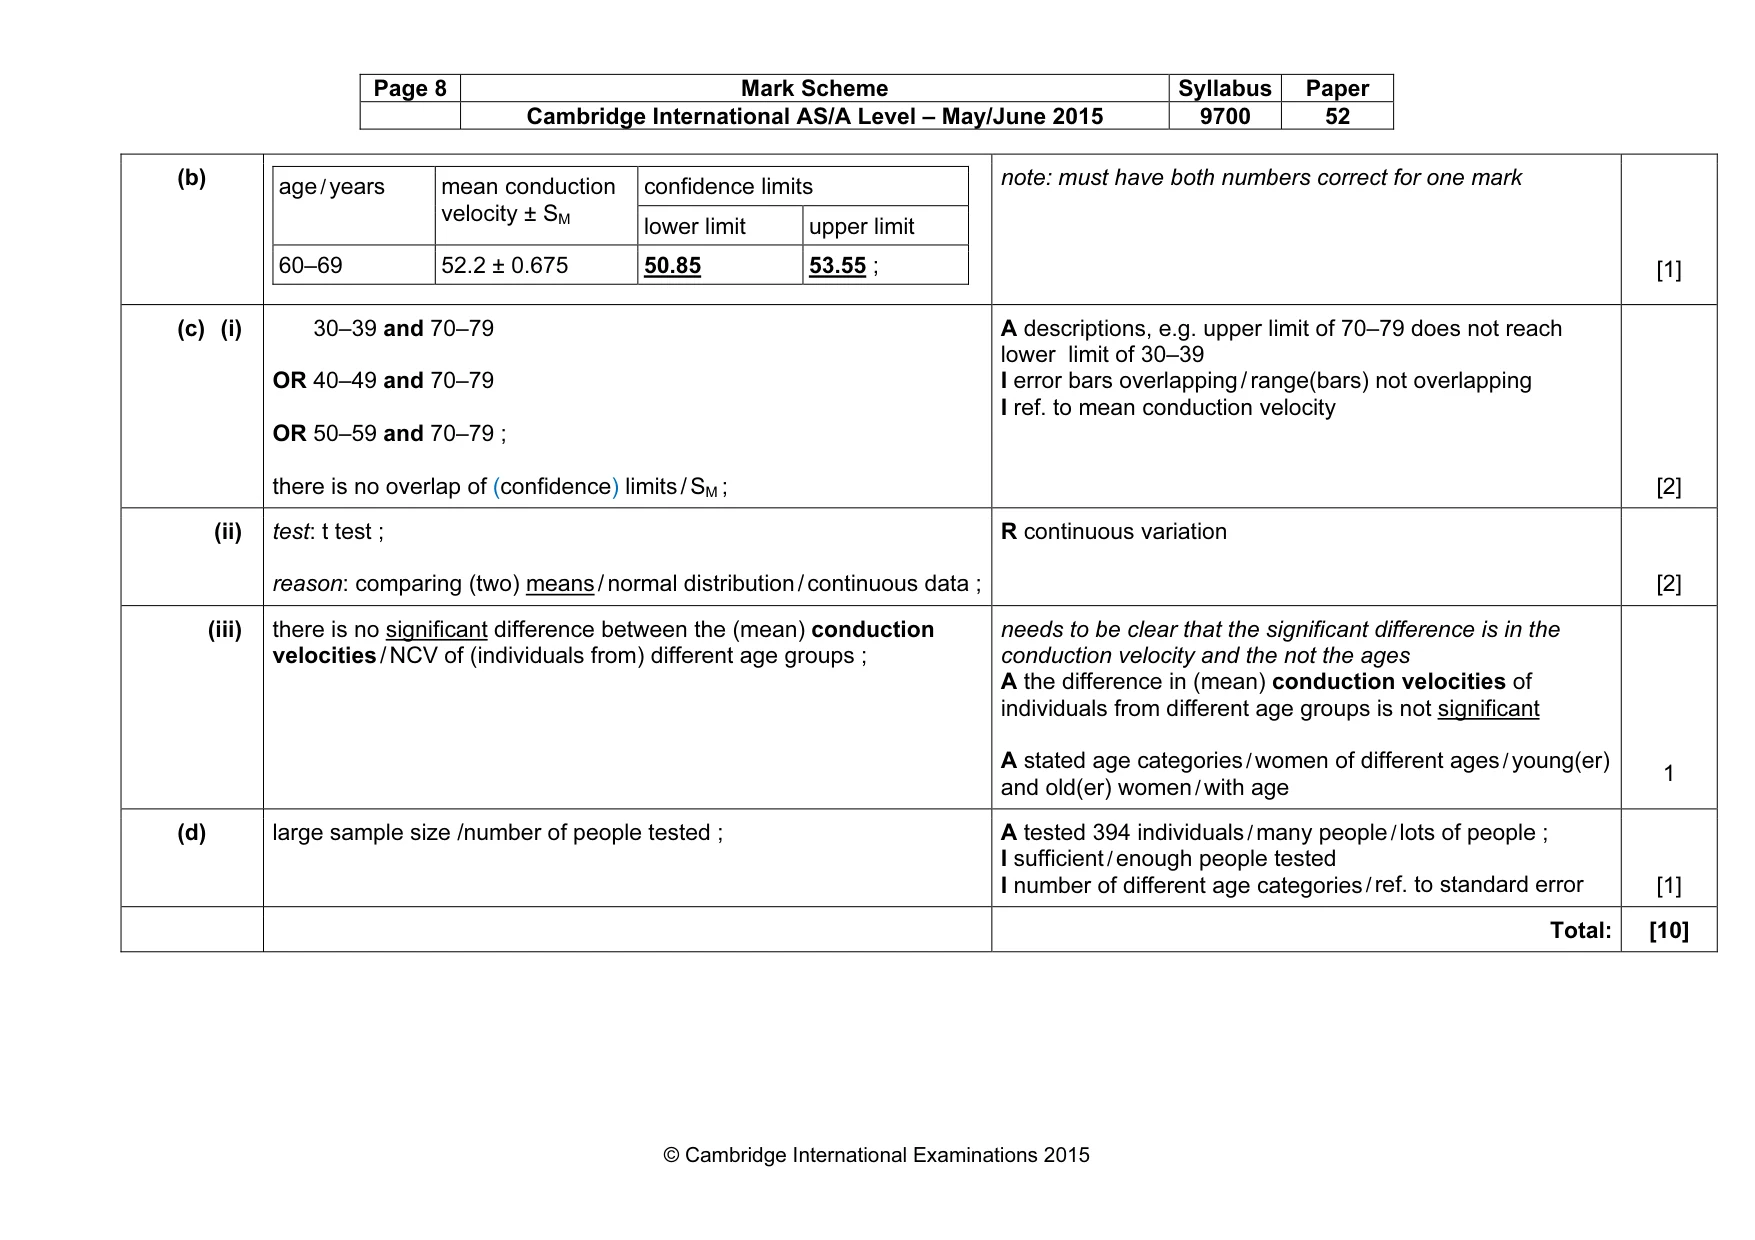
Page 8 Mark Scheme Syllabus Paper Cambridge International AS/A Level – May/June 2015 9700 52 © Cambridge International Examinations 2015 (b) age / years mean conduction velocity ± SM confidence limits lower limit upper limit 60–69 52.2 ± 0.675 50.85 53.55 ; note: must have both numbers correct for one mark [1] (c) (i) OR 30–39 and 70–79 OR 40–49 and 70–79 OR 50–59 and 70–79 ; there is no overlap of (confidence) limits / SM ; A descriptions, e.g. upper limit of 70–79 does not reach lower limit of 30–39 I error bars overlapping / range(bars) not overlapping I ref. to mean conduction velocity [2] (ii) test: t test ; reason: comparing (two) means / normal distribution / continuous data ; R continuous variation [2] (iii) there is no significant difference between the (mean) conduction velocities / NCV of (individuals from) different age groups ; needs to be clear that the significant difference is in the conduction velocity and the not the ages A the difference in (mean) conduction velocities of individuals from different age groups is not significant A stated age categories / women of different ages / young(er) and old(er) women / with age 1 (d) large sample size /number of people tested ; A tested 394 individuals / many people / lots of people ; I sufficient / enough people tested I number of different age categories / ref. to standard error [1] Total: [10]
What you needed in this session
Cambridge’s own grade thresholds for 2015 May/June, Paper 5 · Variant 2. A higher threshold means an easier paper — the bar moves with how the cohort did.