Cambridge A Level Biology 9700 — 2015 May/June Paper 5 · Variant 1
9700/51/M/J/15 · 30 marks · ≈34 min
The question paper and its mark scheme, free to read here and free to download. This is Cambridge’s own paper, exactly as it was sat.
Question paper8 pages
Mark scheme10 pages
Answers below. Sit the paper first if you are practising.
Paper as text
Question paper, page 1
This document consists of 8 printed pages. DC (CW/SW) 90292/4 © UCLES 2015 [Turn over * 8 5 3 7 3 7 0 0 5 0 * BIOLOGY 9700/51 Paper 5 Planning, Analysis and Evaluation May/June 2015 1 hour 15 minutes Candidates answer on the Question Paper. No Additional Materials are required. READ THESE INSTRUCTIONS FIRST Write your Centre number, candidate number and name on all the work you hand in. Write in dark blue or black pen. You may use an HB pencil for any diagrams or graphs. Do not use staples, paper clips, glue or correction fluid. DO NOT WRITE IN ANY BARCODES. Answer all questions. Electronic calculators may be used. You may lose marks if you do not show your working or if you do not use appropriate units. At the end of the examination, fasten all your work securely together. The number of marks is given in brackets [ ] at the end of each question or part question. Cambridge International Examinations Cambridge International Advanced Level
Question paper, page 2
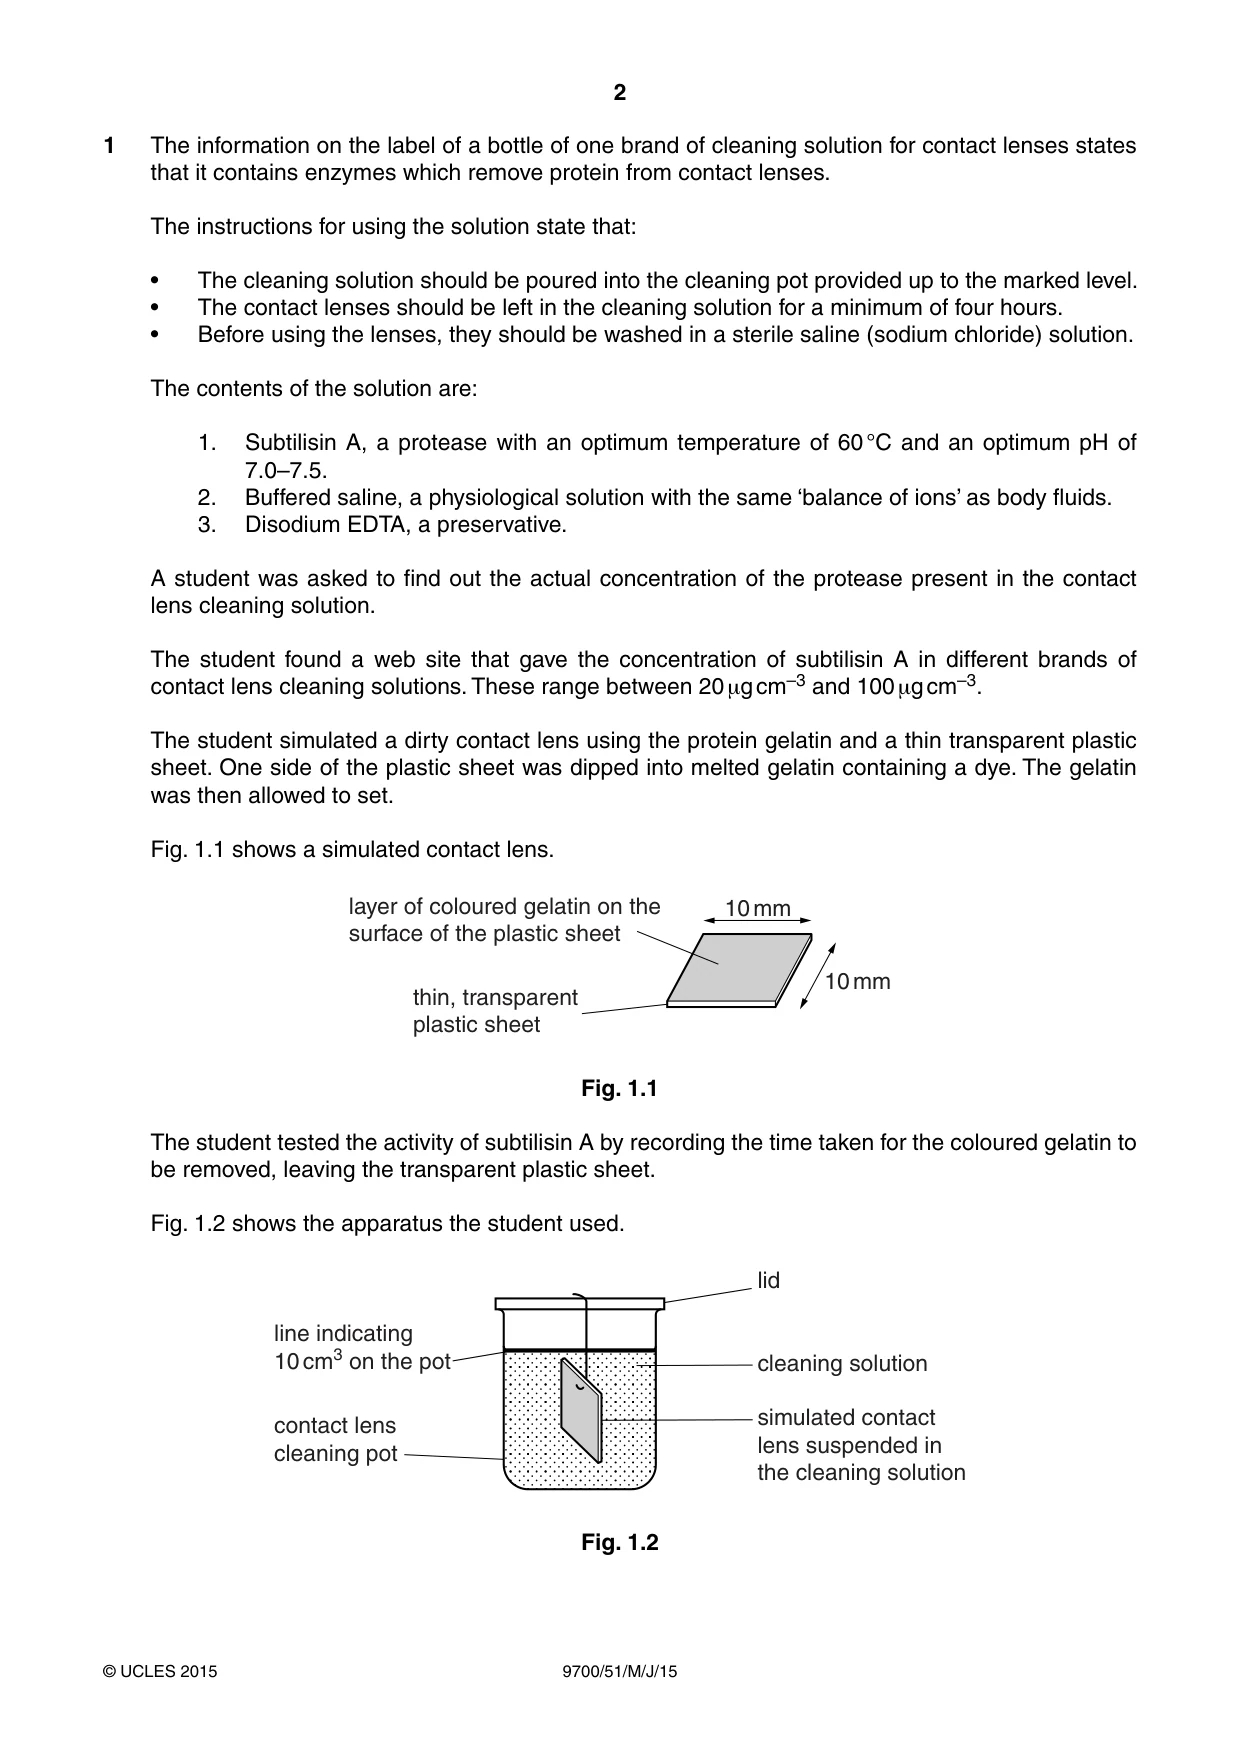
2 9700/51/M/J/15 © UCLES 2015 1 The information on the label of a bottle of one brand of cleaning solution for contact lenses states that it contains enzymes which remove protein from contact lenses. The instructions for using the solution state that: • The cleaning solution should be poured into the cleaning pot provided up to the marked level. • The contact lenses should be left in the cleaning solution for a minimum of four hours. • Before using the lenses, they should be washed in a sterile saline (sodium chloride) solution. The contents of the solution are: 1. Subtilisin A, a protease with an optimum temperature of 60 °C and an optimum pH of 7.0–7.5. 2. Buffered saline, a physiological solution with the same ‘balance of ions’ as body fluids. 3. Disodium EDTA, a preservative. A student was asked to find out the actual concentration of the protease present in the contact lens cleaning solution. The student found a web site that gave the concentration of subtilisin A in different brands of contact lens cleaning solutions. These range between 20 μg cm–3 and 100 μg cm–3. The student simulated a dirty contact lens using the protein gelatin and a thin transparent plastic sheet. One side of the plastic sheet was dipped into melted gelatin containing a dye. The gelatin was then allowed to set. Fig. 1.1 shows a simulated contact lens. 10 mm 10 mm layer of coloured gelatin on the surface of the plastic sheet thin, transparent plastic sheet Fig. 1.1 The student tested the activity of subtilisin A by recording the time taken for the coloured gelatin to be removed, leaving the transparent plastic sheet. Fig. 1.2 shows the apparatus the student used. lid cleaning solution simulated contact lens suspended in the cleaning solution contact lens cleaning pot line indicating 10 cm3 on the pot Fig. 1.2
Question paper, page 3
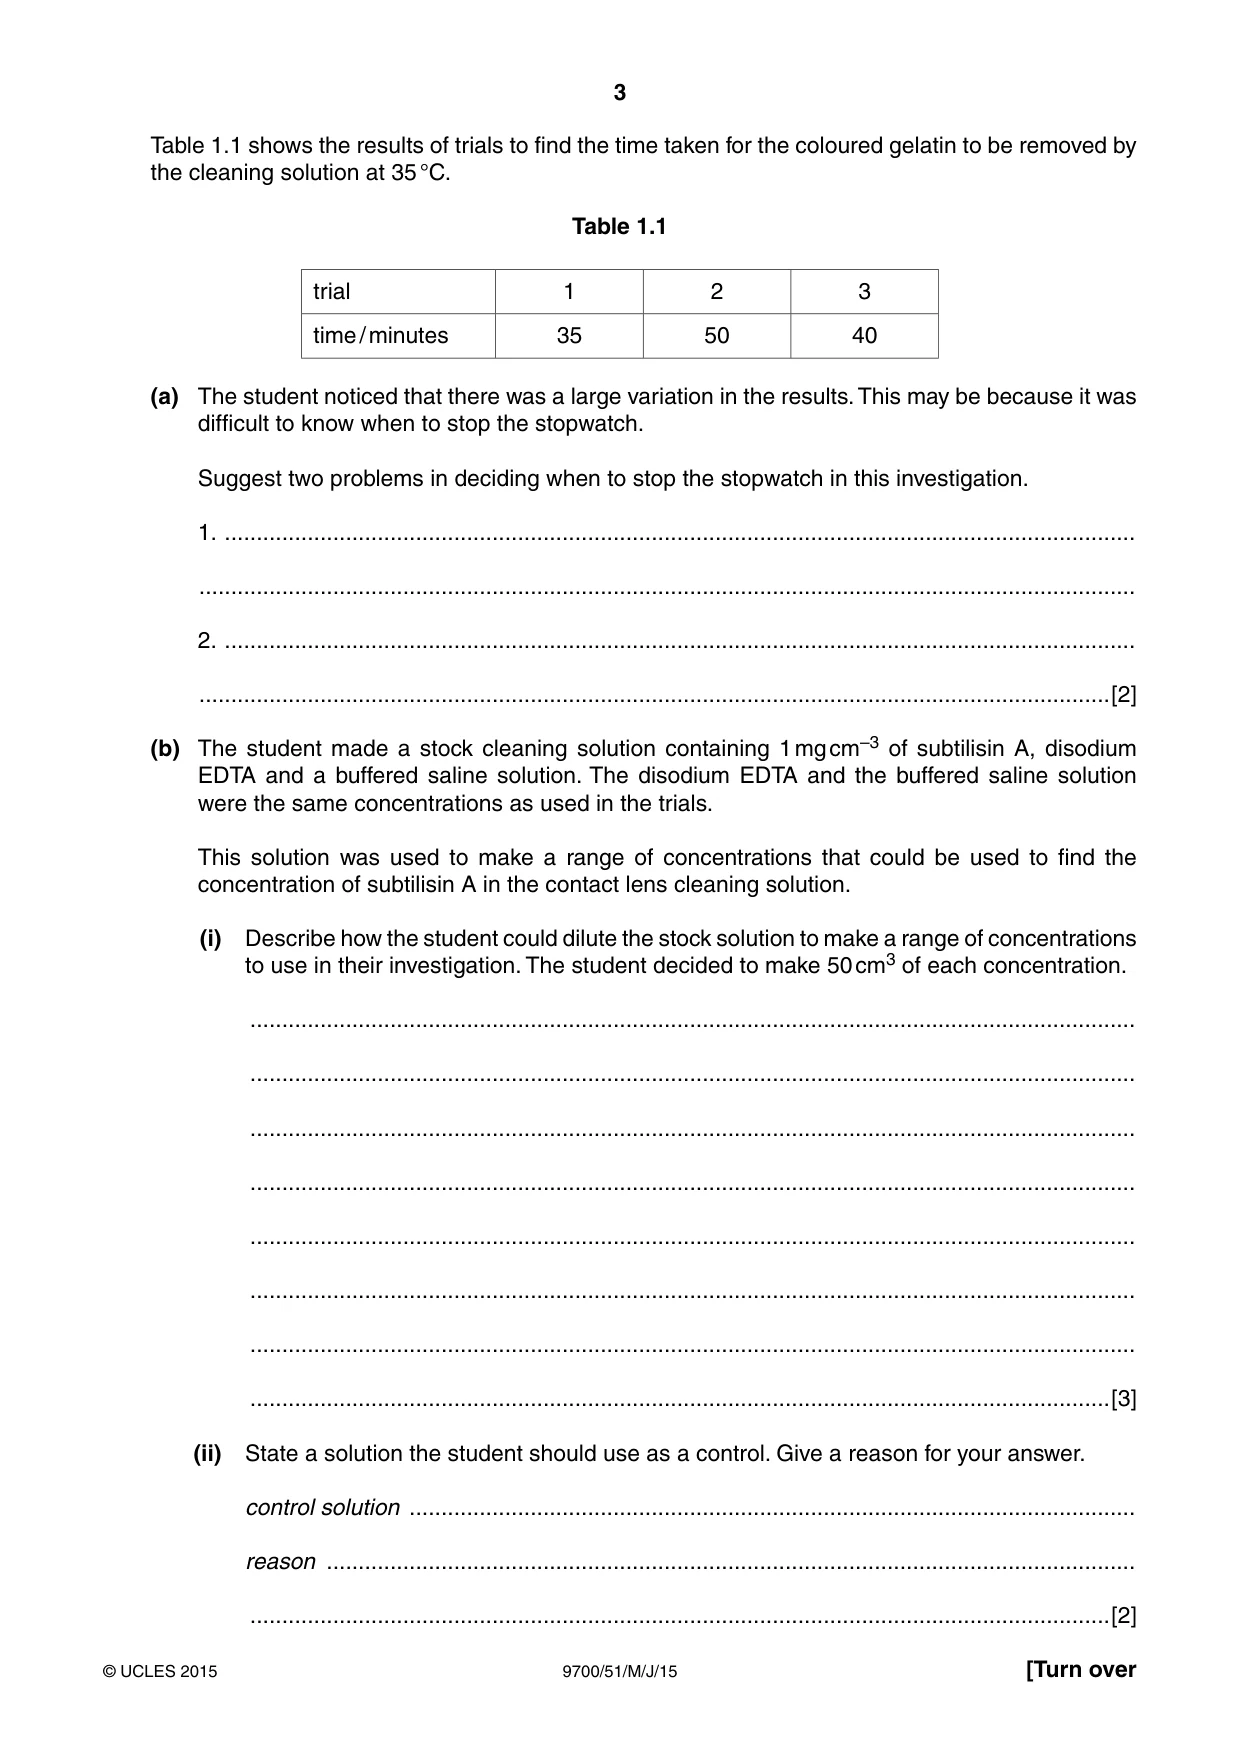
3 9700/51/M/J/15 © UCLES 2015 [Turn over Table 1.1 shows the results of trials to find the time taken for the coloured gelatin to be removed by the cleaning solution at 35 °C. Table 1.1 trial 1 2 3 time / minutes 35 50 40 (a) The student noticed that there was a large variation in the results. This may be because it was difficult to know when to stop the stopwatch. Suggest two problems in deciding when to stop the stopwatch in this investigation. 1. … … 2. … …[2] (b) The student made a stock cleaning solution containing 1 mg cm–3 of subtilisin A, disodium EDTA and a buffered saline solution. The disodium EDTA and the buffered saline solution were the same concentrations as used in the trials. This solution was used to make a range of concentrations that could be used to find the concentration of subtilisin A in the contact lens cleaning solution. (i) Describe how the student could dilute the stock solution to make a range of concentrations to use in their investigation. The student decided to make 50 cm3 of each concentration. … … … … … … … …[3] (ii) State a solution the student should use as a control. Give a reason for your answer. control solution … reason … …[2]
Question paper, page 4
4 9700/51/M/J/15 © UCLES 2015 (c) The student used the apparatus shown in Fig. 1.2 to investigate the effect of different concentrations of subtilisin A on the rate of removal of coloured gelatin from the simulated lenses at 35 °C. (i) Identify the independent and dependent variables in this investigation. independent variable … dependent variable …[2] (ii) Describe a method the student could use to find the effect of different concentrations of subtilisin A on the removal of protein from the simulated lenses. Your method should be detailed enough for another person to follow and should not repeat any details from (b) (i) of how to dilute the stock cleaning solution. … … … … … … … … … … … … … … … … … … … …
Question paper, page 5
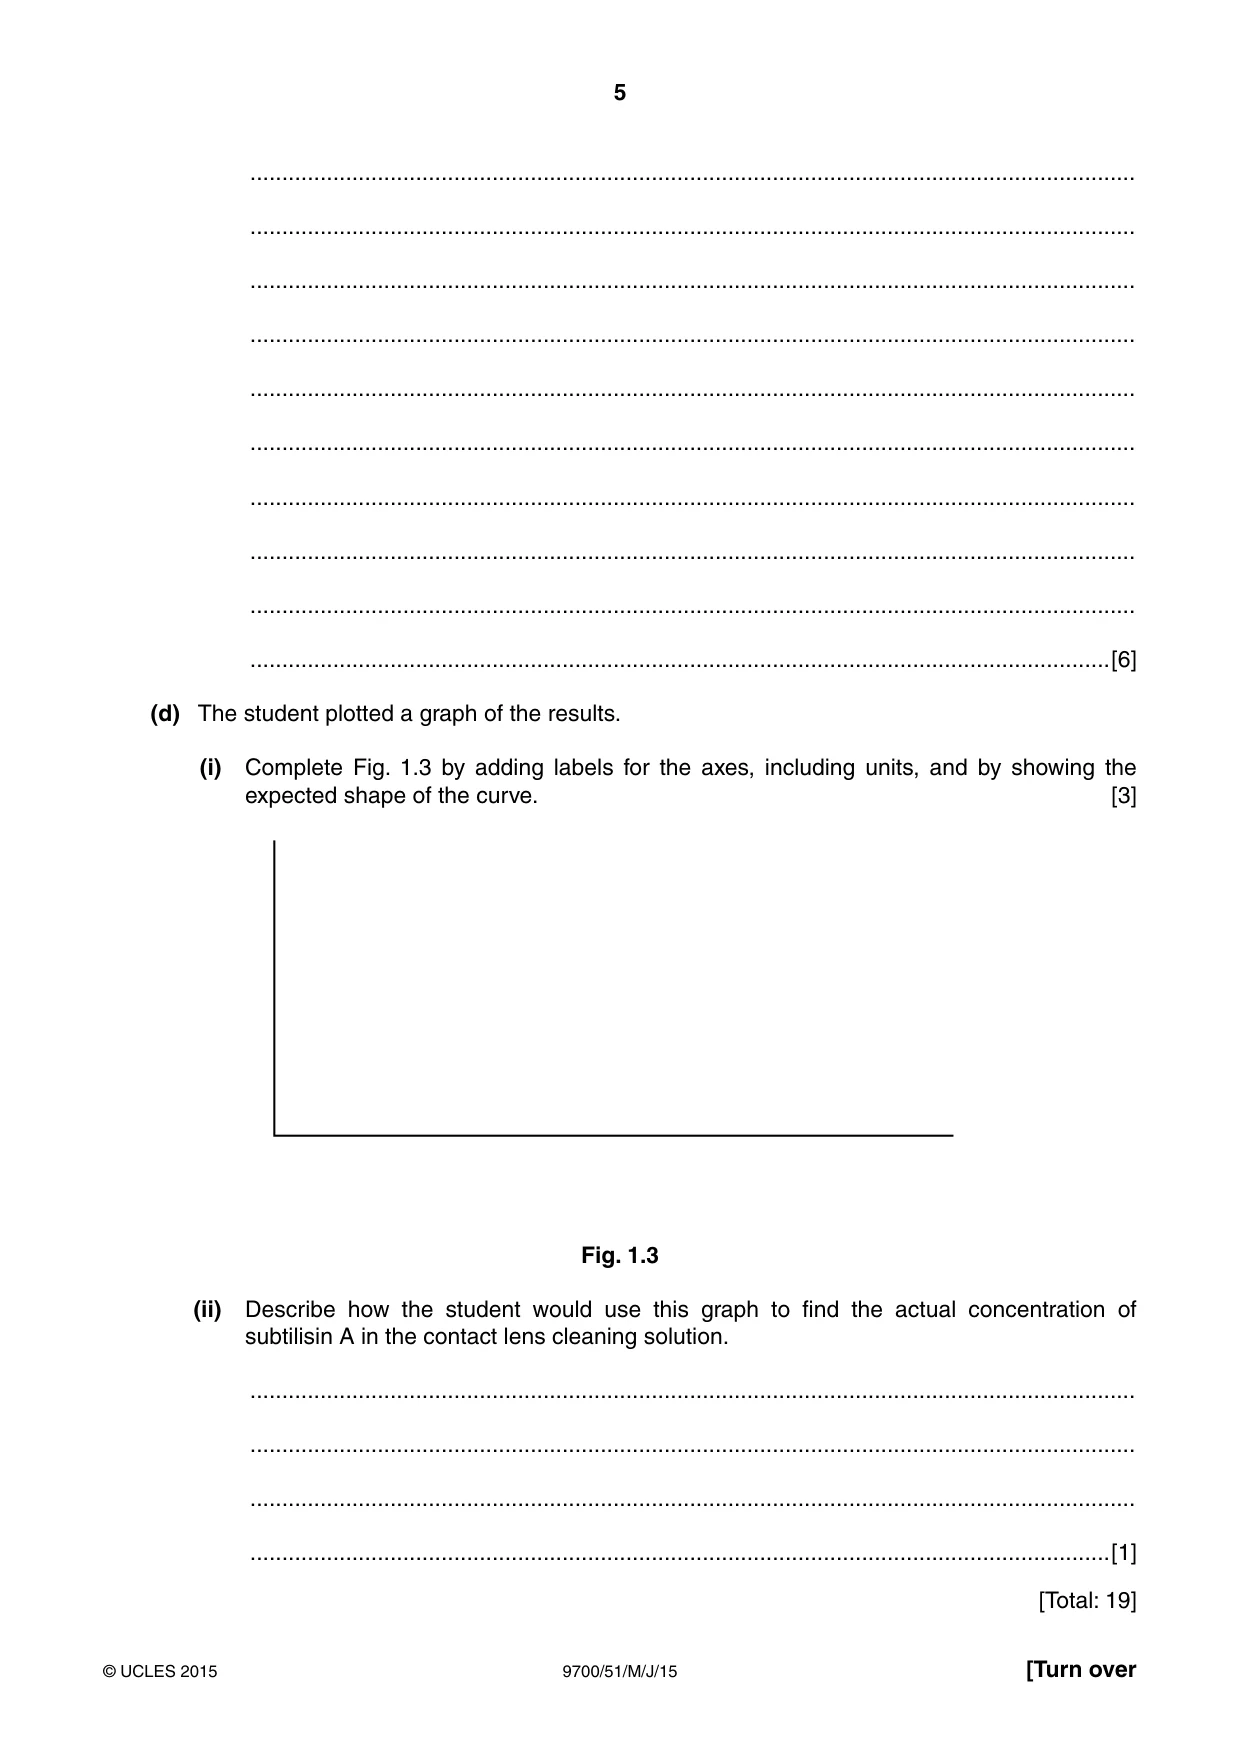
5 9700/51/M/J/15 © UCLES 2015 [Turn over … … … … … … … … … …[6] (d) The student plotted a graph of the results. (i) Complete Fig. 1.3 by adding labels for the axes, including units, and by showing the expected shape of the curve. [3] Fig. 1.3 (ii) Describe how the student would use this graph to find the actual concentration of subtilisin A in the contact lens cleaning solution. … … … …[1] [Total: 19]
Question paper, page 6
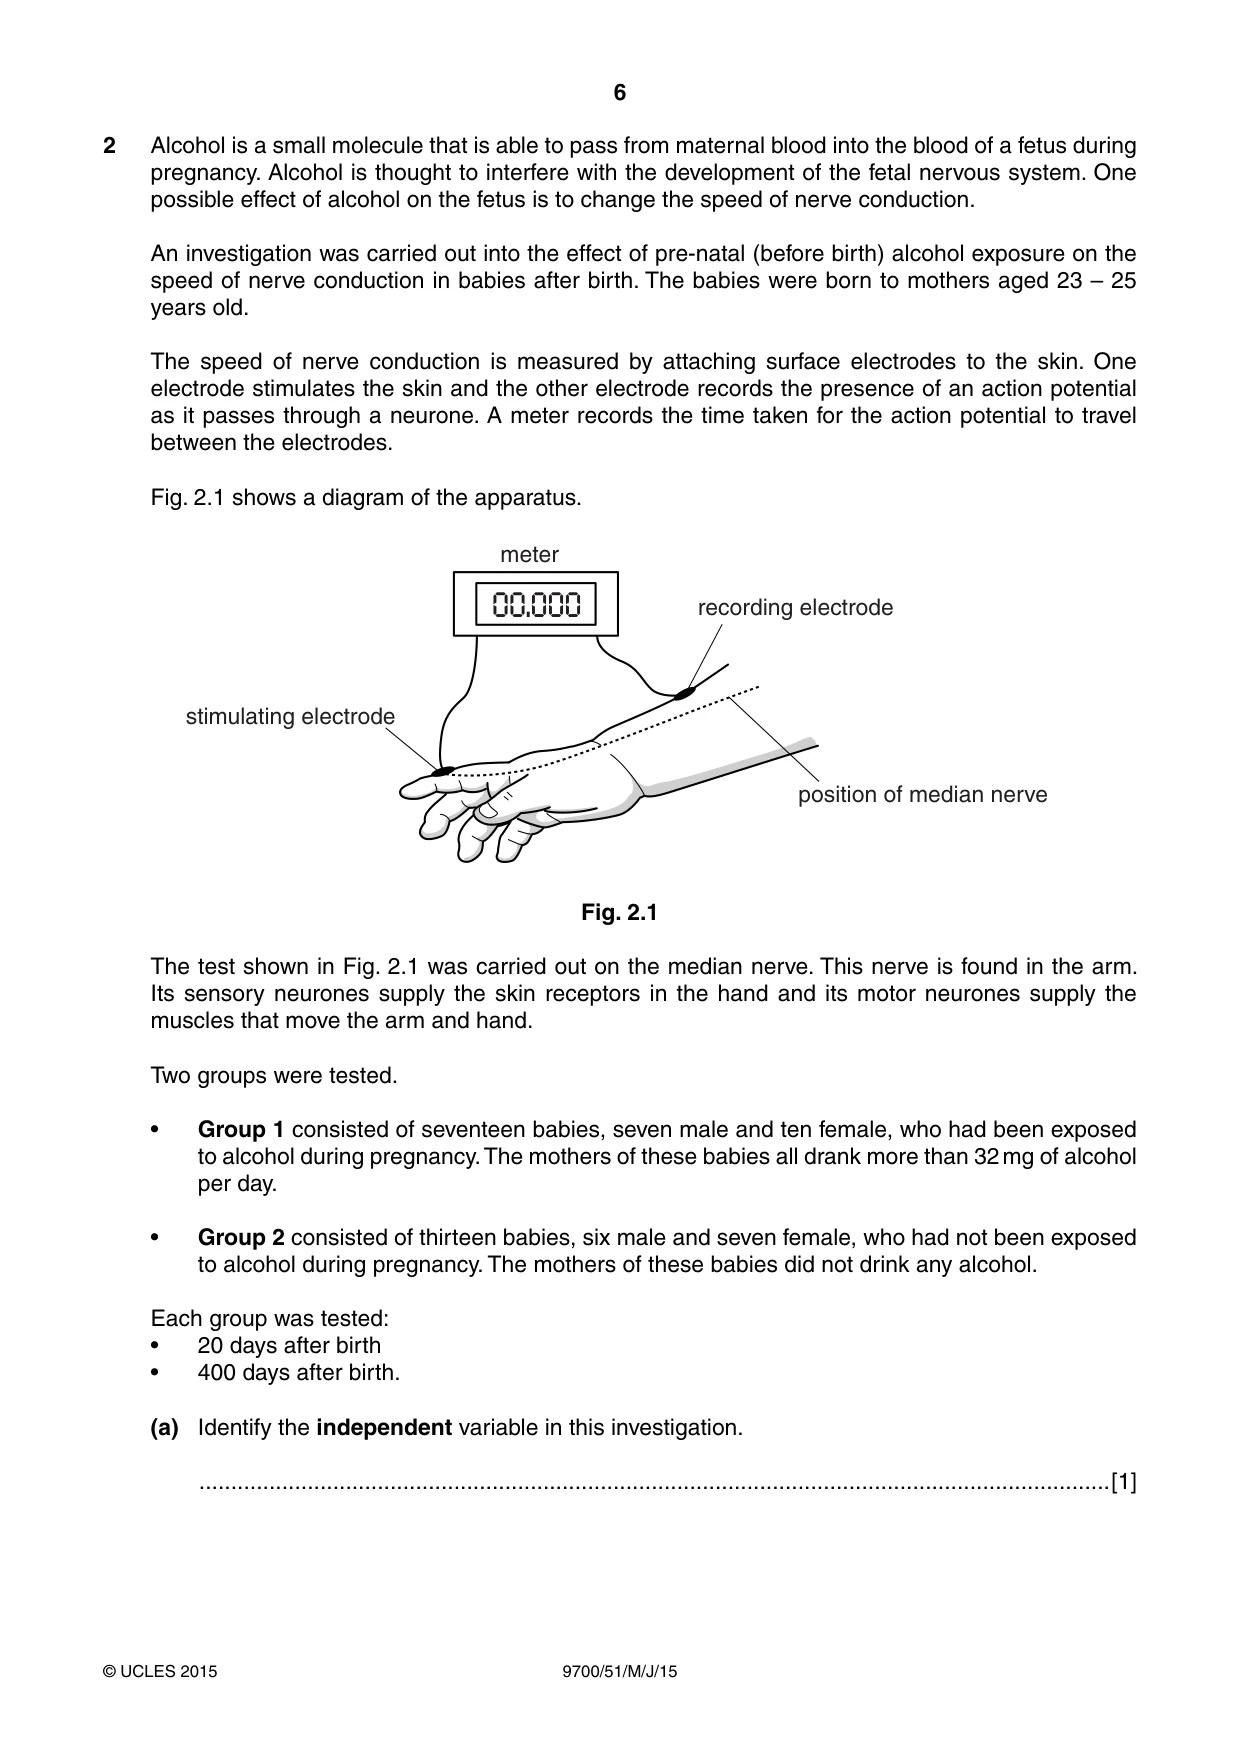
6 9700/51/M/J/15 © UCLES 2015 2 Alcohol is a small molecule that is able to pass from maternal blood into the blood of a fetus during pregnancy. Alcohol is thought to interfere with the development of the fetal nervous system. One possible effect of alcohol on the fetus is to change the speed of nerve conduction. An investigation was carried out into the effect of pre-natal (before birth) alcohol exposure on the speed of nerve conduction in babies after birth. The babies were born to mothers aged 23 – 25 years old. The speed of nerve conduction is measured by attaching surface electrodes to the skin. One electrode stimulates the skin and the other electrode records the presence of an action potential as it passes through a neurone. A meter records the time taken for the action potential to travel between the electrodes. Fig. 2.1 shows a diagram of the apparatus. 00.000 meter recording electrode position of median nerve stimulating electrode Fig. 2.1 The test shown in Fig. 2.1 was carried out on the median nerve. This nerve is found in the arm. Its sensory neurones supply the skin receptors in the hand and its motor neurones supply the muscles that move the arm and hand. Two groups were tested. • Group 1 consisted of seventeen babies, seven male and ten female, who had been exposed to alcohol during pregnancy. The mothers of these babies all drank more than 32 mg of alcohol per day. • Group 2 consisted of thirteen babies, six male and seven female, who had not been exposed to alcohol during pregnancy. The mothers of these babies did not drink any alcohol. Each group was tested: • 20 days after birth • 400 days after birth. (a) Identify the independent variable in this investigation. …[1]
Question paper, page 7
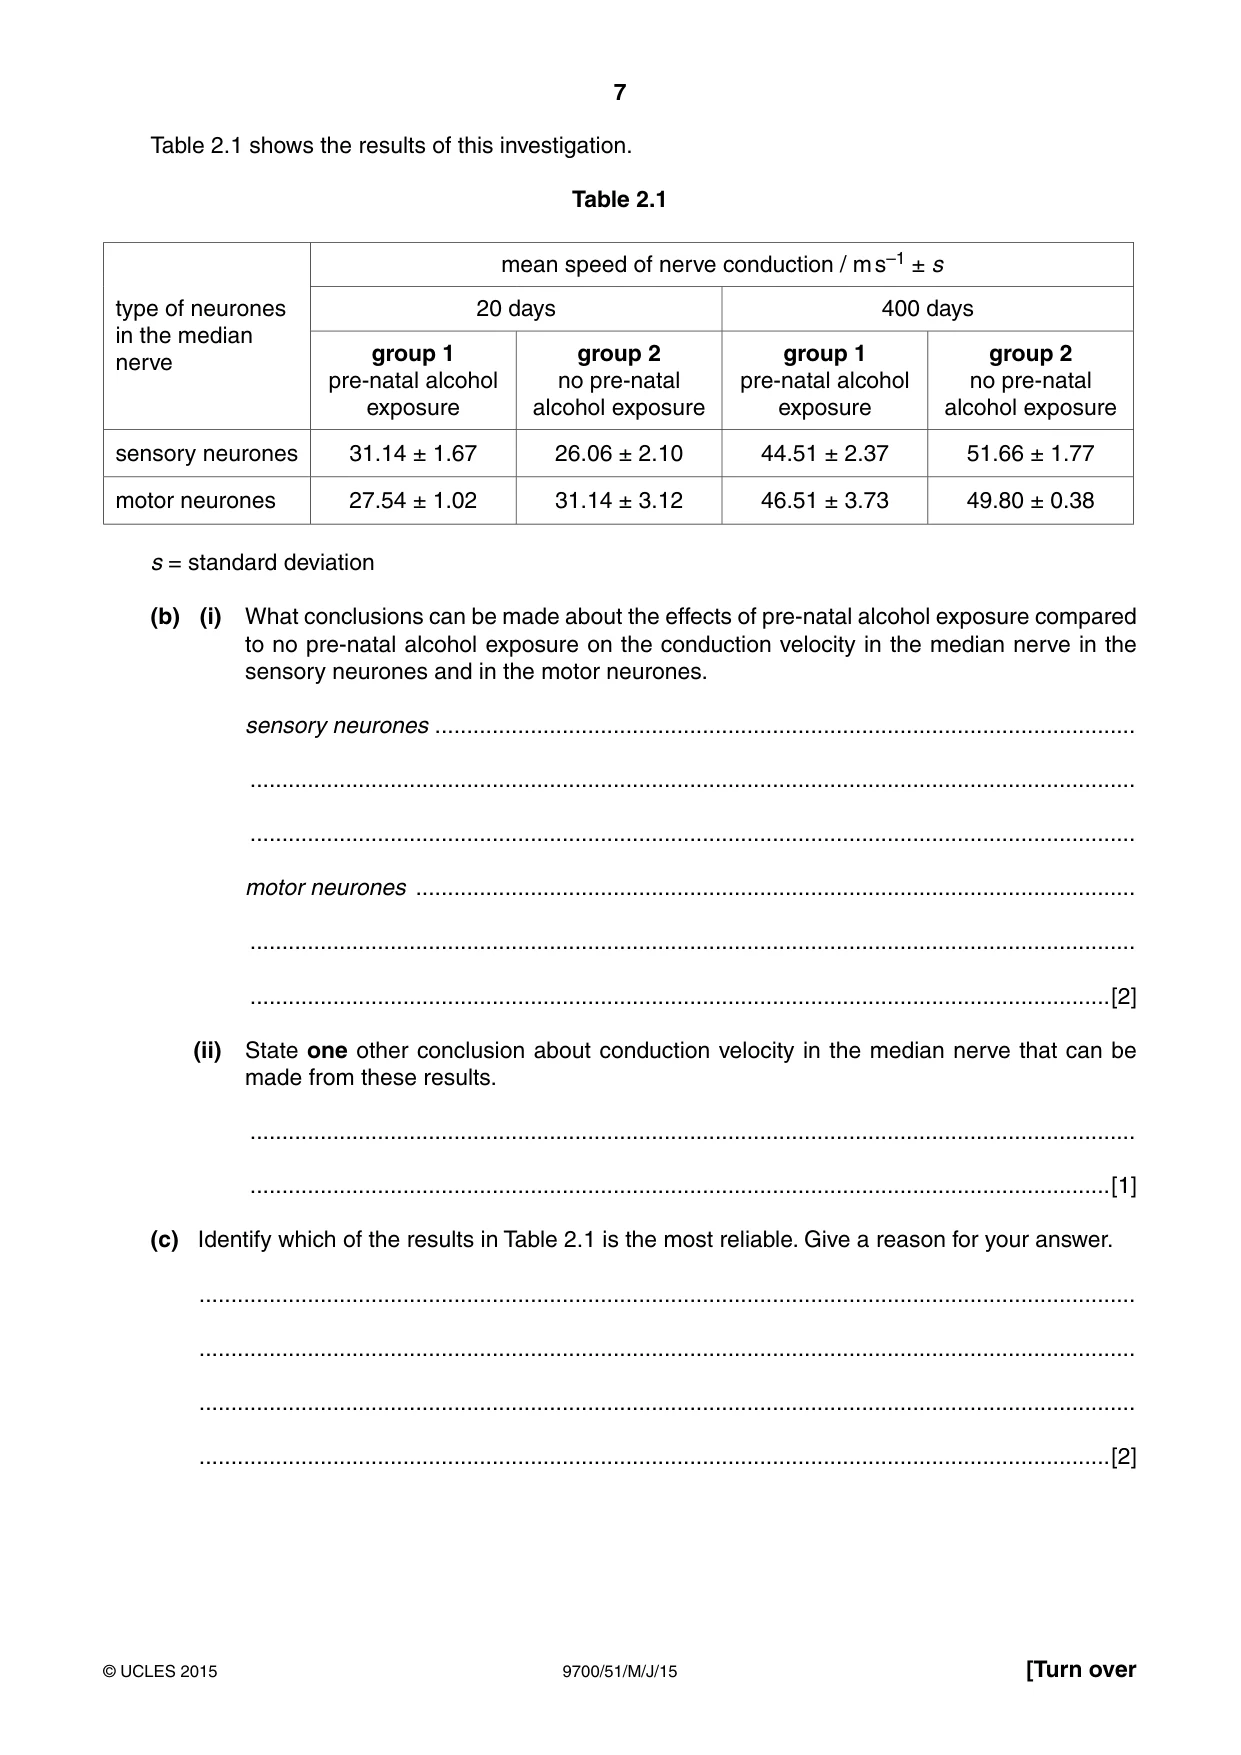
7 9700/51/M/J/15 © UCLES 2015 [Turn over Table 2.1 shows the results of this investigation. Table 2.1 type of neurones in the median nerve mean speed of nerve conduction / m s–1 ± s 20 days 400 days group 1 pre-natal alcohol exposure group 2 no pre-natal alcohol exposure group 1 pre-natal alcohol exposure group 2 no pre-natal alcohol exposure sensory neurones 31.14 ± 1.67 26.06 ± 2.10 44.51 ± 2.37 51.66 ± 1.77 motor neurones 27.54 ± 1.02 31.14 ± 3.12 46.51 ± 3.73 49.80 ± 0.38 s = standard deviation (b) (i) What conclusions can be made about the effects of pre-natal alcohol exposure compared to no pre-natal alcohol exposure on the conduction velocity in the median nerve in the sensory neurones and in the motor neurones. sensory neurones … … … motor neurones … … …[2] (ii) State one other conclusion about conduction velocity in the median nerve that can be made from these results. … …[1] (c) Identify which of the results in Table 2.1 is the most reliable. Give a reason for your answer. … … … …[2]
Question paper, page 8
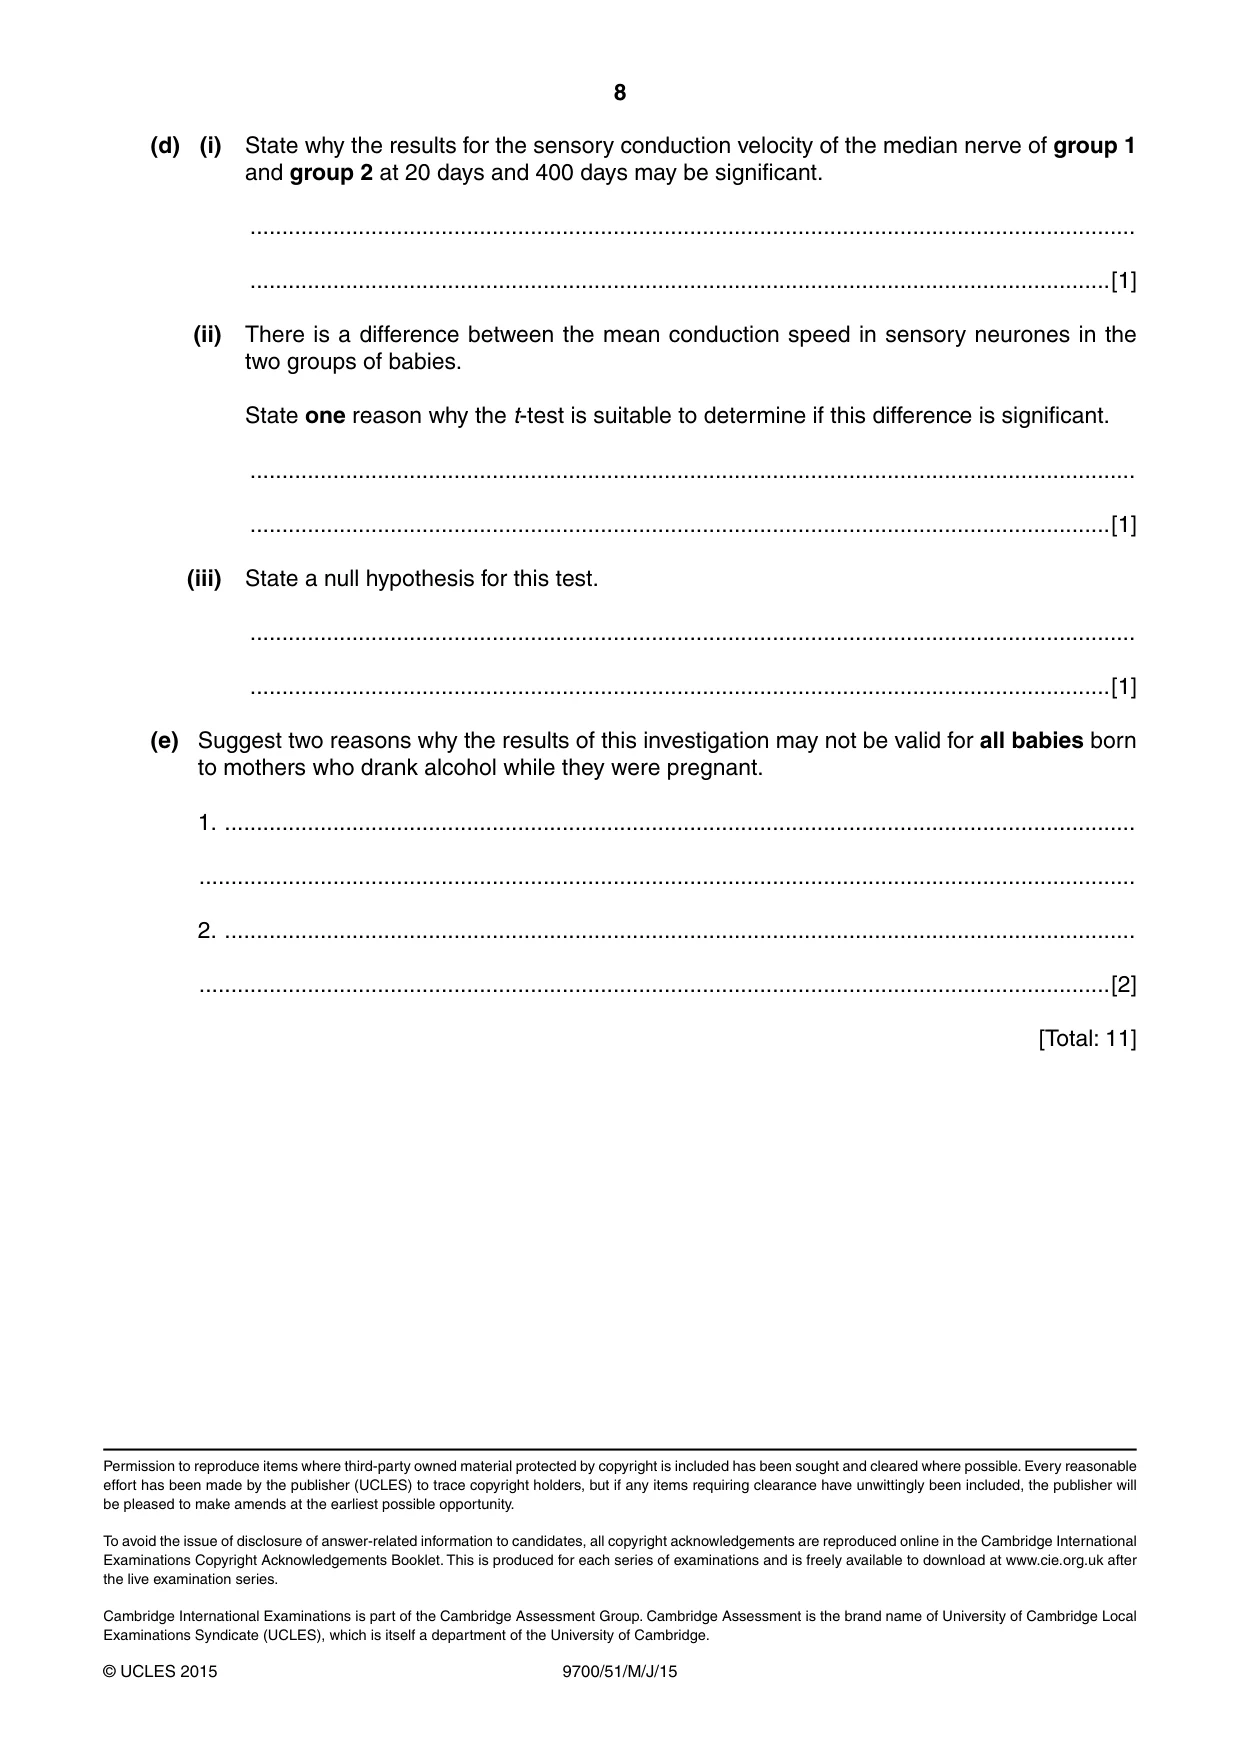
8 9700/51/M/J/15 © UCLES 2015 (d) (i) State why the results for the sensory conduction velocity of the median nerve of group 1 and group 2 at 20 days and 400 days may be significant. … …[1] (ii) There is a difference between the mean conduction speed in sensory neurones in the two groups of babies. State one reason why the t-test is suitable to determine if this difference is significant. … …[1] (iii) State a null hypothesis for this test. … …[1] (e) Suggest two reasons why the results of this investigation may not be valid for all babies born to mothers who drank alcohol while they were pregnant. 1. … … 2. … …[2] [Total: 11] Permission to reproduce items where third-party owned material protected by copyright is included has been sought and cleared where possible. Every reasonable effort has been made by the publisher (UCLES) to trace copyright holders, but if any items requiring clearance have unwittingly been included, the publisher will be pleased to make amends at the earliest possible opportunity. To avoid the issue of disclosure of answer-related information to candidates, all copyright acknowledgements are reproduced online in the Cambridge International Examinations Copyright Acknowledgements Booklet. This is produced for each series of examinations and is freely available to download at www.cie.org.uk after the live examination series. Cambridge International Examinations is part of the Cambridge Assessment Group. Cambridge Assessment is the brand name of University of Cambridge Local Examinations Syndicate (UCLES), which is itself a department of the University of Cambridge.
Mark scheme, page 1
® IGCSE is the registered trademark of Cambridge International Examinations. CAMBRIDGE INTERNATIONAL EXAMINATIONS Cambridge International Advanced Subsidiary and Advanced Level MARK SCHEME for the May/June 2015 series 9700 BIOLOGY 9700/51 Paper 5 (Planning, Analysis and Evaluation), maximum raw mark 30 This mark scheme is published as an aid to teachers and candidates, to indicate the requirements of the examination. It shows the basis on which Examiners were instructed to award marks. It does not indicate the details of the discussions that took place at an Examiners’ meeting before marking began, which would have considered the acceptability of alternative answers. Mark schemes should be read in conjunction with the question paper and the Principal Examiner Report for Teachers. Cambridge will not enter into discussions about these mark schemes. Cambridge is publishing the mark schemes for the May/June 2015 series for most Cambridge IGCSE®, Cambridge International A and AS Level components and some Cambridge O Level components.
Mark scheme, page 2
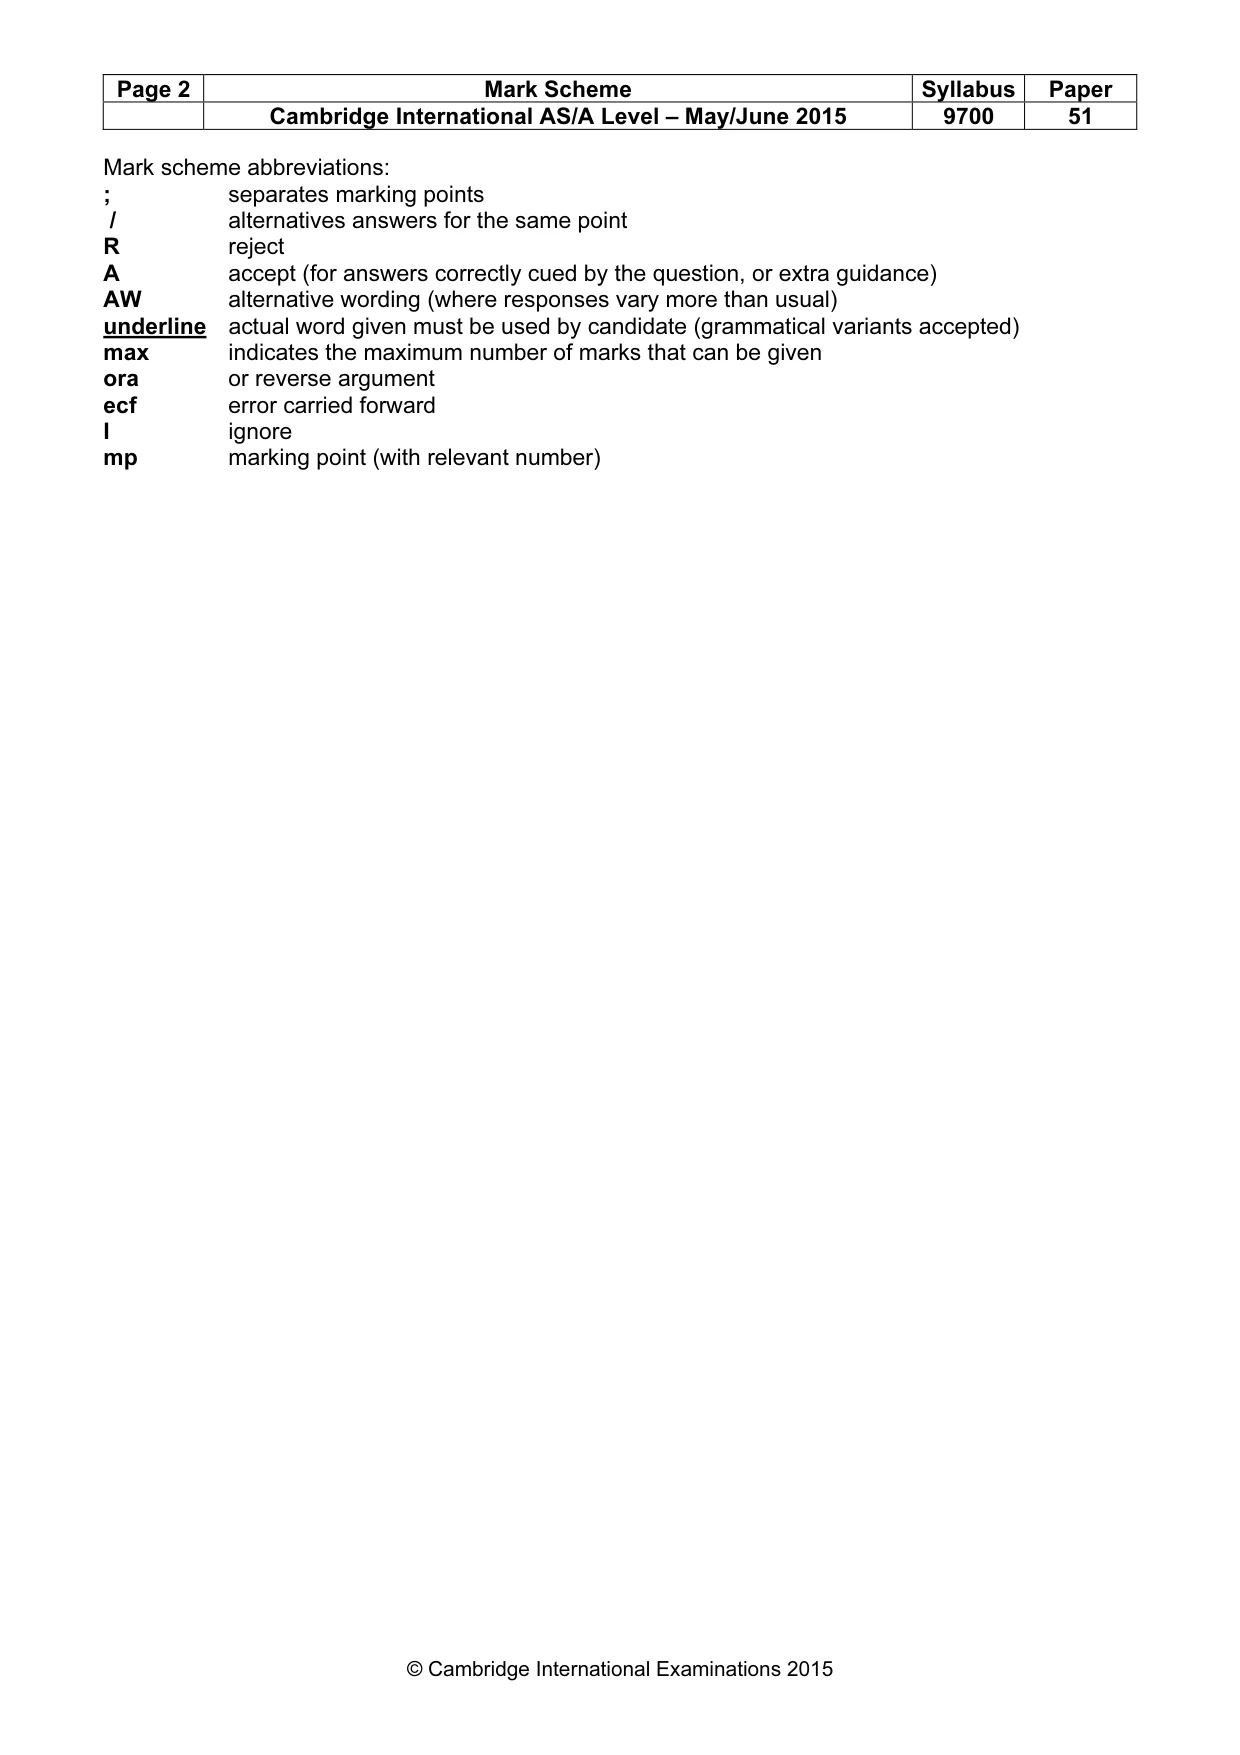
Page 2 Mark Scheme Syllabus Paper Cambridge International AS/A Level – May/June 2015 9700 51 © Cambridge International Examinations 2015 Mark scheme abbreviations: ; separates marking points / alternatives answers for the same point R reject A accept (for answers correctly cued by the question, or extra guidance) AW alternative wording (where responses vary more than usual) underline actual word given must be used by candidate (grammatical variants accepted) max indicates the maximum number of marks that can be given ora or reverse argument ecf error carried forward I ignore mp marking point (with relevant number)
Mark scheme, page 3
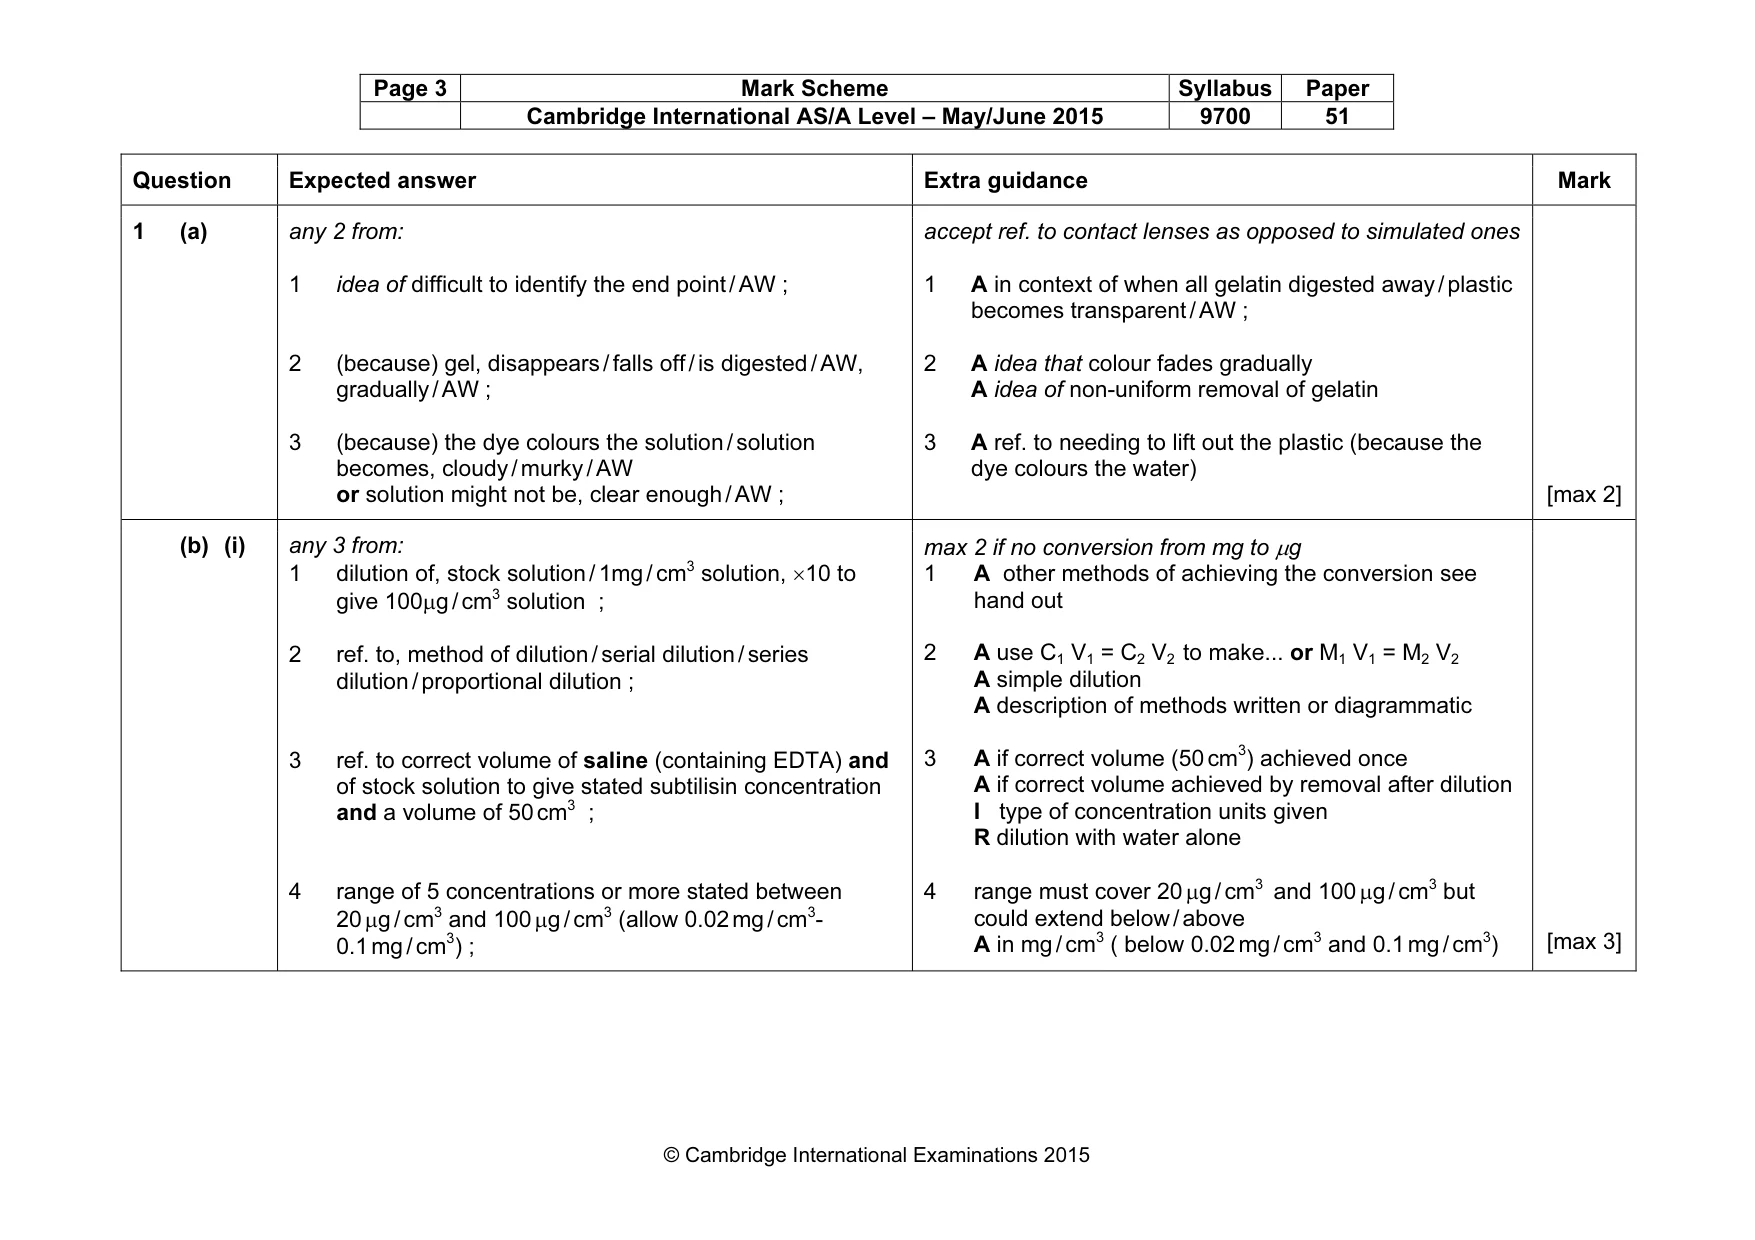
Page 3 Mark Scheme Syllabus Paper Cambridge International AS/A Level – May/June 2015 9700 51 © Cambridge International Examinations 2015 Question Expected answer Extra guidance Mark 1 (a) any 2 from: 1 idea of difficult to identify the end point / AW ; 2 (because) gel, disappears / falls off / is digested / AW, gradually / AW ; 3 (because) the dye colours the solution / solution becomes, cloudy / murky / AW or solution might not be, clear enough / AW ; accept ref. to contact lenses as opposed to simulated ones 1 A in context of when all gelatin digested away / plastic becomes transparent / AW ; 2 A idea that colour fades gradually A idea of non-uniform removal of gelatin 3 A ref. to needing to lift out the plastic (because the dye colours the water) [max 2] (b) (i) any 3 from: 1 dilution of, stock solution / 1mg / cm3 solution, ×10 to give 100µg / cm3 solution ; 2 ref. to, method of dilution / serial dilution / series dilution / proportional dilution ; 3 ref. to correct volume of saline (containing EDTA) and of stock solution to give stated subtilisin concentration and a volume of 50 cm3 ; 4 range of 5 concentrations or more stated between 20 µg / cm3 and 100 µg / cm3 (allow 0.02 mg / cm3- 0.1 mg / cm3) ; max 2 if no conversion from mg to µg 1 A other methods of achieving the conversion see hand out 2 A use C1 V1 = C2 V2 to make... or M1 V1 = M2 V2 A simple dilution A description of methods written or diagrammatic 3 A if correct volume (50 cm3) achieved once A if correct volume achieved by removal after dilution I type of concentration units given R dilution with water alone 4 range must cover 20 µg / cm3 and 100 µg / cm3 but could extend below / above A in mg / cm3 ( below 0.02 mg / cm3 and 0.1 mg / cm3) [max 3]
Mark scheme, page 4
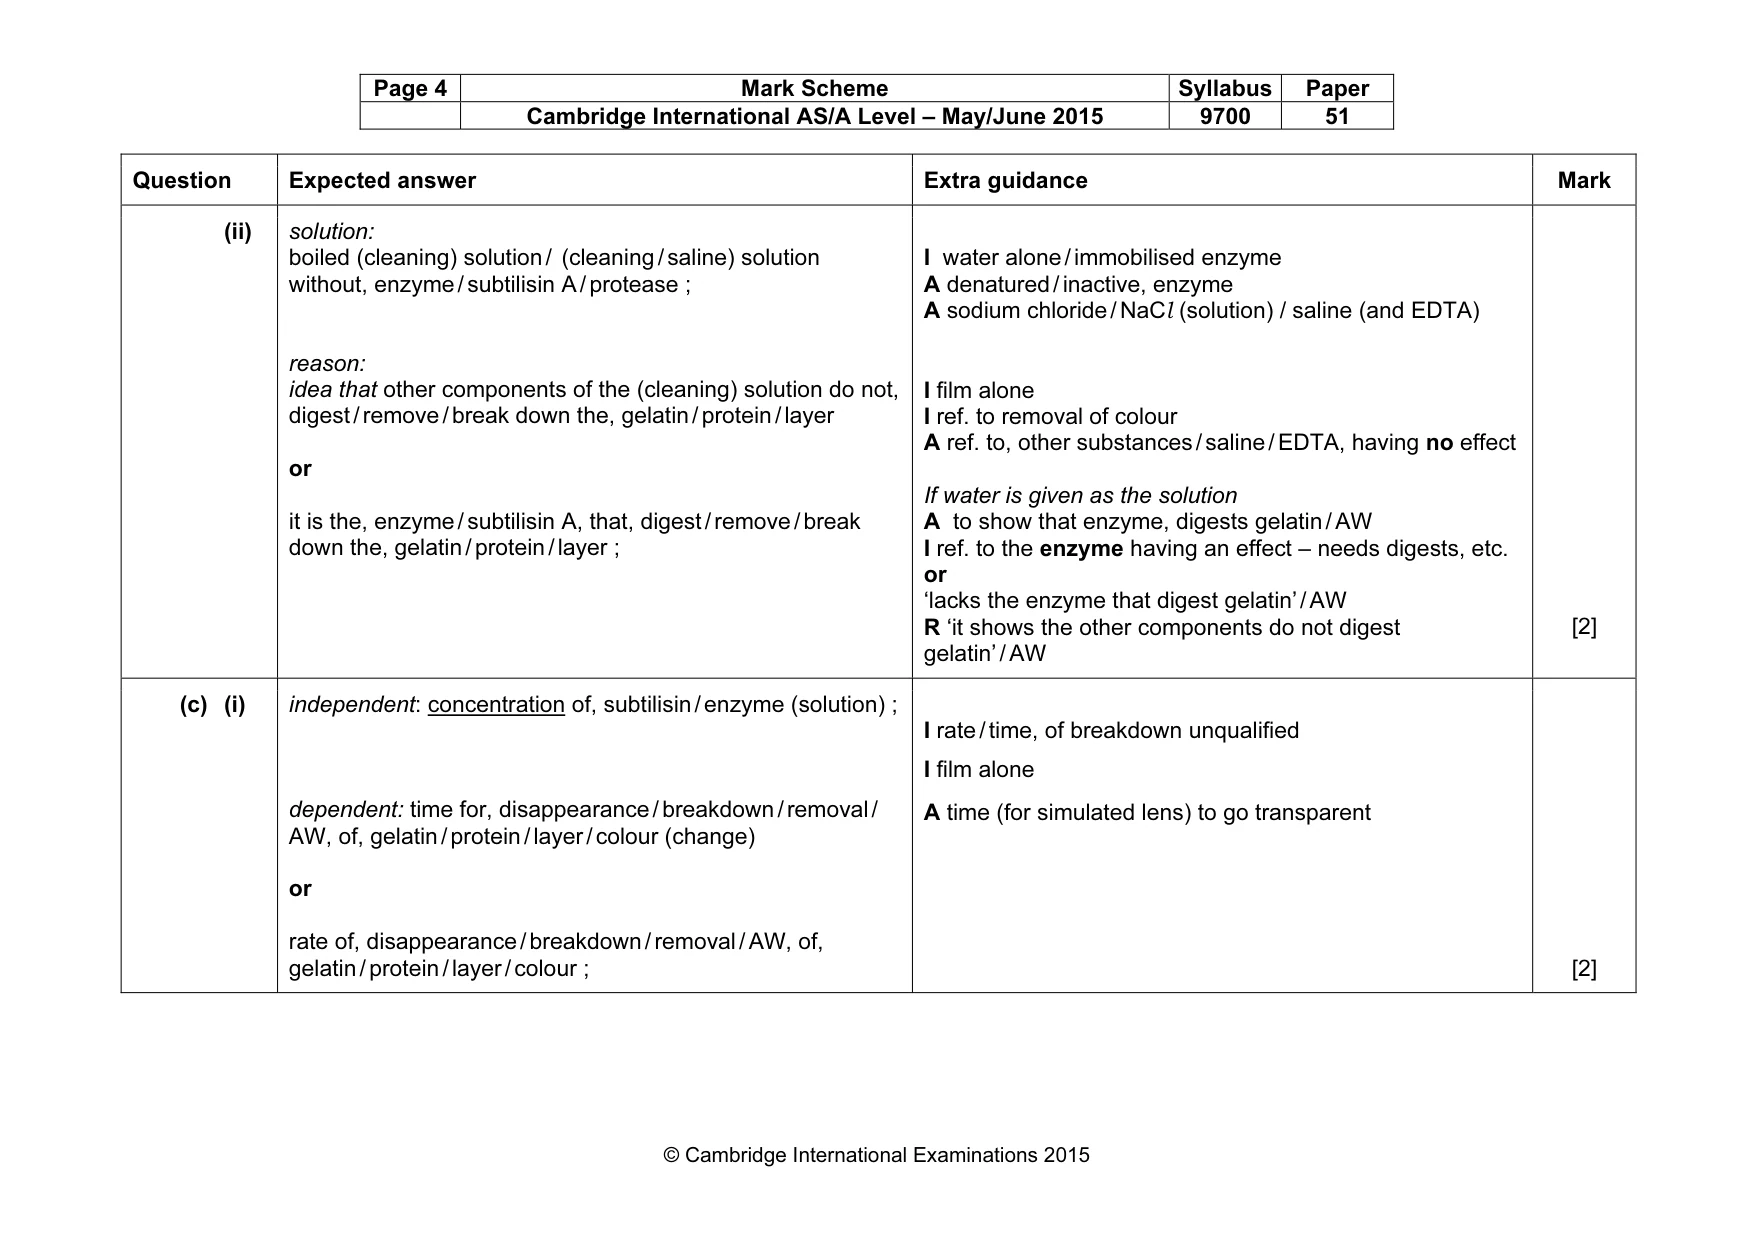
Page 4 Mark Scheme Syllabus Paper Cambridge International AS/A Level – May/June 2015 9700 51 © Cambridge International Examinations 2015 Question Expected answer Extra guidance Mark (ii) solution: boiled (cleaning) solution / (cleaning / saline) solution without, enzyme / subtilisin A / protease ; reason: idea that other components of the (cleaning) solution do not, digest / remove / break down the, gelatin / protein / layer or it is the, enzyme / subtilisin A, that, digest / remove / break down the, gelatin / protein / layer ; I water alone / immobilised enzyme A denatured / inactive, enzyme A sodium chloride / NaCl (solution) / saline (and EDTA) I film alone I ref. to removal of colour A ref. to, other substances / saline / EDTA, having no effect If water is given as the solution A to show that enzyme, digests gelatin / AW I ref. to the enzyme having an effect – needs digests, etc. or ‘lacks the enzyme that digest gelatin’ / AW R ‘it shows the other components do not digest gelatin’ / AW [2] (c) (i) independent: concentration of, subtilisin / enzyme (solution) ; dependent: time for, disappearance / breakdown / removal / AW, of, gelatin / protein / layer / colour (change) or rate of, disappearance / breakdown / removal / AW, of, gelatin / protein / layer / colour ; I rate / time, of breakdown unqualified I film alone A time (for simulated lens) to go transparent [2]
Mark scheme, page 5
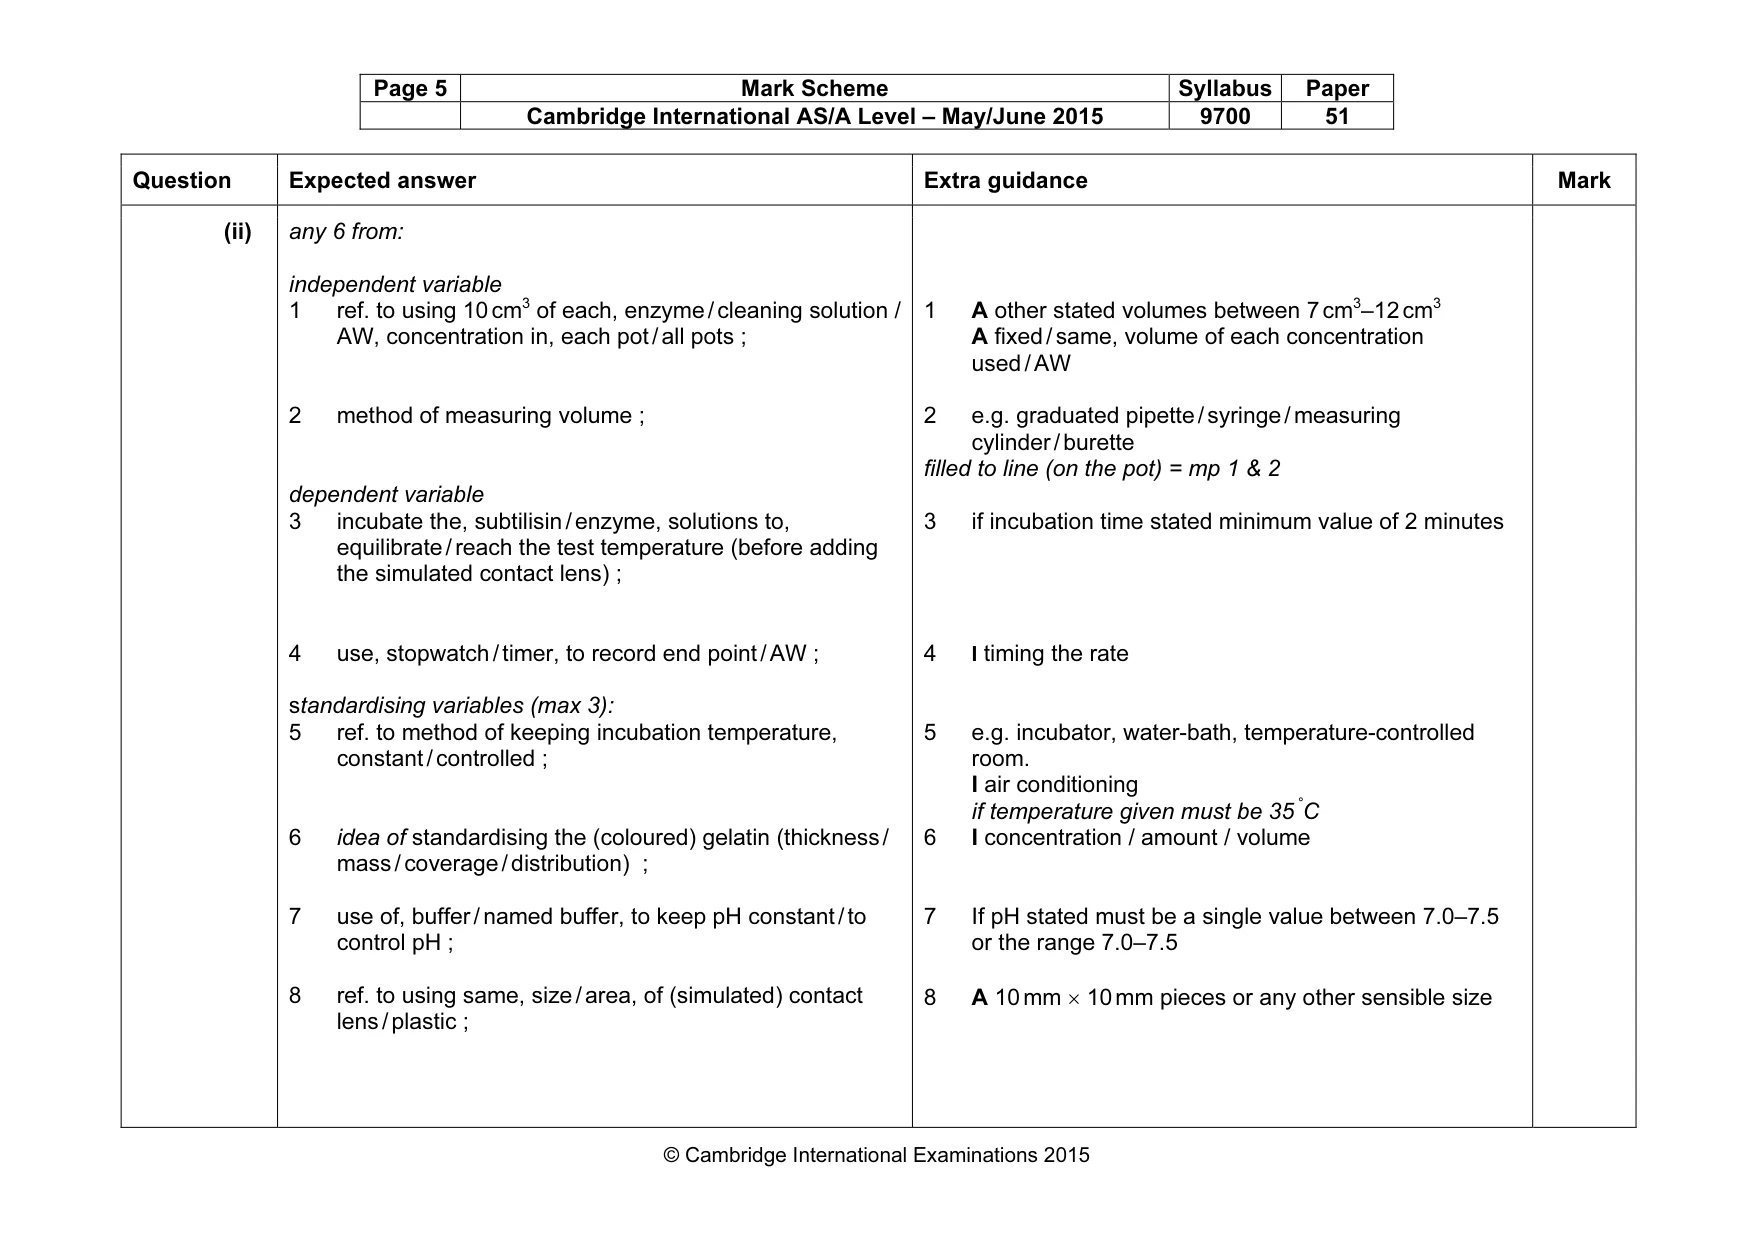
Page 5 Mark Scheme Syllabus Paper Cambridge International AS/A Level – May/June 2015 9700 51 © Cambridge International Examinations 2015 Question Expected answer Extra guidance Mark (ii) any 6 from: independent variable 1 ref. to using 10 cm3 of each, enzyme / cleaning solution / AW, concentration in, each pot / all pots ; 2 method of measuring volume ; dependent variable 3 incubate the, subtilisin / enzyme, solutions to, equilibrate / reach the test temperature (before adding the simulated contact lens) ; 4 use, stopwatch / timer, to record end point / AW ; standardising variables (max 3): 5 ref. to method of keeping incubation temperature, constant / controlled ; 6 idea of standardising the (coloured) gelatin (thickness / mass / coverage / distribution) ; 7 use of, buffer / named buffer, to keep pH constant / to control pH ; 8 ref. to using same, size / area, of (simulated) contact lens / plastic ; 1 A other stated volumes between 7 cm3–12 cm3 A fixed / same, volume of each concentration used / AW 2 e.g. graduated pipette / syringe / measuring cylinder / burette filled to line (on the pot) = mp 1 & 2 3 if incubation time stated minimum value of 2 minutes 4 I timing the rate 5 e.g. incubator, water-bath, temperature-controlled room. I air conditioning if temperature given must be 35 °C 6 I concentration / amount / volume 7 If pH stated must be a single value between 7.0–7.5 or the range 7.0–7.5 8 A 10 mm × 10 mm pieces or any other sensible size
Mark scheme, page 6
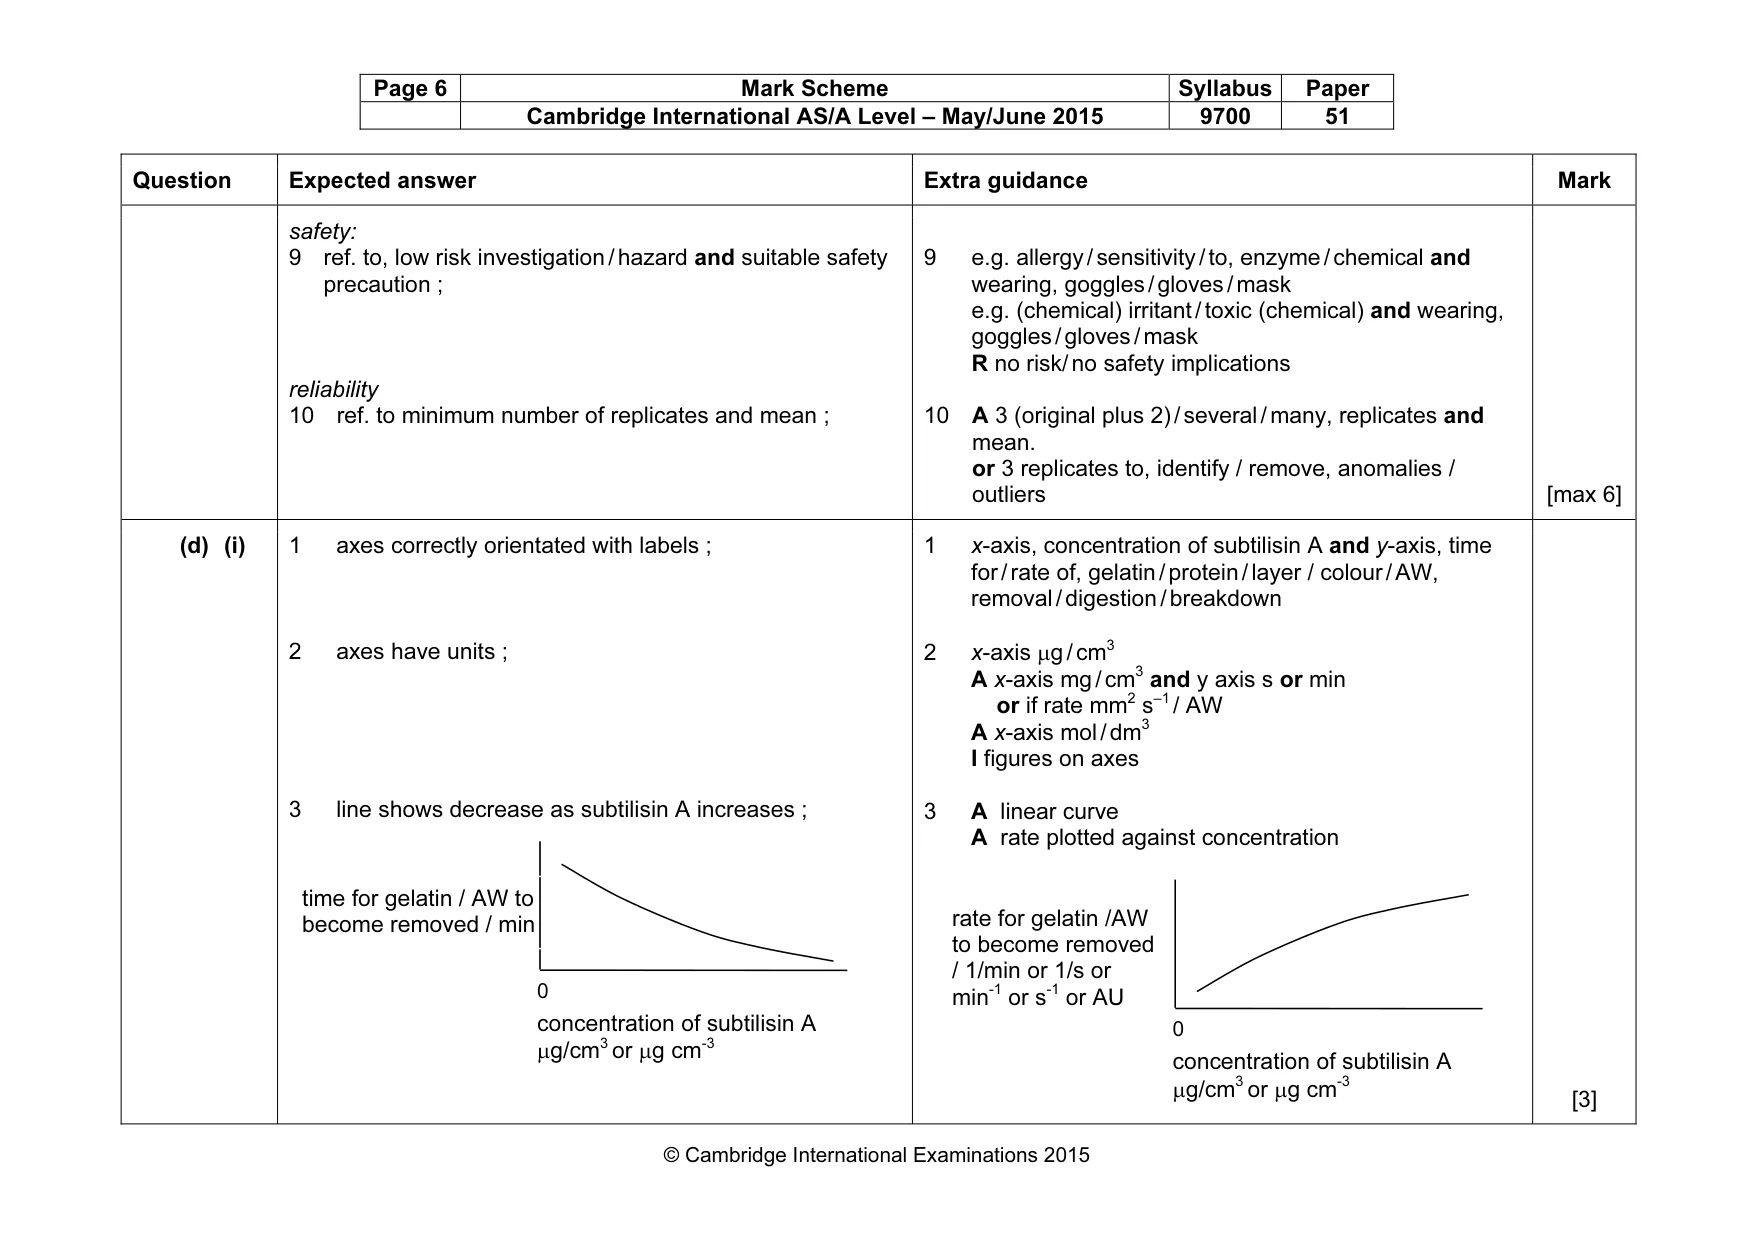
Page 6 Mark Scheme Syllabus Paper Cambridge International AS/A Level – May/June 2015 9700 51 © Cambridge International Examinations 2015 Question Expected answer Extra guidance Mark safety: 9 ref. to, low risk investigation / hazard and suitable safety precaution ; reliability 10 ref. to minimum number of replicates and mean ; 9 e.g. allergy / sensitivity / to, enzyme / chemical and wearing, goggles / gloves / mask e.g. (chemical) irritant / toxic (chemical) and wearing, goggles / gloves / mask R no risk/ no safety implications 10 A 3 (original plus 2) / several / many, replicates and mean. or 3 replicates to, identify / remove, anomalies / outliers [max 6] (d) (i) 1 axes correctly orientated with labels ; 2 axes have units ; 3 line shows decrease as subtilisin A increases ; 1 x-axis, concentration of subtilisin A and y-axis, time for / rate of, gelatin / protein / layer / colour / AW, removal / digestion / breakdown 2 x-axis µg / cm3 A x-axis mg / cm3 and y axis s or min or if rate mm2 s–1 / AW A x-axis mol / dm3 I figures on axes 3 A linear curve A rate plotted against concentration [3] concentration of subtilisin A µg/cm3 or µg cm-3 time for gelatin / AW to become removed / min 0 concentration of subtilisin A µg/cm3 or µg cm-3 rate for gelatin /AW to become removed / 1/min or 1/s or min-1 or s-1 or AU 0
Mark scheme, page 7
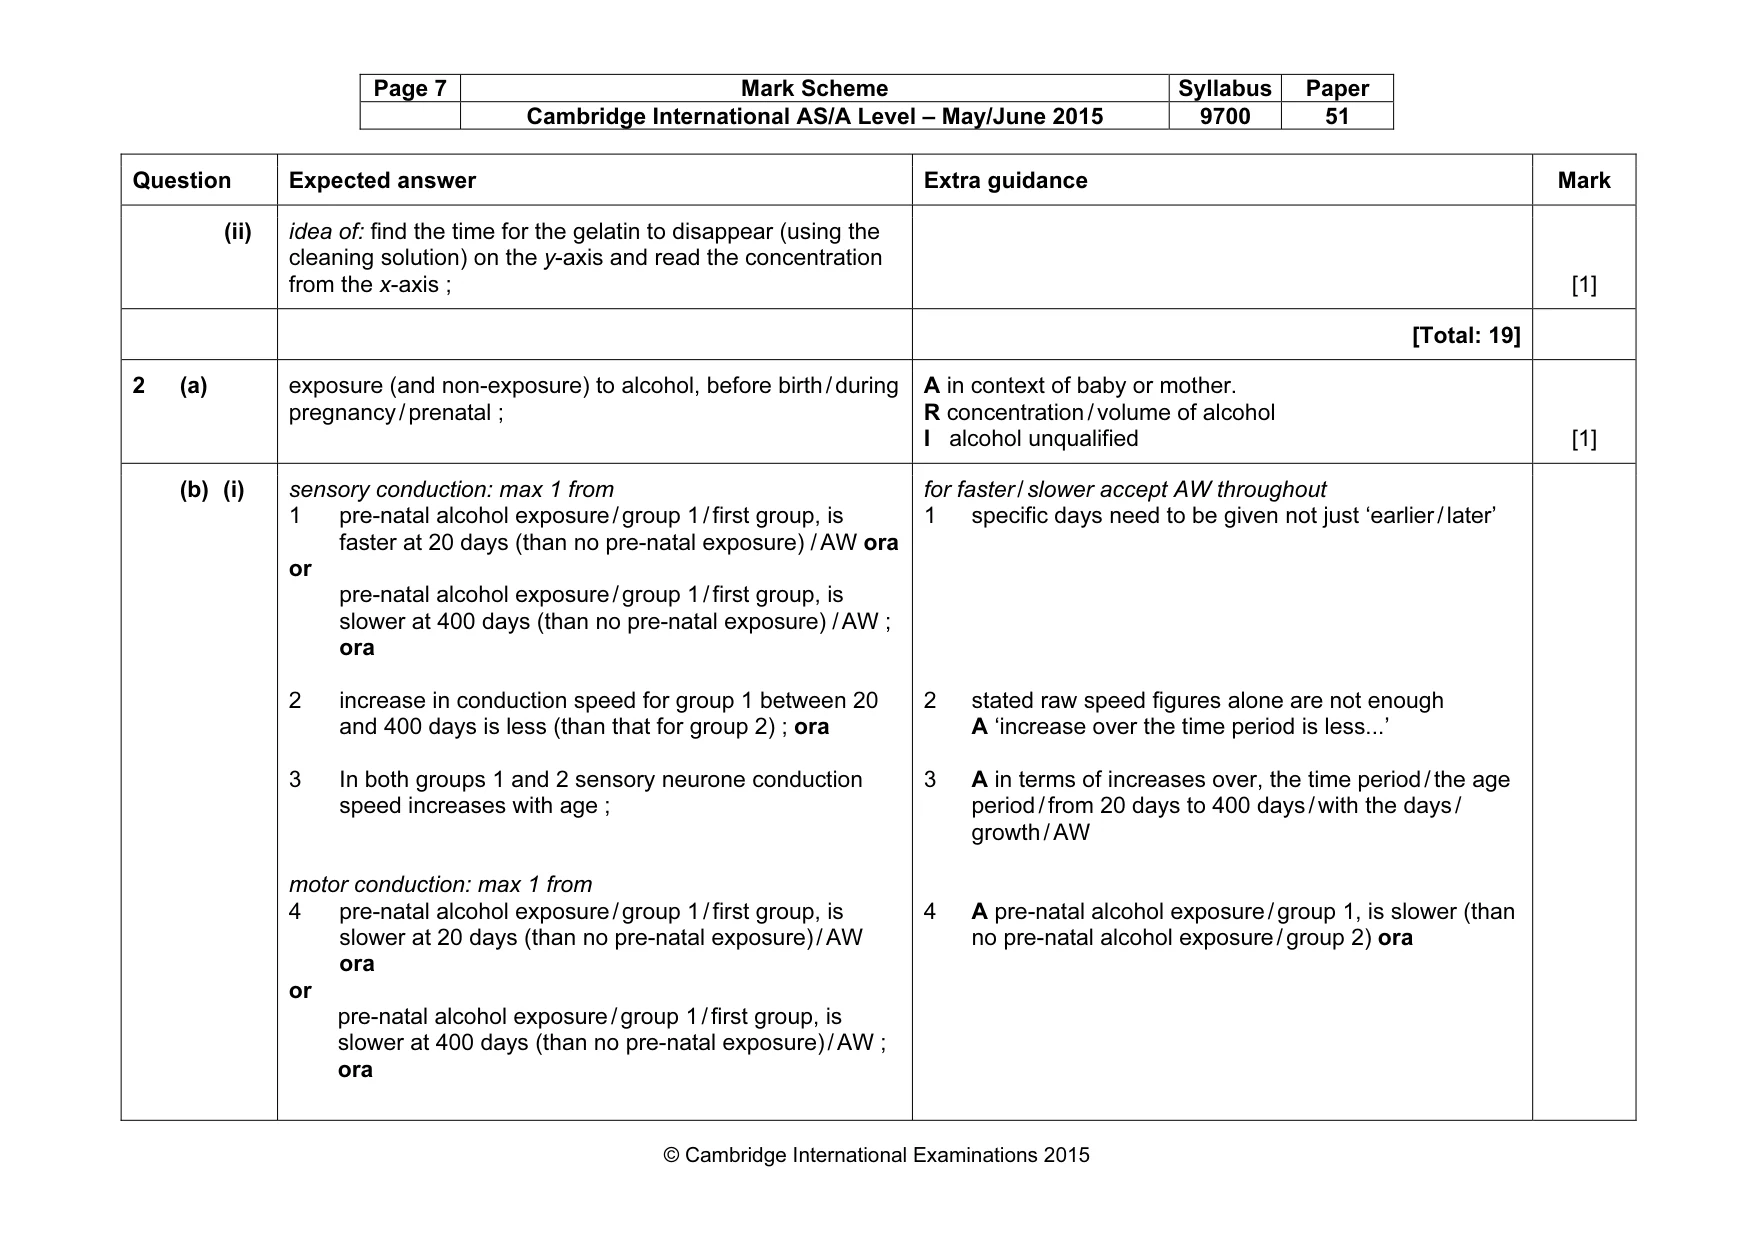
Page 7 Mark Scheme Syllabus Paper Cambridge International AS/A Level – May/June 2015 9700 51 © Cambridge International Examinations 2015 Question Expected answer Extra guidance Mark (ii) idea of: find the time for the gelatin to disappear (using the cleaning solution) on the y-axis and read the concentration from the x-axis ; [1] [Total: 19] 2 (a) exposure (and non-exposure) to alcohol, before birth / during pregnancy / prenatal ; A in context of baby or mother. R concentration / volume of alcohol I alcohol unqualified [1] (b) (i) sensory conduction: max 1 from 1 pre-natal alcohol exposure / group 1 / first group, is faster at 20 days (than no pre-natal exposure) / AW ora or pre-natal alcohol exposure / group 1 / first group, is slower at 400 days (than no pre-natal exposure) / AW ; ora 2 increase in conduction speed for group 1 between 20 and 400 days is less (than that for group 2) ; ora 3 In both groups 1 and 2 sensory neurone conduction speed increases with age ; motor conduction: max 1 from 4 pre-natal alcohol exposure / group 1 / first group, is slower at 20 days (than no pre-natal exposure) / AW ora or pre-natal alcohol exposure / group 1 / first group, is slower at 400 days (than no pre-natal exposure) / AW ; ora for faster / slower accept AW throughout 1 specific days need to be given not just ‘earlier / later’ 2 stated raw speed figures alone are not enough A ‘increase over the time period is less...’ 3 A in terms of increases over, the time period / the age period / from 20 days to 400 days / with the days / growth / AW 4 A pre-natal alcohol exposure / group 1, is slower (than no pre-natal alcohol exposure / group 2) ora
Mark scheme, page 8
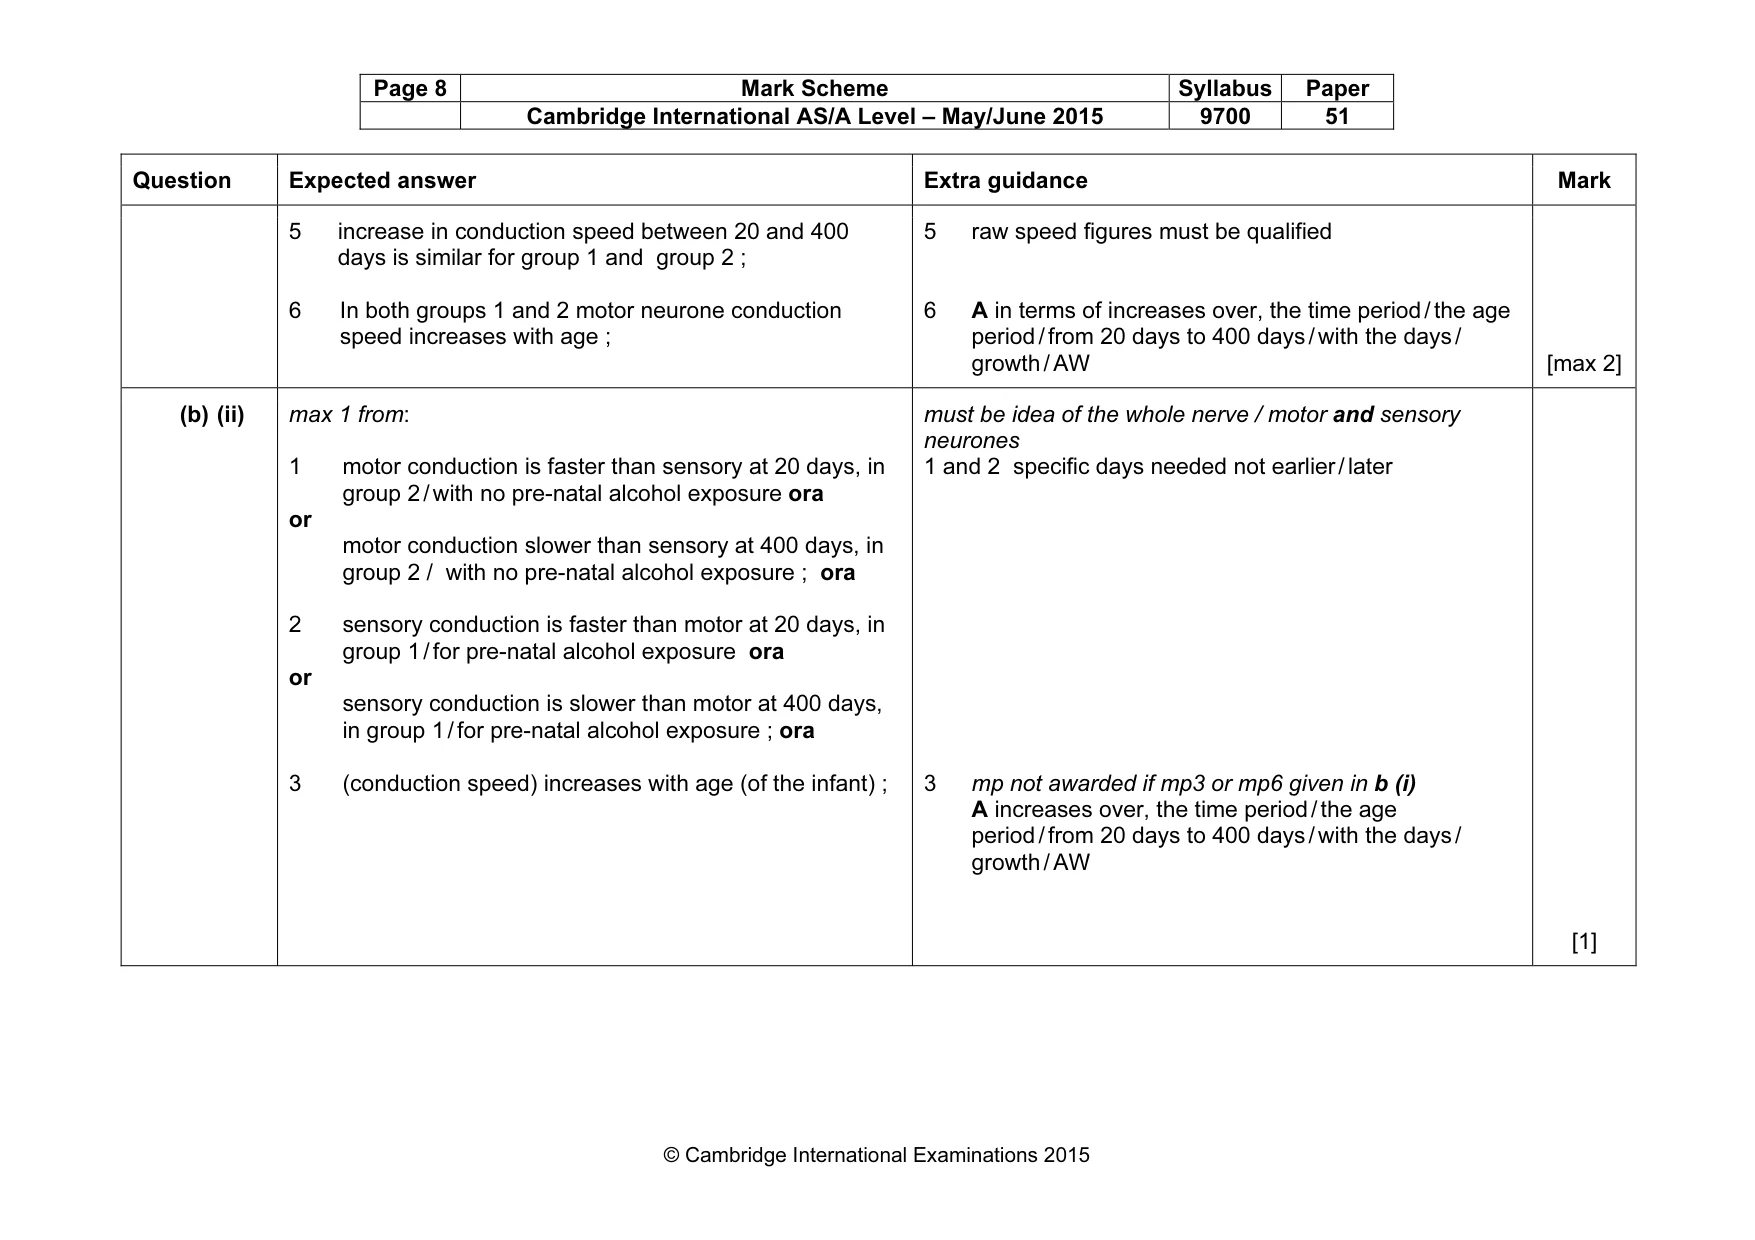
Page 8 Mark Scheme Syllabus Paper Cambridge International AS/A Level – May/June 2015 9700 51 © Cambridge International Examinations 2015 Question Expected answer Extra guidance Mark 5 increase in conduction speed between 20 and 400 days is similar for group 1 and group 2 ; 6 In both groups 1 and 2 motor neurone conduction speed increases with age ; 5 raw speed figures must be qualified 6 A in terms of increases over, the time period / the age period / from 20 days to 400 days / with the days / growth / AW [max 2] (b) (ii) max 1 from: 1 motor conduction is faster than sensory at 20 days, in group 2 / with no pre-natal alcohol exposure ora or motor conduction slower than sensory at 400 days, in group 2 / with no pre-natal alcohol exposure ; ora 2 sensory conduction is faster than motor at 20 days, in group 1 / for pre-natal alcohol exposure ora or sensory conduction is slower than motor at 400 days, in group 1 / for pre-natal alcohol exposure ; ora 3 (conduction speed) increases with age (of the infant) ; must be idea of the whole nerve / motor and sensory neurones 1 and 2 specific days needed not earlier / later 3 mp not awarded if mp3 or mp6 given in b (i) A increases over, the time period / the age period / from 20 days to 400 days / with the days / growth / AW [1]
Mark scheme, page 9
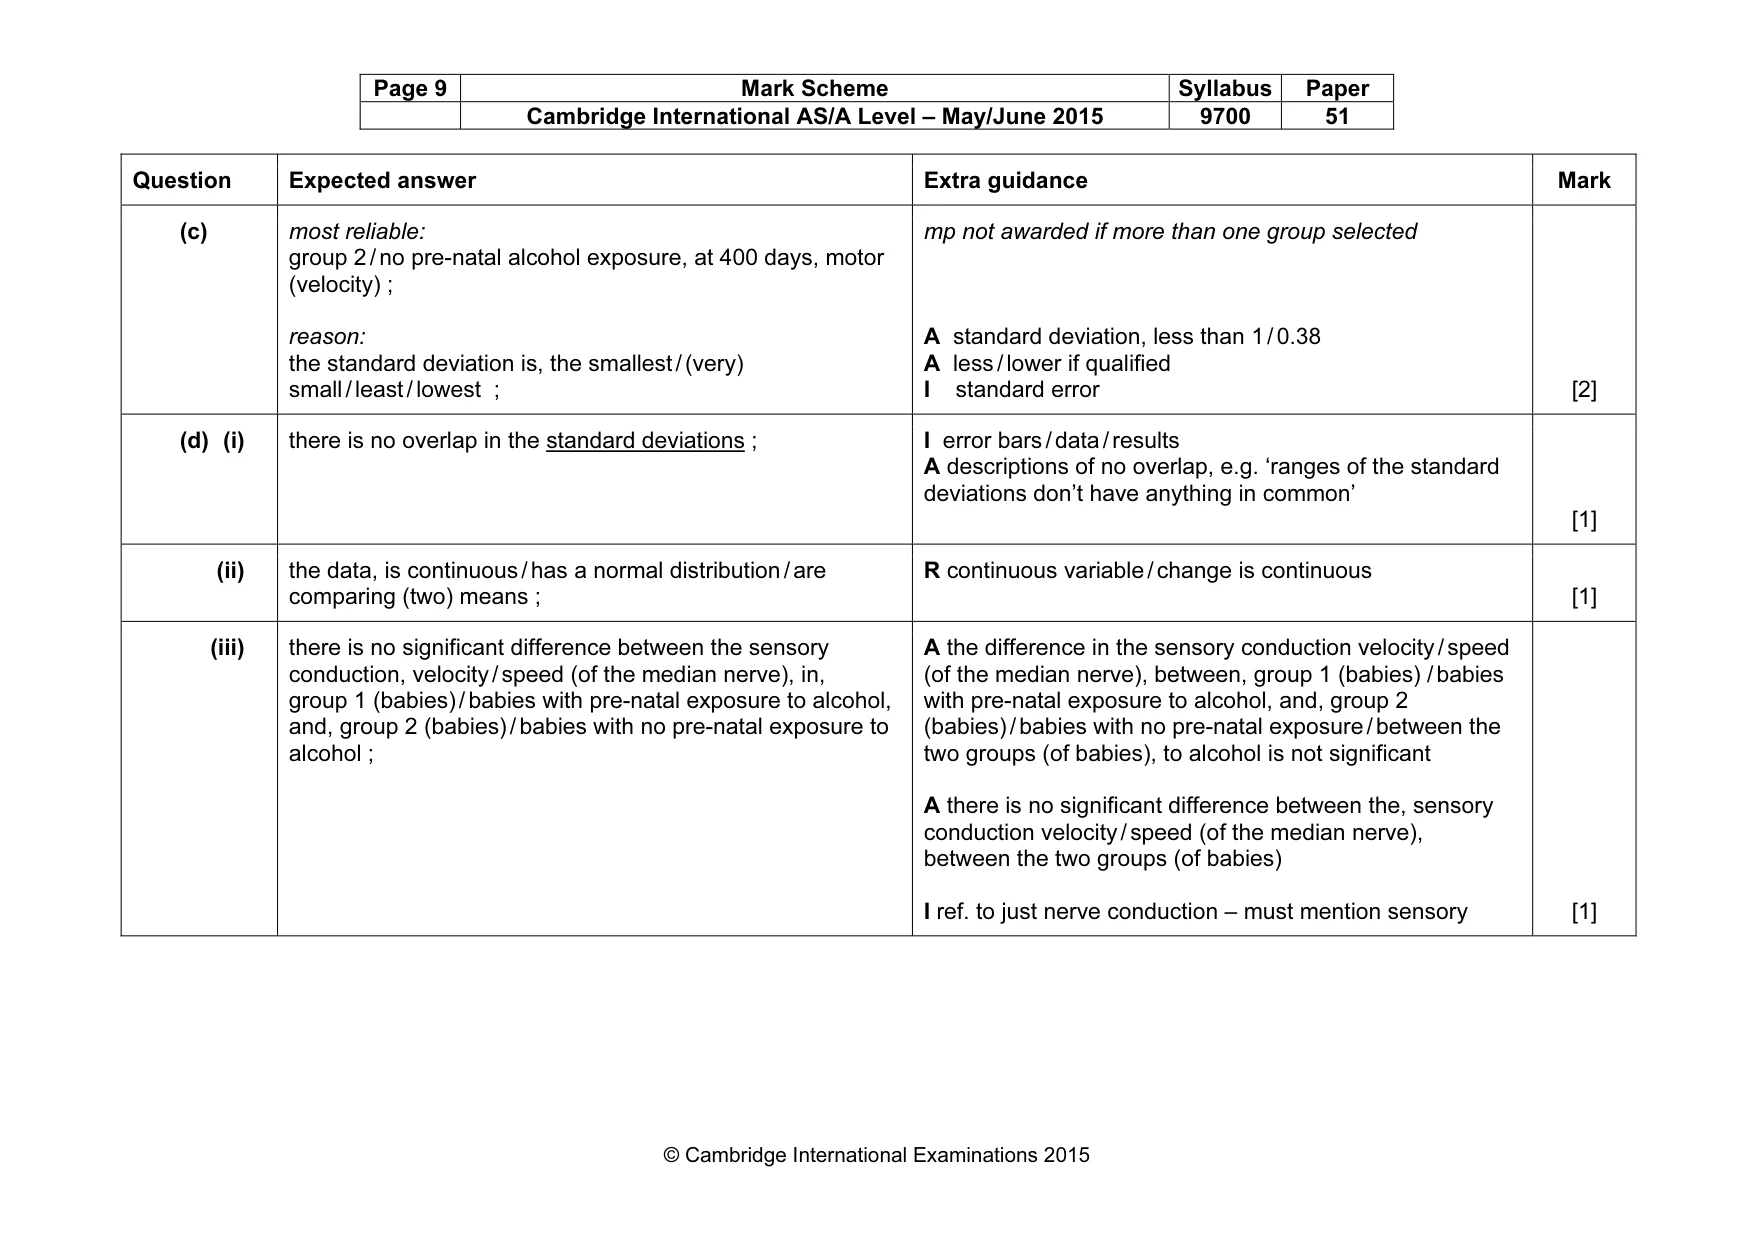
Page 9 Mark Scheme Syllabus Paper Cambridge International AS/A Level – May/June 2015 9700 51 © Cambridge International Examinations 2015 Question Expected answer Extra guidance Mark (c) most reliable: group 2 / no pre-natal alcohol exposure, at 400 days, motor (velocity) ; reason: the standard deviation is, the smallest / (very) small / least / lowest ; mp not awarded if more than one group selected A standard deviation, less than 1 / 0.38 A less / lower if qualified I standard error [2] (d) (i) there is no overlap in the standard deviations ; I error bars / data / results A descriptions of no overlap, e.g. ‘ranges of the standard deviations don’t have anything in common’ [1] (ii) the data, is continuous / has a normal distribution / are comparing (two) means ; R continuous variable / change is continuous [1] (iii) there is no significant difference between the sensory conduction, velocity / speed (of the median nerve), in, group 1 (babies) / babies with pre-natal exposure to alcohol, and, group 2 (babies) / babies with no pre-natal exposure to alcohol ; A the difference in the sensory conduction velocity / speed (of the median nerve), between, group 1 (babies) / babies with pre-natal exposure to alcohol, and, group 2 (babies) / babies with no pre-natal exposure / between the two groups (of babies), to alcohol is not significant A there is no significant difference between the, sensory conduction velocity / speed (of the median nerve), between the two groups (of babies) I ref. to just nerve conduction – must mention sensory [1]
Mark scheme, page 10
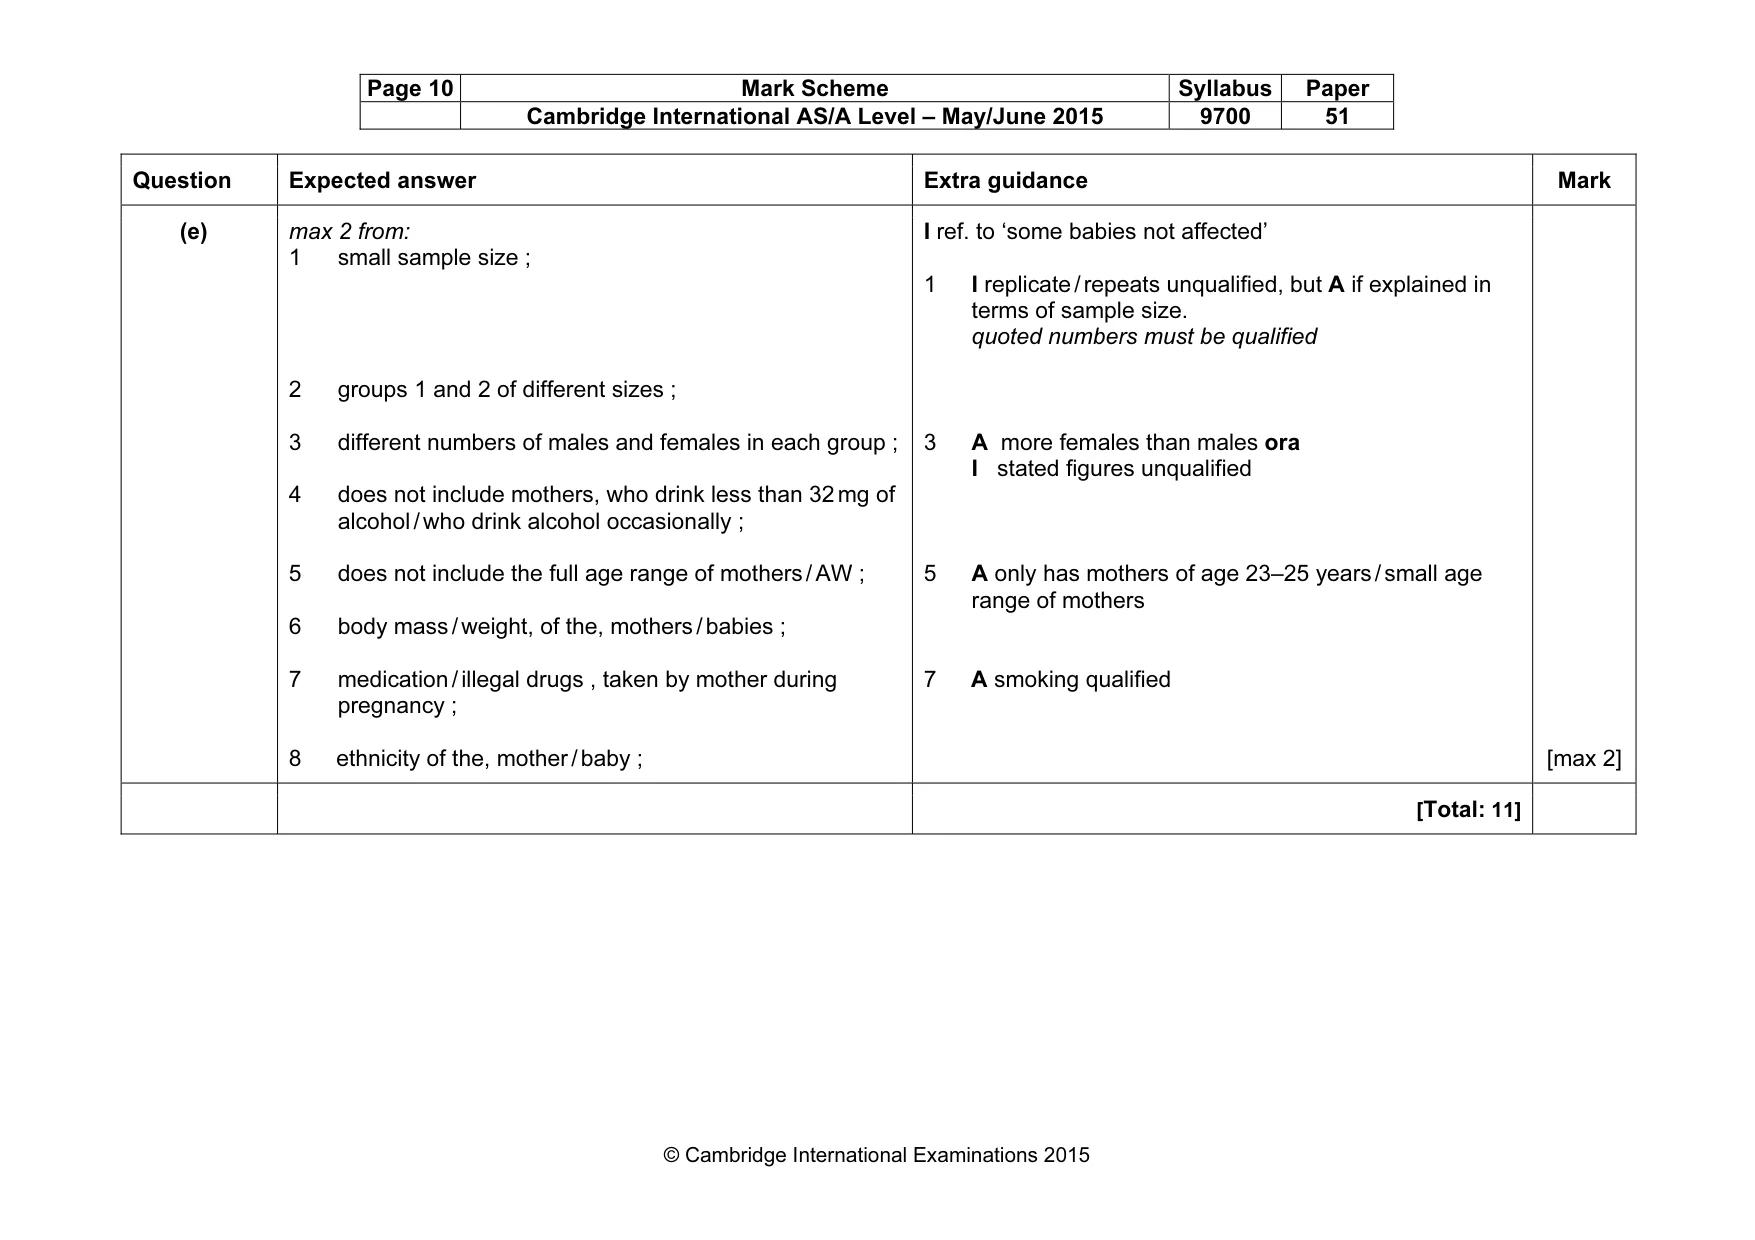
Page 10 Mark Scheme Syllabus Paper Cambridge International AS/A Level – May/June 2015 9700 51 © Cambridge International Examinations 2015 Question Expected answer Extra guidance Mark (e) max 2 from: 1 small sample size ; 2 groups 1 and 2 of different sizes ; 3 different numbers of males and females in each group ; 4 does not include mothers, who drink less than 32 mg of alcohol / who drink alcohol occasionally ; 5 does not include the full age range of mothers / AW ; 6 body mass / weight, of the, mothers / babies ; 7 medication / illegal drugs , taken by mother during pregnancy ; 8 ethnicity of the, mother / baby ; I ref. to ‘some babies not affected’ 1 I replicate / repeats unqualified, but A if explained in terms of sample size. quoted numbers must be qualified 3 A more females than males ora I stated figures unqualified 5 A only has mothers of age 23–25 years / small age range of mothers 7 A smoking qualified [max 2] [Total: 11]
What you needed in this session
Cambridge’s own grade thresholds for 2015 May/June, Paper 5 · Variant 1. A higher threshold means an easier paper — the bar moves with how the cohort did.