Cambridge A Level Biology 9700 — 2013 May/June Paper 5 · Variant 1
9700/51/M/J/13 · 30 marks · ≈34 min
The question paper and its mark scheme, free to read here and free to download. This is Cambridge’s own paper, exactly as it was sat.
Question paper8 pages

Mark scheme9 pages
Answers below. Sit the paper first if you are practising.
Paper as text
Question paper, page 1
This document consists of 7 printed pages and 1 blank page. DC (AC/CGW) 62464/3 © UCLES 2013 [Turn over UNIVERSITY OF CAMBRIDGE INTERNATIONAL EXAMINATIONS General Certificate of Education Advanced Level * 4 9 5 0 9 9 3 2 6 2 * BIOLOGY 9700/51 Paper 5 Planning, Analysis and Evaluation May/June 2013 1 hour 15 minutes Candidates answer on the Question Paper. No Additional Materials are required. READ THESE INSTRUCTIONS FIRST Write your Centre number, candidate number and name on all the work you hand in. Write in dark blue or black ink. You may use a soft pencil for any diagrams, graphs or rough working. Do not use staples, paper clips, highlighters, glue or correction fluid. DO NOT WRITE IN ANY BARCODES. Answer all questions. Electronic calculators may be used. At the end of the examination, fasten all your work securely together. The number of marks is given in brackets [ ] at the end of each question or part question. For Examiner’s Use 1 2 Total
Question paper, page 2
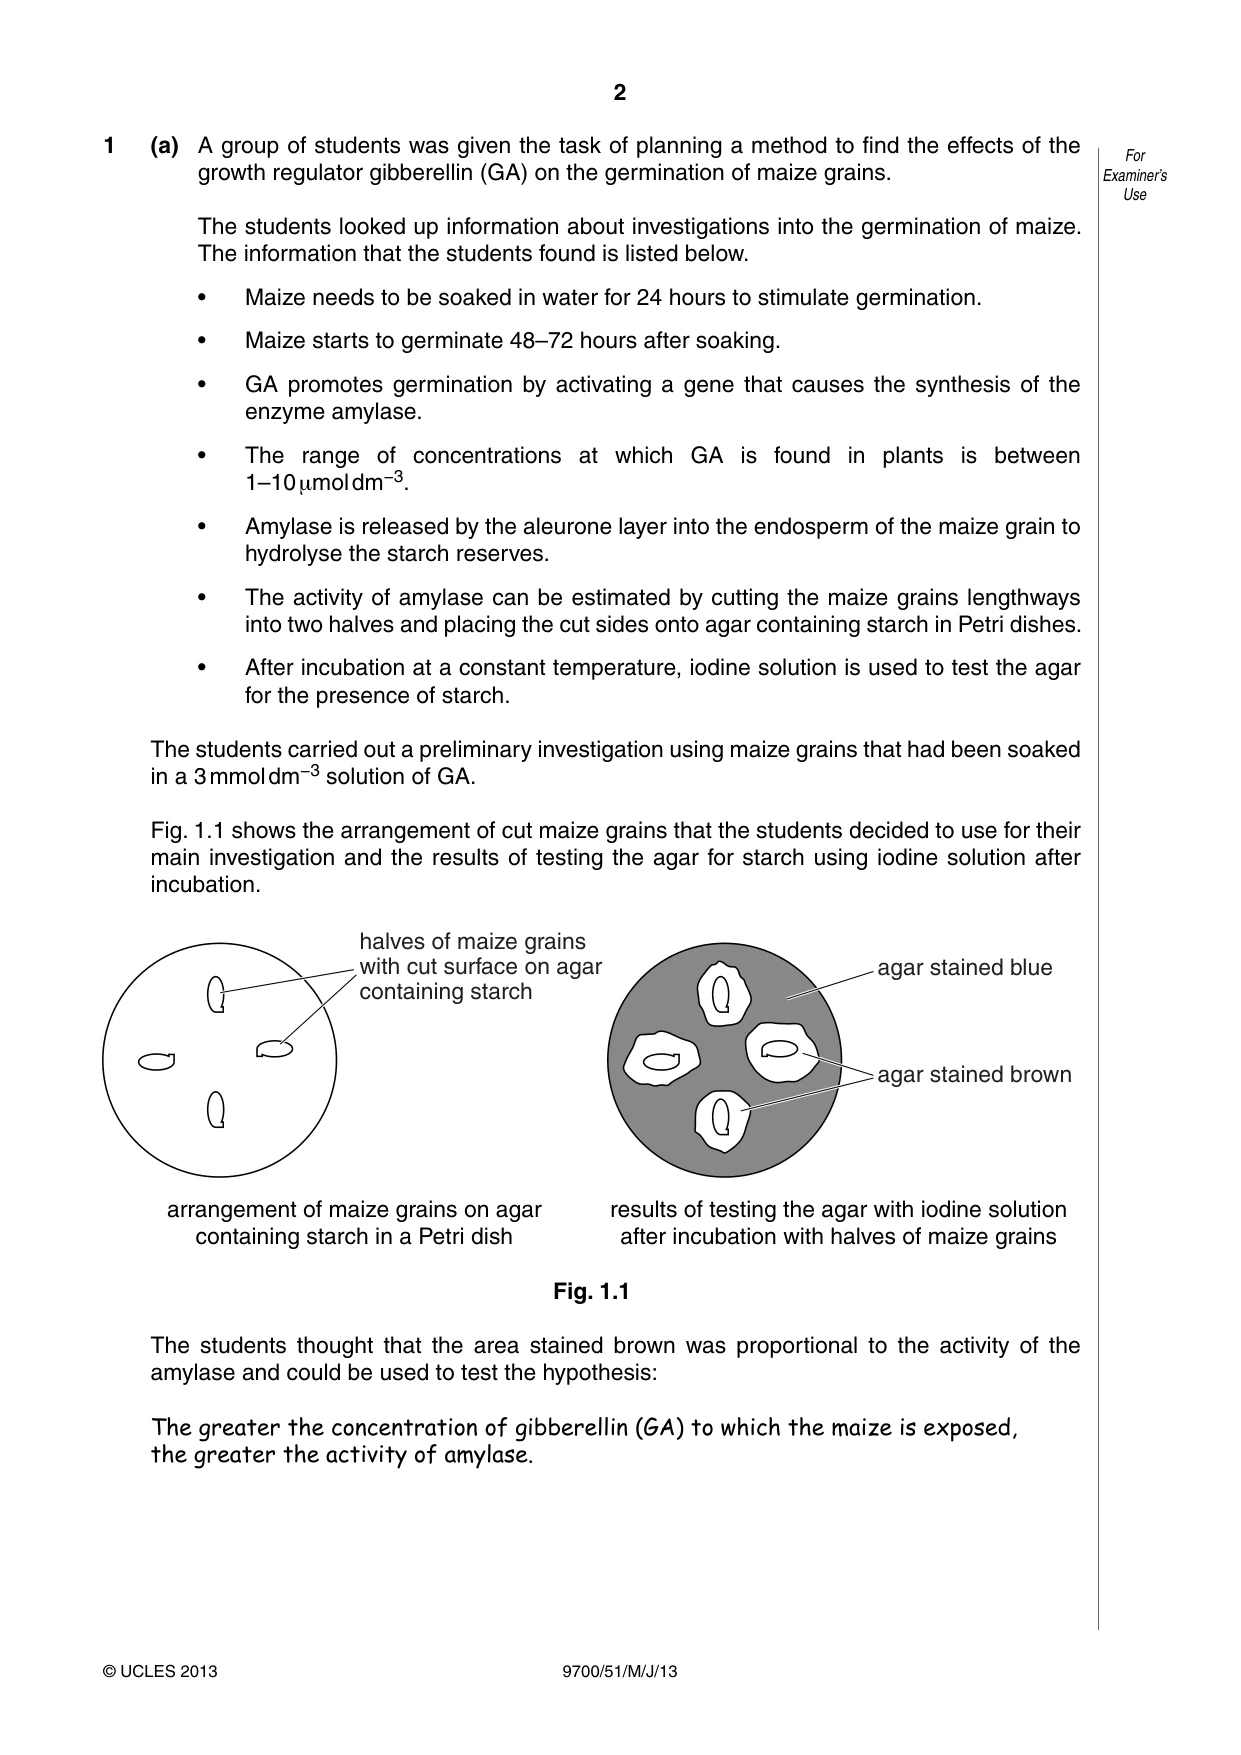
2 9700/51/M/J/13 © UCLES 2013 For Examiner’s Use 1 (a) A group of students was given the task of planning a method to find the effects of the growth regulator gibberellin (GA) on the germination of maize grains. The students looked up information about investigations into the germination of maize. The information that the students found is listed below. • Maize needs to be soaked in water for 24 hours to stimulate germination. • Maize starts to germinate 48–72 hours after soaking. • GA promotes germination by activating a gene that causes the synthesis of the enzyme amylase. • The range of concentrations at which GA is found in plants is between 1–10 μmol dm−3. • Amylase is released by the aleurone layer into the endosperm of the maize grain to hydrolyse the starch reserves. • The activity of amylase can be estimated by cutting the maize grains lengthways into two halves and placing the cut sides onto agar containing starch in Petri dishes. • After incubation at a constant temperature, iodine solution is used to test the agar for the presence of starch. The students carried out a preliminary investigation using maize grains that had been soaked in a 3 mmol dm−3 solution of GA. Fig. 1.1 shows the arrangement of cut maize grains that the students decided to use for their main investigation and the results of testing the agar for starch using iodine solution after incubation. halves of maize grains with cut surface on agar containing starch agar stained blue agar stained brown arrangement of maize grains on agar containing starch in a Petri dish results of testing the agar with iodine solution after incubation with halves of maize grains Fig. 1.1 The students thought that the area stained brown was proportional to the activity of the amylase and could be used to test the hypothesis: The greater the concentration of gibberellin (GA) to which the maize is exposed, the greater the activity of amylase.
Question paper, page 3
3 9700/51/M/J/13 © UCLES 2013 [Turn over For Examiner’s Use (i) Identify the independent and the dependent variables in the students’ preliminary investigation. independent variable … … dependent variable … …[2] (ii) The students were provided with a 3 mmol dm−3 GA solution. Describe how the students could use the method from their preliminary investigation to test their hypothesis. Your method should be detailed enough for another person to use. … … … … … … … … … … … … … … … … … … … … …[8]
Question paper, page 4
4 9700/51/M/J/13 © UCLES 2013 For Examiner’s Use (b) The students decided to plot a graph of their results. Suggest labels, including units, for the axes of this graph. x-axis … … y-axis … …[2] (c) (i) The students thought that the area stained brown was proportional to the activity of the amylase. Suggest three limitations of using this way to estimate amylase activity. 1. … … 2. … … 3. … …[3] (ii) For one of these limitations, suggest how the estimation of amylase activity could be improved. … … … … …[2] [Total: 17]
Question paper, page 5
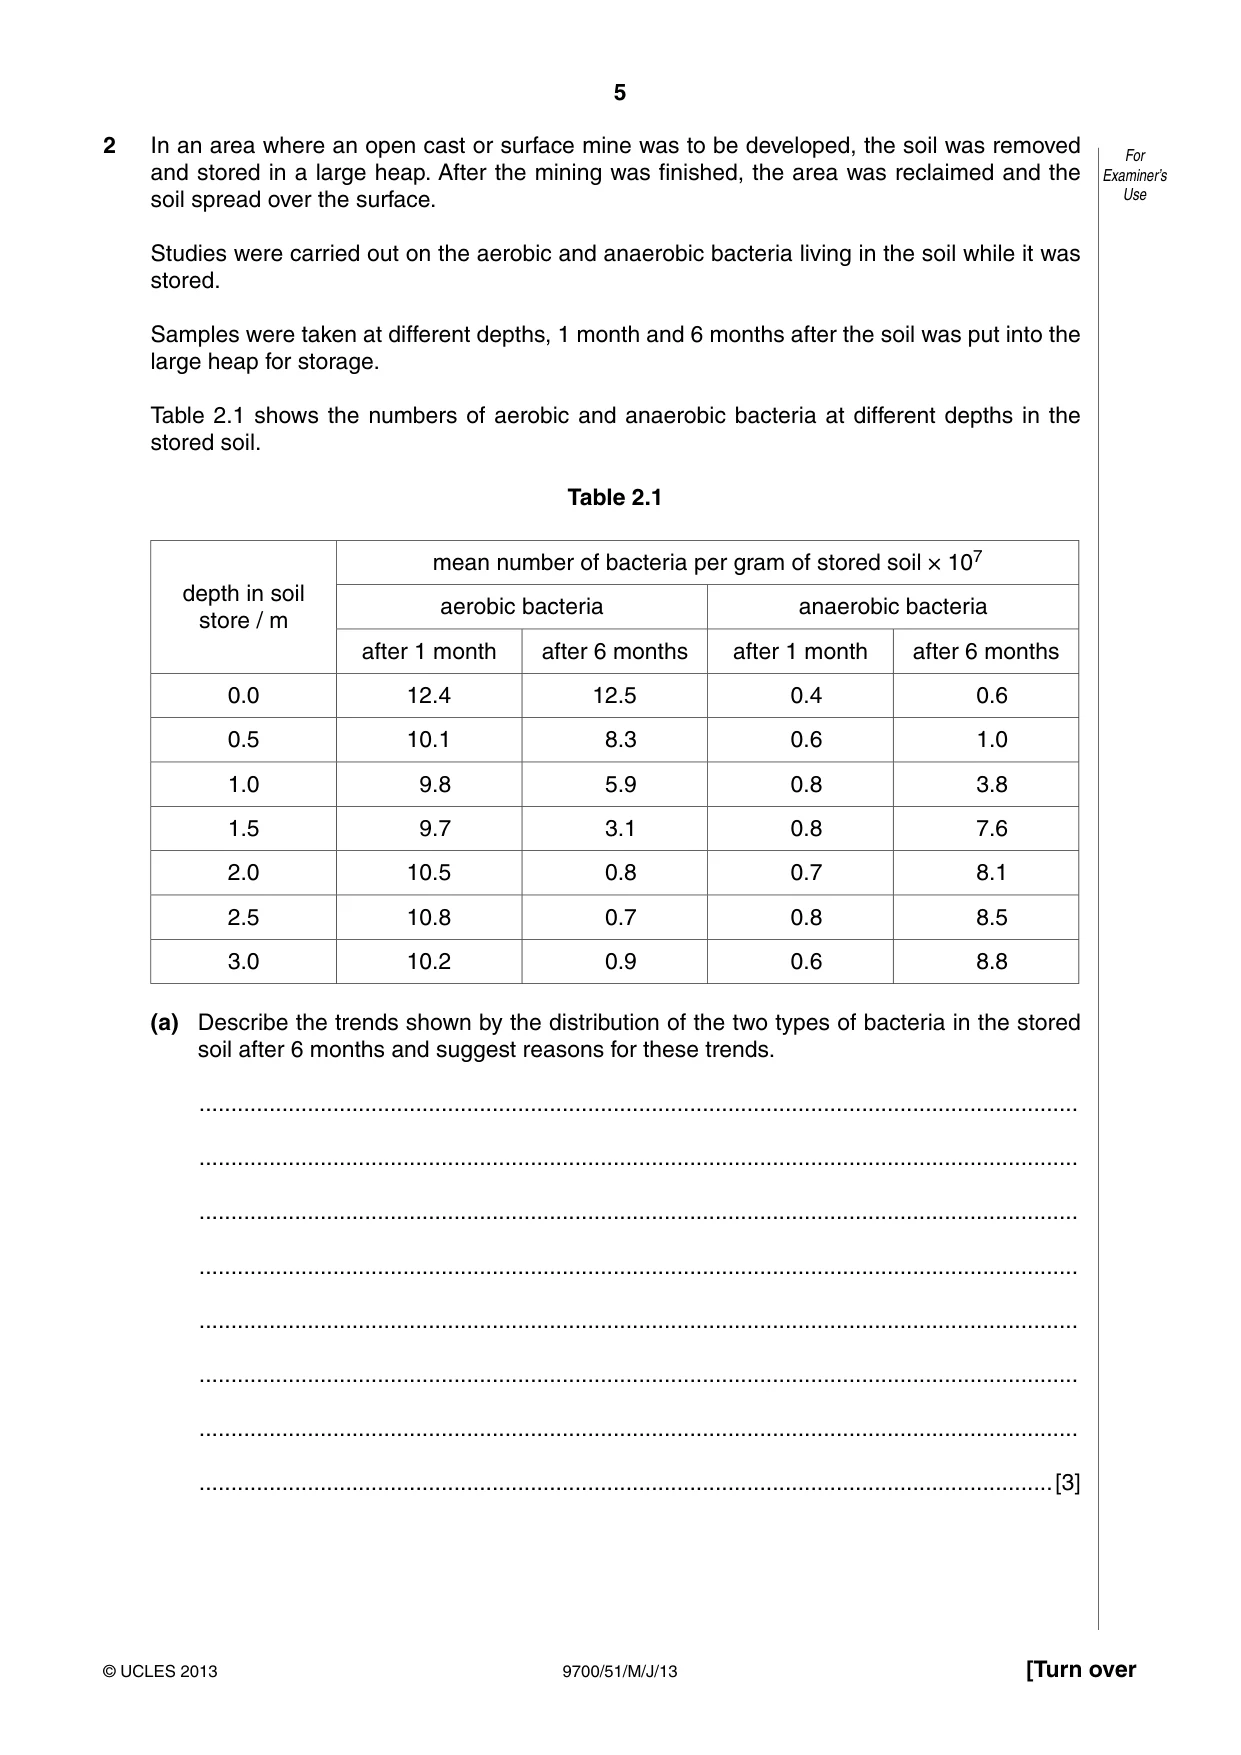
5 9700/51/M/J/13 © UCLES 2013 [Turn over For Examiner’s Use 2 In an area where an open cast or surface mine was to be developed, the soil was removed and stored in a large heap. After the mining was finished, the area was reclaimed and the soil spread over the surface. Studies were carried out on the aerobic and anaerobic bacteria living in the soil while it was stored. Samples were taken at different depths, 1 month and 6 months after the soil was put into the large heap for storage. Table 2.1 shows the numbers of aerobic and anaerobic bacteria at different depths in the stored soil. Table 2.1 depth in soil store / m mean number of bacteria per gram of stored soil × 107 aerobic bacteria anaerobic bacteria after 1 month after 6 months after 1 month after 6 months 0.0 12.4 12.5 0.4 0.6 0.5 10.1 8.3 0.6 1.0 1.0 9.8 5.9 0.8 3.8 1.5 9.7 3.1 0.8 7.6 2.0 10.5 0.8 0.7 8.1 2.5 10.8 0.7 0.8 8.5 3.0 10.2 0.9 0.6 8.8 (a) Describe the trends shown by the distribution of the two types of bacteria in the stored soil after 6 months and suggest reasons for these trends. … … … … … … … …[3]
Question paper, page 6
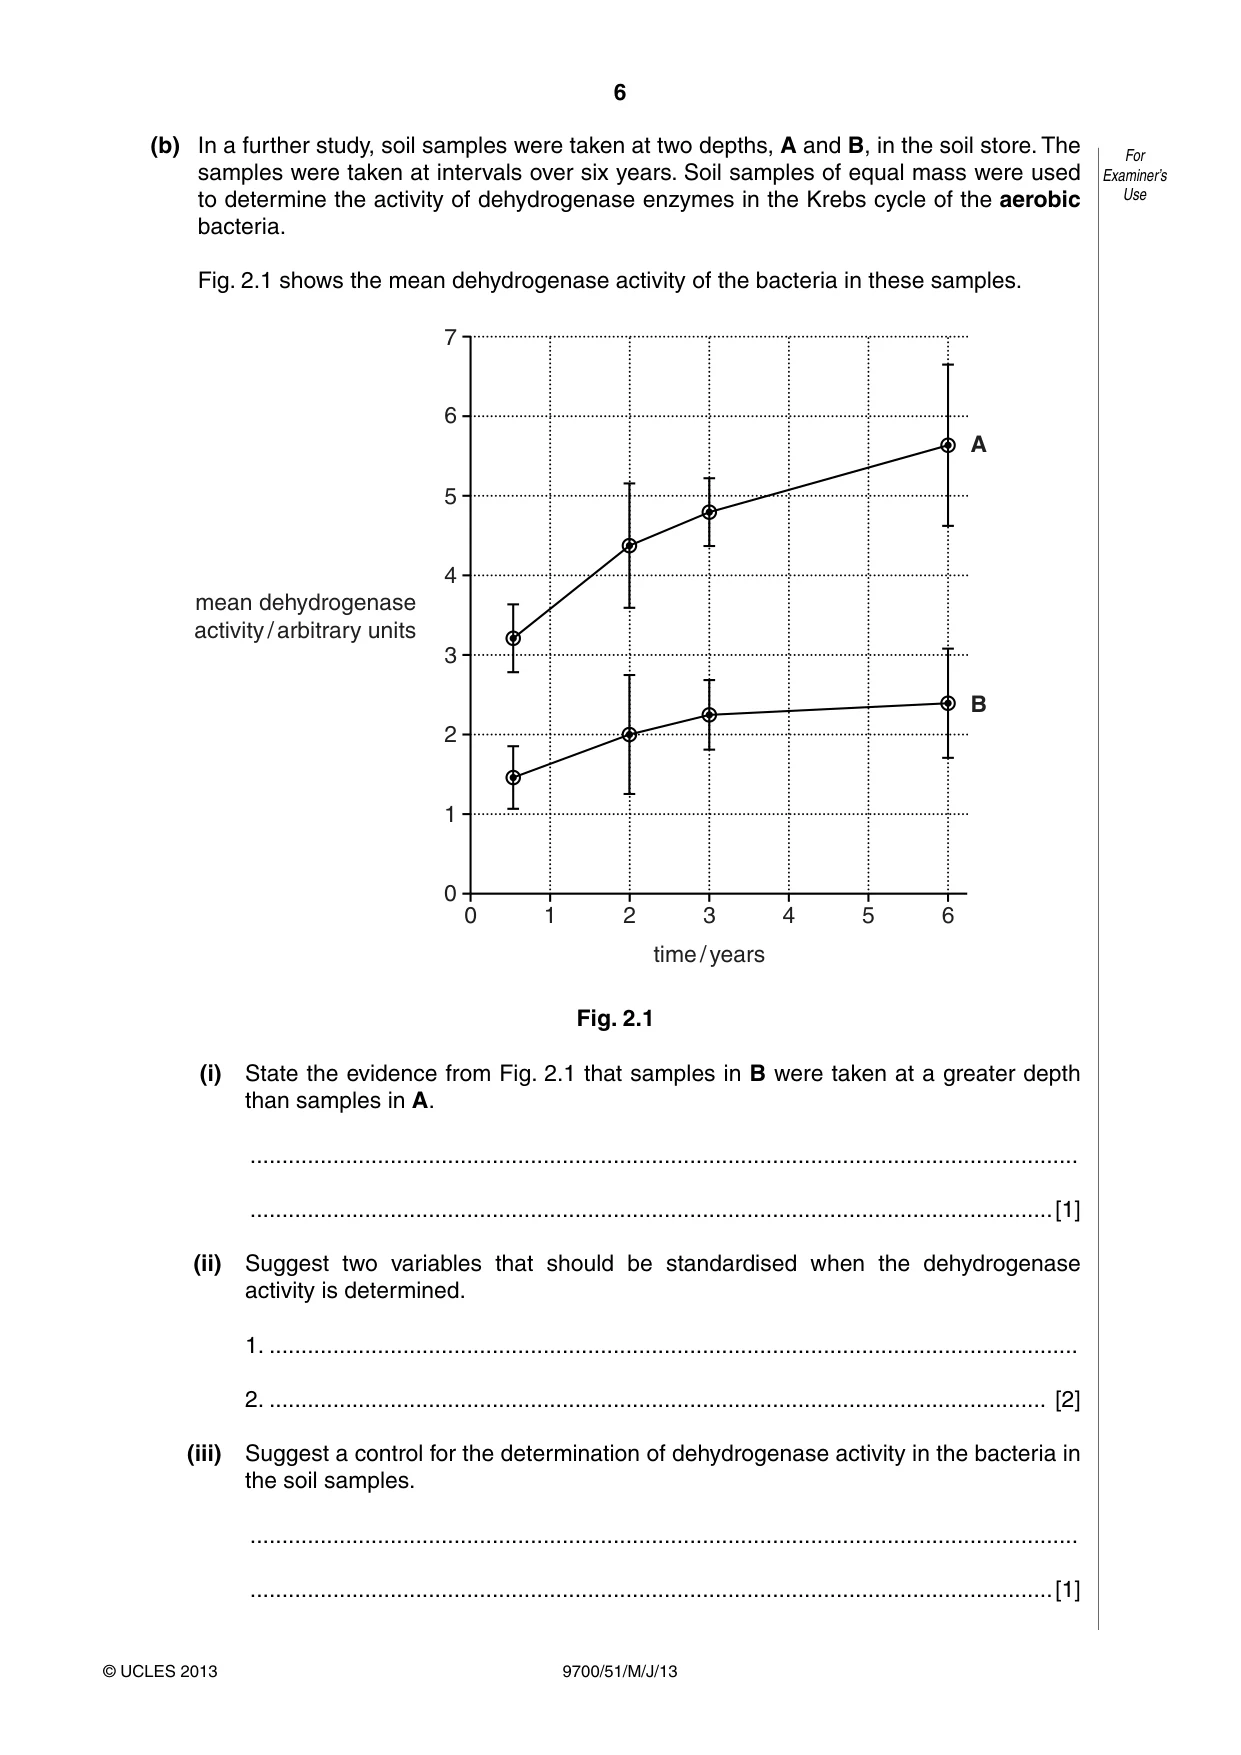
6 9700/51/M/J/13 © UCLES 2013 For Examiner’s Use (b) In a further study, soil samples were taken at two depths, A and B, in the soil store. The samples were taken at intervals over six years. Soil samples of equal mass were used to determine the activity of dehydrogenase enzymes in the Krebs cycle of the aerobic bacteria. Fig. 2.1 shows the mean dehydrogenase activity of the bacteria in these samples. 7 6 5 4 mean dehydrogenase activity / arbitrary units 3 A B 2 0 1 2 3 time / years 4 5 6 1 0 Fig. 2.1 (i) State the evidence from Fig. 2.1 that samples in B were taken at a greater depth than samples in A. … …[1] (ii) Suggest two variables that should be standardised when the dehydrogenase activity is determined. 1. … 2. … [2] (iii) Suggest a control for the determination of dehydrogenase activity in the bacteria in the soil samples. … …[1]
Question paper, page 7
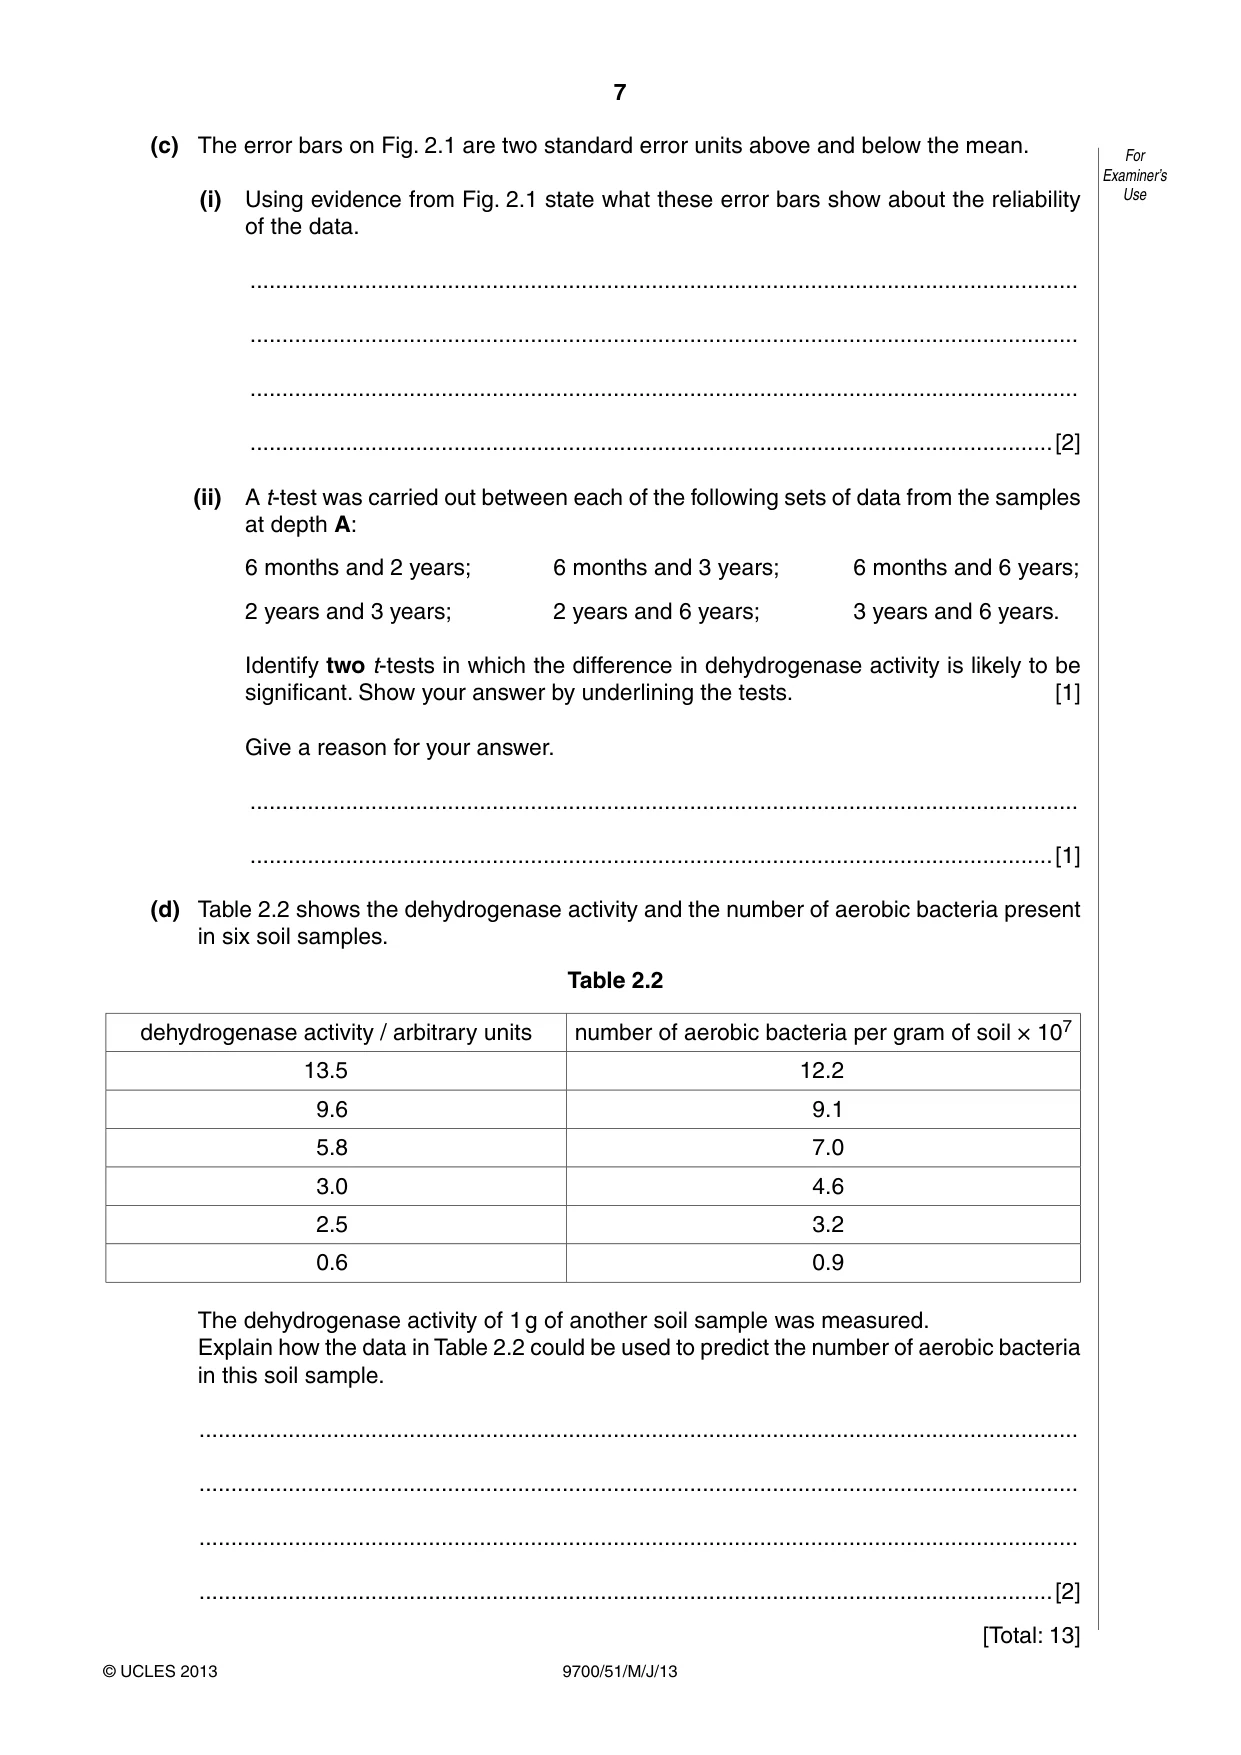
7 9700/51/M/J/13 © UCLES 2013 For Examiner’s Use (c) The error bars on Fig. 2.1 are two standard error units above and below the mean. (i) Using evidence from Fig. 2.1 state what these error bars show about the reliability of the data. … … … …[2] (ii) A t-test was carried out between each of the following sets of data from the samples at depth A: 6 months and 2 years; 6 months and 3 years; 6 months and 6 years; 2 years and 3 years; 2 years and 6 years; 3 years and 6 years. Identify two t-tests in which the difference in dehydrogenase activity is likely to be significant. Show your answer by underlining the tests. [1] Give a reason for your answer. … …[1] (d) Table 2.2 shows the dehydrogenase activity and the number of aerobic bacteria present in six soil samples. Table 2.2 dehydrogenase activity / arbitrary units number of aerobic bacteria per gram of soil × 107 13.5 12.2 9.6 9.1 5.8 7.0 3.0 4.6 2.5 3.2 0.6 0.9 The dehydrogenase activity of 1 g of another soil sample was measured. Explain how the data in Table 2.2 could be used to predict the number of aerobic bacteria in this soil sample. … … … …[2] [Total: 13]
Question paper, page 8
8 9700/51/M/J/13 © UCLES 2013 Permission to reproduce items where third-party owned material protected by copyright is included has been sought and cleared where possible. Every reasonable effort has been made by the publisher (UCLES) to trace copyright holders, but if any items requiring clearance have unwittingly been included, the publisher will be pleased to make amends at the earliest possible opportunity. University of Cambridge International Examinations is part of the Cambridge Assessment Group. Cambridge Assessment is the brand name of University of Cambridge Local Examinations Syndicate (UCLES), which is itself a department of the University of Cambridge. BLANK PAGE
Mark scheme, page 1
CAMBRIDGE INTERNATIONAL EXAMINATIONS GCE Advanced Subsidiary Level and GCE Advanced Level MARK SCHEME for the May/June 2013 series 9700 BIOLOGY 9700/51 Paper 5 (Planning, Analysis and Evaluation), maximum raw mark 30 This mark scheme is published as an aid to teachers and candidates, to indicate the requirements of the examination. It shows the basis on which Examiners were instructed to award marks. It does not indicate the details of the discussions that took place at an Examiners’ meeting before marking began, which would have considered the acceptability of alternative answers. Mark schemes should be read in conjunction with the question paper and the Principal Examiner Report for Teachers. Cambridge will not enter into discussions about these mark schemes. Cambridge is publishing the mark schemes for the May/June 2013 series for most IGCSE, GCE Advanced Level and Advanced Subsidiary Level components and some Ordinary Level components.
Mark scheme, page 2
Page 2 Mark Scheme Syllabus Paper GCE AS/A LEVEL – May/June 2013 9700 51 © Cambridge International Examinations 2013 Mark schemes abbreviations: ; separates marking points / alternatives answers for the same point R do not allow A allow (for answers correctly cued by the question, or guidance for examiners) AW alternative wording (where responses vary more than usual) underline actual word given must be used by candidate (grammatical variants excepted) max indicates the maximum number of marks that can be given
Mark scheme, page 3
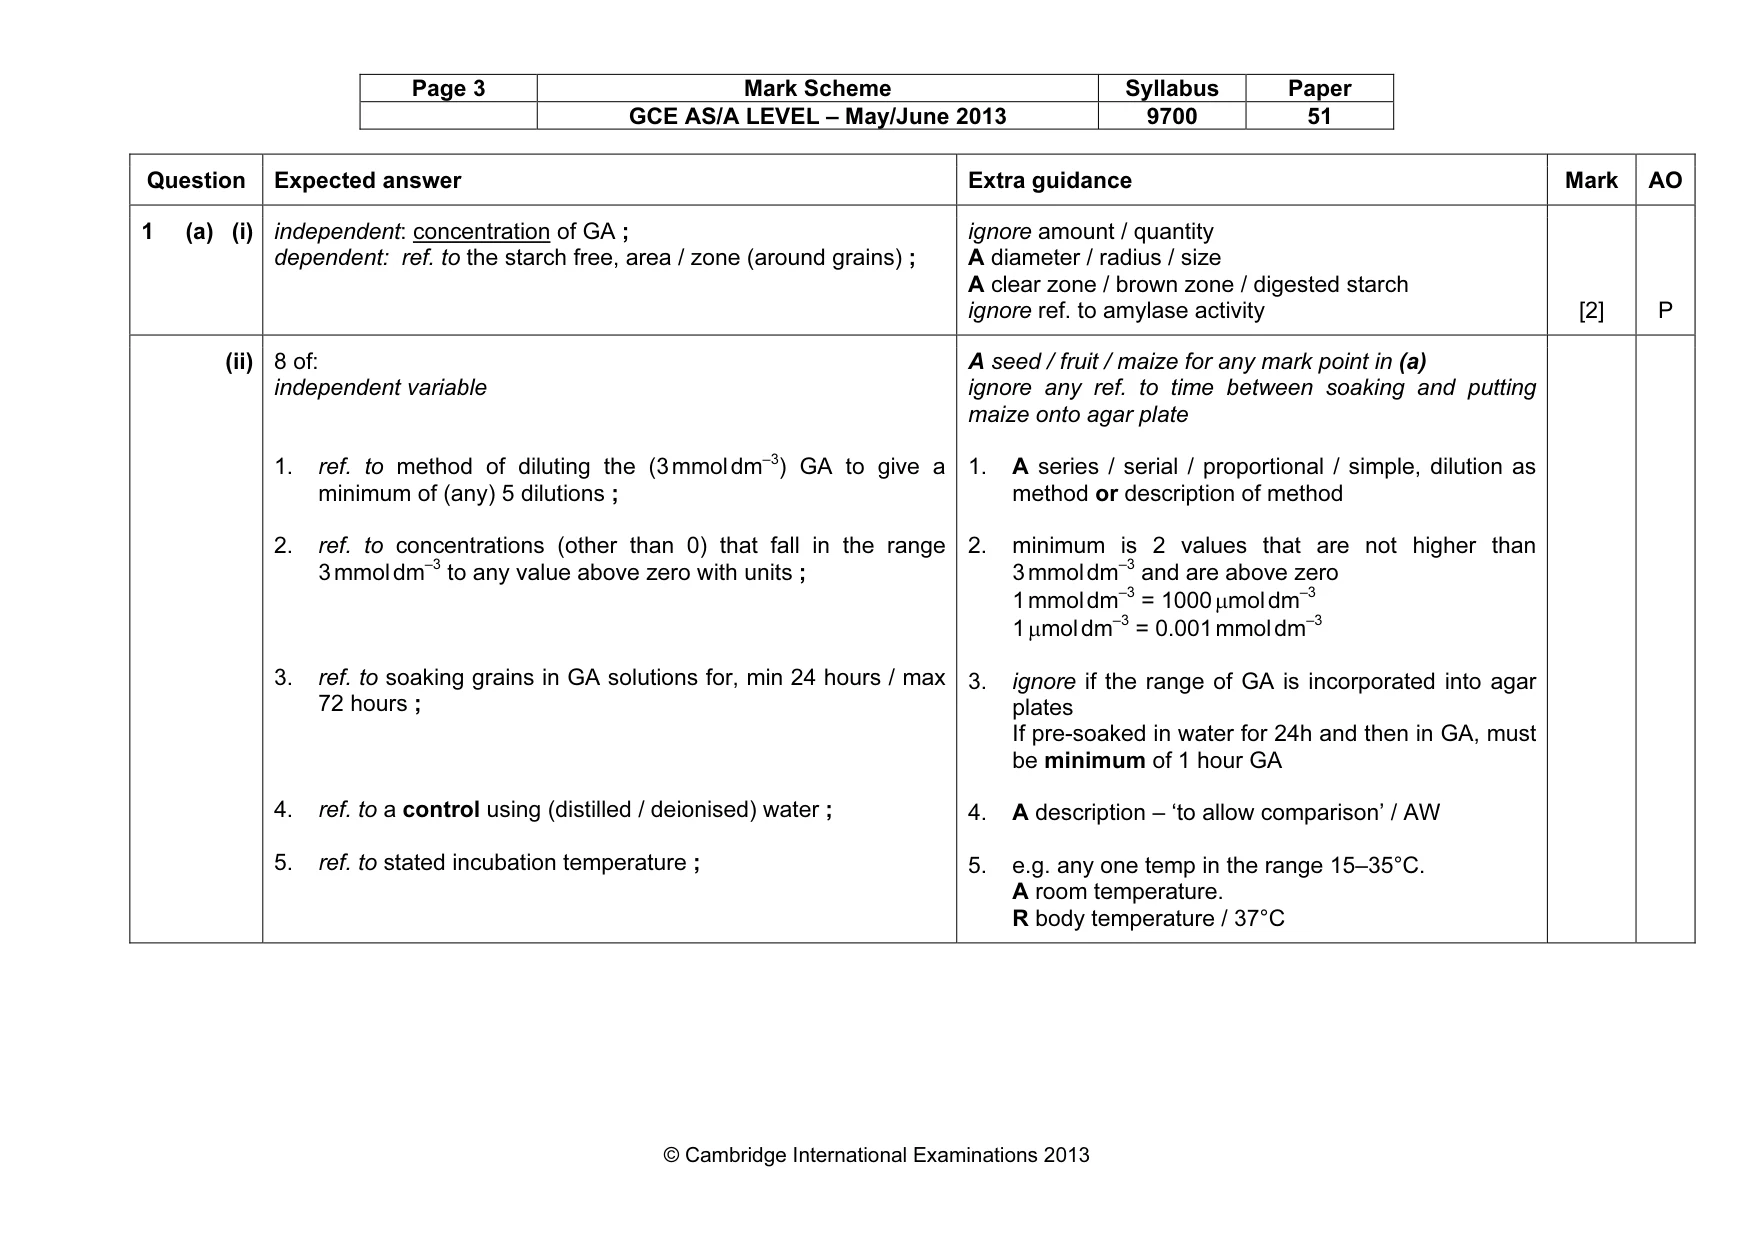
Page 3 Mark Scheme Syllabus Paper GCE AS/A LEVEL – May/June 2013 9700 51 © Cambridge International Examinations 2013 Question Expected answer Extra guidance Mark AO 1 (a) (i) independent: concentration of GA ; dependent: ref. to the starch free, area / zone (around grains) ; ignore amount / quantity A diameter / radius / size A clear zone / brown zone / digested starch ignore ref. to amylase activity [2] P (ii) 8 of: independent variable 1. ref. to method of diluting the (3 mmol dm–3) GA to give a minimum of (any) 5 dilutions ; 2. ref. to concentrations (other than 0) that fall in the range 3 mmol dm–3 to any value above zero with units ; 3. ref. to soaking grains in GA solutions for, min 24 hours / max 72 hours ; 4. ref. to a control using (distilled / deionised) water ; 5. ref. to stated incubation temperature ; A seed / fruit / maize for any mark point in (a) ignore any ref. to time between soaking and putting maize onto agar plate 1. A series / serial / proportional / simple, dilution as method or description of method 2. minimum is 2 values that are not higher than 3 mmol dm–3 and are above zero 1 mmol dm–3 = 1000 µmol dm–3 1 µmol dm–3 = 0.001 mmol dm–3 3. ignore if the range of GA is incorporated into agar plates If pre-soaked in water for 24h and then in GA, must be minimum of 1 hour GA 4. A description – ‘to allow comparison’ / AW 5. e.g. any one temp in the range 15–35°C. A room temperature. R body temperature / 37°C
Mark scheme, page 4
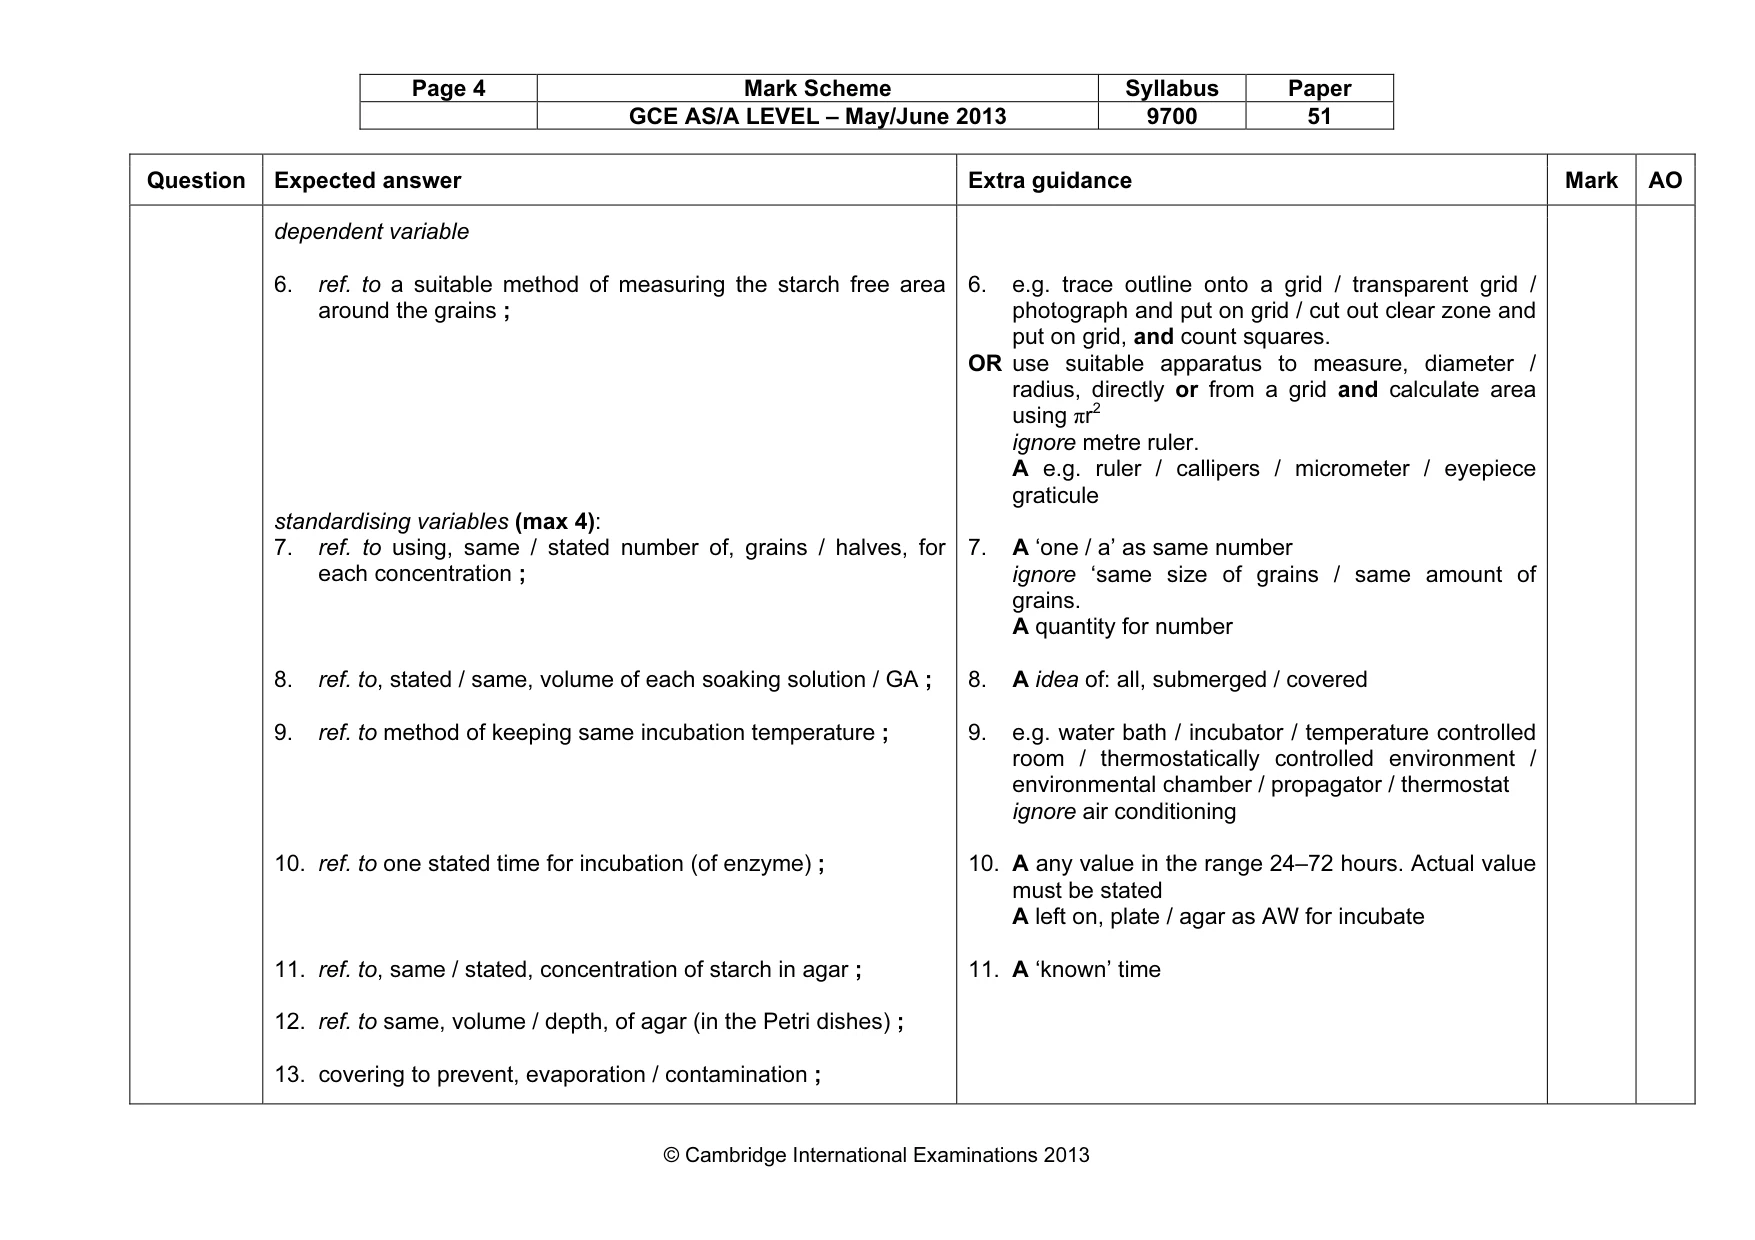
Page 4 Mark Scheme Syllabus Paper GCE AS/A LEVEL – May/June 2013 9700 51 © Cambridge International Examinations 2013 Question Expected answer Extra guidance Mark AO dependent variable 6. ref. to a suitable method of measuring the starch free area around the grains ; standardising variables (max 4): 7. ref. to using, same / stated number of, grains / halves, for each concentration ; 8. ref. to, stated / same, volume of each soaking solution / GA ; 9. ref. to method of keeping same incubation temperature ; 10. ref. to one stated time for incubation (of enzyme) ; 11. ref. to, same / stated, concentration of starch in agar ; 12. ref. to same, volume / depth, of agar (in the Petri dishes) ; 13. covering to prevent, evaporation / contamination ; 6. e.g. trace outline onto a grid / transparent grid / photograph and put on grid / cut out clear zone and put on grid, and count squares. OR use suitable apparatus to measure, diameter / radius, directly or from a grid and calculate area using πr2 ignore metre ruler. A e.g. ruler / callipers / micrometer / eyepiece graticule 7. A ‘one / a’ as same number ignore ‘same size of grains / same amount of grains. A quantity for number 8. A idea of: all, submerged / covered 9. e.g. water bath / incubator / temperature controlled room / thermostatically controlled environment / environmental chamber / propagator / thermostat ignore air conditioning 10. A any value in the range 24–72 hours. Actual value must be stated A left on, plate / agar as AW for incubate 11. A ‘known’ time
Mark scheme, page 5
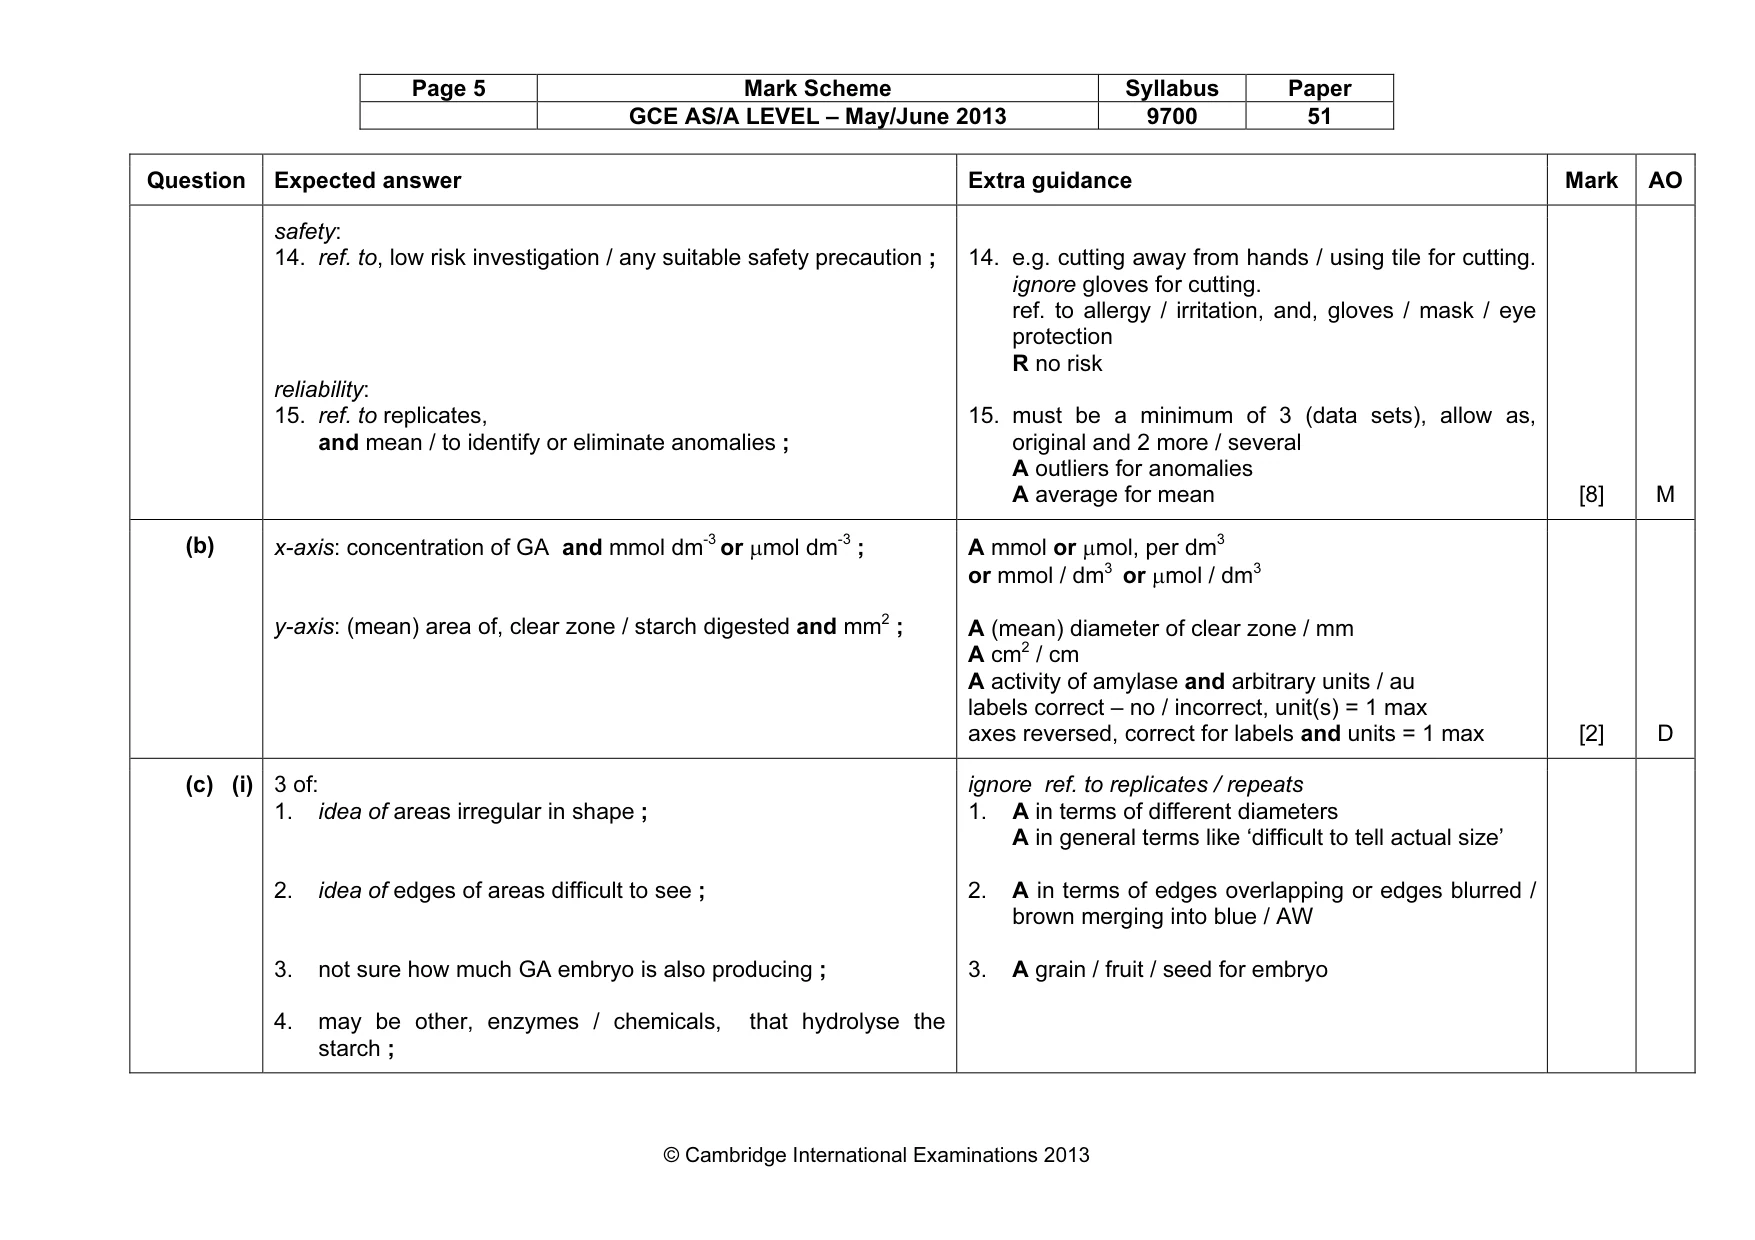
Page 5 Mark Scheme Syllabus Paper GCE AS/A LEVEL – May/June 2013 9700 51 © Cambridge International Examinations 2013 Question Expected answer Extra guidance Mark AO safety: 14. ref. to, low risk investigation / any suitable safety precaution ; reliability: 15. ref. to replicates, and mean / to identify or eliminate anomalies ; 14. e.g. cutting away from hands / using tile for cutting. ignore gloves for cutting. ref. to allergy / irritation, and, gloves / mask / eye protection R no risk 15. must be a minimum of 3 (data sets), allow as, original and 2 more / several A outliers for anomalies A average for mean [8] M (b) x-axis: concentration of GA and mmol dm-3 or µmol dm-3 ; y-axis: (mean) area of, clear zone / starch digested and mm2 ; A mmol or µmol, per dm3 or mmol / dm3 or µmol / dm3 A (mean) diameter of clear zone / mm A cm2 / cm A activity of amylase and arbitrary units / au labels correct – no / incorrect, unit(s) = 1 max axes reversed, correct for labels and units = 1 max [2] D (c) (i) 3 of: 1. idea of areas irregular in shape ; 2. idea of edges of areas difficult to see ; 3. not sure how much GA embryo is also producing ; 4. may be other, enzymes / chemicals, that hydrolyse the starch ; ignore ref. to replicates / repeats 1. A in terms of different diameters A in general terms like ‘difficult to tell actual size’ 2. A in terms of edges overlapping or edges blurred / brown merging into blue / AW 3. A grain / fruit / seed for embryo
Mark scheme, page 6
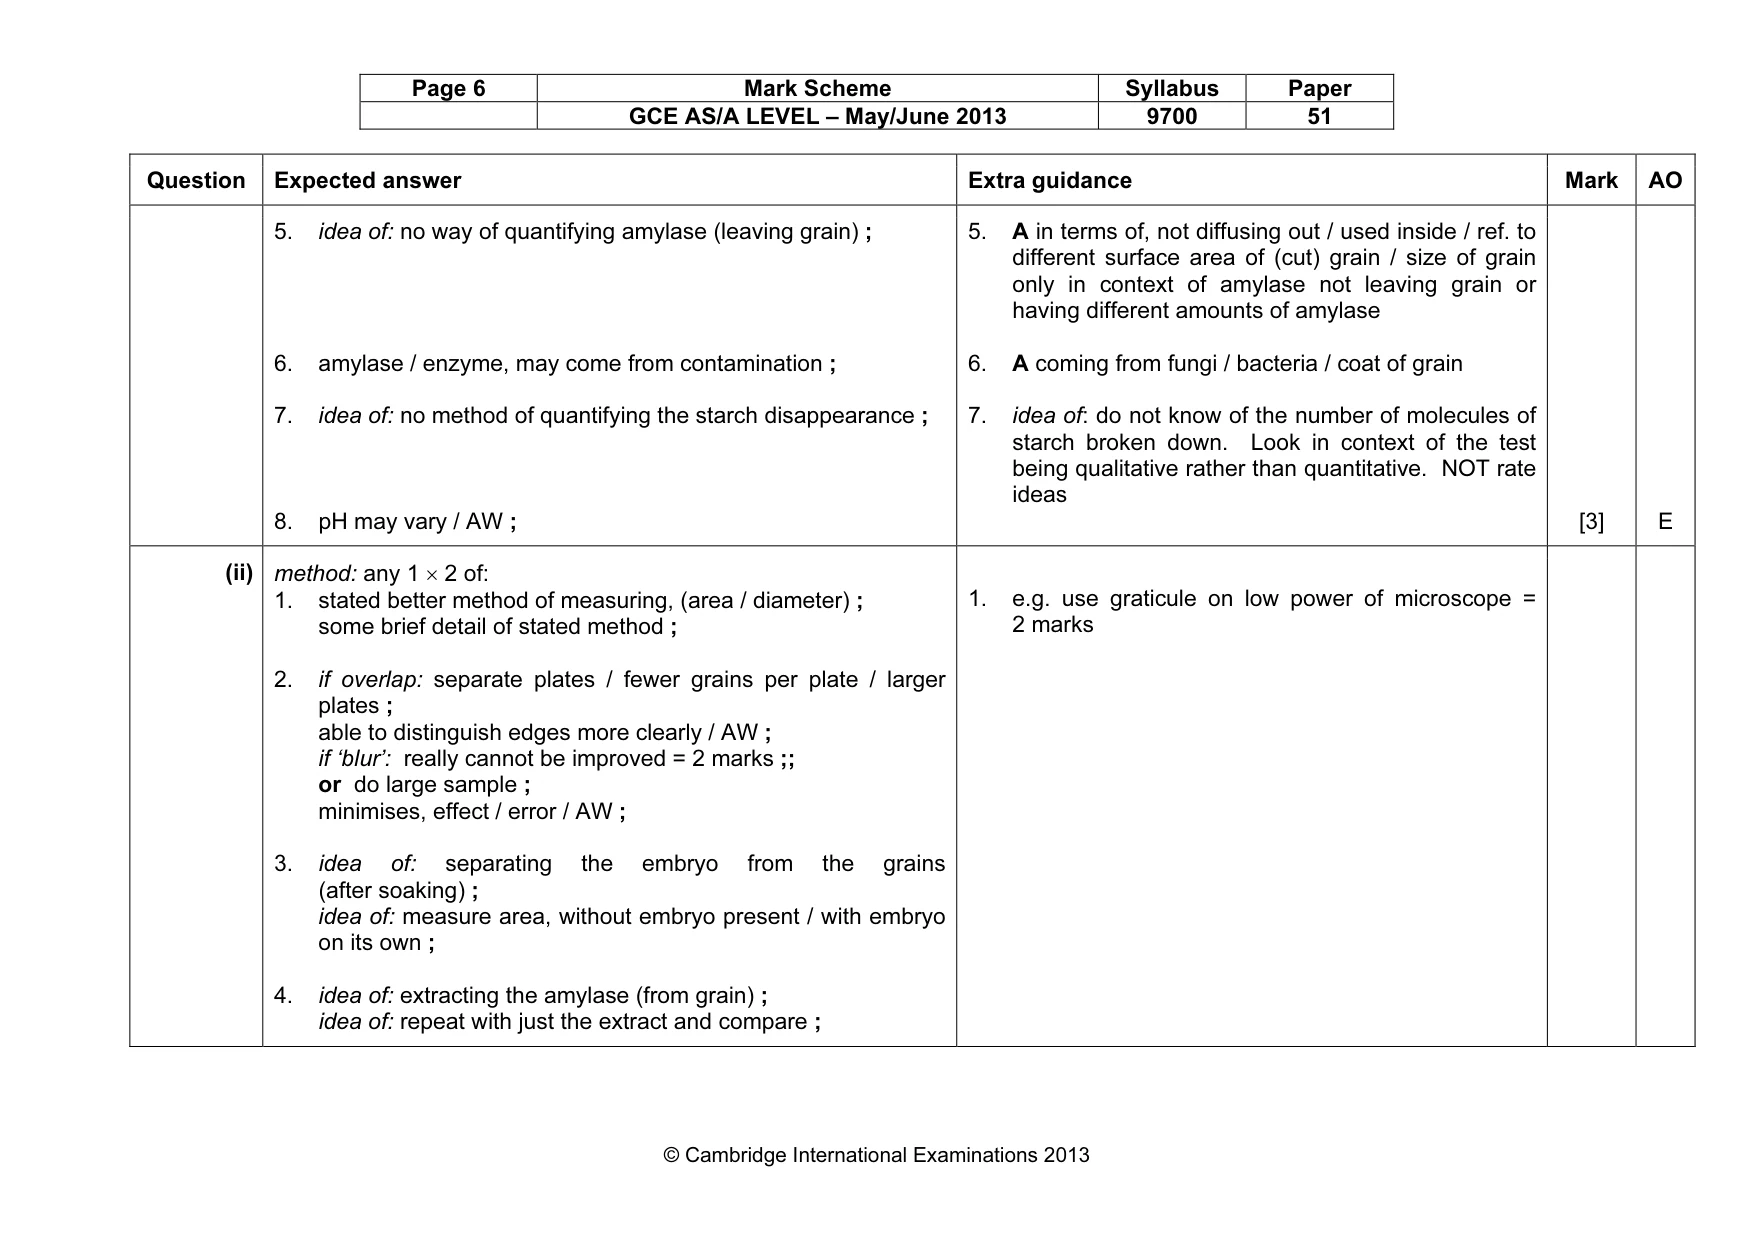
Page 6 Mark Scheme Syllabus Paper GCE AS/A LEVEL – May/June 2013 9700 51 © Cambridge International Examinations 2013 Question Expected answer Extra guidance Mark AO 5. idea of: no way of quantifying amylase (leaving grain) ; 6. amylase / enzyme, may come from contamination ; 7. idea of: no method of quantifying the starch disappearance ; 8. pH may vary / AW ; 5. A in terms of, not diffusing out / used inside / ref. to different surface area of (cut) grain / size of grain only in context of amylase not leaving grain or having different amounts of amylase 6. A coming from fungi / bacteria / coat of grain 7. idea of: do not know of the number of molecules of starch broken down. Look in context of the test being qualitative rather than quantitative. NOT rate ideas [3] E (ii) method: any 1 × 2 of: 1. stated better method of measuring, (area / diameter) ; some brief detail of stated method ; 2. if overlap: separate plates / fewer grains per plate / larger plates ; able to distinguish edges more clearly / AW ; if ‘blur’: really cannot be improved = 2 marks ;; or do large sample ; minimises, effect / error / AW ; 3. idea of: separating the embryo from the grains (after soaking) ; idea of: measure area, without embryo present / with embryo on its own ; 4. idea of: extracting the amylase (from grain) ; idea of: repeat with just the extract and compare ; 1. e.g. use graticule on low power of microscope = 2 marks
Mark scheme, page 7
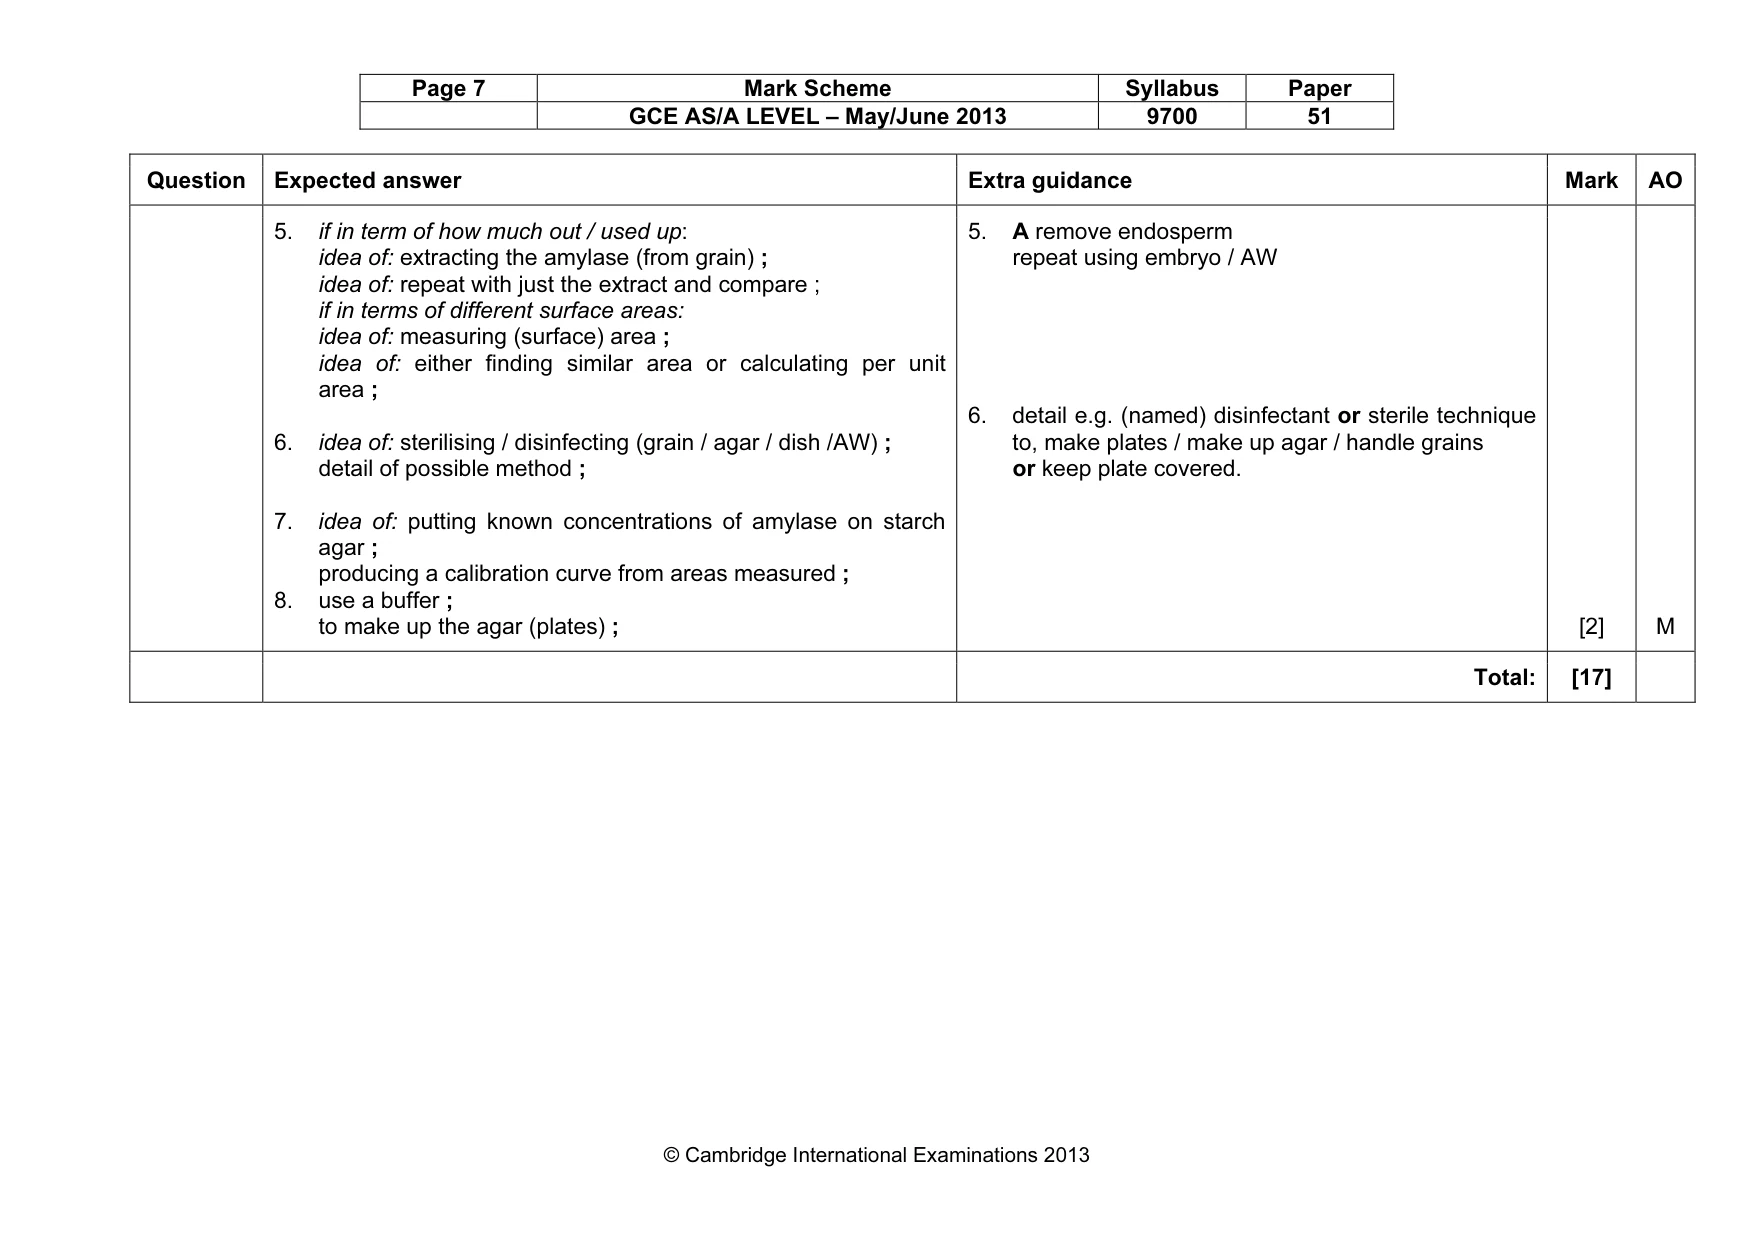
Page 7 Mark Scheme Syllabus Paper GCE AS/A LEVEL – May/June 2013 9700 51 © Cambridge International Examinations 2013 Question Expected answer Extra guidance Mark AO 5. if in term of how much out / used up: idea of: extracting the amylase (from grain) ; idea of: repeat with just the extract and compare ; if in terms of different surface areas: idea of: measuring (surface) area ; idea of: either finding similar area or calculating per unit area ; 6. idea of: sterilising / disinfecting (grain / agar / dish /AW) ; detail of possible method ; 7. idea of: putting known concentrations of amylase on starch agar ; producing a calibration curve from areas measured ; 8. use a buffer ; to make up the agar (plates) ; 5. A remove endosperm repeat using embryo / AW 6. detail e.g. (named) disinfectant or sterile technique to, make plates / make up agar / handle grains or keep plate covered. [2] M Total: [17]
Mark scheme, page 8
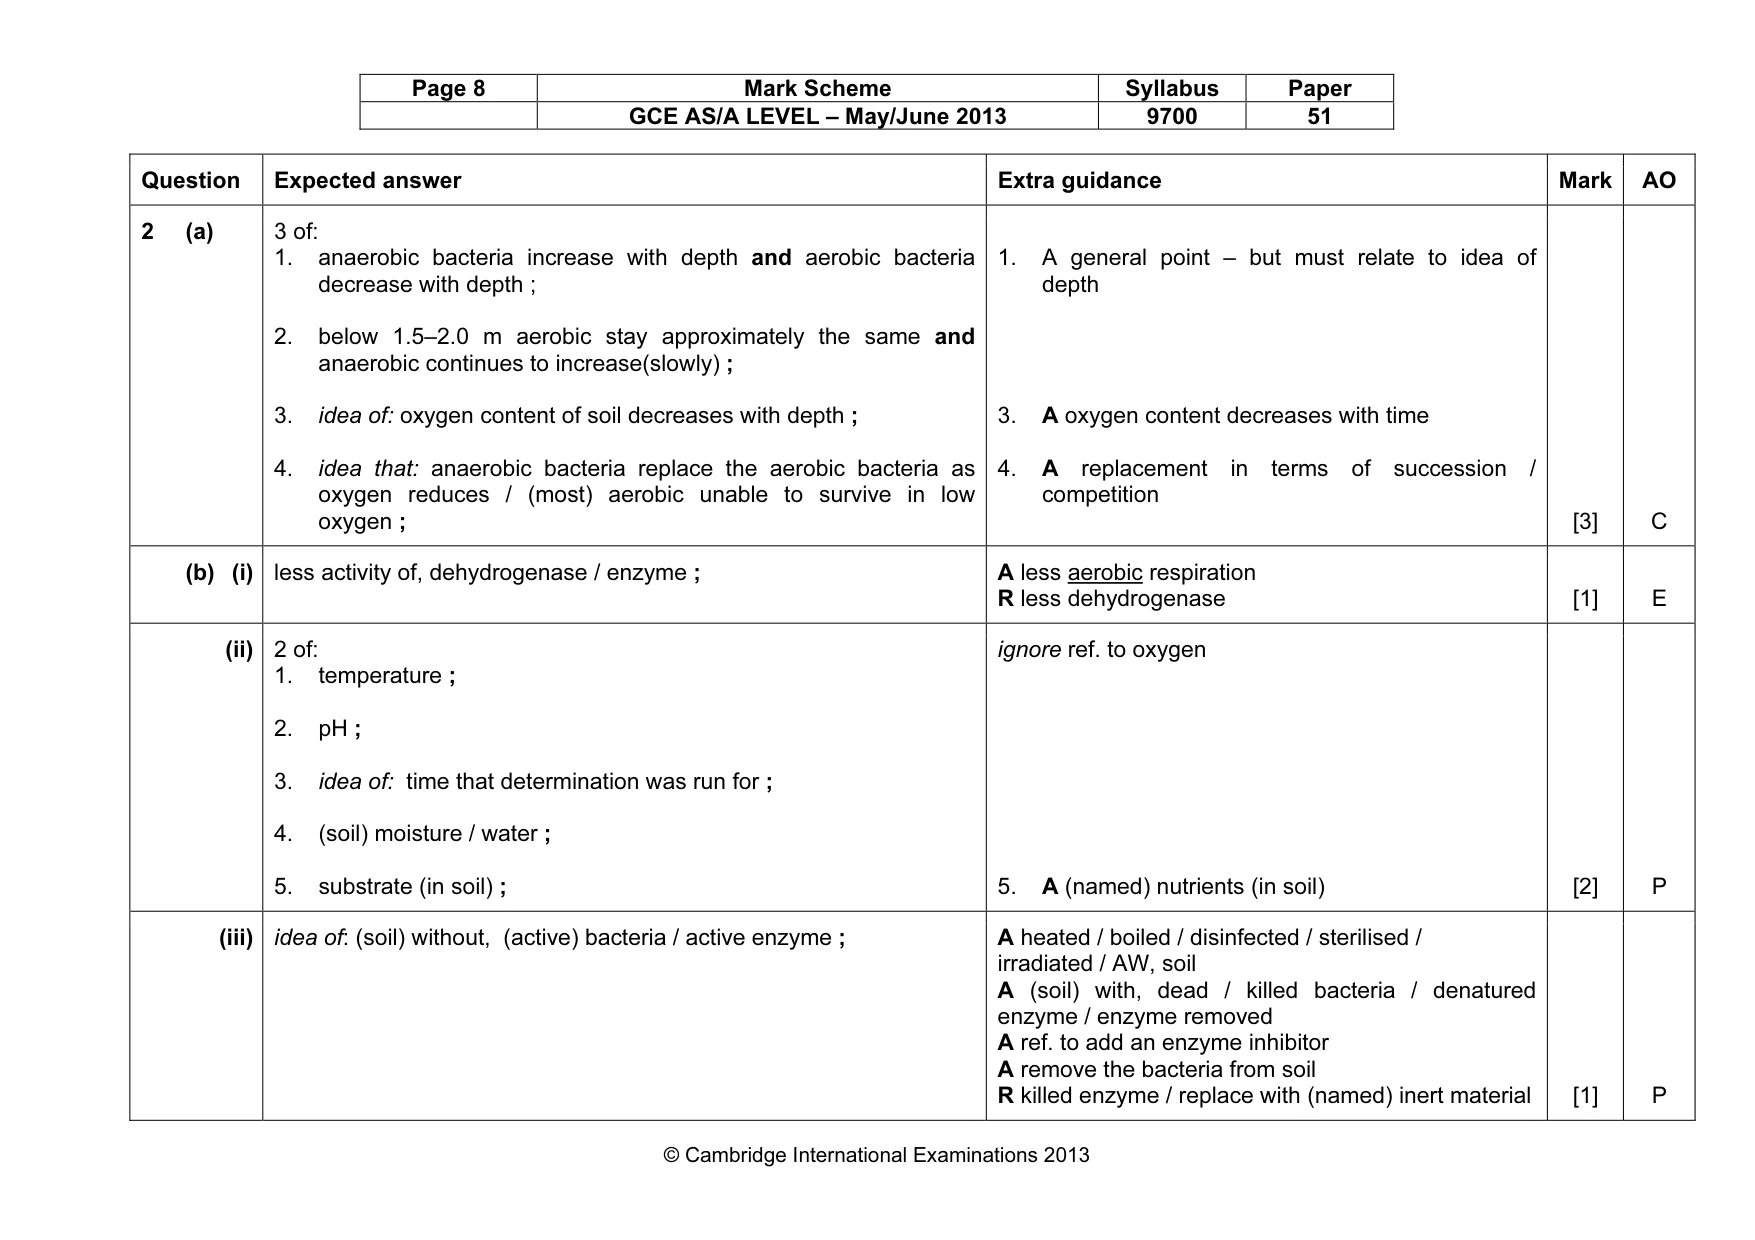
Page 8 Mark Scheme Syllabus Paper GCE AS/A LEVEL – May/June 2013 9700 51 © Cambridge International Examinations 2013 Question Expected answer Extra guidance Mark AO 2 (a) 3 of: 1. anaerobic bacteria increase with depth and aerobic bacteria decrease with depth ; 2. below 1.5–2.0 m aerobic stay approximately the same and anaerobic continues to increase(slowly) ; 3. idea of: oxygen content of soil decreases with depth ; 4. idea that: anaerobic bacteria replace the aerobic bacteria as oxygen reduces / (most) aerobic unable to survive in low oxygen ; 1. A general point – but must relate to idea of depth 3. A oxygen content decreases with time 4. A replacement in terms of succession / competition [3] C (b) (i) less activity of, dehydrogenase / enzyme ; A less aerobic respiration R less dehydrogenase [1] E (ii) 2 of: 1. temperature ; 2. pH ; 3. idea of: time that determination was run for ; 4. (soil) moisture / water ; 5. substrate (in soil) ; ignore ref. to oxygen 5. A (named) nutrients (in soil) [2] P (iii) idea of: (soil) without, (active) bacteria / active enzyme ; A heated / boiled / disinfected / sterilised / irradiated / AW, soil A (soil) with, dead / killed bacteria / denatured enzyme / enzyme removed A ref. to add an enzyme inhibitor A remove the bacteria from soil R killed enzyme / replace with (named) inert material [1] P
Mark scheme, page 9
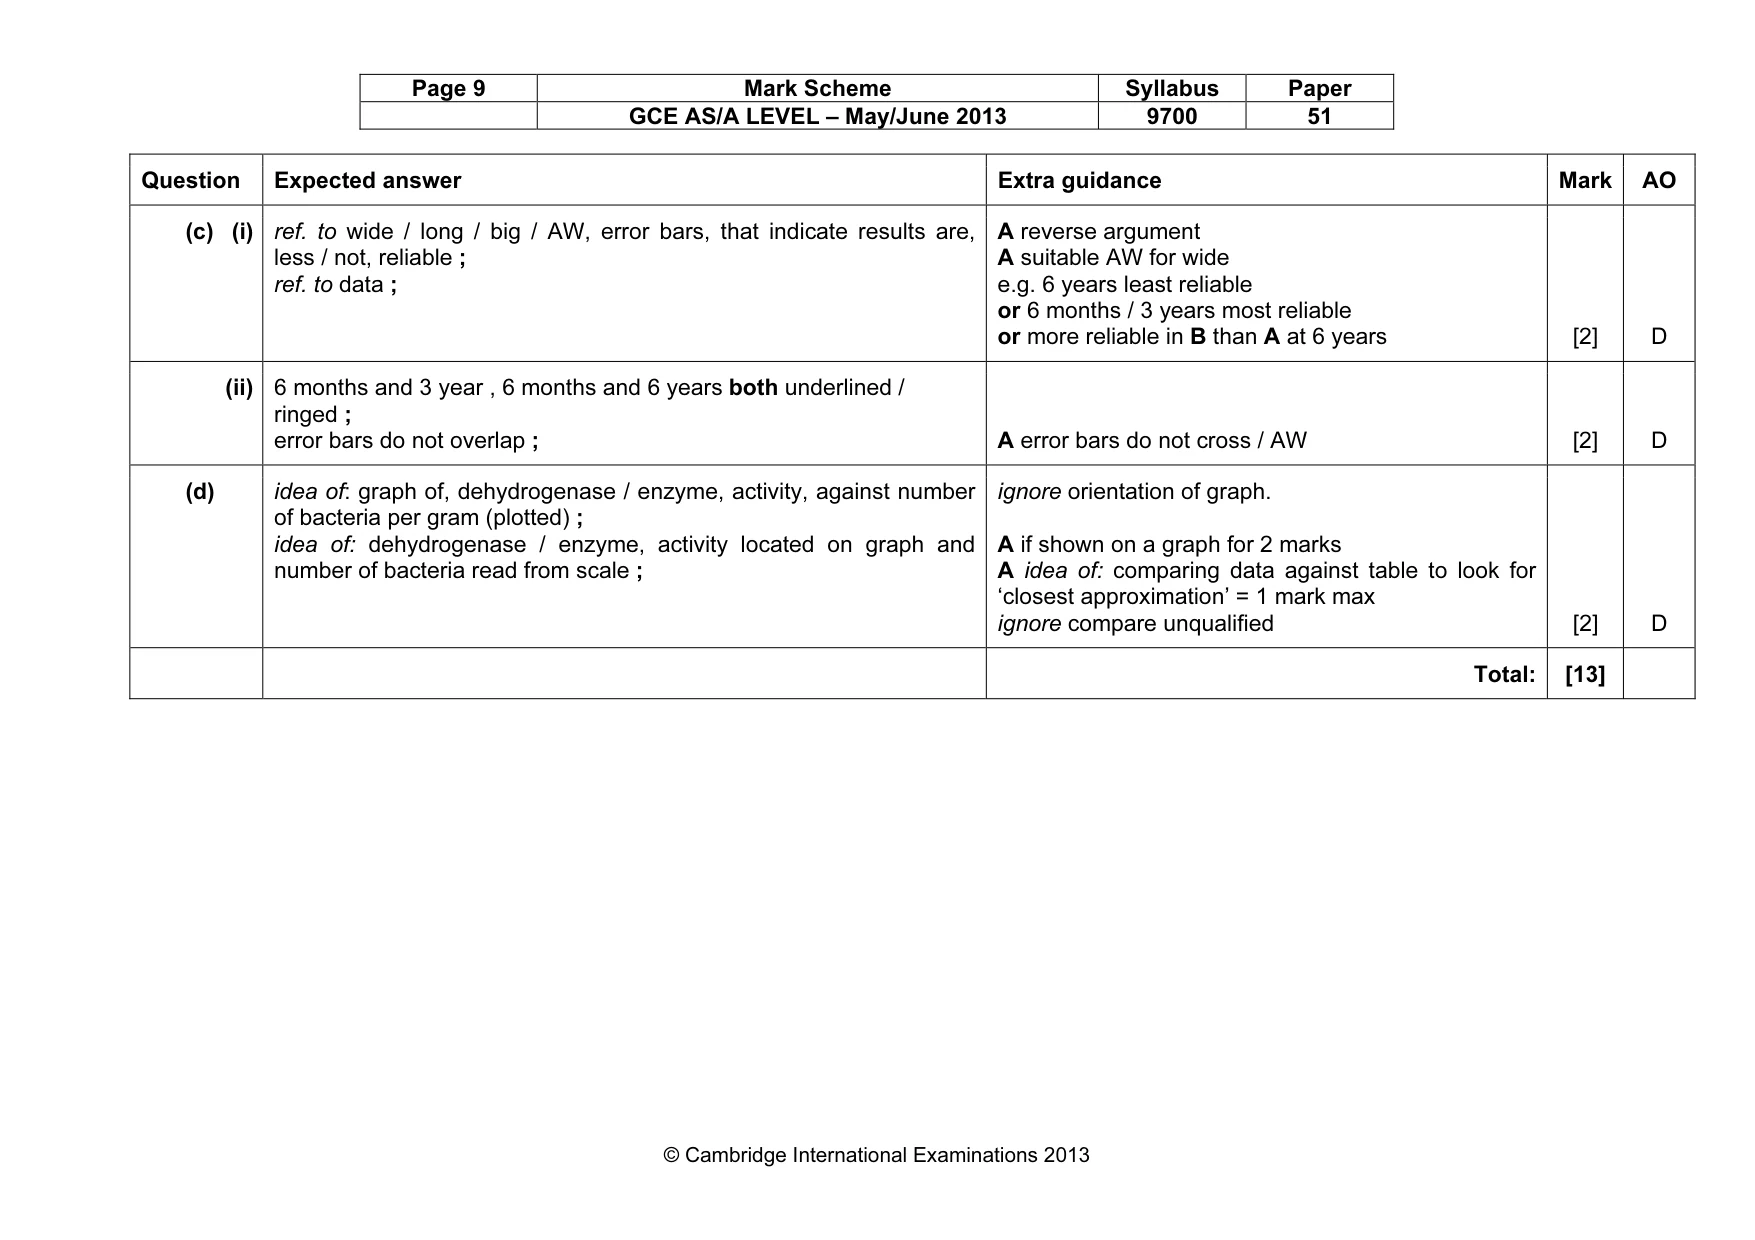
Page 9 Mark Scheme Syllabus Paper GCE AS/A LEVEL – May/June 2013 9700 51 © Cambridge International Examinations 2013 Question Expected answer Extra guidance Mark AO (c) (i) ref. to wide / long / big / AW, error bars, that indicate results are, less / not, reliable ; ref. to data ; A reverse argument A suitable AW for wide e.g. 6 years least reliable or 6 months / 3 years most reliable or more reliable in B than A at 6 years [2] D (ii) 6 months and 3 year , 6 months and 6 years both underlined / ringed ; error bars do not overlap ; A error bars do not cross / AW [2] D (d) idea of: graph of, dehydrogenase / enzyme, activity, against number of bacteria per gram (plotted) ; idea of: dehydrogenase / enzyme, activity located on graph and number of bacteria read from scale ; ignore orientation of graph. A if shown on a graph for 2 marks A idea of: comparing data against table to look for ‘closest approximation’ = 1 mark max ignore compare unqualified [2] D Total: [13]
What you needed in this session
Cambridge’s own grade thresholds for 2013 May/June, Paper 5 · Variant 1. A higher threshold means an easier paper — the bar moves with how the cohort did.