Cambridge A Level Biology 9700 — 2012 Oct/Nov Paper 5 · Variant 2
9700/52/O/N/12 · 30 marks · ≈34 min
The question paper and its mark scheme, free to read here and free to download. This is Cambridge’s own paper, exactly as it was sat.
Question paper12 pages



Mark scheme6 pages
Answers below. Sit the paper first if you are practising.

Paper as text
Question paper, page 1
This document consists of 9 printed pages and 3 blank pages. DC (SLM) 65180 © UCLES 2012 [Turn over UNIVERSITY OF CAMBRIDGE INTERNATIONAL EXAMINATIONS General Certificate of Education Advanced Level * 9 8 3 6 9 2 1 4 2 9 * BIOLOGY 9700/52 Paper 5 Planning, Analysis and Evaluation October/November 2012 1 hour 15 minutes Candidates answer on the Question Paper. No Additional Materials are required. READ THESE INSTRUCTIONS FIRST Write your Centre number, candidate number and name on all the work you hand in. Write in dark blue or black ink. You may use a pencil for any diagrams, graphs or rough working. Do not use staples, paper clips, highlighters, glue or correction fluid. DO NOT WRITE IN ANY BARCODES. Answer both questions. At the end of the examination, fasten all your work securely together. The number of marks is given in brackets [ ] at the end of each question or part question. For Examiner’s Use 1 2 Total
Question paper, page 2
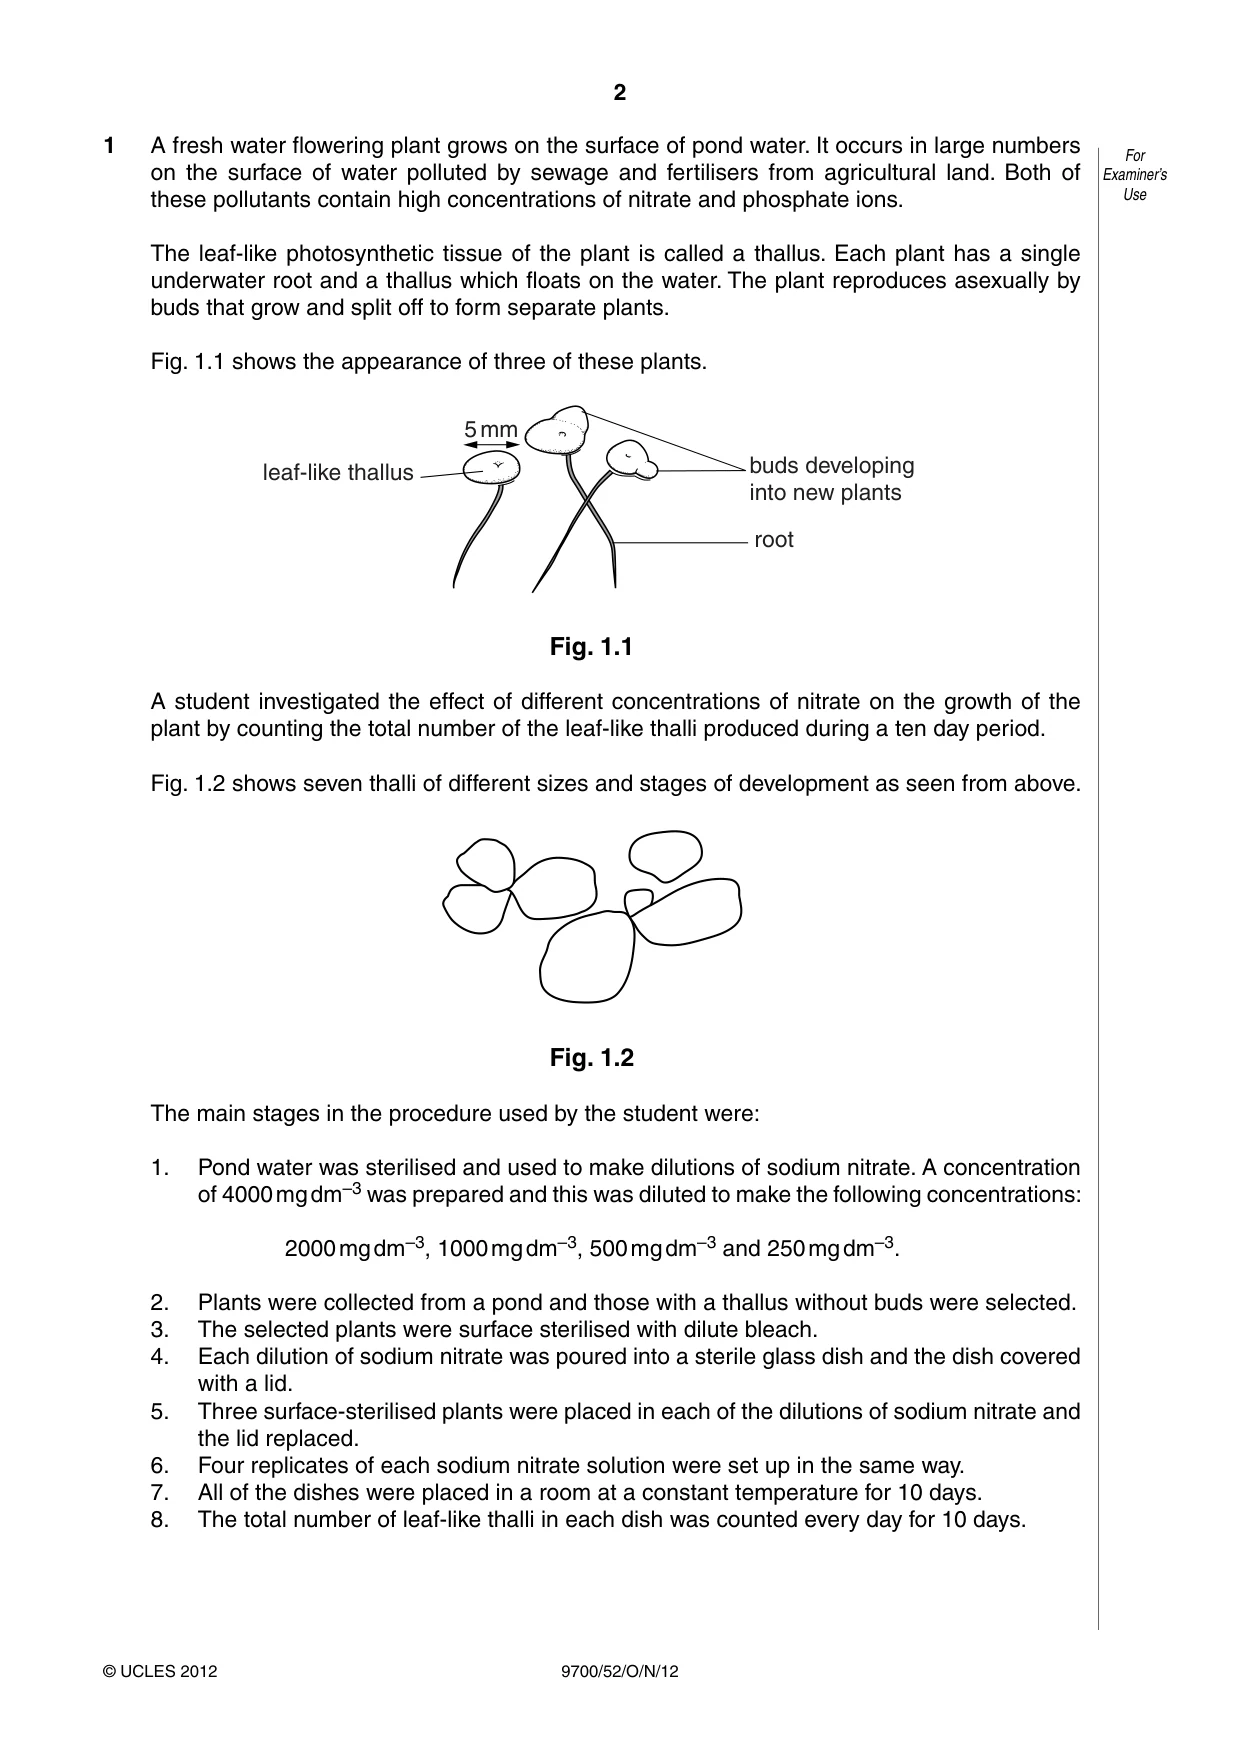
2 9700/52/O/N/12 © UCLES 2012 For Examiner’s Use 1 A fresh water flowering plant grows on the surface of pond water. It occurs in large numbers on the surface of water polluted by sewage and fertilisers from agricultural land. Both of these pollutants contain high concentrations of nitrate and phosphate ions. The leaf-like photosynthetic tissue of the plant is called a thallus. Each plant has a single underwater root and a thallus which floats on the water. The plant reproduces asexually by buds that grow and split off to form separate plants. Fig. 1.1 shows the appearance of three of these plants. leaf-like thallus 5 mm buds developing into new plants root Fig. 1.1 A student investigated the effect of different concentrations of nitrate on the growth of the plant by counting the total number of the leaf-like thalli produced during a ten day period. Fig. 1.2 shows seven thalli of different sizes and stages of development as seen from above. Fig. 1.2 The main stages in the procedure used by the student were: 1. Pond water was sterilised and used to make dilutions of sodium nitrate. A concentration of 4000 mg dm–3 was prepared and this was diluted to make the following concentrations: 2000 mg dm–3, 1000 mg dm–3, 500 mg dm–3 and 250 mg dm–3. 2. Plants were collected from a pond and those with a thallus without buds were selected. 3. The selected plants were surface sterilised with dilute bleach. 4. Each dilution of sodium nitrate was poured into a sterile glass dish and the dish covered with a lid. 5. Three surface-sterilised plants were placed in each of the dilutions of sodium nitrate and the lid replaced. 6. Four replicates of each sodium nitrate solution were set up in the same way. 7. All of the dishes were placed in a room at a constant temperature for 10 days. 8. The total number of leaf-like thalli in each dish was counted every day for 10 days.
Question paper, page 3
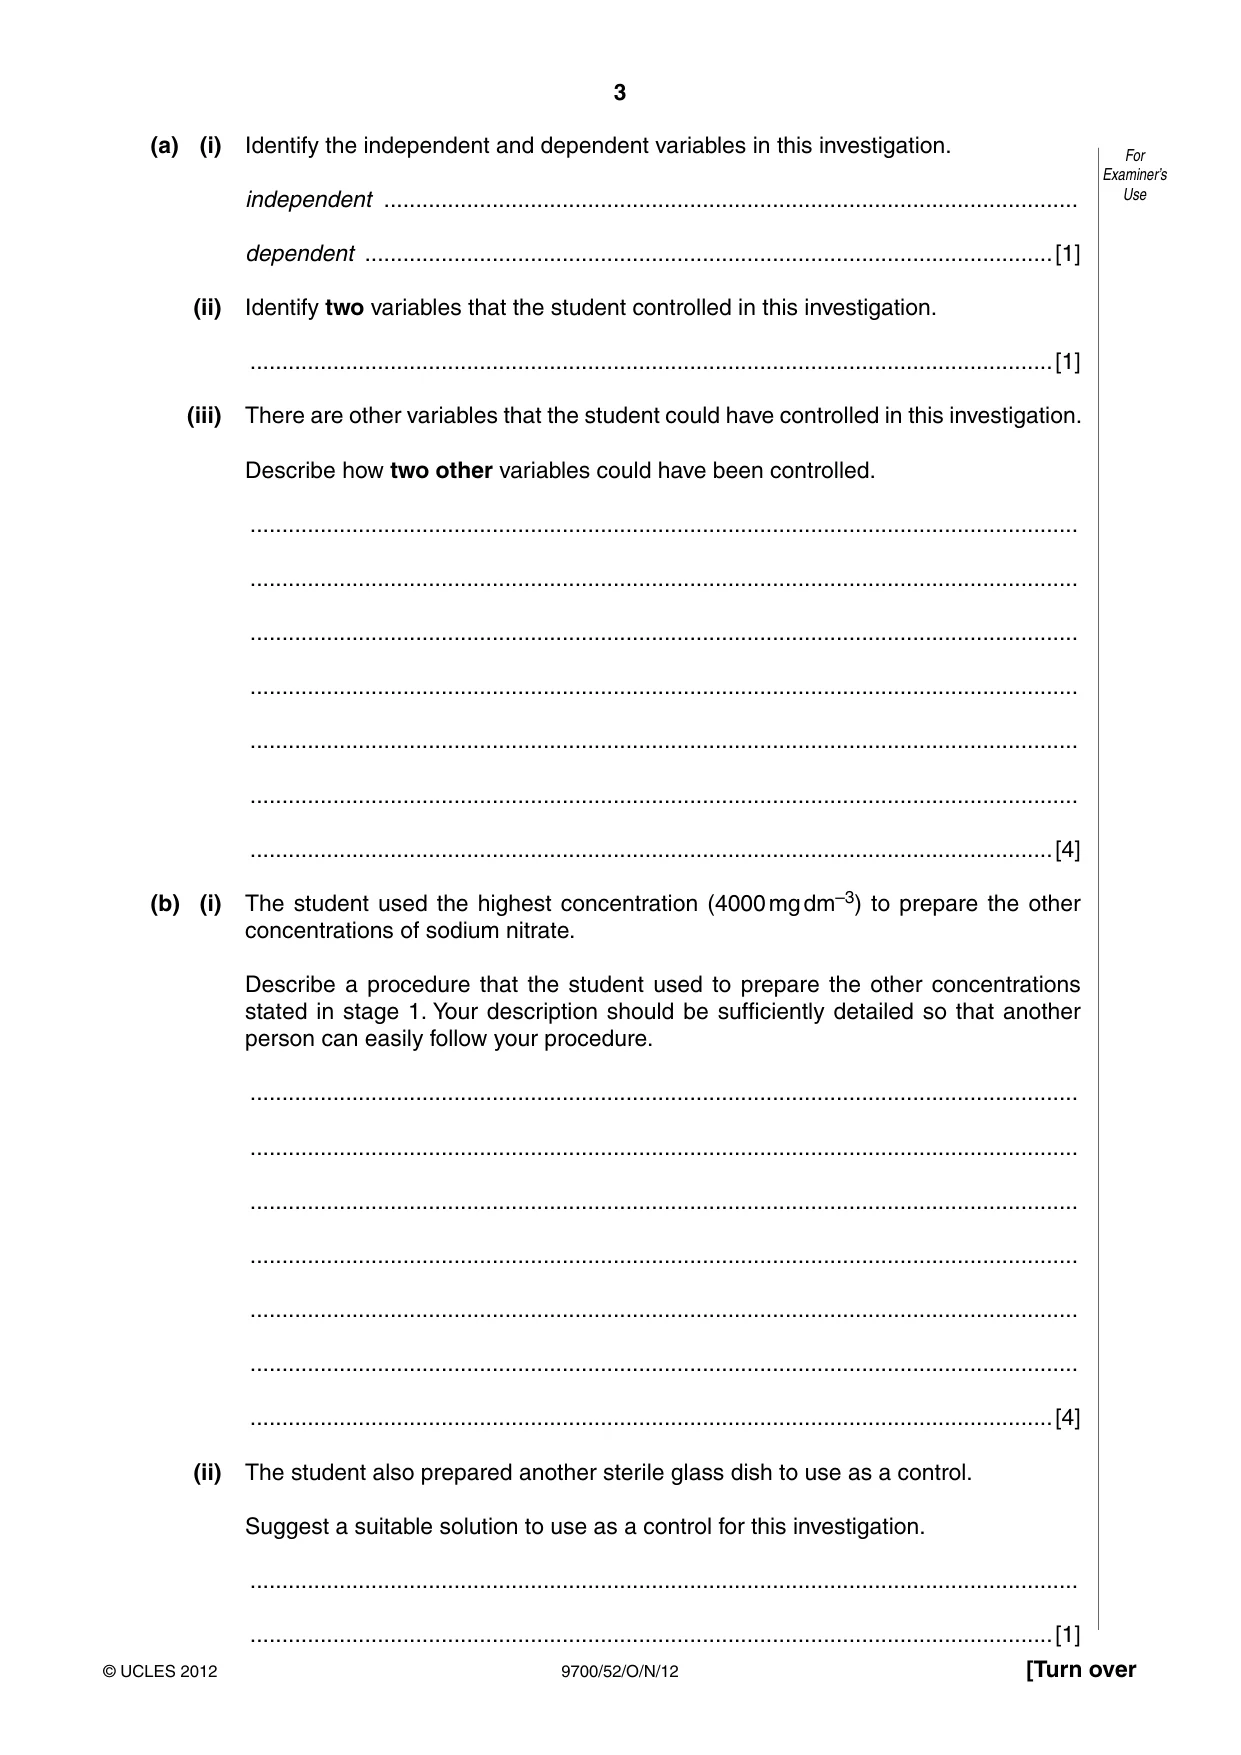
3 9700/52/O/N/12 © UCLES 2012 [Turn over For Examiner’s Use (a) (i) Identify the independent and dependent variables in this investigation. independent … dependent …[1] (ii) Identify two variables that the student controlled in this investigation. …[1] (iii) There are other variables that the student could have controlled in this investigation. Describe how two other variables could have been controlled. … … … … … … …[4] (b) (i) The student used the highest concentration (4000 mg dm–3) to prepare the other concentrations of sodium nitrate. Describe a procedure that the student used to prepare the other concentrations stated in stage 1. Your description should be sufficiently detailed so that another person can easily follow your procedure. … … … … … … …[4] (ii) The student also prepared another sterile glass dish to use as a control. Suggest a suitable solution to use as a control for this investigation. … …[1]
Question paper, page 4
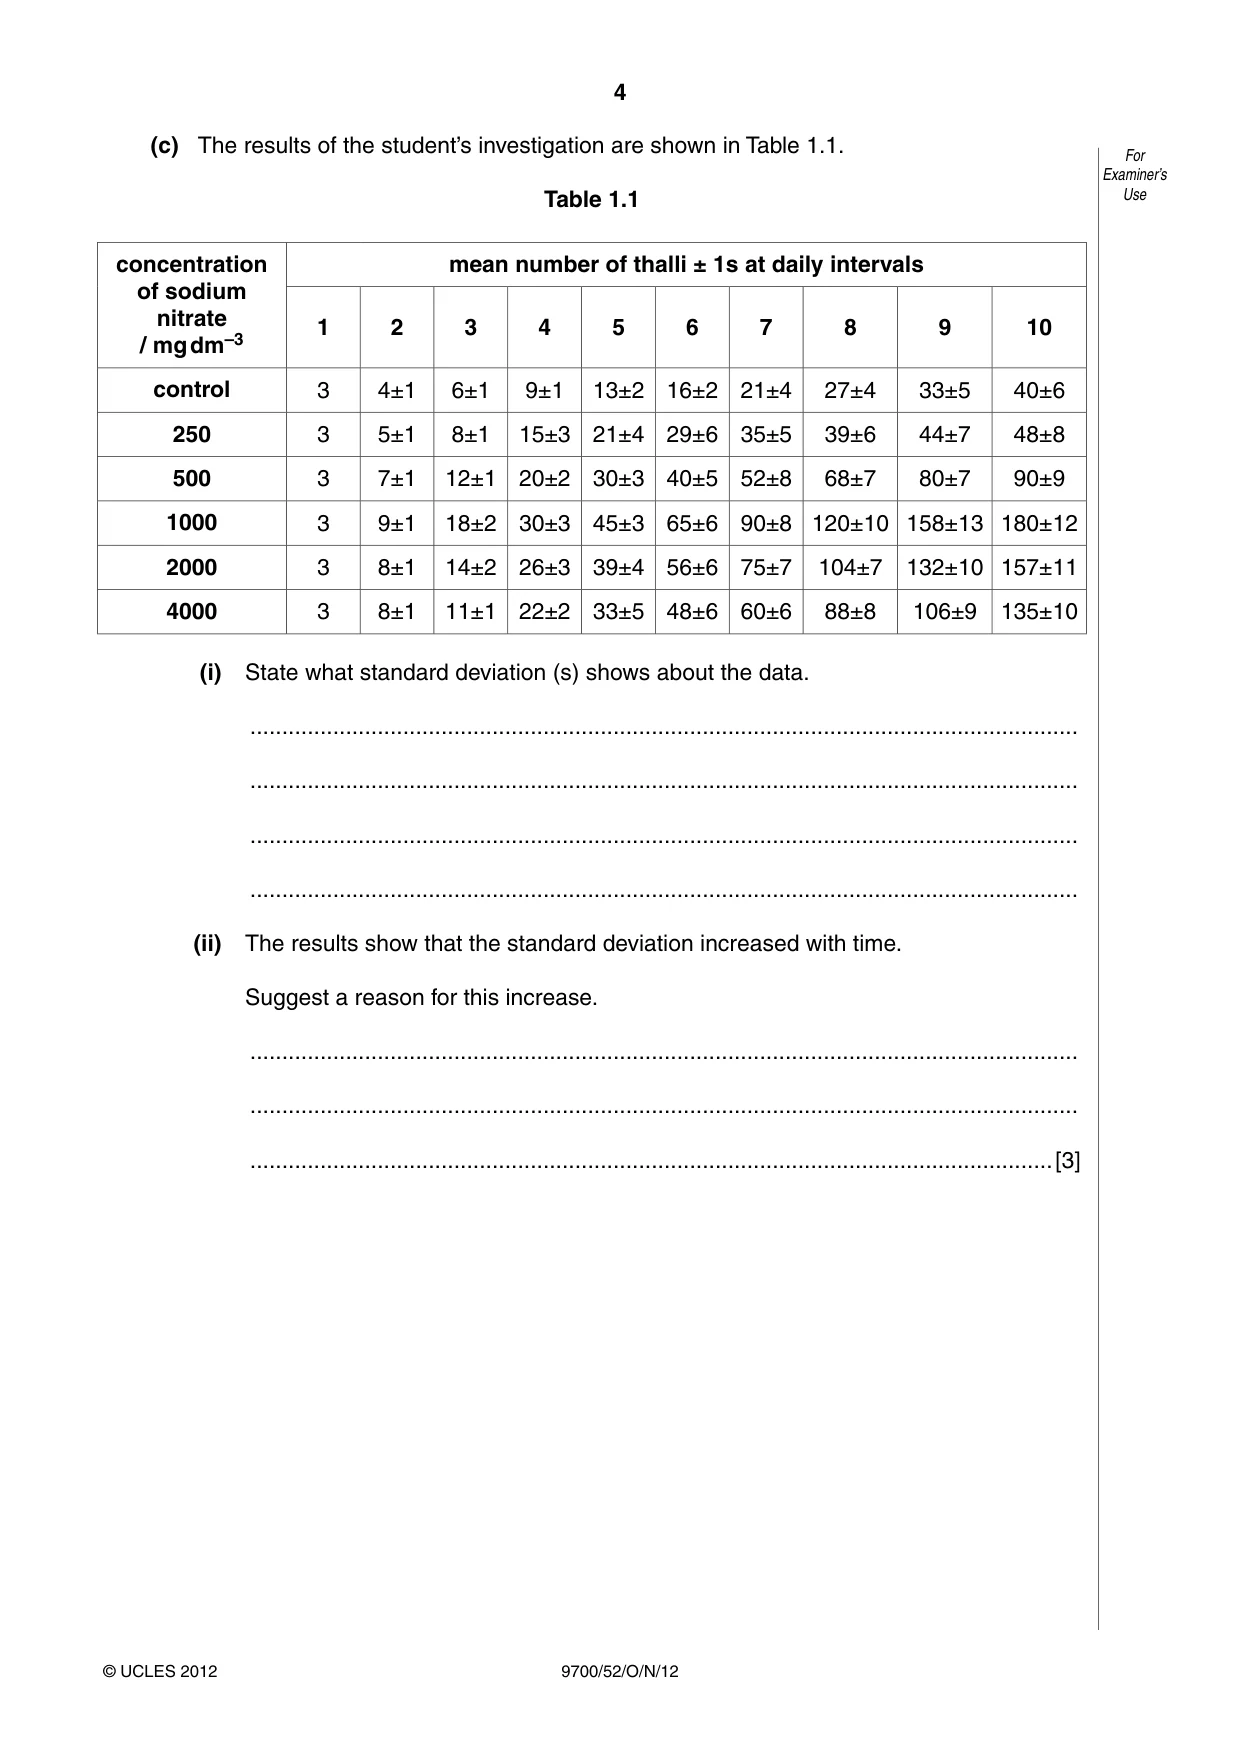
4 9700/52/O/N/12 © UCLES 2012 For Examiner’s Use (c) The results of the student’s investigation are shown in Table 1.1. Table 1.1 concentration of sodium nitrate / mg dm–3 mean number of thalli ± 1s at daily intervals 1 2 3 4 5 6 7 8 9 10 control 3 4±1 6±1 9±1 13±2 16±2 21±4 27±4 33±5 40±6 250 3 5±1 8±1 15±3 21±4 29±6 35±5 39±6 44±7 48±8 500 3 7±1 12±1 20±2 30±3 40±5 52±8 68±7 80±7 90±9 1000 3 9±1 18±2 30±3 45±3 65±6 90±8 120±10 158±13 180±12 2000 3 8±1 14±2 26±3 39±4 56±6 75±7 104±7 132±10 157±11 4000 3 8±1 11±1 22±2 33±5 48±6 60±6 88±8 106±9 135±10 (i) State what standard deviation (s) shows about the data. … … … … (ii) The results show that the standard deviation increased with time. Suggest a reason for this increase. … … …[3]
Question paper, page 5
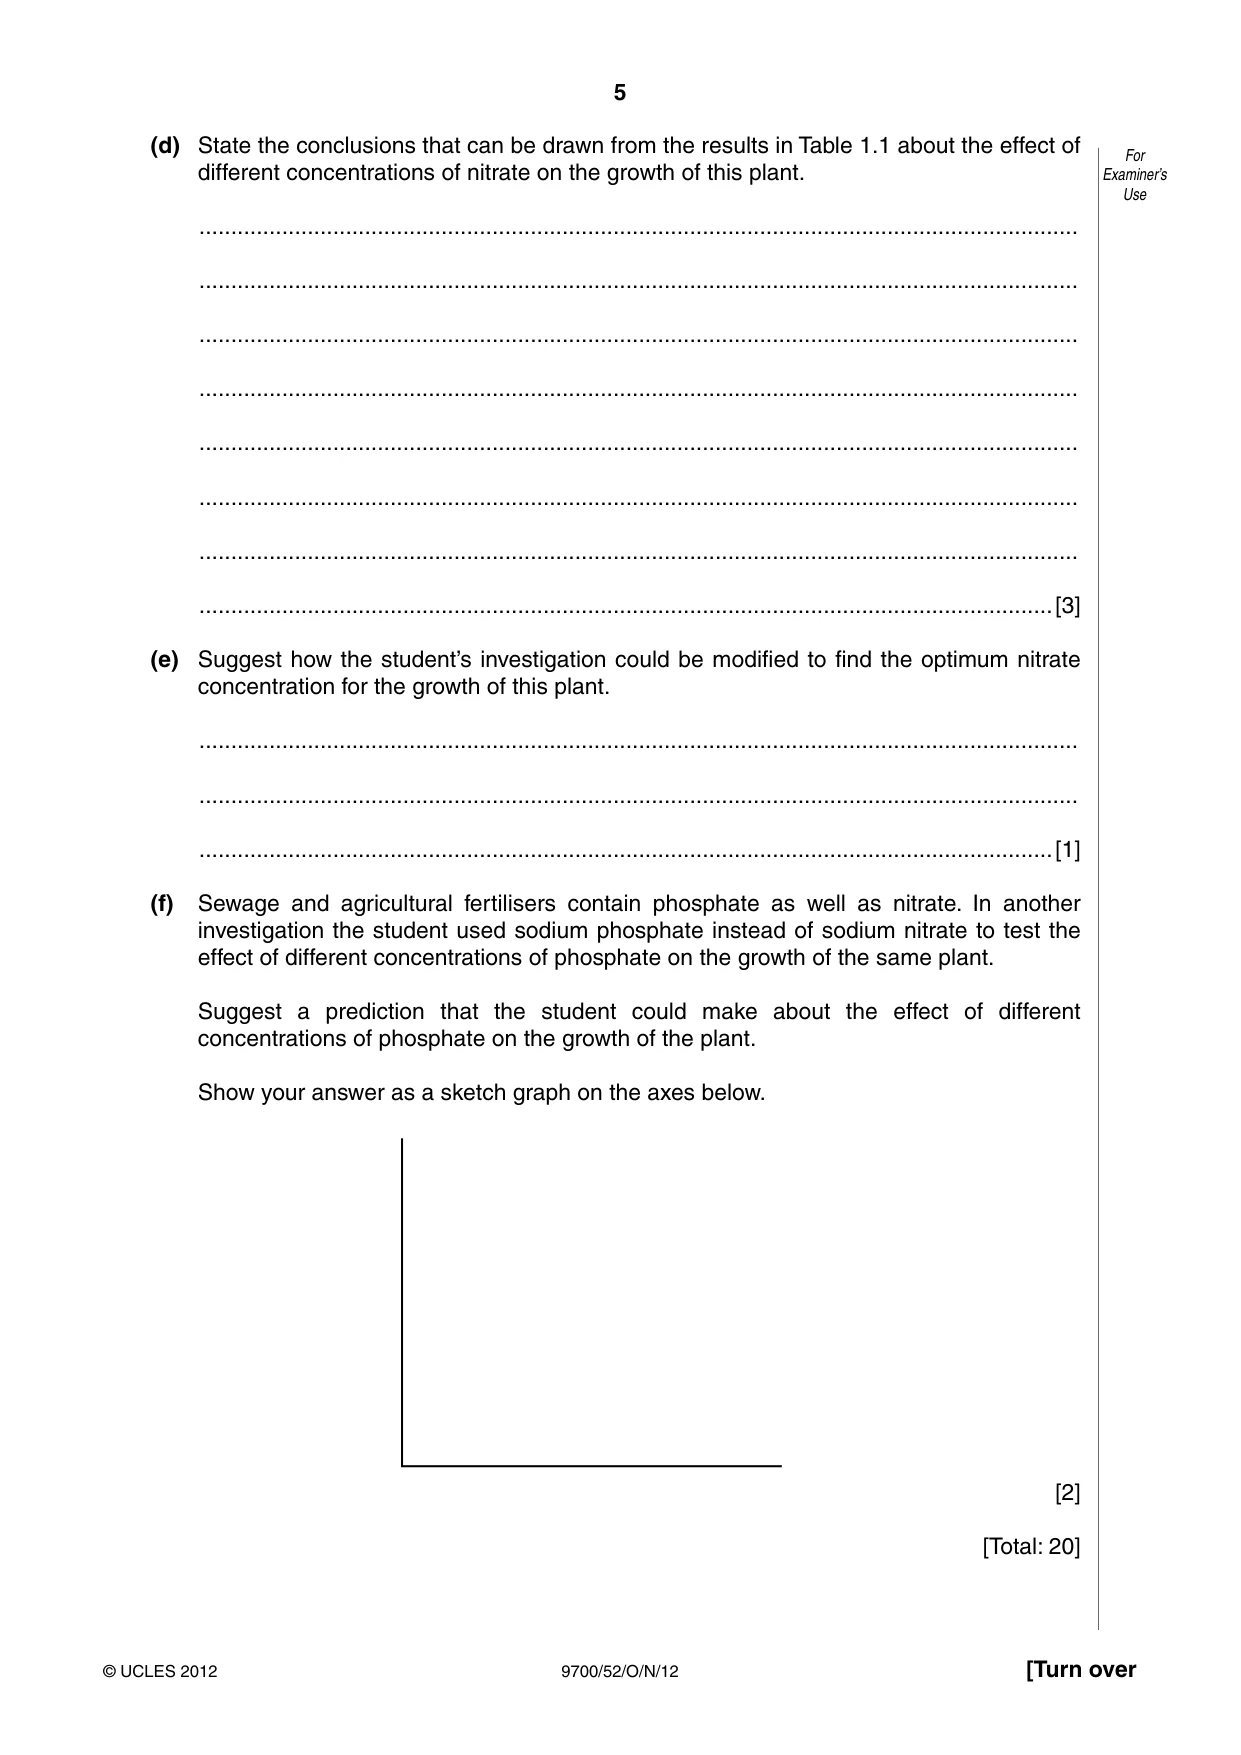
5 9700/52/O/N/12 © UCLES 2012 [Turn over For Examiner’s Use (d) State the conclusions that can be drawn from the results in Table 1.1 about the effect of different concentrations of nitrate on the growth of this plant. … … … … … … … …[3] (e) Suggest how the student’s investigation could be modified to find the optimum nitrate concentration for the growth of this plant. … … …[1] (f) Sewage and agricultural fertilisers contain phosphate as well as nitrate. In another investigation the student used sodium phosphate instead of sodium nitrate to test the effect of different concentrations of phosphate on the growth of the same plant. Suggest a prediction that the student could make about the effect of different concentrations of phosphate on the growth of the plant. Show your answer as a sketch graph on the axes below. [2] [Total: 20]
Question paper, page 6
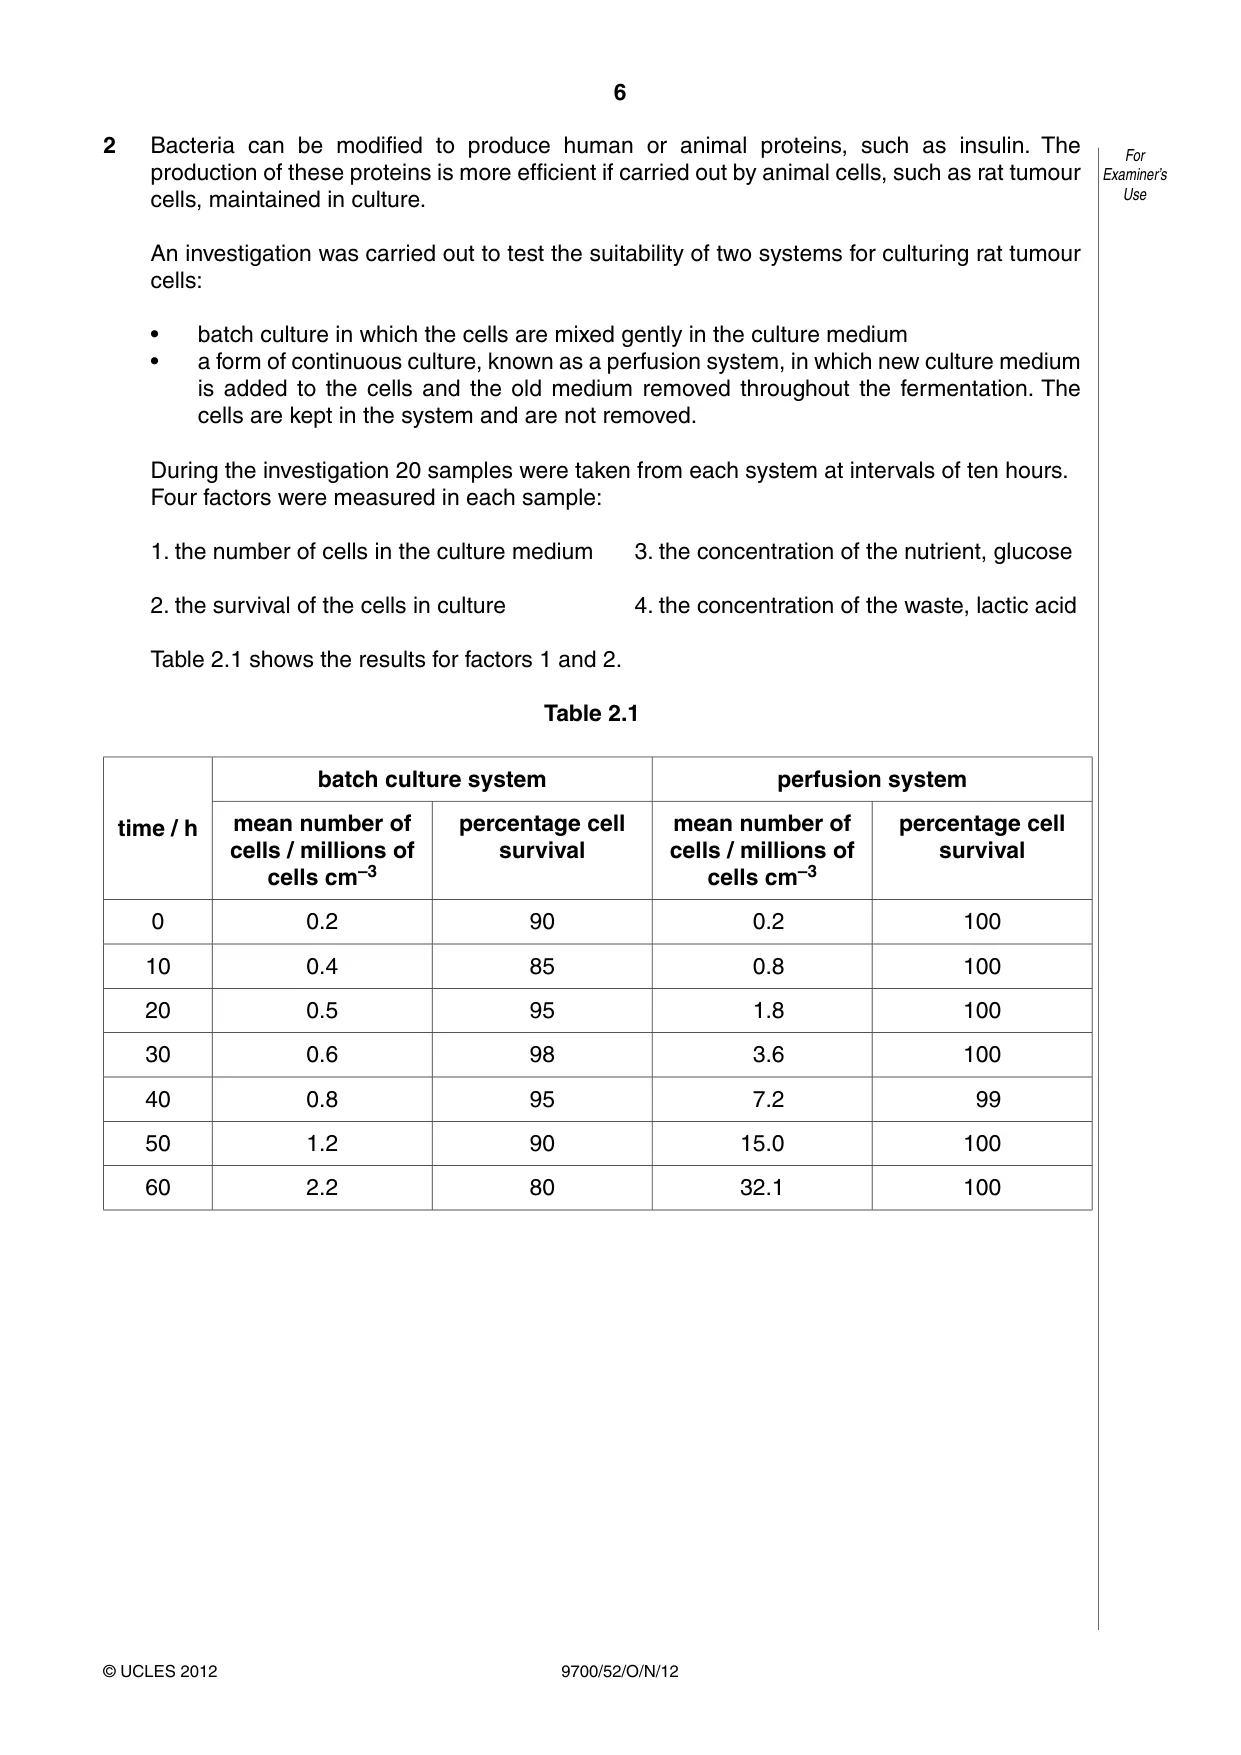
6 9700/52/O/N/12 © UCLES 2012 For Examiner’s Use 2 Bacteria can be modified to produce human or animal proteins, such as insulin. The production of these proteins is more efficient if carried out by animal cells, such as rat tumour cells, maintained in culture. An investigation was carried out to test the suitability of two systems for culturing rat tumour cells: • batch culture in which the cells are mixed gently in the culture medium • a form of continuous culture, known as a perfusion system, in which new culture medium is added to the cells and the old medium removed throughout the fermentation. The cells are kept in the system and are not removed. During the investigation 20 samples were taken from each system at intervals of ten hours. Four factors were measured in each sample: 1. the number of cells in the culture medium 3. the concentration of the nutrient, glucose 2. the survival of the cells in culture 4. the concentration of the waste, lactic acid Table 2.1 shows the results for factors 1 and 2. Table 2.1 time / h batch culture system perfusion system mean number of cells / millions of cells cm–3 percentage cell survival mean number of cells / millions of cells cm–3 percentage cell survival 0 0.2 90 0.2 100 10 0.4 85 0.8 100 20 0.5 95 1.8 100 30 0.6 98 3.6 100 40 0.8 95 7.2 99 50 1.2 90 15.0 100 60 2.2 80 32.1 100
Question paper, page 7
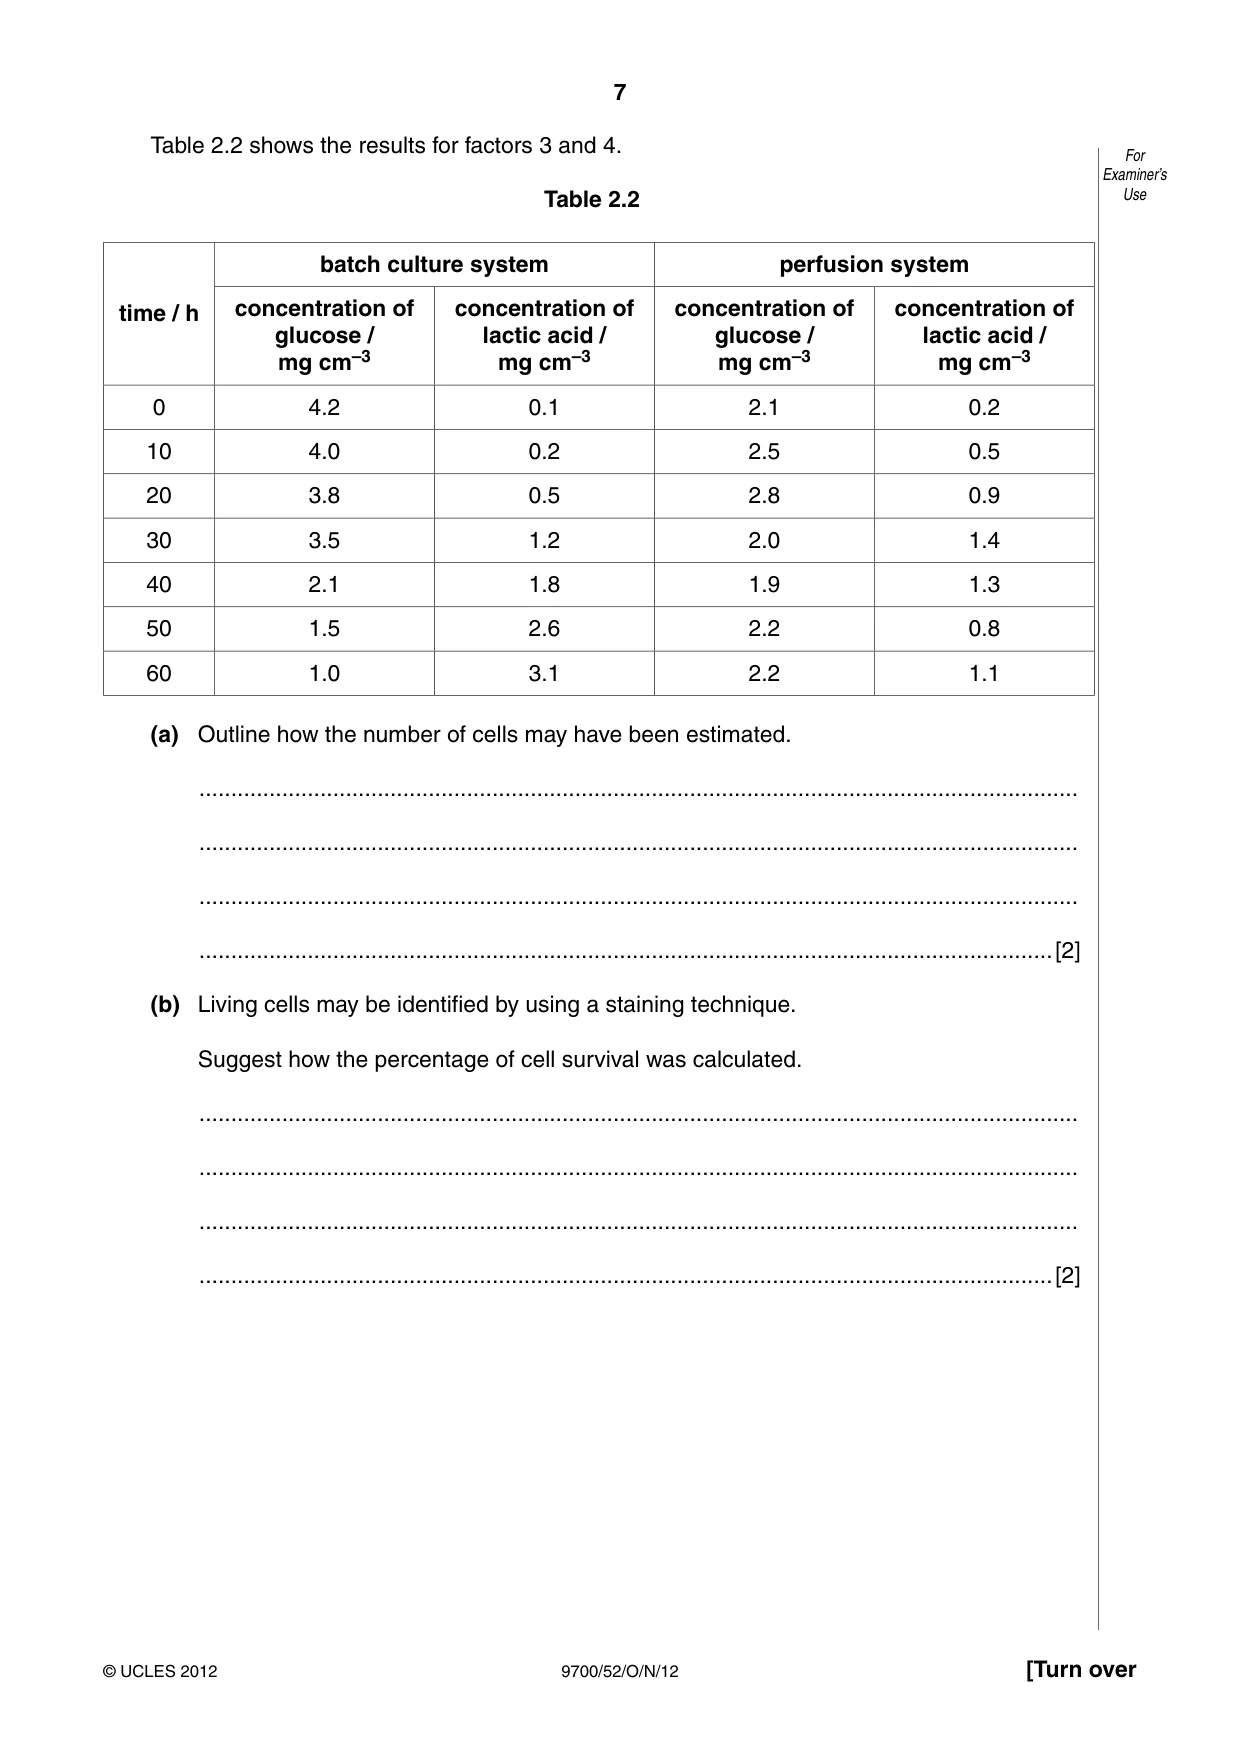
7 9700/52/O/N/12 © UCLES 2012 [Turn over For Examiner’s Use Table 2.2 shows the results for factors 3 and 4. Table 2.2 time / h batch culture system perfusion system concentration of glucose / mg cm–3 concentration of lactic acid / mg cm–3 concentration of glucose / mg cm–3 concentration of lactic acid / mg cm–3 0 4.2 0.1 2.1 0.2 10 4.0 0.2 2.5 0.5 20 3.8 0.5 2.8 0.9 30 3.5 1.2 2.0 1.4 40 2.1 1.8 1.9 1.3 50 1.5 2.6 2.2 0.8 60 1.0 3.1 2.2 1.1 (a) Outline how the number of cells may have been estimated. … … … …[2] (b) Living cells may be identified by using a staining technique. Suggest how the percentage of cell survival was calculated. … … … …[2]
Question paper, page 8
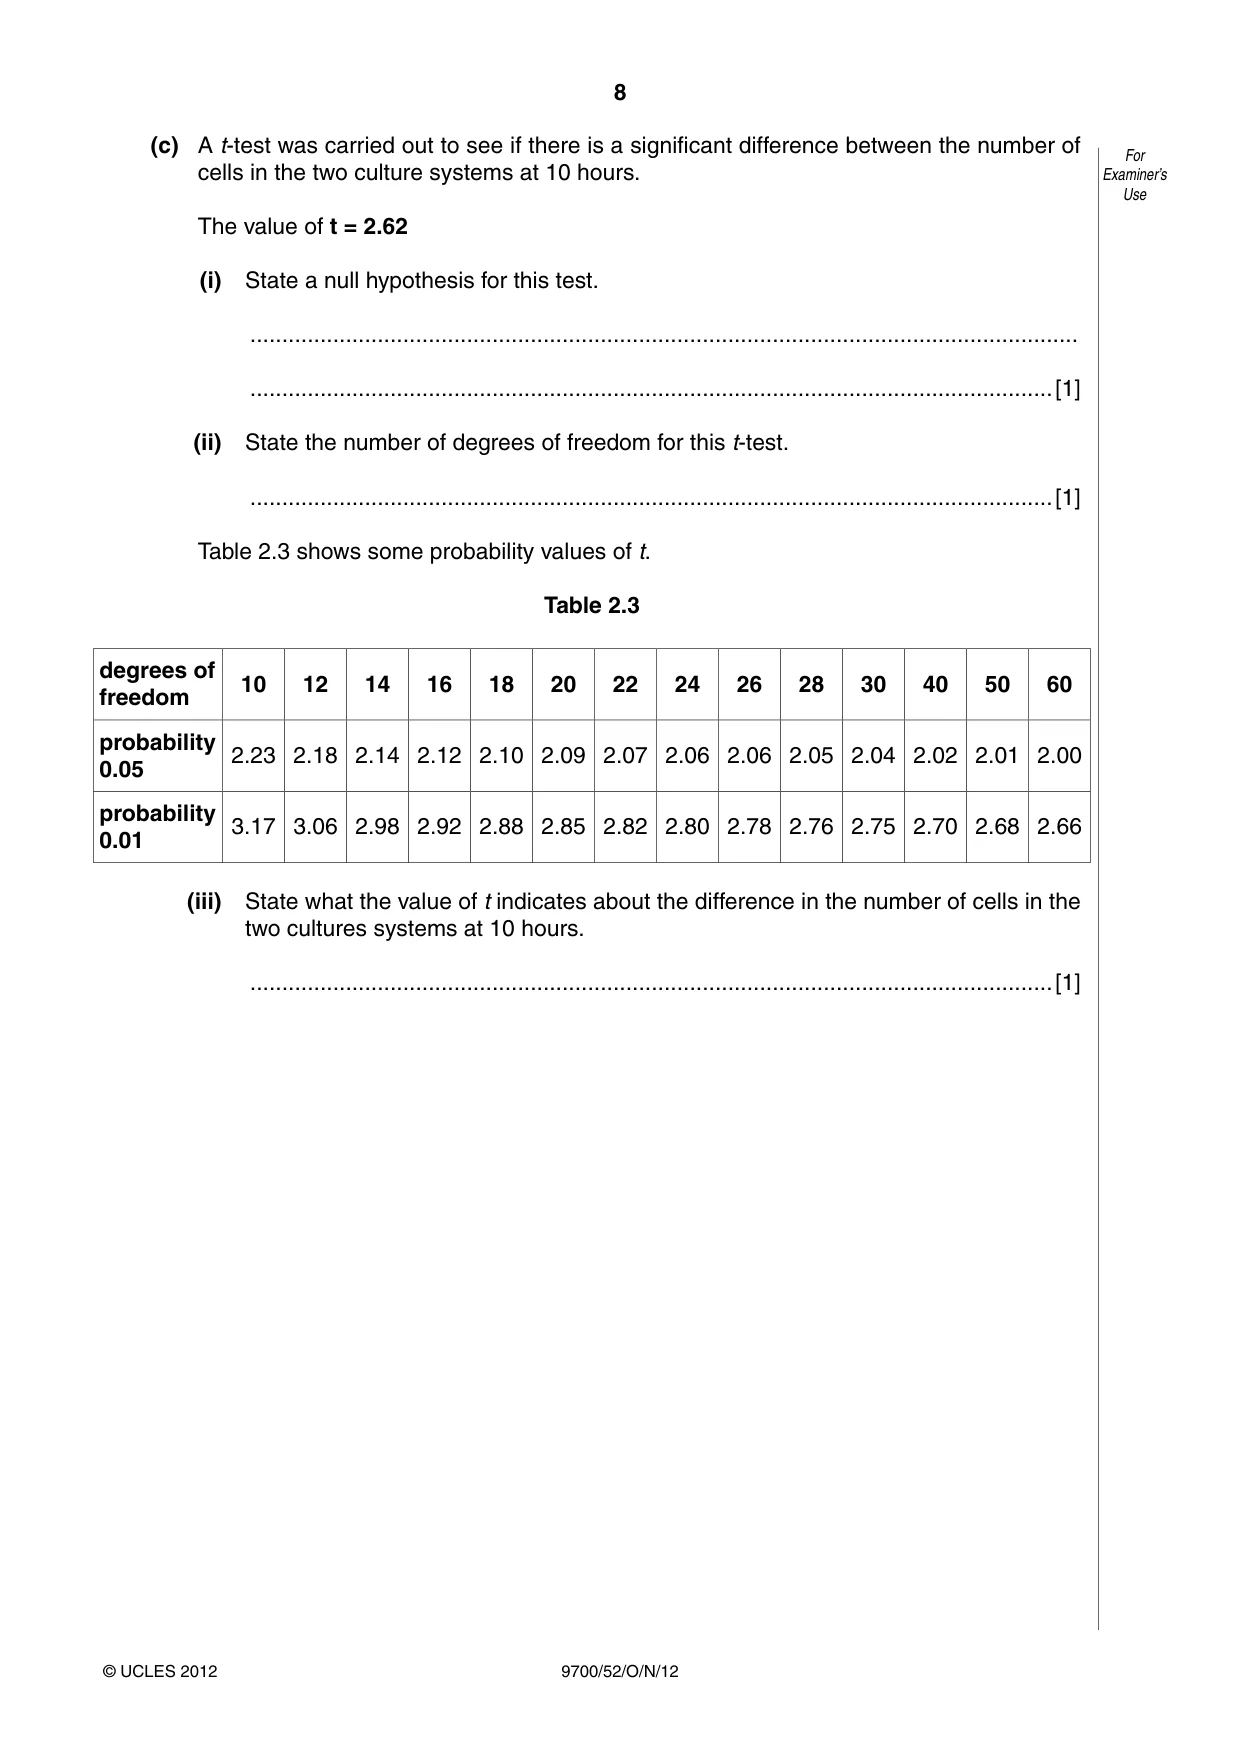
8 9700/52/O/N/12 © UCLES 2012 For Examiner’s Use (c) A t-test was carried out to see if there is a significant difference between the number of cells in the two culture systems at 10 hours. The value of t = 2.62 (i) State a null hypothesis for this test. … …[1] (ii) State the number of degrees of freedom for this t-test. …[1] Table 2.3 shows some probability values of t. Table 2.3 degrees of freedom 10 12 14 16 18 20 22 24 26 28 30 40 50 60 probability 0.05 2.23 2.18 2.14 2.12 2.10 2.09 2.07 2.06 2.06 2.05 2.04 2.02 2.01 2.00 probability 0.01 3.17 3.06 2.98 2.92 2.88 2.85 2.82 2.80 2.78 2.76 2.75 2.70 2.68 2.66 (iii) State what the value of t indicates about the difference in the number of cells in the two cultures systems at 10 hours. …[1]
Question paper, page 9
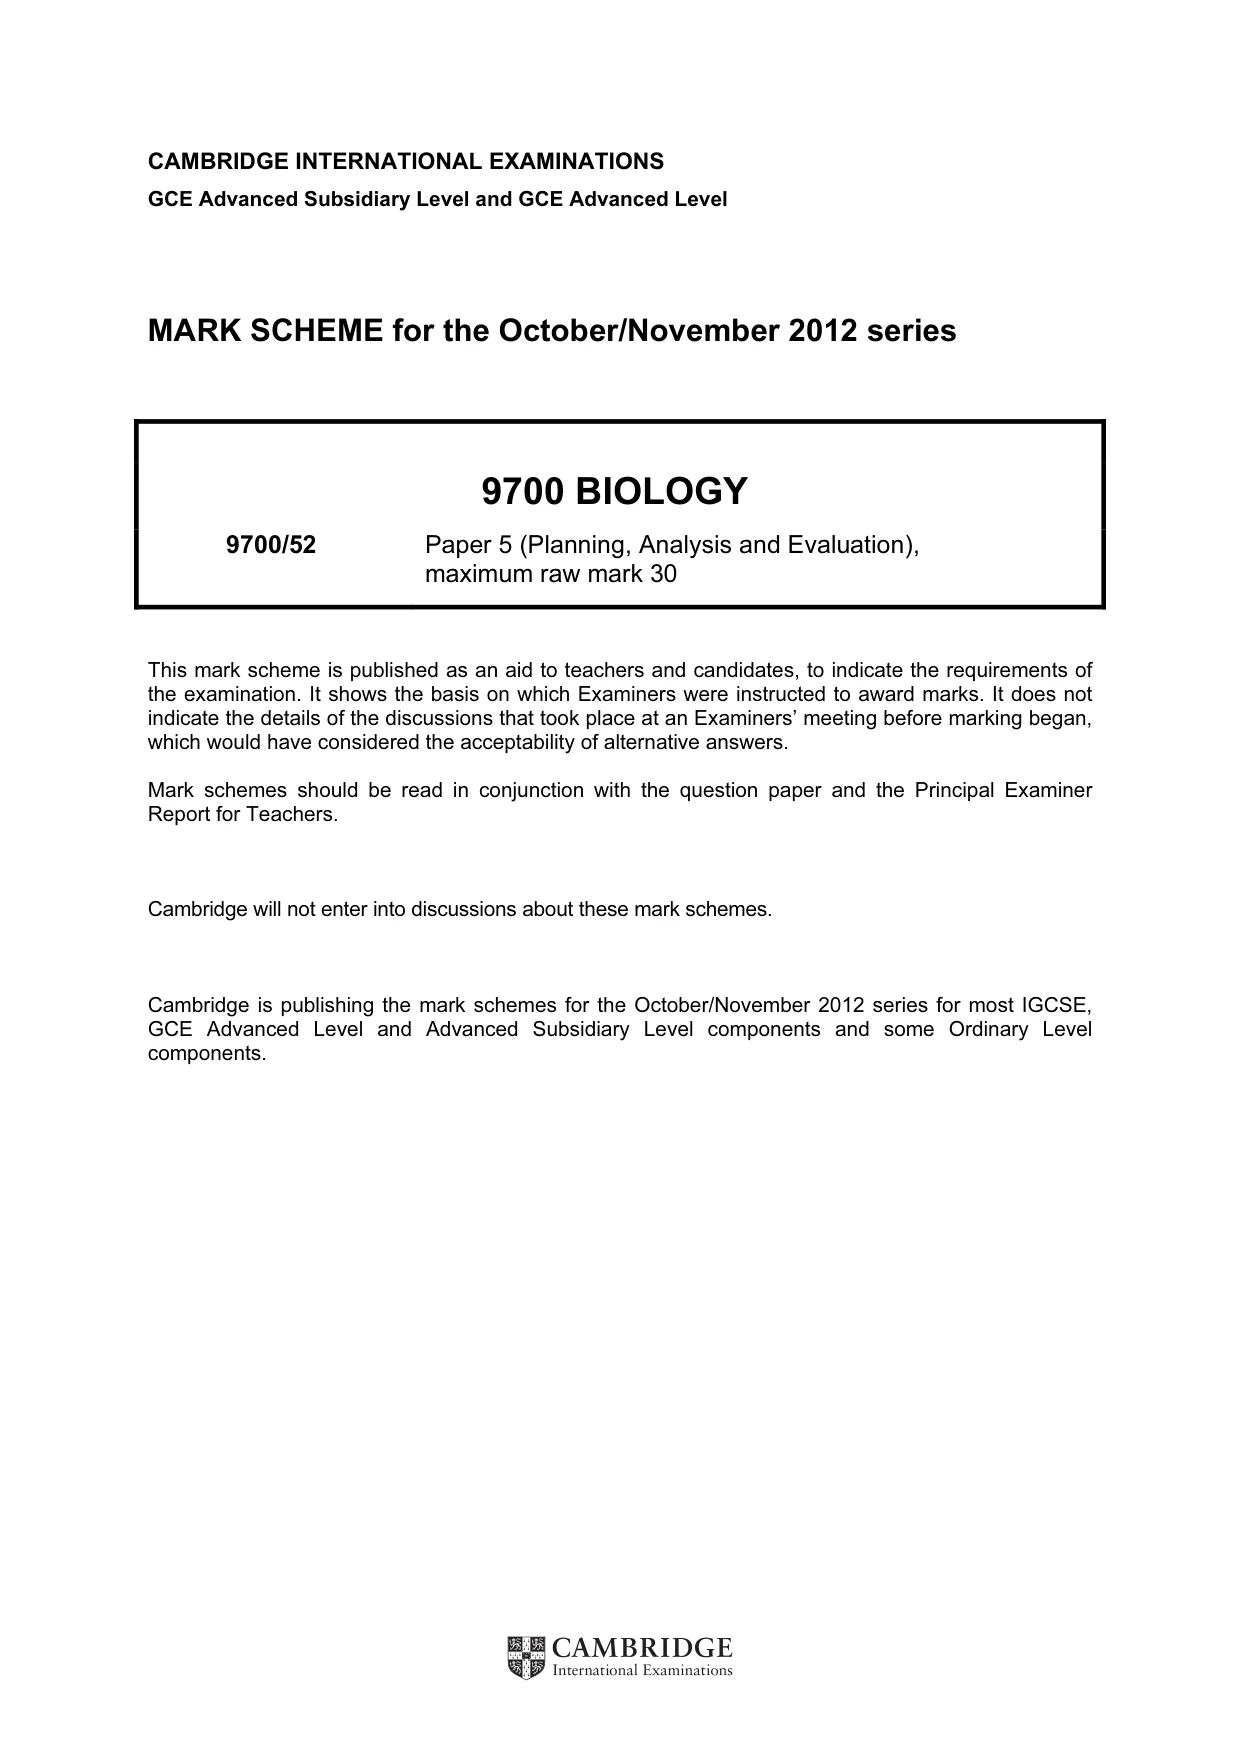
9 9700/52/O/N/12 © UCLES 2012 For Examiner’s Use (d) The investigation showed that the perfusion system is a more efficient way to culture rat tumour cells. Describe how the data in Table 2.1 and Table 2.2 support the statement that the perfusion system is more efficient. … … … … … … … … …[3] [Total: 10]
Question paper, page 10
10 9700/52/O/N/12 © UCLES 2012 BLANK PAGE
Question paper, page 11
11 9700/52/O/N/12 © UCLES 2012 BLANK PAGE
Question paper, page 12
12 9700/52/O/N/12 © UCLES 2012 BLANK PAGE Permission to reproduce items where third-party owned material protected by copyright is included has been sought and cleared where possible. Every reasonable effort has been made by the publisher (UCLES) to trace copyright holders, but if any items requiring clearance have unwittingly been included, the publisher will be pleased to make amends at the earliest possible opportunity. University of Cambridge International Examinations is part of the Cambridge Assessment Group. Cambridge Assessment is the brand name of University of Cambridge Local Examinations Syndicate (UCLES), which is itself a department of the University of Cambridge.
Mark scheme, page 1
CAMBRIDGE INTERNATIONAL EXAMINATIONS GCE Advanced Subsidiary Level and GCE Advanced Level MARK SCHEME for the October/November 2012 series 9700 BIOLOGY 9700/52 Paper 5 (Planning, Analysis and Evaluation), maximum raw mark 30 This mark scheme is published as an aid to teachers and candidates, to indicate the requirements of the examination. It shows the basis on which Examiners were instructed to award marks. It does not indicate the details of the discussions that took place at an Examiners’ meeting before marking began, which would have considered the acceptability of alternative answers. Mark schemes should be read in conjunction with the question paper and the Principal Examiner Report for Teachers. Cambridge will not enter into discussions about these mark schemes. Cambridge is publishing the mark schemes for the October/November 2012 series for most IGCSE, GCE Advanced Level and Advanced Subsidiary Level components and some Ordinary Level components.
Mark scheme, page 2
Page 2 Mark Scheme Syllabus Paper GCE AS/A LEVEL – October/November 2012 9700 52 © Cambridge International Examinations 2012 Mark scheme abbreviations: ; separates marking points / alternatives answers for the same point R reject A accept (for answers correctly cued by the question, or extra guidance) AW alternative wording (where responses vary more than usual) underline actual word given must be used by candidate (grammatical variants excepted) max indicates the maximum number of marks that can be given
Mark scheme, page 3
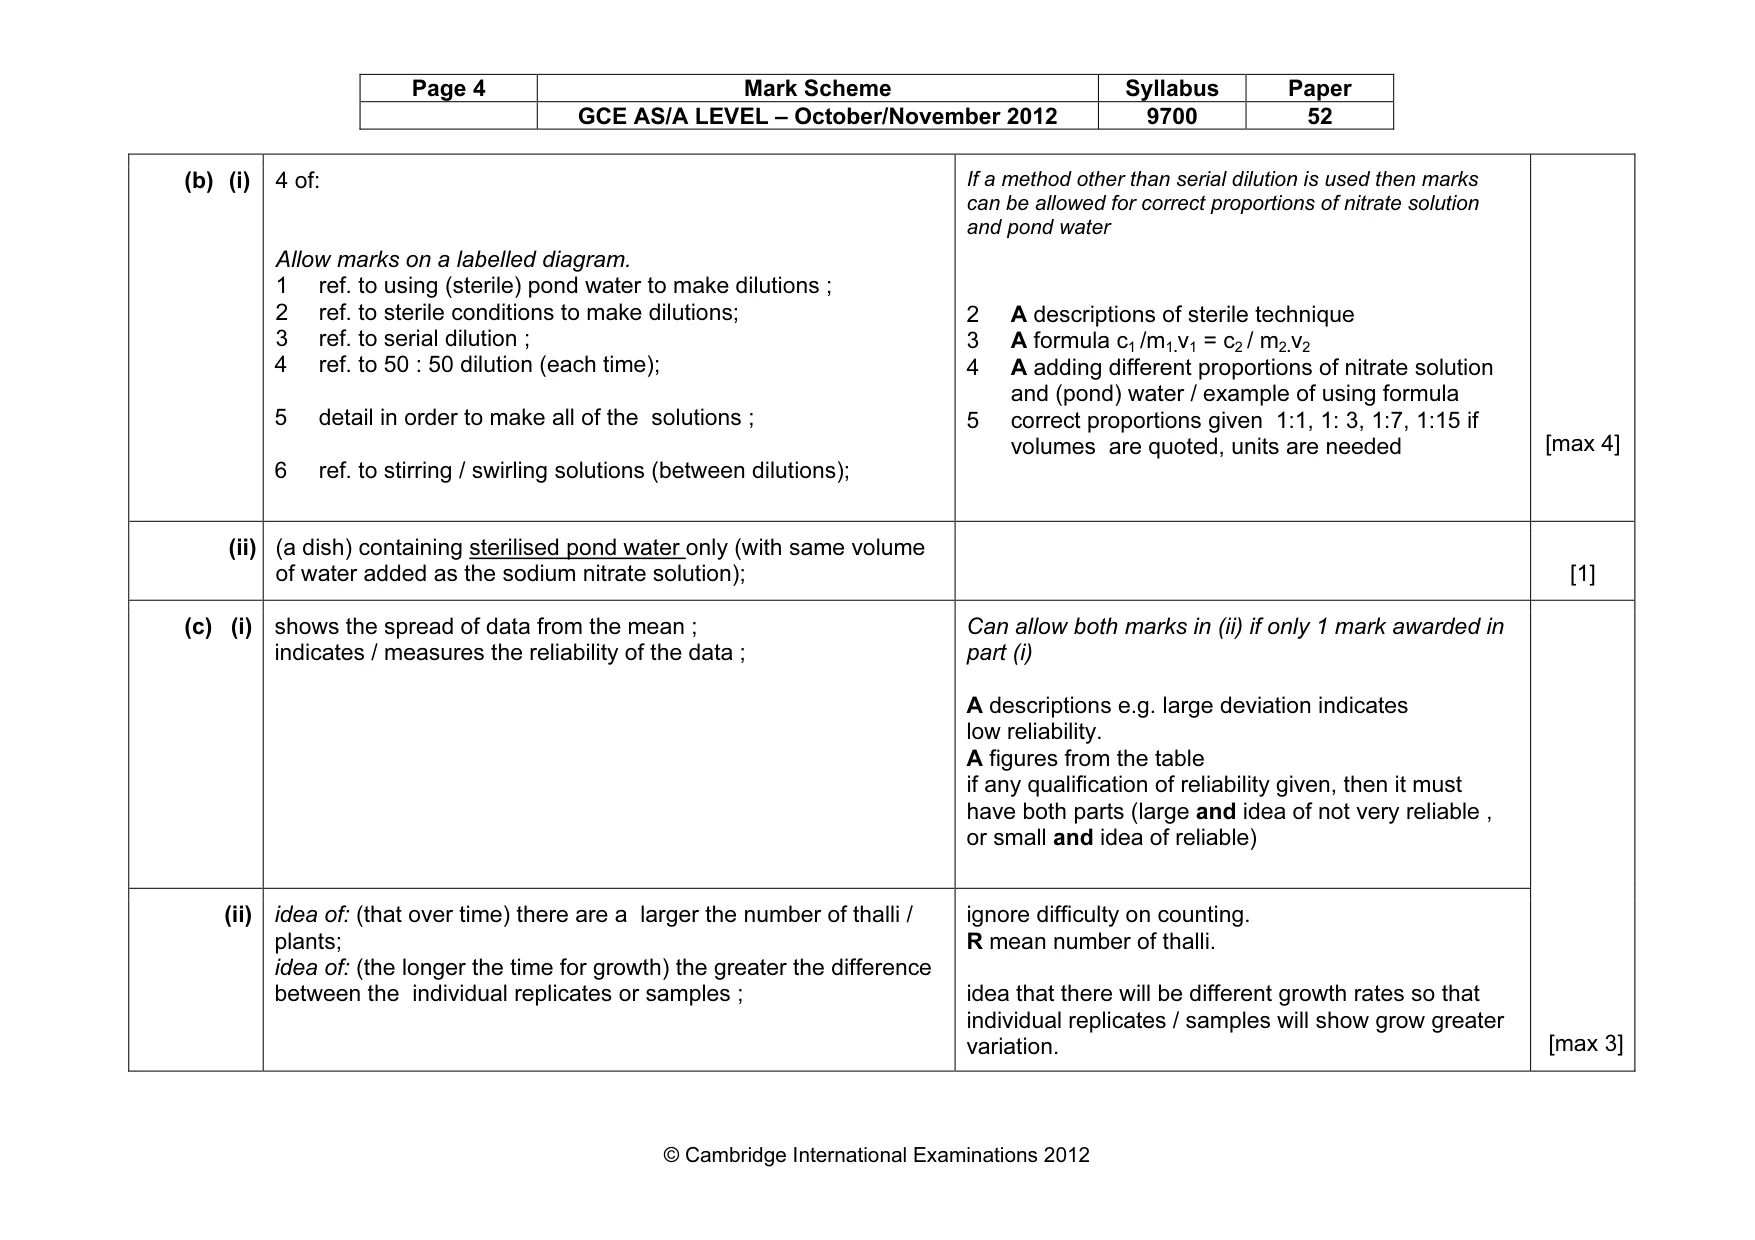
Page 3 Mark Scheme Syllabus Paper GCE AS/A LEVEL – October/November 2012 9700 52 © Cambridge International Examinations 2012 Question Expected answer Extra guidance Mark 1 (a) (i) independent : (sodium) nitrate concentration dependent : number of (leaf-like) thalli (of flowering plant); A allow leaves ignore growth unqualified [1] (ii) 2 of: (initial) number / three thalli / three plants ; time (of investigation) / ten days ; source of plants ; temperature ; activity / interference by microorganisms (in the water) ; If more than two given, mark the first 2. A allow thalli without any buds e.g. from the same pond / same environment allow room temperature ignore sterile [max 1] (iii) 2 x 2 of: 1 same volume of the sodium nitrate solution in each dish; ref. to a suitable method of measuring ; 2 light (intensity / wave length / duration) ; ref. to a method of giving standard intensity / wave length / time of illumination per day ; 3 aeration / oxygen concentration (of water) ; ref. to a method of supplying (sterile) air / oxygen ; 4 nitrate concentration ; add fresh nitrate solution daily / regularly ; 5 pH ; ref. to using a buffer ; 6 carbon dioxide (concentration) ; method of supplying carbon dioxide ; 7 size / diameter / surface area of starting thalli ; ref. to suitable method of measuring Read the whole. Identifying a variable is free standing, method linked to the variable. Ignore plant species, bleach. 1 e.g. measuring cylinder, (graduated) pipette, burette, accept graduated beaker / graduated conical flask 2 e.g. lamp at fixed distance / same wattage bulb / filter of known wave length for duration, allow 12 hours / 48 hours of light OR exposure to daylight hours 3 e.g. pump / oxygen cylinder / bubbler / diffuser allow bubbling of air / oxygen 4 A stated time interval up to 48 hours / 2 days 5 R phosphate buffer 6 e.g. (sodium) hydrogen carbonate / sodium bicarbonate / CO2 gas from a cylinder 7 e.g. ruler / grid /callipers ; ignore mass [max 4]
Mark scheme, page 4
Page 4 Mark Scheme Syllabus Paper GCE AS/A LEVEL – October/November 2012 9700 52 © Cambridge International Examinations 2012 (b) (i) 4 of: Allow marks on a labelled diagram. 1 ref. to using (sterile) pond water to make dilutions ; 2 ref. to sterile conditions to make dilutions; 3 ref. to serial dilution ; 4 ref. to 50 : 50 dilution (each time); 5 detail in order to make all of the solutions ; 6 ref. to stirring / swirling solutions (between dilutions); If a method other than serial dilution is used then marks can be allowed for correct proportions of nitrate solution and pond water 2 A descriptions of sterile technique 3 A formula c1 /m1.v1 = c2 / m2.v2 4 A adding different proportions of nitrate solution and (pond) water / example of using formula 5 correct proportions given 1:1, 1: 3, 1:7, 1:15 if volumes are quoted, units are needed [max 4] (ii) (a dish) containing sterilised pond water only (with same volume of water added as the sodium nitrate solution); [1] (c) (i) shows the spread of data from the mean ; indicates / measures the reliability of the data ; Can allow both marks in (ii) if only 1 mark awarded in part (i) A descriptions e.g. large deviation indicates low reliability. A figures from the table if any qualification of reliability given, then it must have both parts (large and idea of not very reliable , or small and idea of reliable) (ii) idea of: (that over time) there are a larger the number of thalli / plants; idea of: (the longer the time for growth) the greater the difference between the individual replicates or samples ; ignore difficulty on counting. R mean number of thalli. idea that there will be different growth rates so that individual replicates / samples will show grow greater variation. [max 3]
Mark scheme, page 5
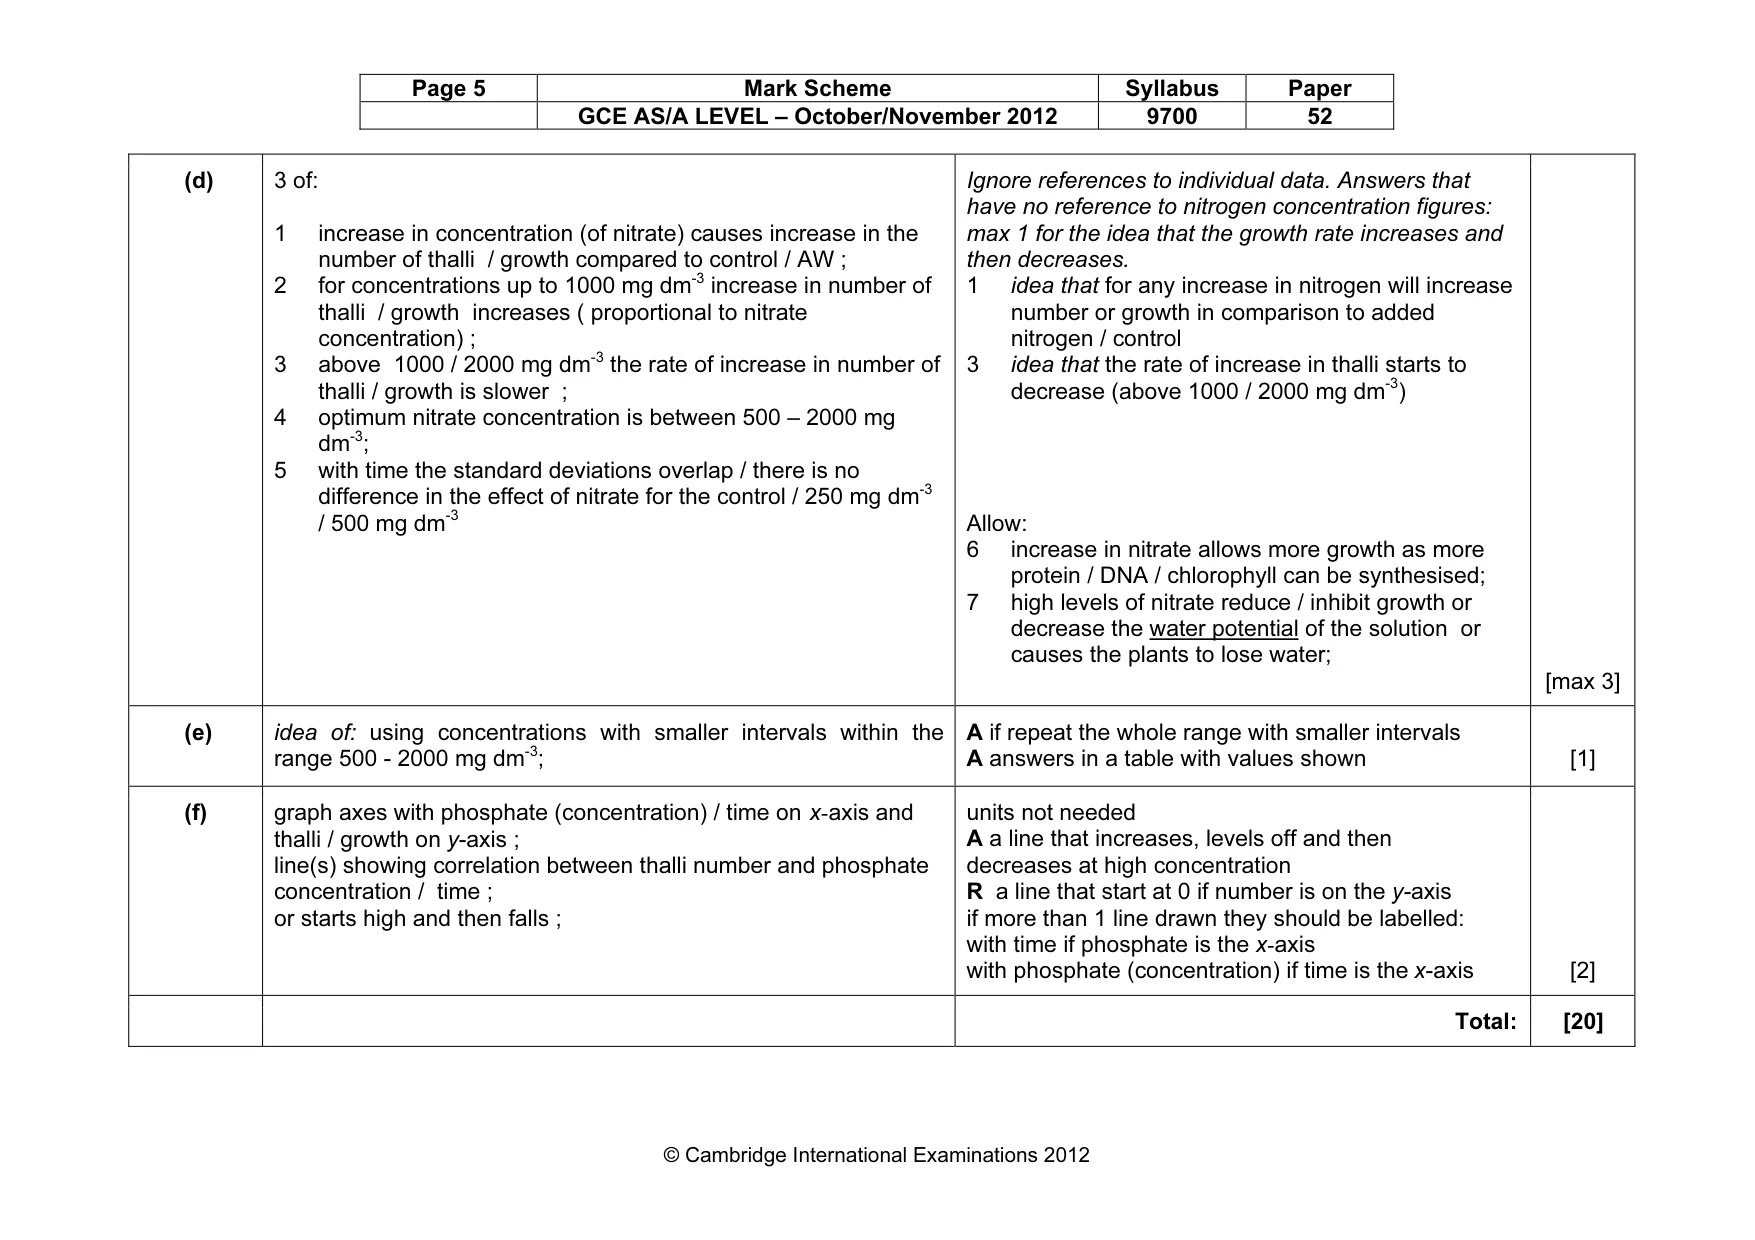
Page 5 Mark Scheme Syllabus Paper GCE AS/A LEVEL – October/November 2012 9700 52 © Cambridge International Examinations 2012 (d) 3 of: 1 increase in concentration (of nitrate) causes increase in the number of thalli / growth compared to control / AW ; 2 for concentrations up to 1000 mg dm-3 increase in number of thalli / growth increases ( proportional to nitrate concentration) ; 3 above 1000 / 2000 mg dm-3 the rate of increase in number of thalli / growth is slower ; 4 optimum nitrate concentration is between 500 – 2000 mg dm-3; 5 with time the standard deviations overlap / there is no difference in the effect of nitrate for the control / 250 mg dm-3 / 500 mg dm-3 Ignore references to individual data. Answers that have no reference to nitrogen concentration figures: max 1 for the idea that the growth rate increases and then decreases. 1 idea that for any increase in nitrogen will increase number or growth in comparison to added nitrogen / control 3 idea that the rate of increase in thalli starts to decrease (above 1000 / 2000 mg dm-3) Allow: 6 increase in nitrate allows more growth as more protein / DNA / chlorophyll can be synthesised; 7 high levels of nitrate reduce / inhibit growth or decrease the water potential of the solution or causes the plants to lose water; [max 3] (e) idea of: using concentrations with smaller intervals within the range 500 - 2000 mg dm-3; A if repeat the whole range with smaller intervals A answers in a table with values shown [1] (f) graph axes with phosphate (concentration) / time on x-axis and thalli / growth on y-axis ; line(s) showing correlation between thalli number and phosphate concentration / time ; or starts high and then falls ; units not needed A a line that increases, levels off and then decreases at high concentration R a line that start at 0 if number is on the y-axis if more than 1 line drawn they should be labelled: with time if phosphate is the x-axis with phosphate (concentration) if time is the x-axis [2] Total: [20]
Mark scheme, page 6
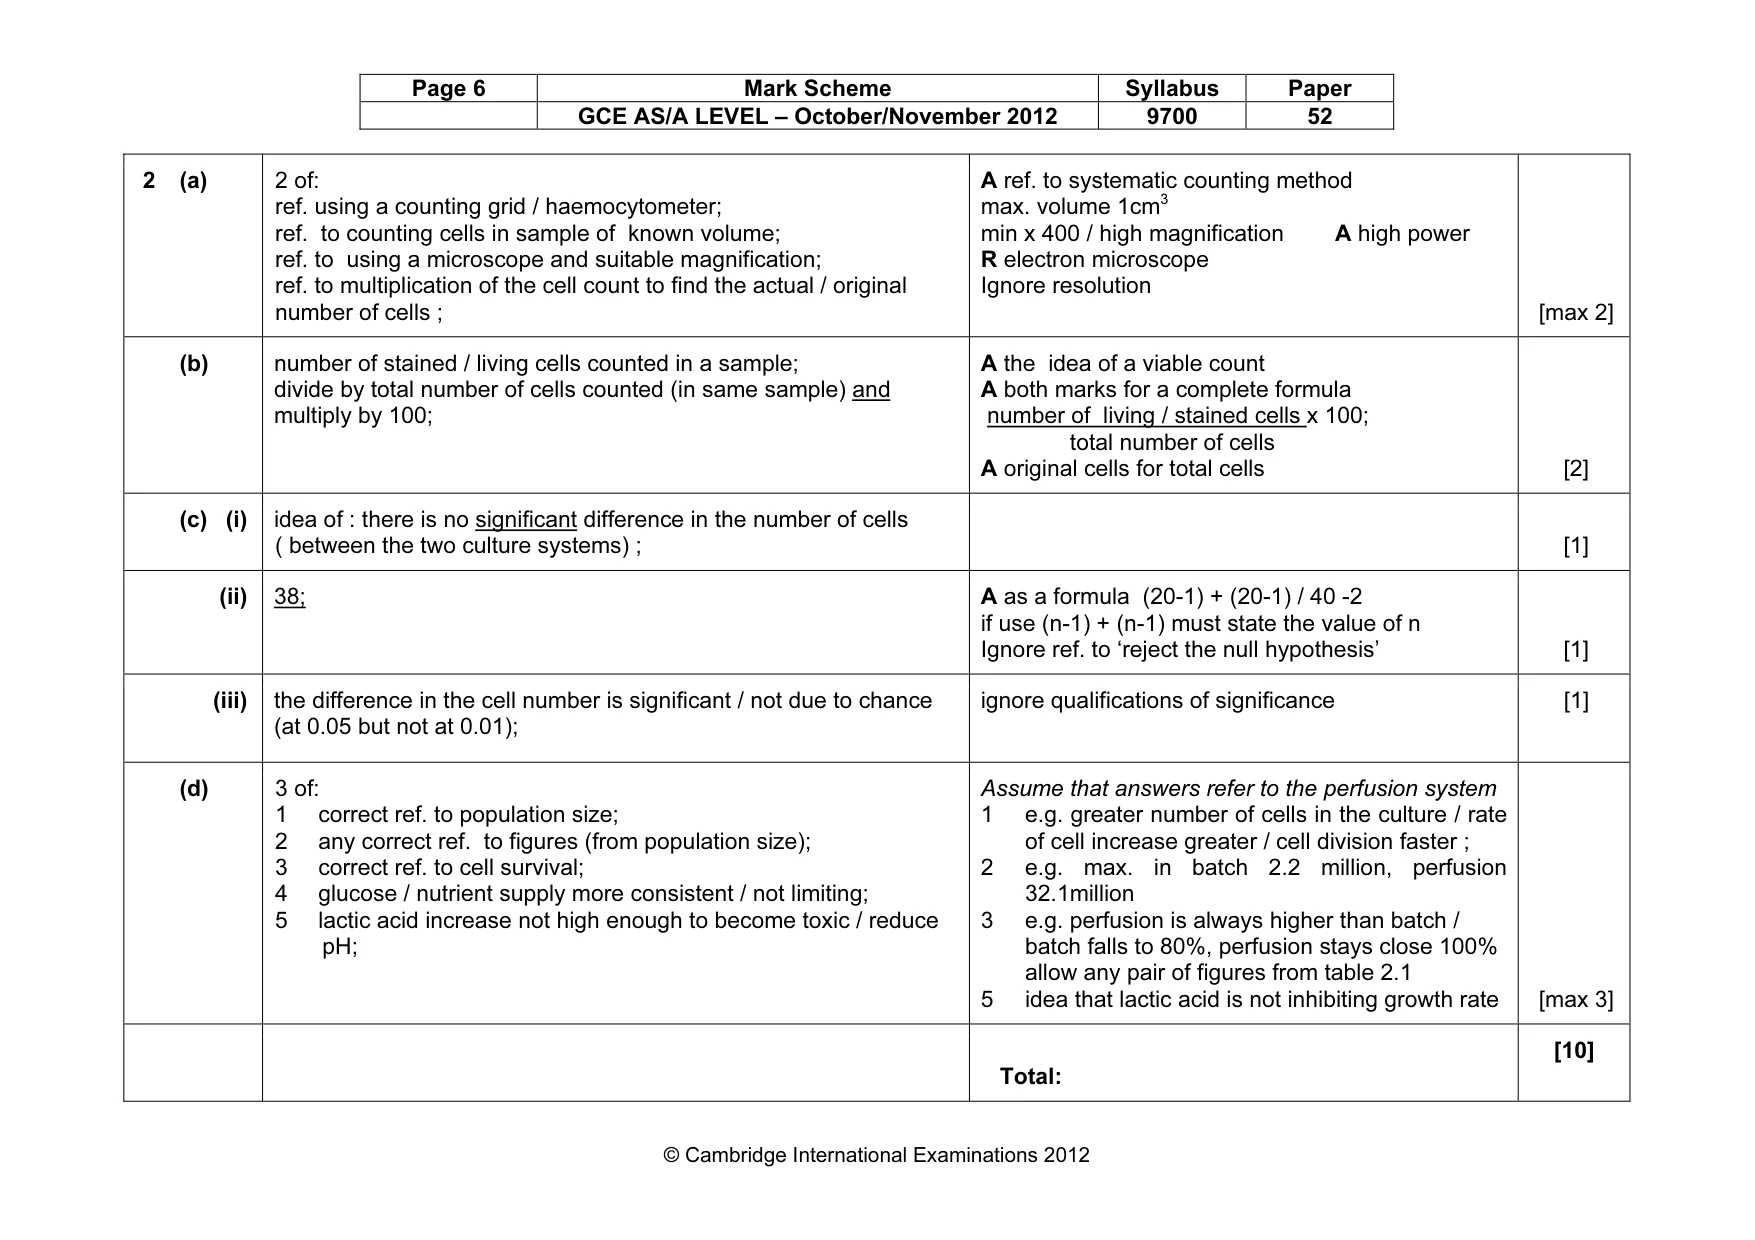
Page 6 Mark Scheme Syllabus Paper GCE AS/A LEVEL – October/November 2012 9700 52 © Cambridge International Examinations 2012 2 (a) 2 of: ref. using a counting grid / haemocytometer; ref. to counting cells in sample of known volume; ref. to using a microscope and suitable magnification; ref. to multiplication of the cell count to find the actual / original number of cells ; A ref. to systematic counting method max. volume 1cm3 min x 400 / high magnification A high power R electron microscope Ignore resolution [max 2] (b) number of stained / living cells counted in a sample; divide by total number of cells counted (in same sample) and multiply by 100; A the idea of a viable count A both marks for a complete formula number of living / stained cells x 100; total number of cells A original cells for total cells [2] (c) (i) idea of : there is no significant difference in the number of cells ( between the two culture systems) ; [1] (ii) 38; A as a formula (20-1) + (20-1) / 40 -2 if use (n-1) + (n-1) must state the value of n Ignore ref. to ‘reject the null hypothesis’ [1] (iii) the difference in the cell number is significant / not due to chance (at 0.05 but not at 0.01); ignore qualifications of significance [1] (d) 3 of: 1 correct ref. to population size; 2 any correct ref. to figures (from population size); 3 correct ref. to cell survival; 4 glucose / nutrient supply more consistent / not limiting; 5 lactic acid increase not high enough to become toxic / reduce pH; Assume that answers refer to the perfusion system 1 e.g. greater number of cells in the culture / rate of cell increase greater / cell division faster ; 2 e.g. max. in batch 2.2 million, perfusion 32.1million 3 e.g. perfusion is always higher than batch / batch falls to 80%, perfusion stays close 100% allow any pair of figures from table 2.1 5 idea that lactic acid is not inhibiting growth rate [max 3] Total: [10]
What you needed in this session
Cambridge’s own grade thresholds for 2012 Oct/Nov, Paper 5 · Variant 2. A higher threshold means an easier paper — the bar moves with how the cohort did.