Cambridge A Level Biology 9700 — 2012 Oct/Nov Paper 5 · Variant 3
9700/53/O/N/12 · 30 marks · ≈34 min
The question paper and its mark scheme, free to read here and free to download. This is Cambridge’s own paper, exactly as it was sat.
Question paper8 pages
Mark scheme8 pages
Answers below. Sit the paper first if you are practising.

Paper as text
Question paper, page 1
This document consists of 8 printed pages. DC (CW/JG) 46680/4 © UCLES 2012 [Turn over UNIVERSITY OF CAMBRIDGE INTERNATIONAL EXAMINATIONS General Certificate of Education Advanced Level * 0 1 2 0 0 1 3 7 5 3 * BIOLOGY 9700/53 Paper 5 Planning, Analysis and Evaluation October/November 2012 1 hour 15 minutes Candidates answer on the Question Paper. No Additional Materials are required. READ THESE INSTRUCTIONS FIRST Write your Centre number, candidate number and name on all the work you hand in. Write in dark blue or black ink. You may use a pencil for any diagrams, graphs or rough working. Do not use staples, paper clips, highlighters, glue or correction fluid. Answer both questions. At the end of the examination, fasten all your work securely together. The number of marks is given in brackets [ ] at the end of each question or part question. For Examiner’s Use 1 2 Total
Question paper, page 2
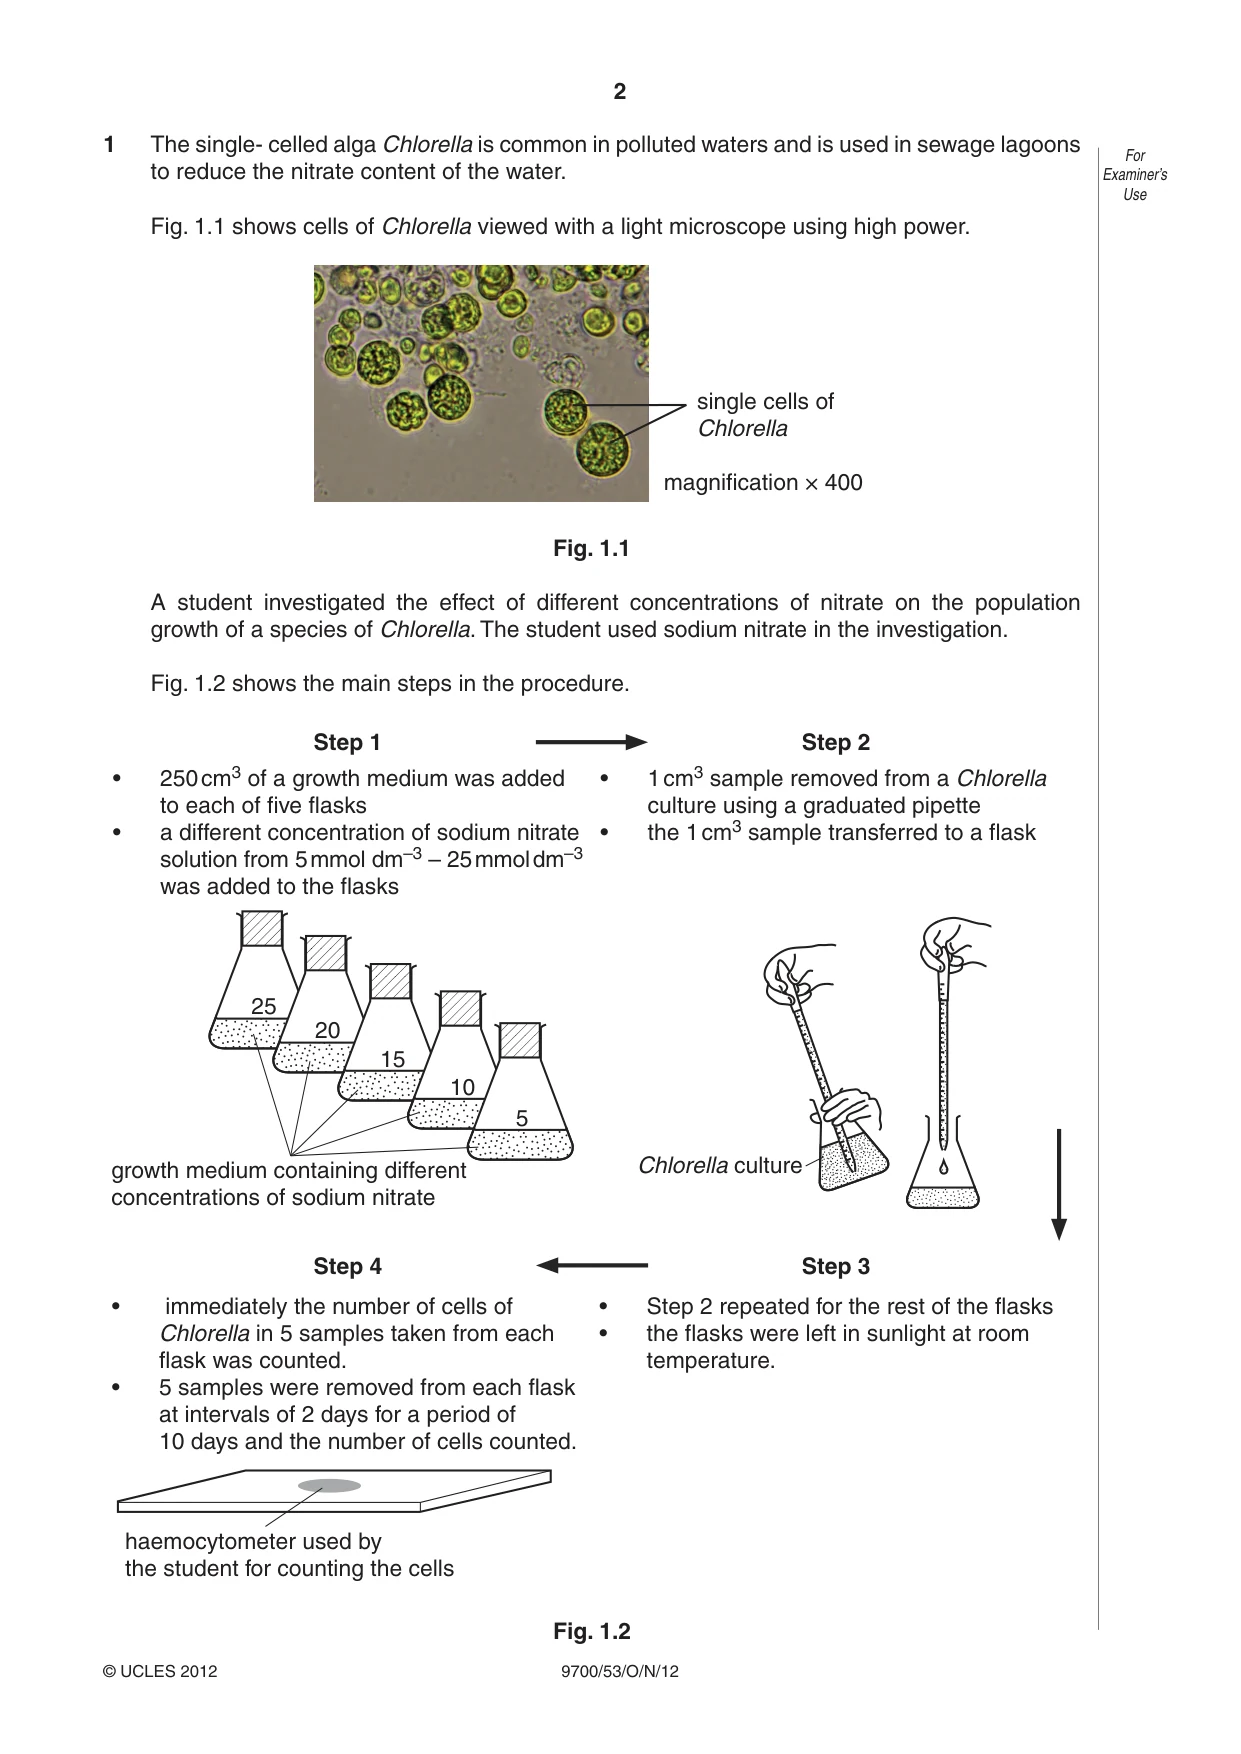
2 9700/53/O/N/12 © UCLES 2012 For Examiner’s Use 1 The single- celled alga Chlorella is common in polluted waters and is used in sewage lagoons to reduce the nitrate content of the water. Fig. 1.1 shows cells of Chlorella viewed with a light microscope using high power. single cells of Chlorella magnification × 400 Fig. 1.1 A student investigated the effect of different concentrations of nitrate on the population growth of a species of Chlorella. The student used sodium nitrate in the investigation. Fig. 1.2 shows the main steps in the procedure. Step 1 Step 2 • 250 cm3 of a growth medium was added to each of five flasks • a different concentration of sodium nitrate solution from 5 mmol dm–3 – 25 mmol dm –3 was added to the flasks • 1 cm3 sample removed from a Chlorella culture using a graduated pipette • the 1 cm3 sample transferred to a flask 25 20 15 10 5 growth medium containing different concentrations of sodium nitrate Chlorella culture Step 4 Step 3 • immediately the number of cells of Chlorella in 5 samples taken from each flask was counted. • 5 samples were removed from each flask at intervals of 2 days for a period of 10 days and the number of cells counted. haemocytometer used by the student for counting the cells • Step 2 repeated for the rest of the flasks • the flasks were left in sunlight at room temperature. Fig. 1.2
Question paper, page 3
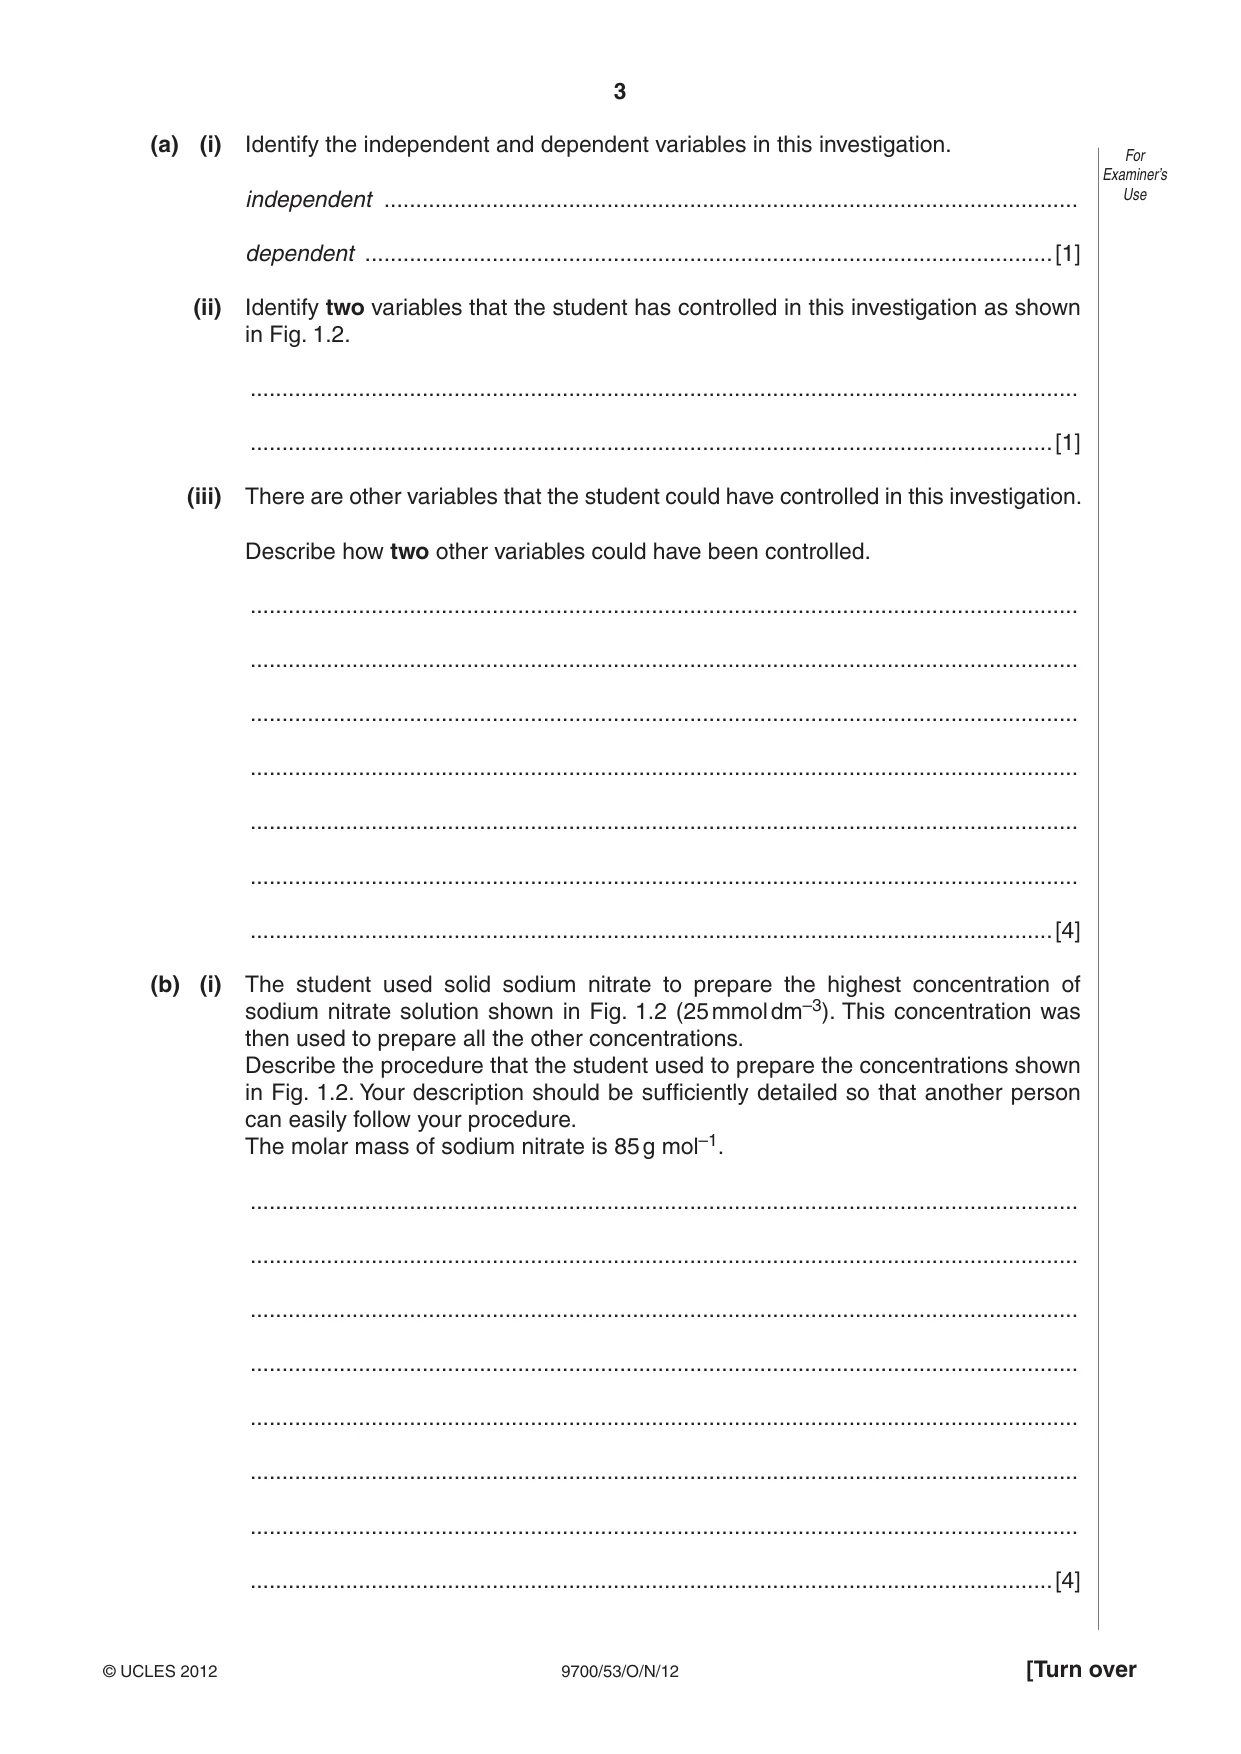
3 9700/53/O/N/12 © UCLES 2012 [Turn over For Examiner’s Use (a) (i) Identify the independent and dependent variables in this investigation. independent … dependent …[1] (ii) Identify two variables that the student has controlled in this investigation as shown in Fig. 1.2. … …[1] (iii) There are other variables that the student could have controlled in this investigation. Describe how two other variables could have been controlled. … … … … … … …[4] (b) (i) The student used solid sodium nitrate to prepare the highest concentration of sodium nitrate solution shown in Fig. 1.2 (25 mmol dm–3). This concentration was then used to prepare all the other concentrations. Describe the procedure that the student used to prepare the concentrations shown in Fig. 1.2. Your description should be sufficiently detailed so that another person can easily follow your procedure. The molar mass of sodium nitrate is 85 g mol–1. … … … … … … … …[4]
Question paper, page 4
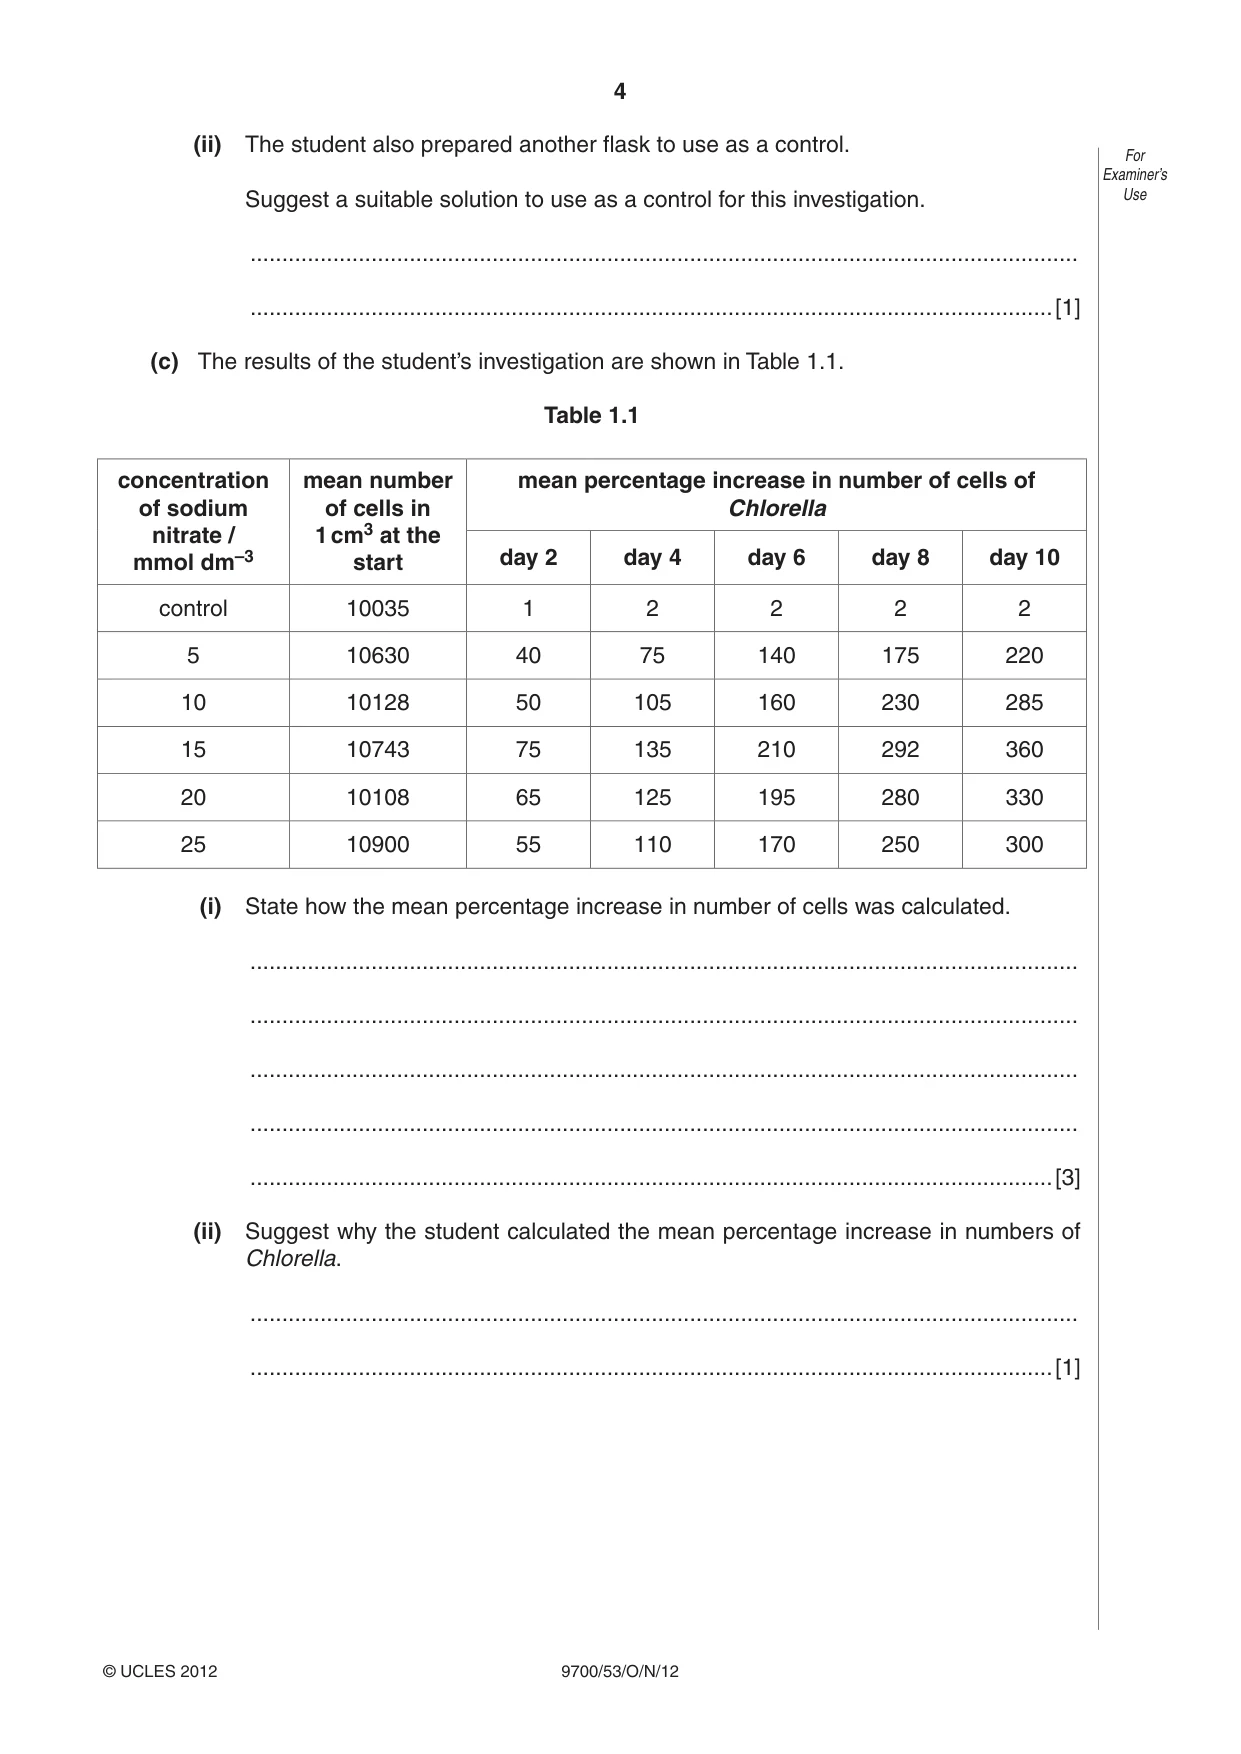
4 9700/53/O/N/12 © UCLES 2012 For Examiner’s Use (ii) The student also prepared another flask to use as a control. Suggest a suitable solution to use as a control for this investigation. … …[1] (c) The results of the student’s investigation are shown in Table 1.1. Table 1.1 concentration of sodium nitrate / mmol dm–3 mean number of cells in 1 cm3 at the start mean percentage increase in number of cells of Chlorella day 2 day 4 day 6 day 8 day 10 control 10035 1 2 2 2 2 5 10630 40 75 140 175 220 10 10128 50 105 160 230 285 15 10743 75 135 210 292 360 20 10108 65 125 195 280 330 25 10900 55 110 170 250 300 (i) State how the mean percentage increase in number of cells was calculated. … … … … …[3] (ii) Suggest why the student calculated the mean percentage increase in numbers of Chlorella. … …[1]
Question paper, page 5
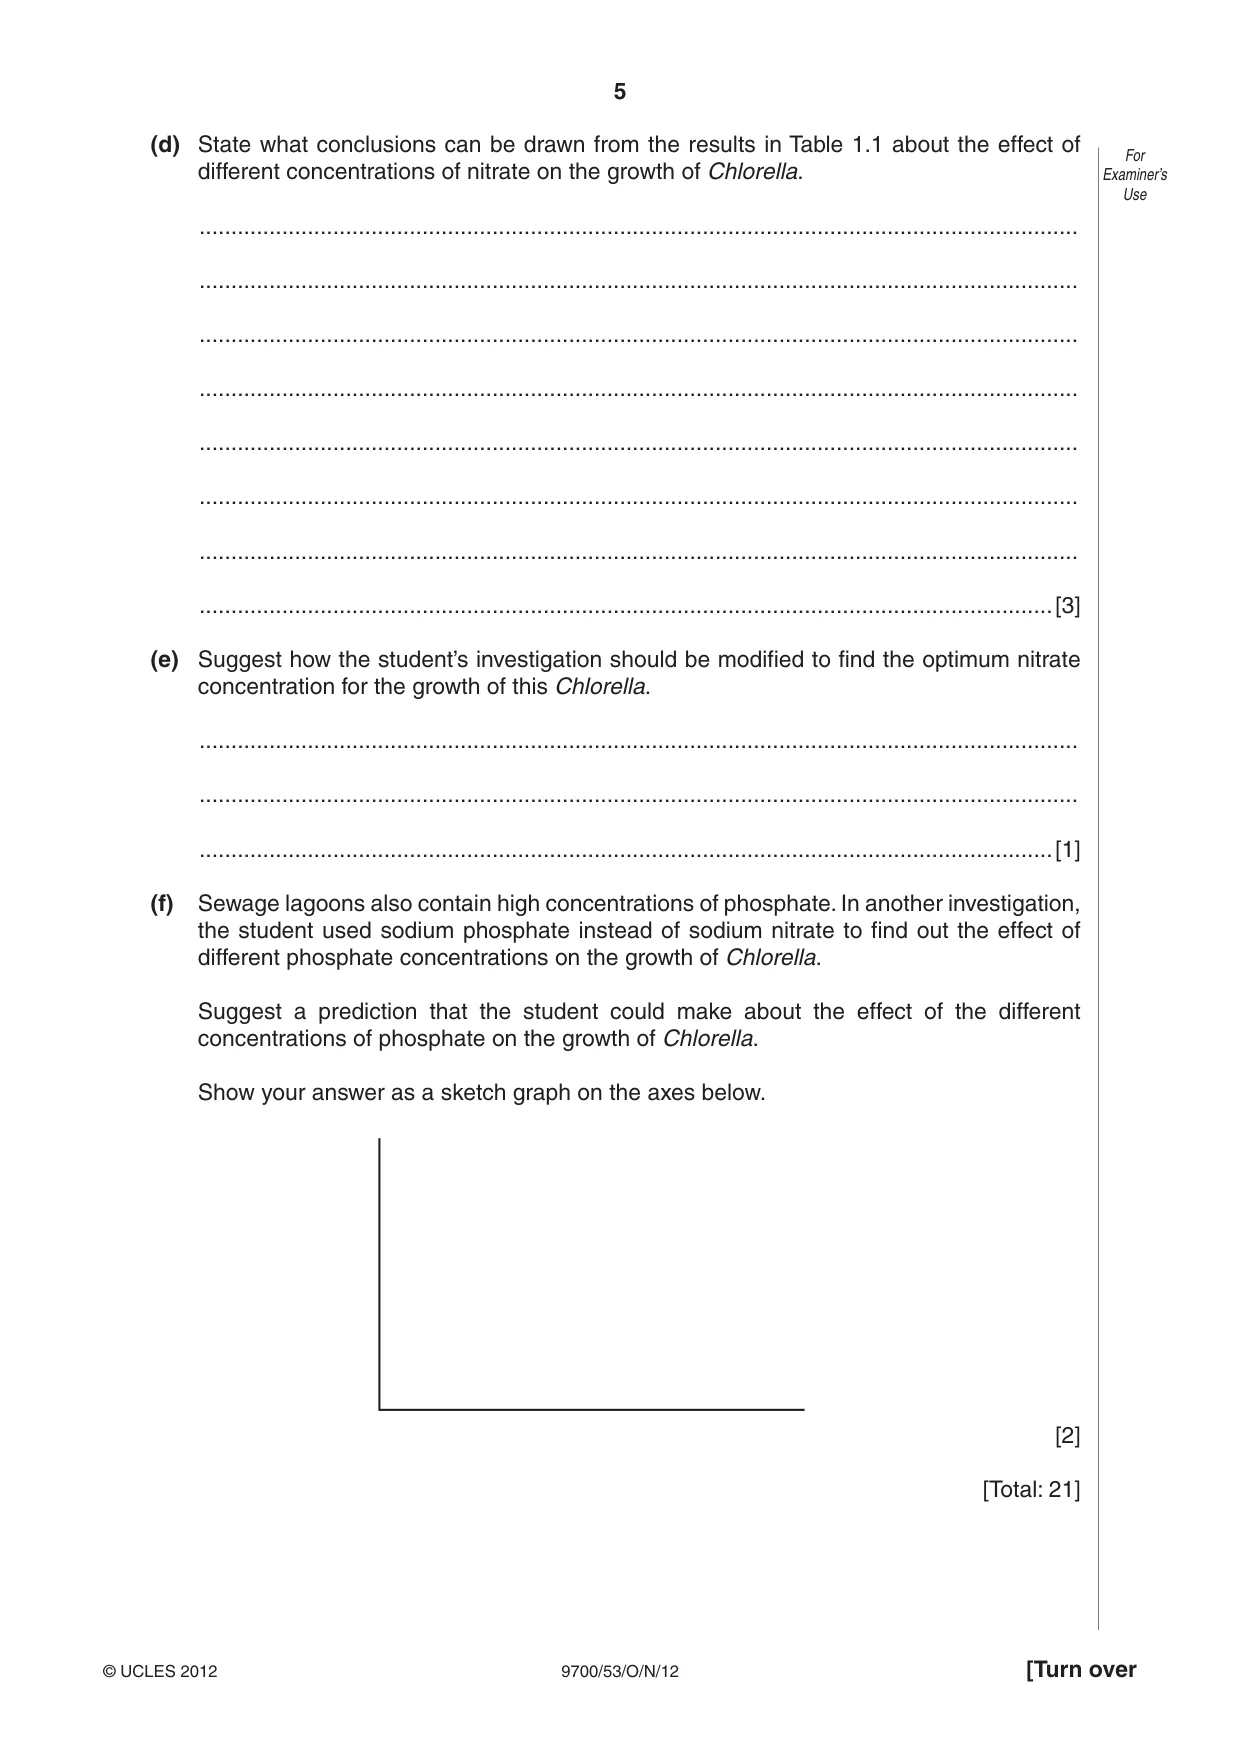
5 9700/53/O/N/12 © UCLES 2012 [Turn over For Examiner’s Use (d) State what conclusions can be drawn from the results in Table 1.1 about the effect of different concentrations of nitrate on the growth of Chlorella. … … … … … … … …[3] (e) Suggest how the student’s investigation should be modified to find the optimum nitrate concentration for the growth of this Chlorella. … … …[1] (f) Sewage lagoons also contain high concentrations of phosphate. In another investigation, the student used sodium phosphate instead of sodium nitrate to find out the effect of different phosphate concentrations on the growth of Chlorella. Suggest a prediction that the student could make about the effect of the different concentrations of phosphate on the growth of Chlorella. Show your answer as a sketch graph on the axes below. [2] [Total: 21]
Question paper, page 6
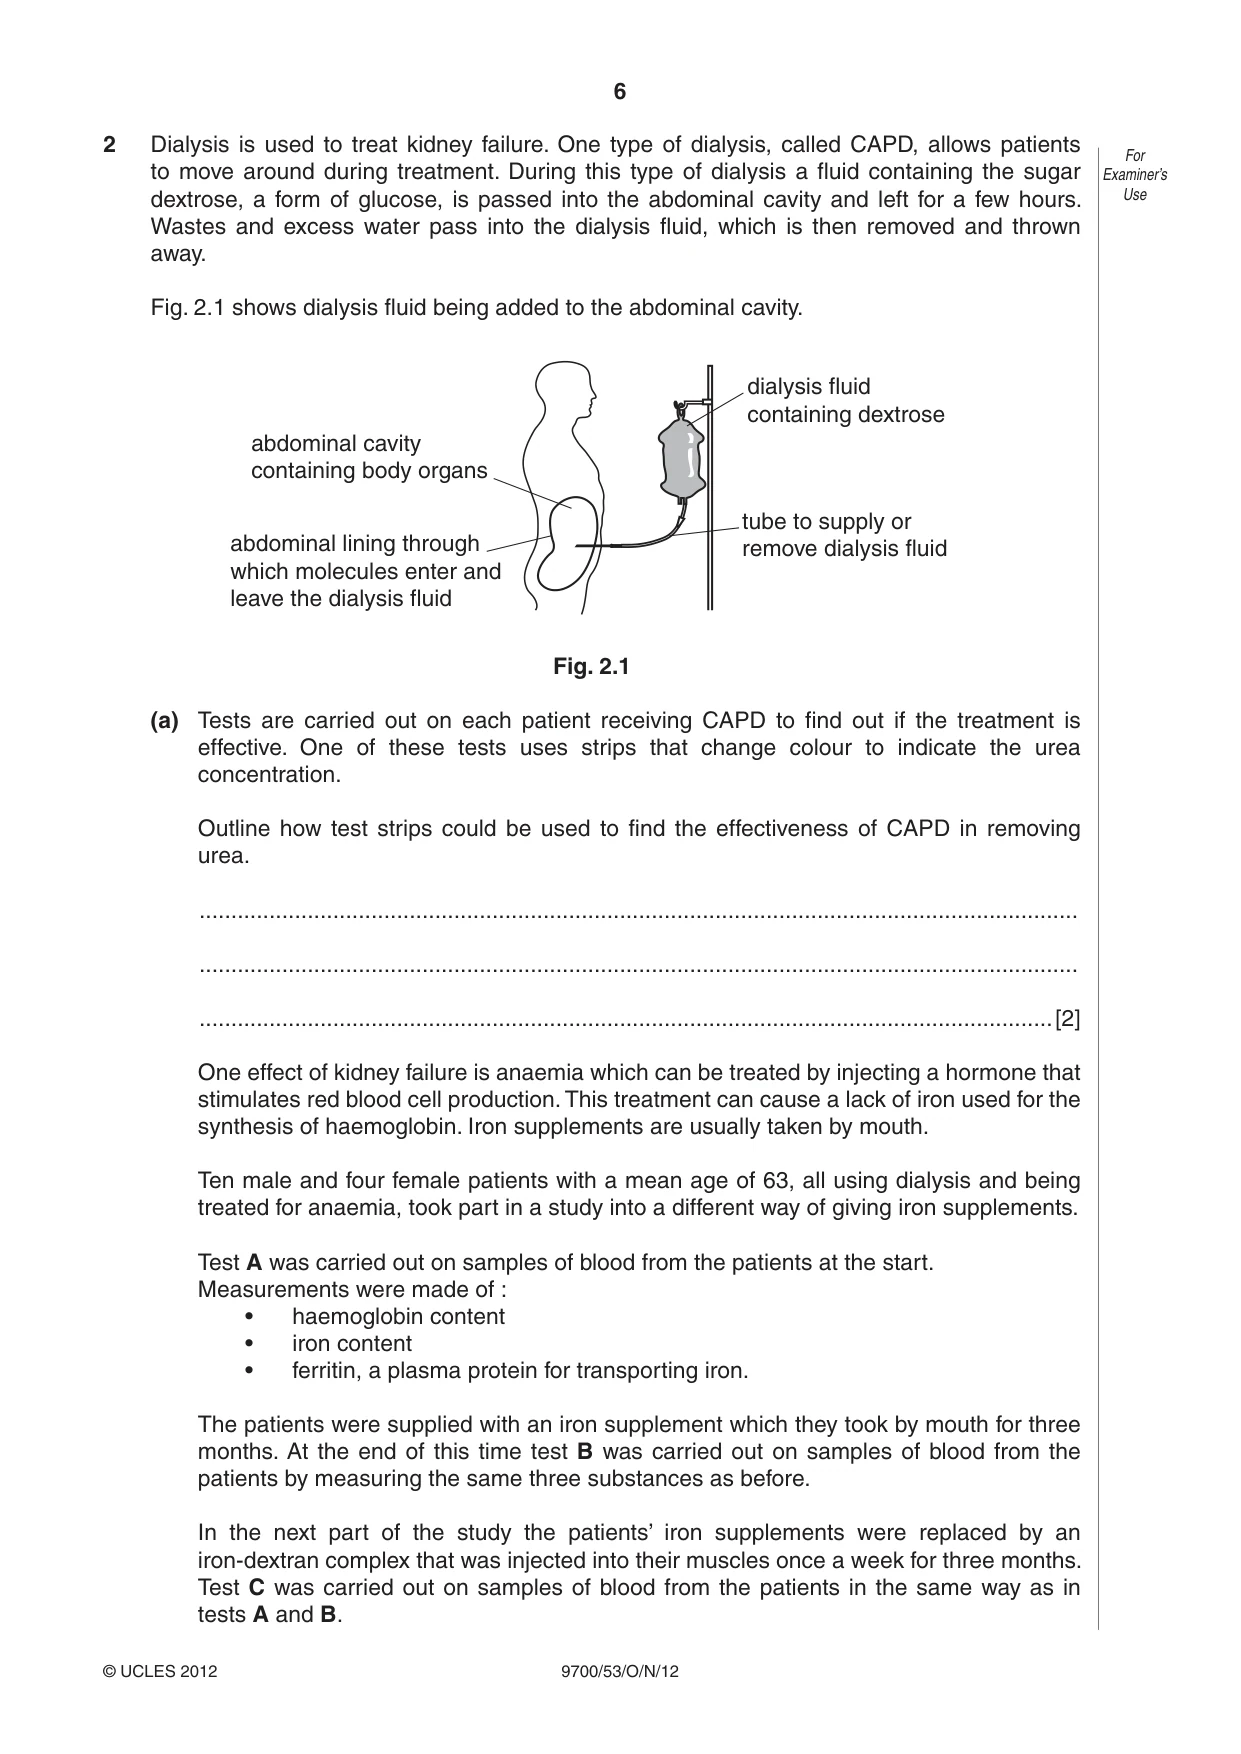
6 9700/53/O/N/12 © UCLES 2012 For Examiner’s Use 2 Dialysis is used to treat kidney failure. One type of dialysis, called CAPD, allows patients to move around during treatment. During this type of dialysis a fluid containing the sugar dextrose, a form of glucose, is passed into the abdominal cavity and left for a few hours. Wastes and excess water pass into the dialysis fluid, which is then removed and thrown away. Fig. 2.1 shows dialysis fluid being added to the abdominal cavity. dialysis fluid containing dextrose tube to supply or remove dialysis fluid abdominal lining through which molecules enter and leave the dialysis fluid abdominal cavity containing body organs Fig. 2.1 (a) Tests are carried out on each patient receiving CAPD to find out if the treatment is effective. One of these tests uses strips that change colour to indicate the urea concentration. Outline how test strips could be used to find the effectiveness of CAPD in removing urea. … … …[2] One effect of kidney failure is anaemia which can be treated by injecting a hormone that stimulates red blood cell production. This treatment can cause a lack of iron used for the synthesis of haemoglobin. Iron supplements are usually taken by mouth. Ten male and four female patients with a mean age of 63, all using dialysis and being treated for anaemia, took part in a study into a different way of giving iron supplements. Test A was carried out on samples of blood from the patients at the start. Measurements were made of : • haemoglobin content • iron content • ferritin, a plasma protein for transporting iron. The patients were supplied with an iron supplement which they took by mouth for three months. At the end of this time test B was carried out on samples of blood from the patients by measuring the same three substances as before. In the next part of the study the patients’ iron supplements were replaced by an iron-dextran complex that was injected into their muscles once a week for three months. Test C was carried out on samples of blood from the patients in the same way as in tests A and B.
Question paper, page 7
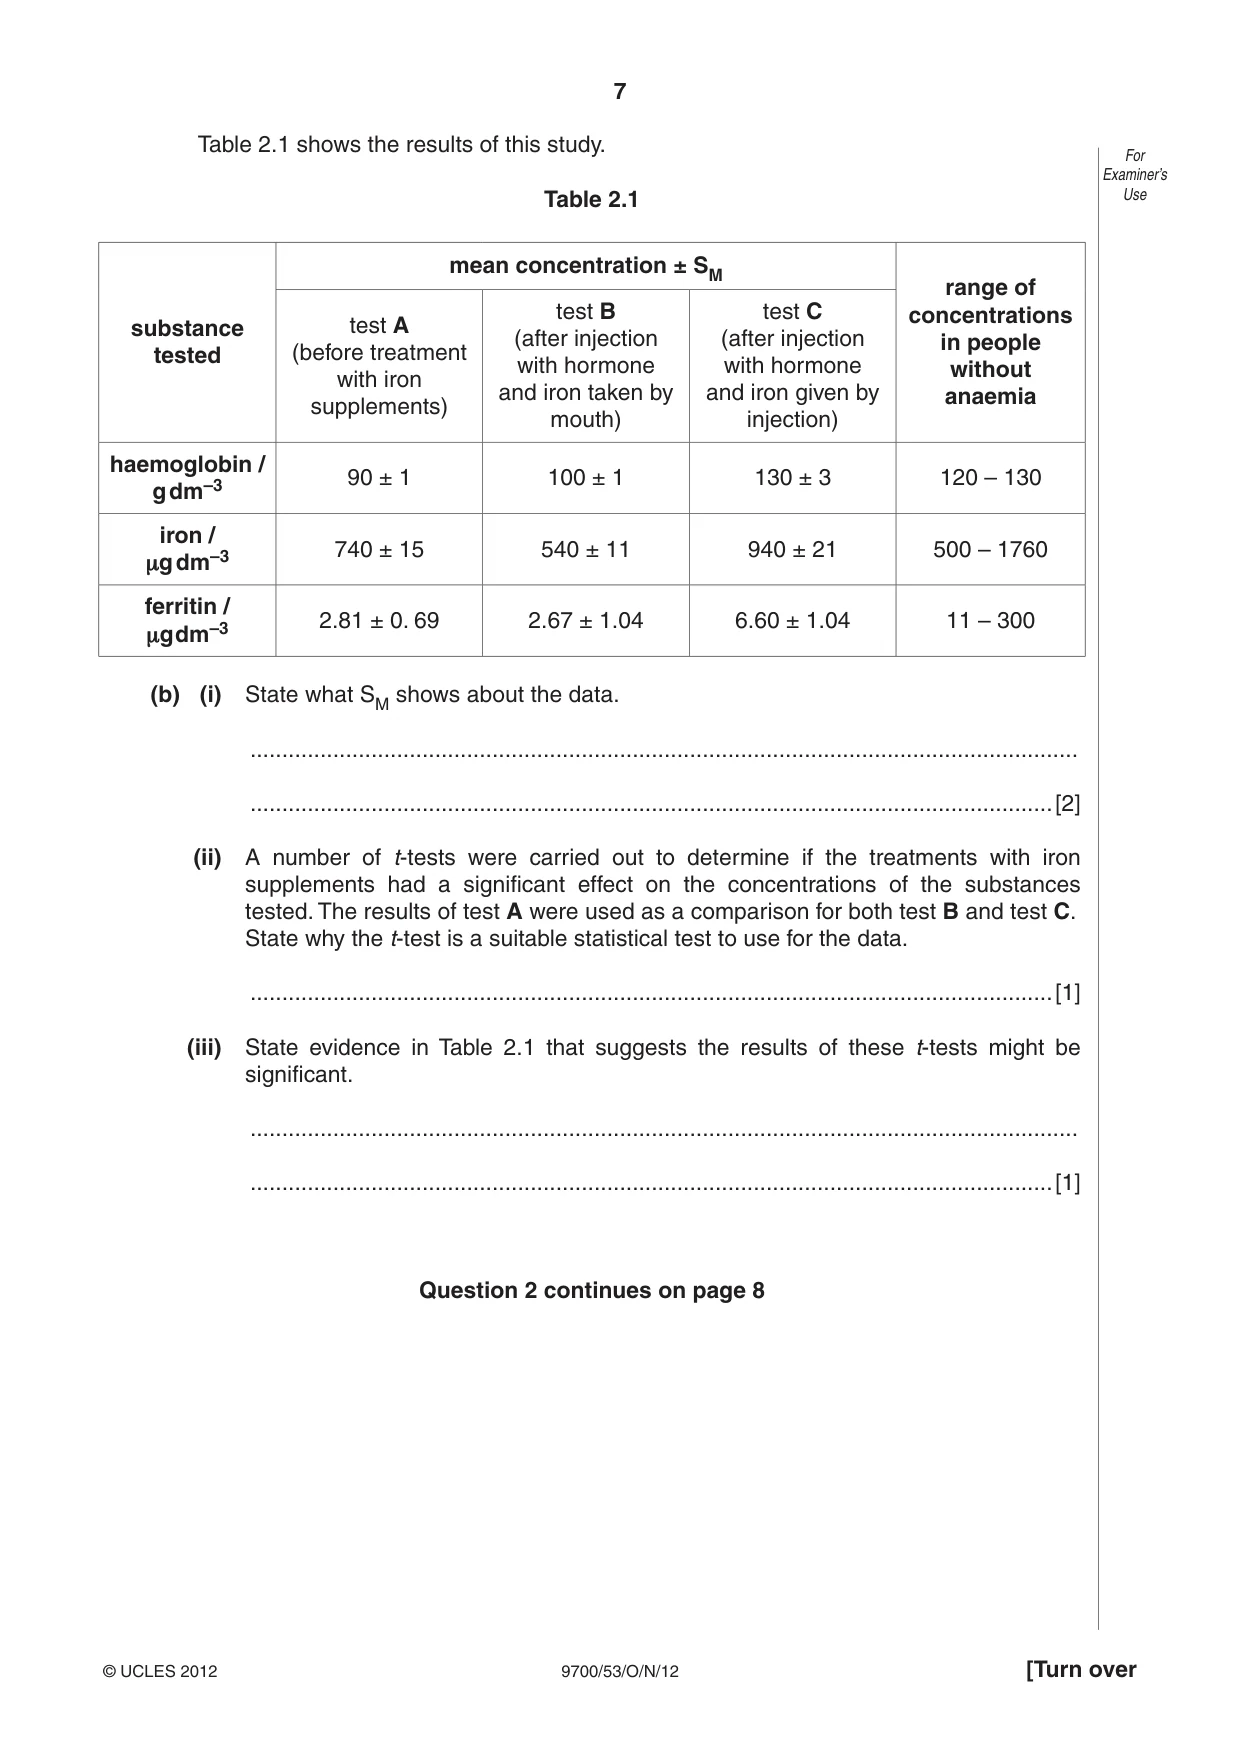
7 9700/53/O/N/12 © UCLES 2012 [Turn over For Examiner’s Use Table 2.1 shows the results of this study. Table 2.1 substance tested mean concentration ± SM range of concentrations in people without anaemia test A (before treatment with iron supplements) test B (after injection with hormone and iron taken by mouth) test C (after injection with hormone and iron given by injection) haemoglobin / g dm–3 90 ± 1 100 ± 1 130 ± 3 120 – 130 iron / μg dm–3 740 ± 15 540 ± 11 940 ± 21 500 – 1760 ferritin / μg dm–3 2.81 ± 0. 69 2.67 ± 1.04 6.60 ± 1.04 11 – 300 (b) (i) State what SM shows about the data. … …[2] (ii) A number of t-tests were carried out to determine if the treatments with iron supplements had a significant effect on the concentrations of the substances tested. The results of test A were used as a comparison for both test B and test C. State why the t-test is a suitable statistical test to use for the data. …[1] (iii) State evidence in Table 2.1 that suggests the results of these t-tests might be significant. … …[1] Question 2 continues on page 8
Question paper, page 8
8 9700/53/O/N/12 © UCLES 2012 For Examiner’s Use (c) The researchers who carried out this study concluded that providing iron supplement by injection was more effective than providing iron by mouth. (i) State the evidence from Table 2.1 for this conclusion. … … … (ii) Suggest limitations of this study. … … …[3] [Total: 9] Permission to reproduce items where third-party owned material protected by copyright is included has been sought and cleared where possible. Every reasonable effort has been made by the publisher (UCLES) to trace copyright holders, but if any items requiring clearance have unwittingly been included, the publisher will be pleased to make amends at the earliest possible opportunity. University of Cambridge International Examinations is part of the Cambridge Assessment Group. Cambridge Assessment is the brand name of University of Cambridge Local Examinations Syndicate (UCLES), which is itself a department of the University of Cambridge.
Mark scheme, page 1
CAMBRIDGE INTERNATIONAL EXAMINATIONS GCE Advanced Subsidiary Level and GCE Advanced Level MARK SCHEME for the October/November 2012 series 9700 BIOLOGY 9700/53 Paper 5 (Planning, Analysis and Evaluation), maximum raw mark 30 This mark scheme is published as an aid to teachers and candidates, to indicate the requirements of the examination. It shows the basis on which Examiners were instructed to award marks. It does not indicate the details of the discussions that took place at an Examiners’ meeting before marking began, which would have considered the acceptability of alternative answers. Mark schemes should be read in conjunction with the question paper and the Principal Examiner Report for Teachers. Cambridge will not enter into discussions about these mark schemes. Cambridge is publishing the mark schemes for the October/November 2012 series for most IGCSE, GCE Advanced Level and Advanced Subsidiary Level components and some Ordinary Level components.
Mark scheme, page 2
Page 2 Mark Scheme Syllabus Paper GCE AS/A LEVEL – October/November 2012 9700 53 © Cambridge International Examinations 2012 Mark scheme abbreviations: ; separates marking points / alternatives answers for the same point R reject A accept (for answers correctly cued by the question, or guidance for examiners) AW alternative wording (where responses vary more than usual) underline actual word given must be used by candidate (grammatical variants excepted) max indicates the maximum number of marks that can be given efc error carried forward mp marking point (with relevant number) ora or reverse argument
Mark scheme, page 3
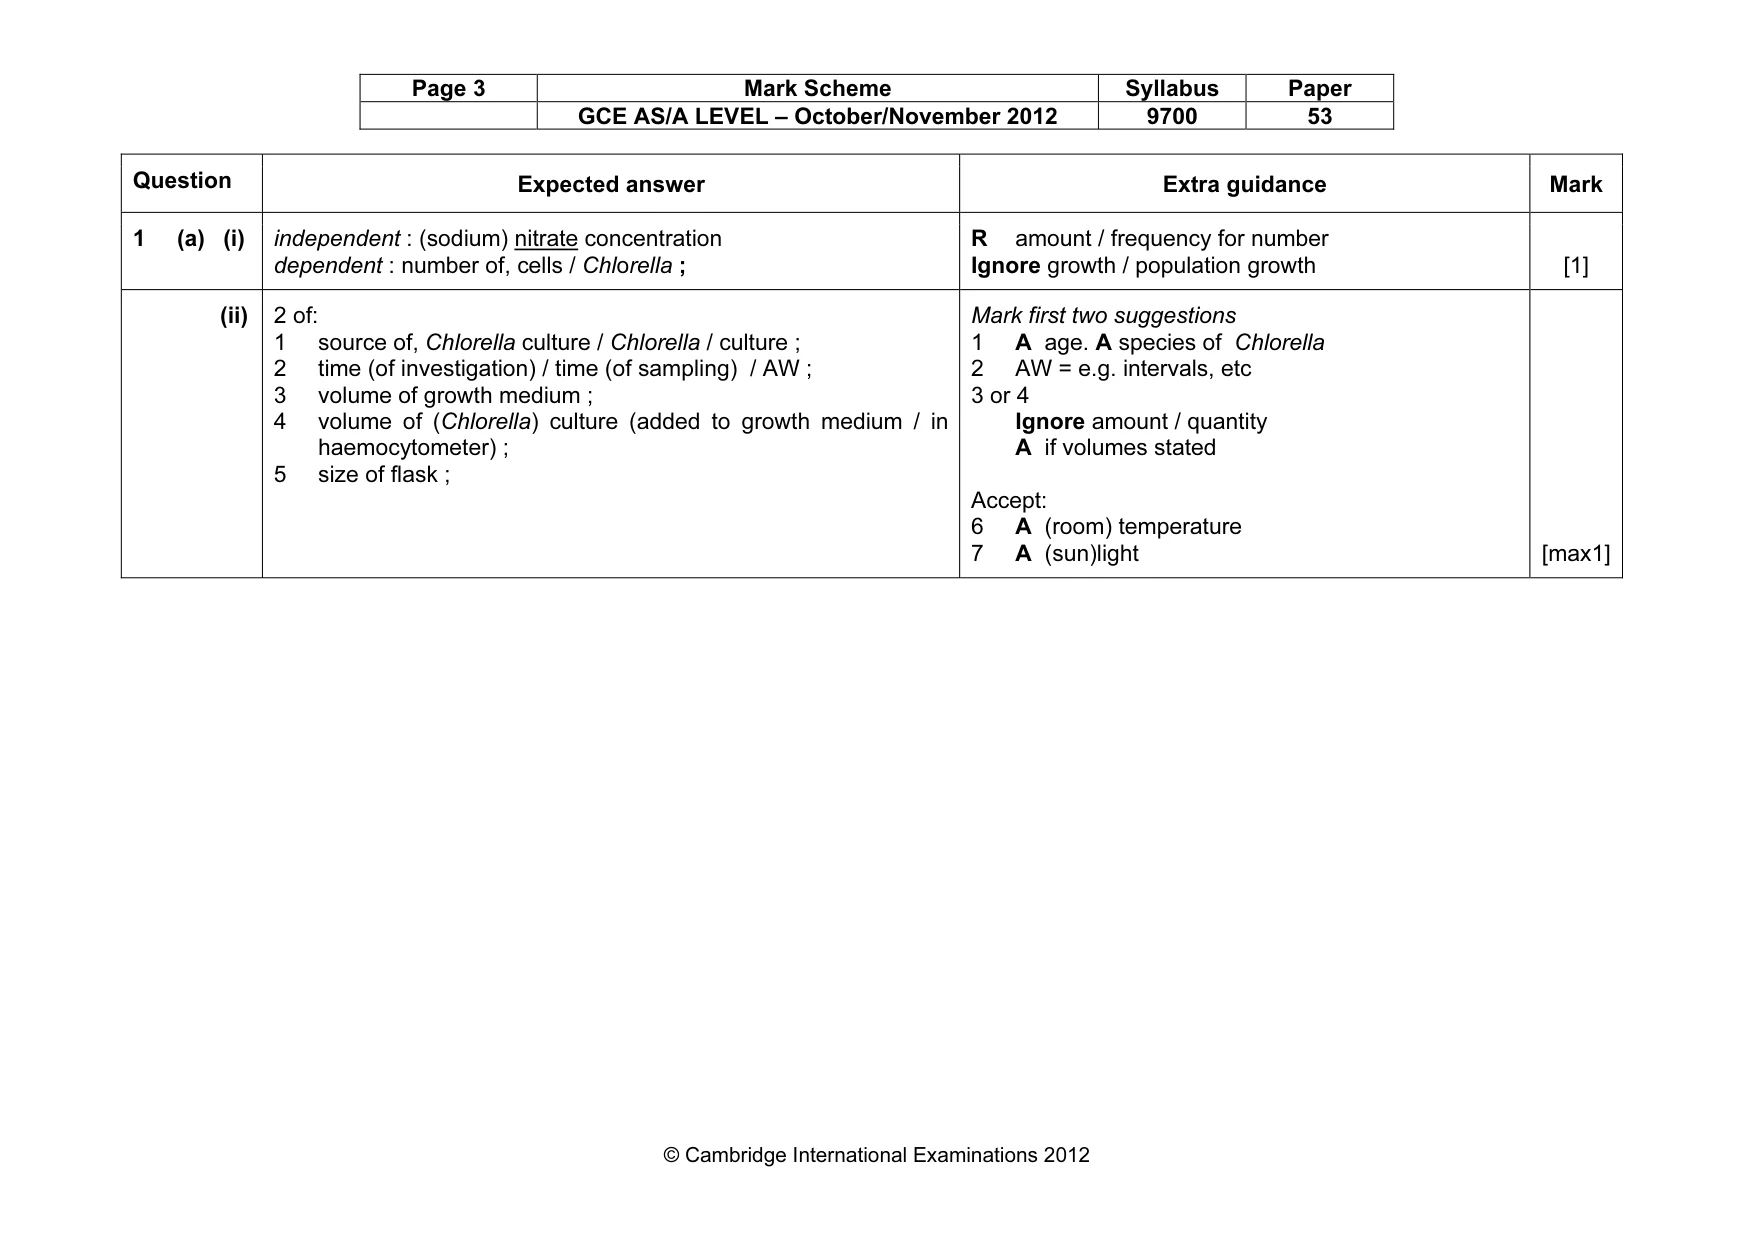
Page 3 Mark Scheme Syllabus Paper GCE AS/A LEVEL – October/November 2012 9700 53 © Cambridge International Examinations 2012 Question Expected answer Extra guidance Mark 1 (a) (i) independent : (sodium) nitrate concentration dependent : number of, cells / Chlorella ; R amount / frequency for number Ignore growth / population growth [1] (ii) 2 of: 1 source of, Chlorella culture / Chlorella / culture ; 2 time (of investigation) / time (of sampling) / AW ; 3 volume of growth medium ; 4 volume of (Chlorella) culture (added to growth medium / in haemocytometer) ; 5 size of flask ; Mark first two suggestions 1 A age. A species of Chlorella 2 AW = e.g. intervals, etc 3 or 4 Ignore amount / quantity A if volumes stated Accept: 6 A (room) temperature 7 A (sun)light [max1]
Mark scheme, page 4
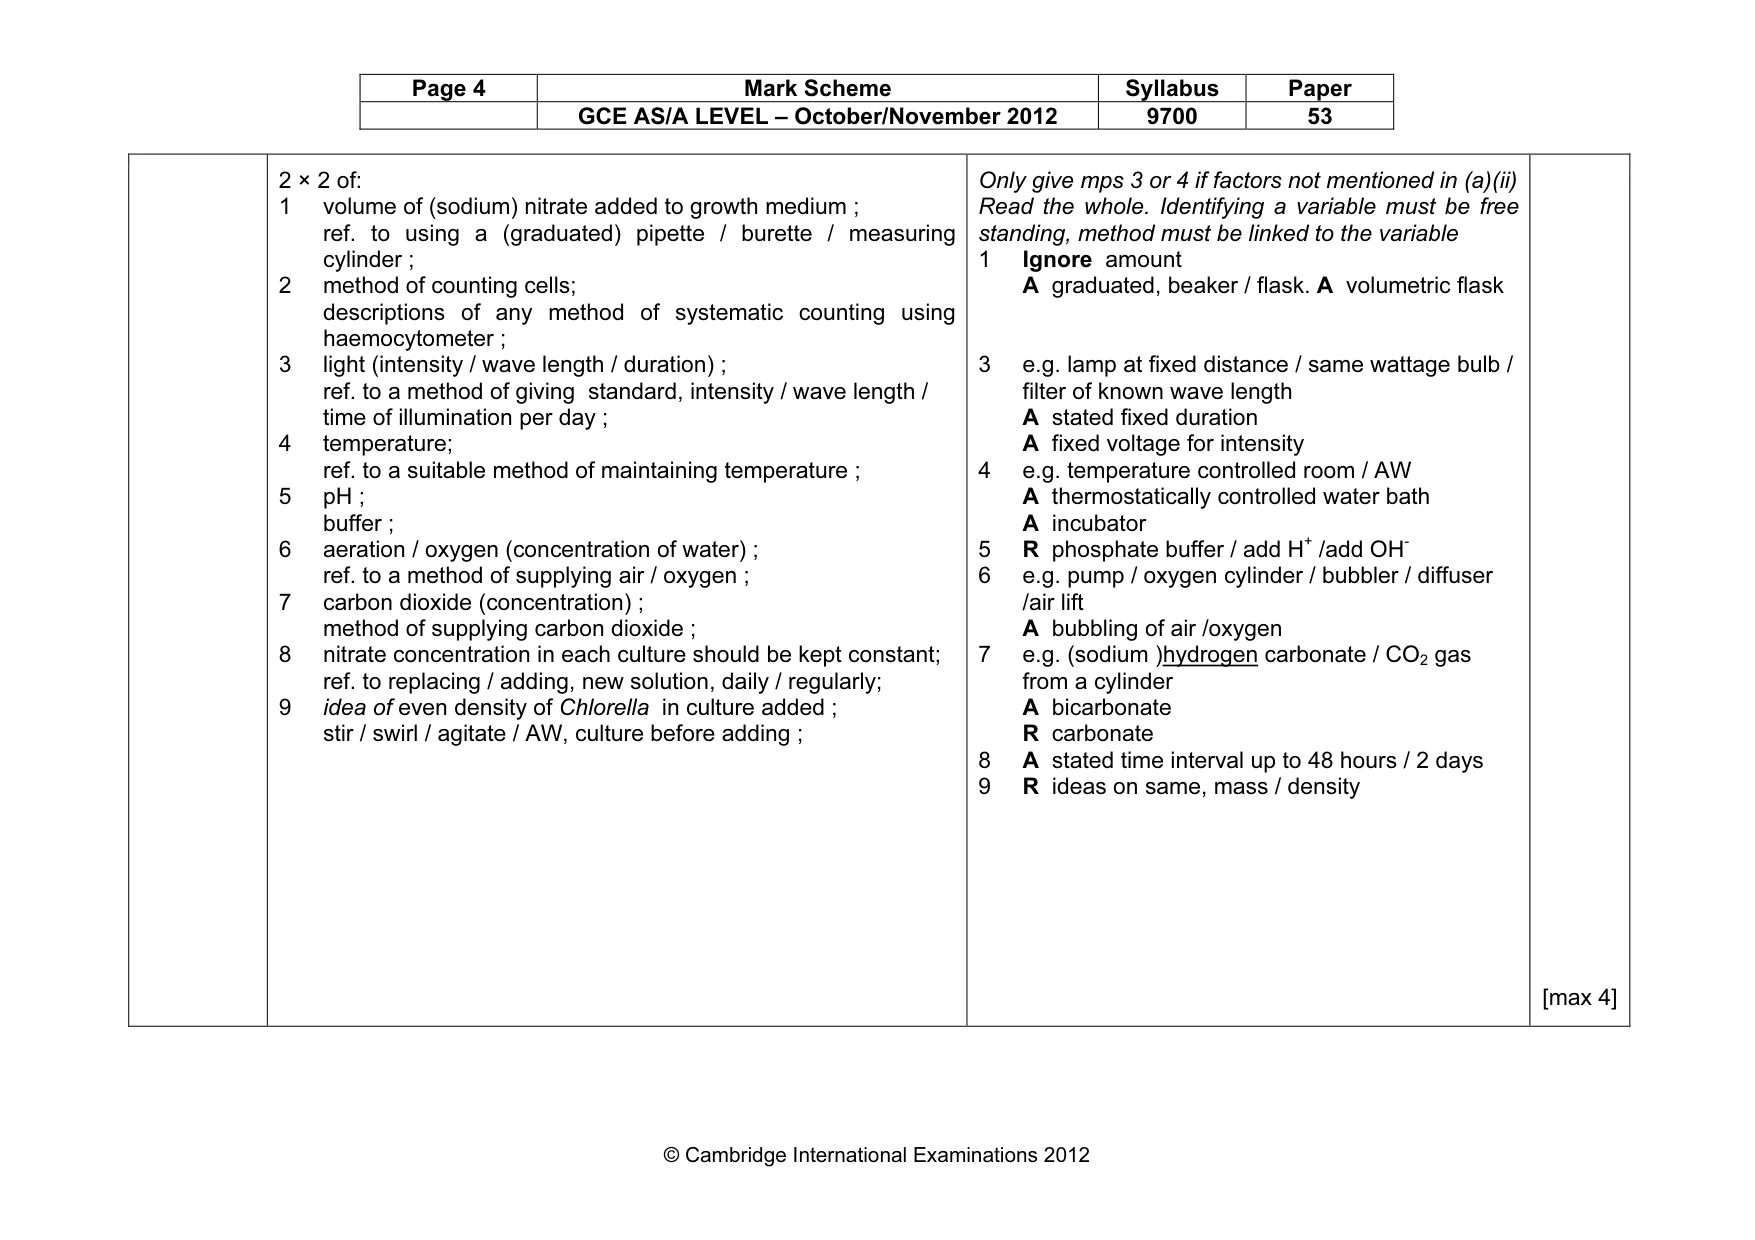
Page 4 Mark Scheme Syllabus Paper GCE AS/A LEVEL – October/November 2012 9700 53 © Cambridge International Examinations 2012 2 × 2 of: 1 volume of (sodium) nitrate added to growth medium ; ref. to using a (graduated) pipette / burette / measuring cylinder ; 2 method of counting cells; descriptions of any method of systematic counting using haemocytometer ; 3 light (intensity / wave length / duration) ; ref. to a method of giving standard, intensity / wave length / time of illumination per day ; 4 temperature; ref. to a suitable method of maintaining temperature ; 5 pH ; buffer ; 6 aeration / oxygen (concentration of water) ; ref. to a method of supplying air / oxygen ; 7 carbon dioxide (concentration) ; method of supplying carbon dioxide ; 8 nitrate concentration in each culture should be kept constant; ref. to replacing / adding, new solution, daily / regularly; 9 idea of even density of Chlorella in culture added ; stir / swirl / agitate / AW, culture before adding ; Only give mps 3 or 4 if factors not mentioned in (a)(ii) Read the whole. Identifying a variable must be free standing, method must be linked to the variable 1 Ignore amount A graduated, beaker / flask. A volumetric flask 3 e.g. lamp at fixed distance / same wattage bulb / filter of known wave length A stated fixed duration A fixed voltage for intensity 4 e.g. temperature controlled room / AW A thermostatically controlled water bath A incubator 5 R phosphate buffer / add H+ /add OH- 6 e.g. pump / oxygen cylinder / bubbler / diffuser /air lift A bubbling of air /oxygen 7 e.g. (sodium )hydrogen carbonate / CO2 gas from a cylinder A bicarbonate R carbonate 8 A stated time interval up to 48 hours / 2 days 9 R ideas on same, mass / density [max 4]
Mark scheme, page 5
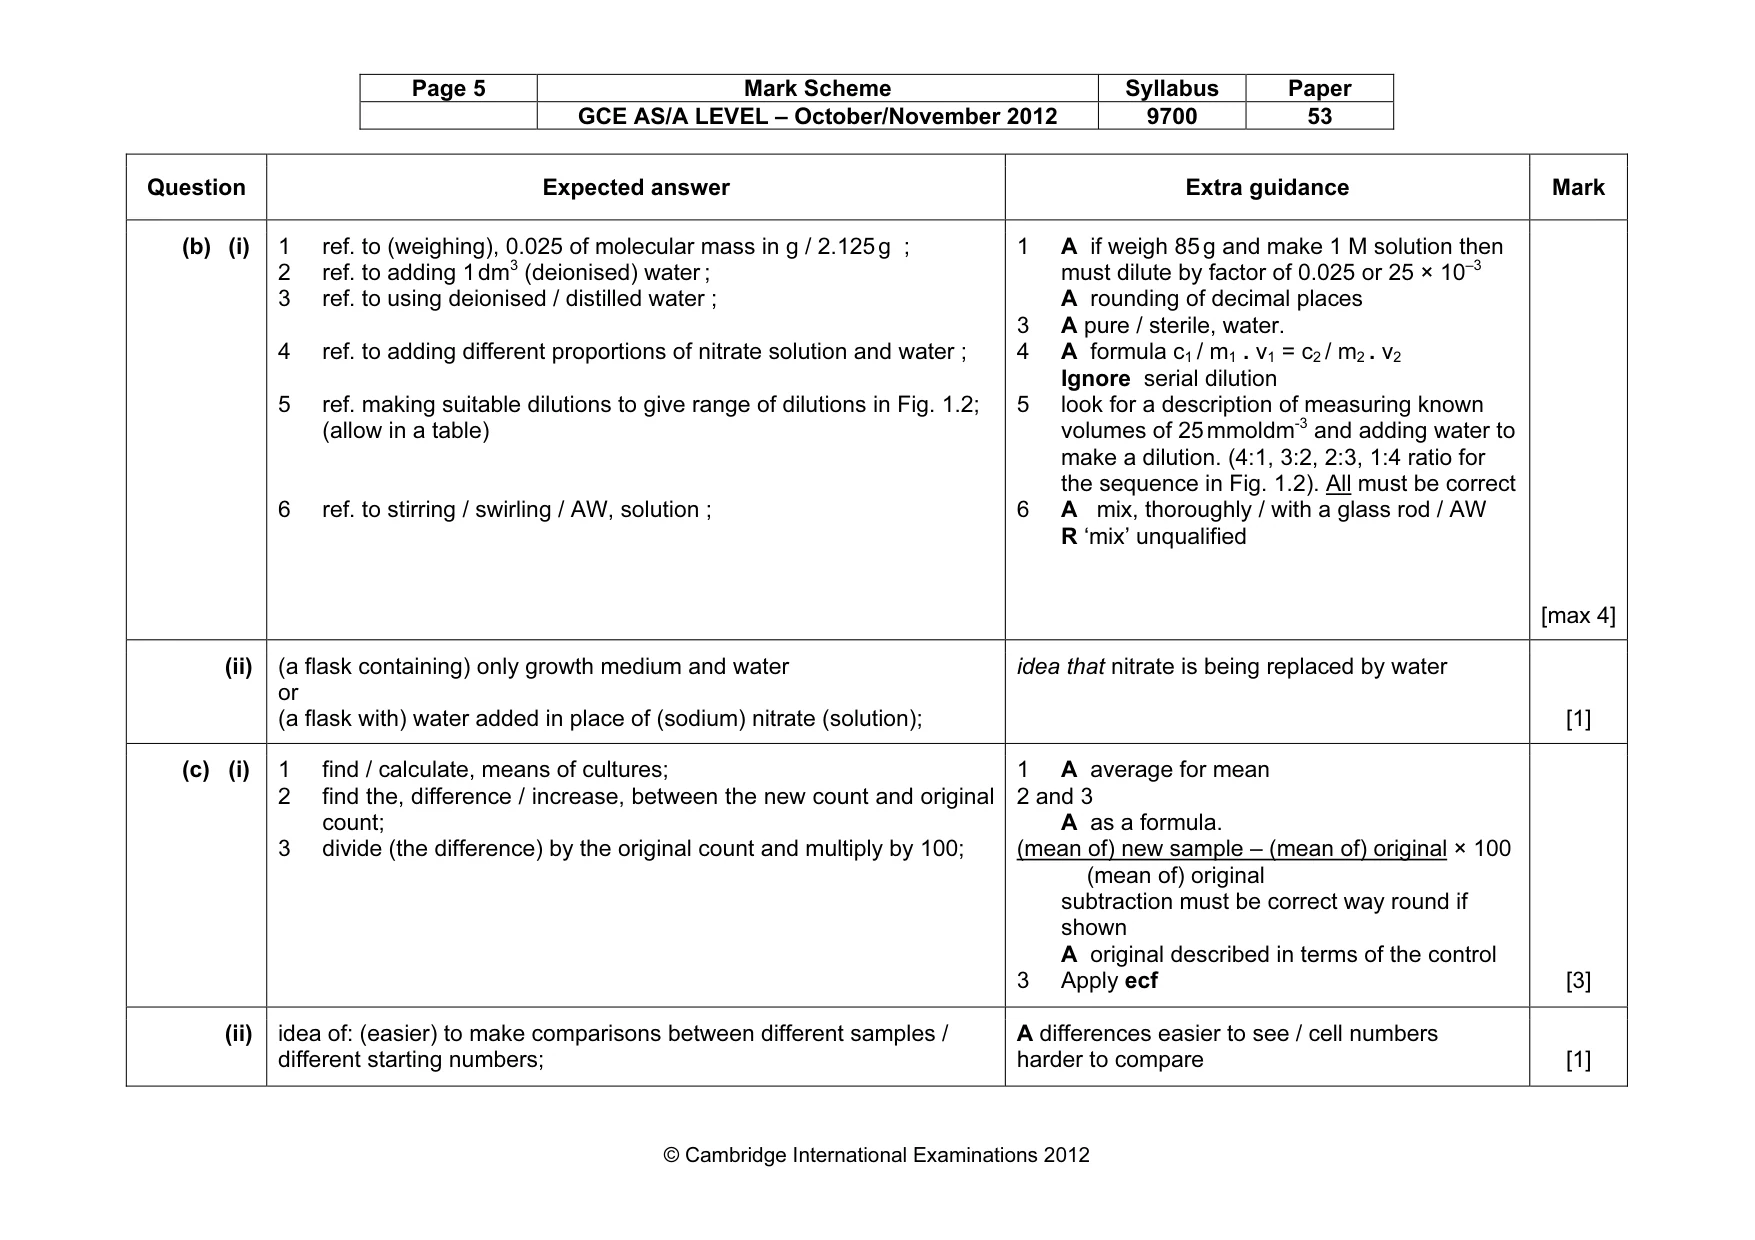
Page 5 Mark Scheme Syllabus Paper GCE AS/A LEVEL – October/November 2012 9700 53 © Cambridge International Examinations 2012 Question Expected answer Extra guidance Mark (b) (i) 1 ref. to (weighing), 0.025 of molecular mass in g / 2.125 g ; 2 ref. to adding 1 dm3 (deionised) water ; 3 ref. to using deionised / distilled water ; 4 ref. to adding different proportions of nitrate solution and water ; 5 ref. making suitable dilutions to give range of dilutions in Fig. 1.2; (allow in a table) 6 ref. to stirring / swirling / AW, solution ; 1 A if weigh 85 g and make 1 M solution then must dilute by factor of 0.025 or 25 × 10–3 A rounding of decimal places 3 A pure / sterile, water. 4 A formula c1 / m1 . v1 = c2 / m2 . v2 Ignore serial dilution 5 look for a description of measuring known volumes of 25 mmoldm-3 and adding water to make a dilution. (4:1, 3:2, 2:3, 1:4 ratio for the sequence in Fig. 1.2). All must be correct 6 A mix, thoroughly / with a glass rod / AW R ‘mix’ unqualified [max 4] (ii) (a flask containing) only growth medium and water or (a flask with) water added in place of (sodium) nitrate (solution); idea that nitrate is being replaced by water [1] (c) (i) 1 find / calculate, means of cultures; 2 find the, difference / increase, between the new count and original count; 3 divide (the difference) by the original count and multiply by 100; 1 A average for mean 2 and 3 A as a formula. (mean of) new sample – (mean of) original × 100 (mean of) original subtraction must be correct way round if shown A original described in terms of the control 3 Apply ecf [3] (ii) idea of: (easier) to make comparisons between different samples / different starting numbers; A differences easier to see / cell numbers harder to compare [1]
Mark scheme, page 6
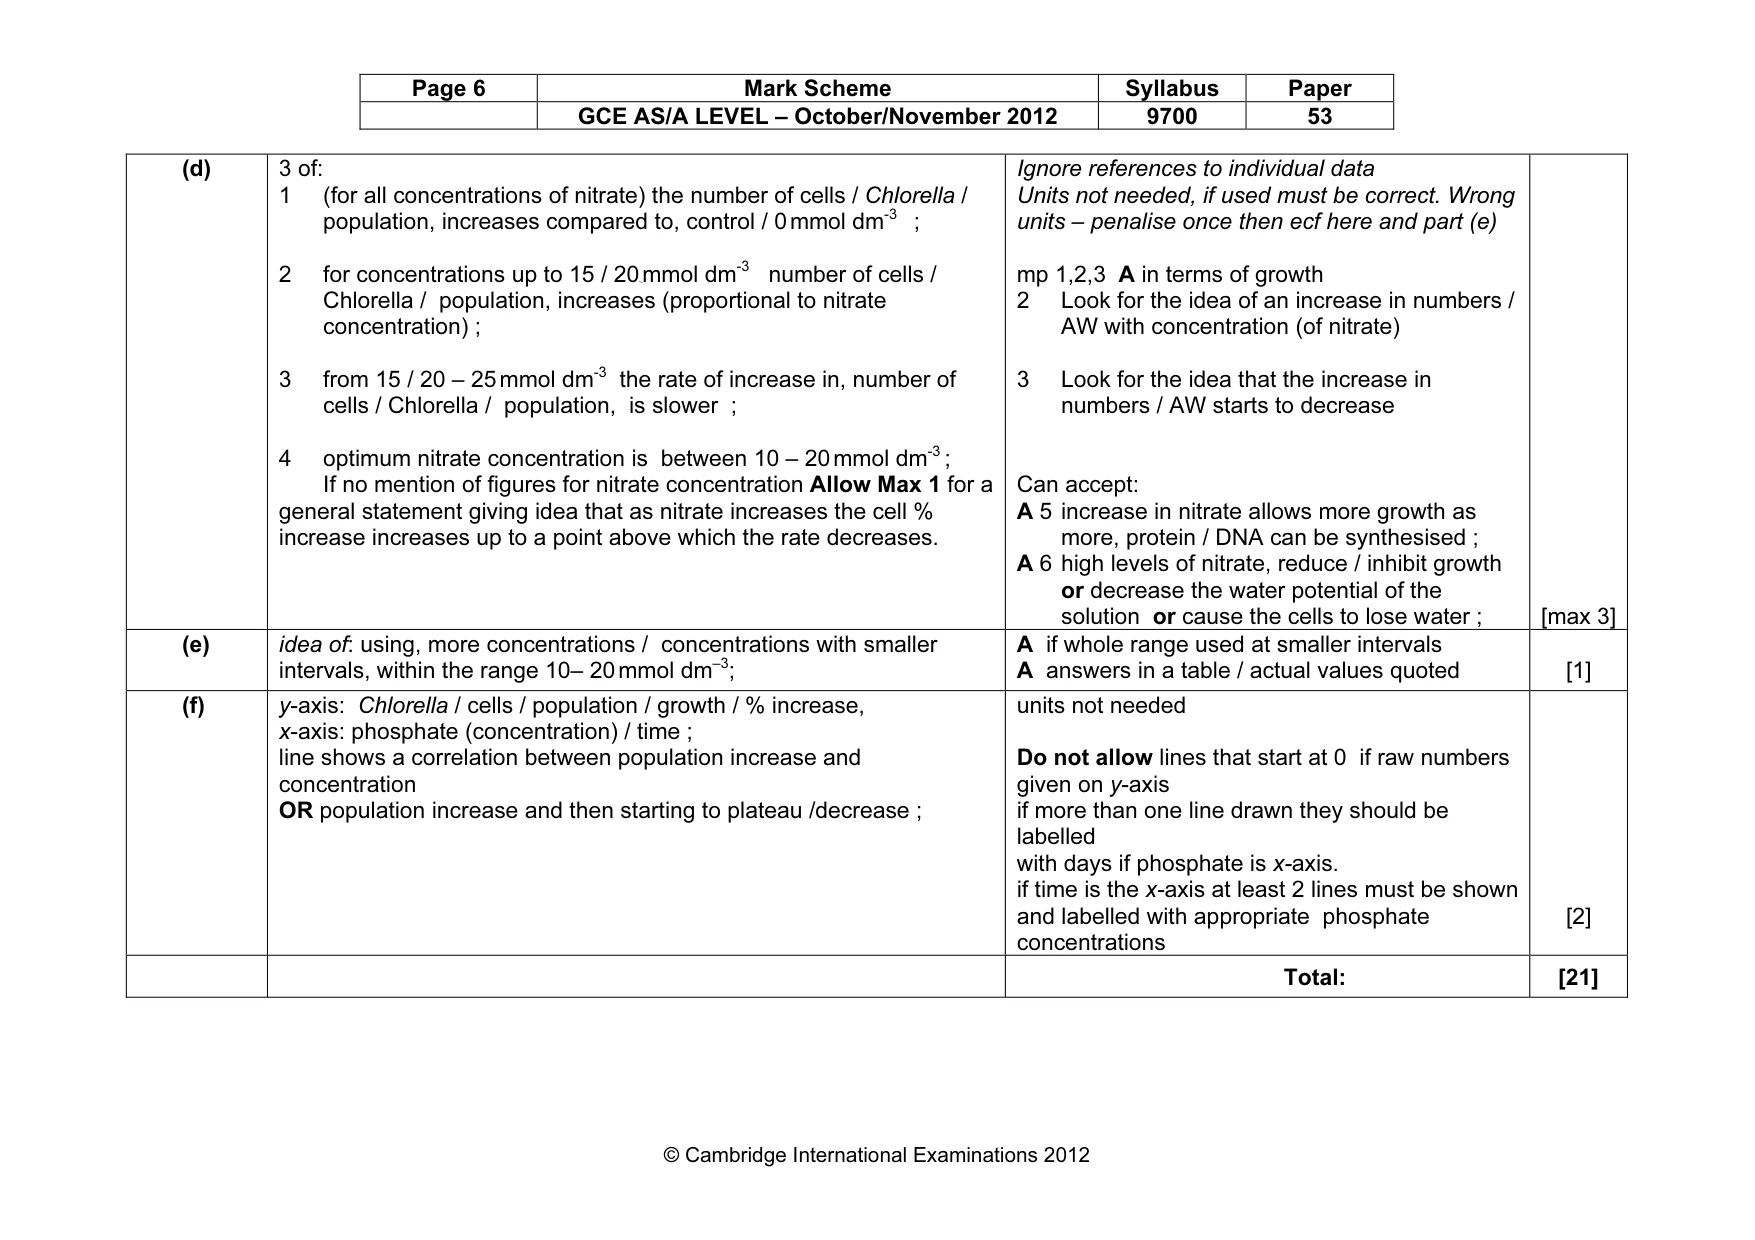
Page 6 Mark Scheme Syllabus Paper GCE AS/A LEVEL – October/November 2012 9700 53 © Cambridge International Examinations 2012 (d) 3 of: 1 (for all concentrations of nitrate) the number of cells / Chlorella / population, increases compared to, control / 0 mmol dm-3 ; 2 for concentrations up to 15 / 20 mmol dm-3 number of cells / Chlorella / population, increases (proportional to nitrate concentration) ; 3 from 15 / 20 – 25 mmol dm-3 the rate of increase in, number of cells / Chlorella / population, is slower ; 4 optimum nitrate concentration is between 10 – 20 mmol dm-3 ; If no mention of figures for nitrate concentration Allow Max 1 for a general statement giving idea that as nitrate increases the cell % increase increases up to a point above which the rate decreases. Ignore references to individual data Units not needed, if used must be correct. Wrong units – penalise once then ecf here and part (e) mp 1,2,3 A in terms of growth 2 Look for the idea of an increase in numbers / AW with concentration (of nitrate) 3 Look for the idea that the increase in numbers / AW starts to decrease Can accept: A 5 increase in nitrate allows more growth as more, protein / DNA can be synthesised ; A 6 high levels of nitrate, reduce / inhibit growth or decrease the water potential of the solution or cause the cells to lose water ; [max 3] (e) idea of: using, more concentrations / concentrations with smaller intervals, within the range 10– 20 mmol dm–3; A if whole range used at smaller intervals A answers in a table / actual values quoted [1] (f) y-axis: Chlorella / cells / population / growth / % increase, x-axis: phosphate (concentration) / time ; line shows a correlation between population increase and concentration OR population increase and then starting to plateau /decrease ; units not needed Do not allow lines that start at 0 if raw numbers given on y-axis if more than one line drawn they should be labelled with days if phosphate is x-axis. if time is the x-axis at least 2 lines must be shown and labelled with appropriate phosphate concentrations [2] Total: [21]
Mark scheme, page 7
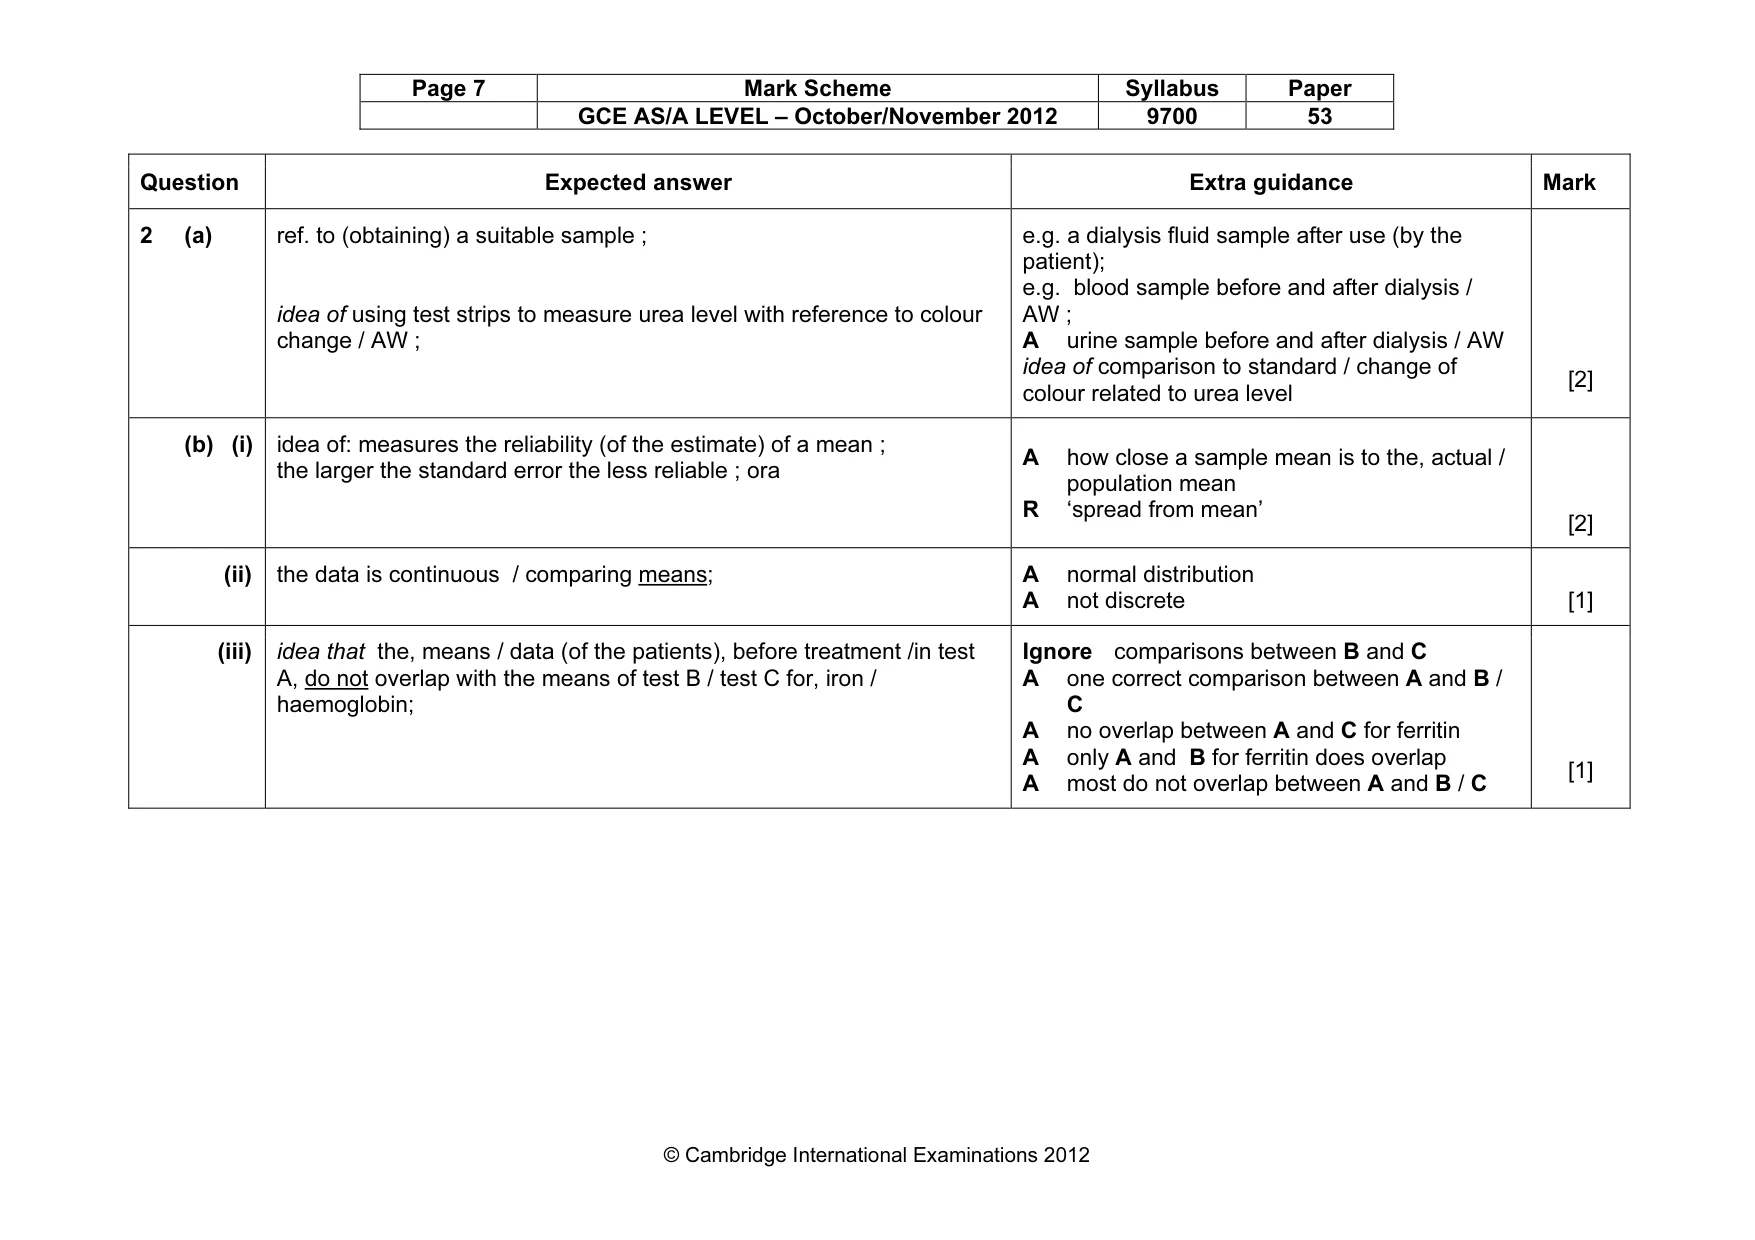
Page 7 Mark Scheme Syllabus Paper GCE AS/A LEVEL – October/November 2012 9700 53 © Cambridge International Examinations 2012 Question Expected answer Extra guidance Mark 2 (a) ref. to (obtaining) a suitable sample ; idea of using test strips to measure urea level with reference to colour change / AW ; e.g. a dialysis fluid sample after use (by the patient); e.g. blood sample before and after dialysis / AW ; A urine sample before and after dialysis / AW idea of comparison to standard / change of colour related to urea level [2] (b) (i) idea of: measures the reliability (of the estimate) of a mean ; the larger the standard error the less reliable ; ora A how close a sample mean is to the, actual / population mean R ‘spread from mean’ [2] (ii) the data is continuous / comparing means; A normal distribution A not discrete [1] (iii) idea that the, means / data (of the patients), before treatment /in test A, do not overlap with the means of test B / test C for, iron / haemoglobin; Ignore comparisons between B and C A one correct comparison between A and B / C A no overlap between A and C for ferritin A only A and B for ferritin does overlap A most do not overlap between A and B / C [1]
Mark scheme, page 8
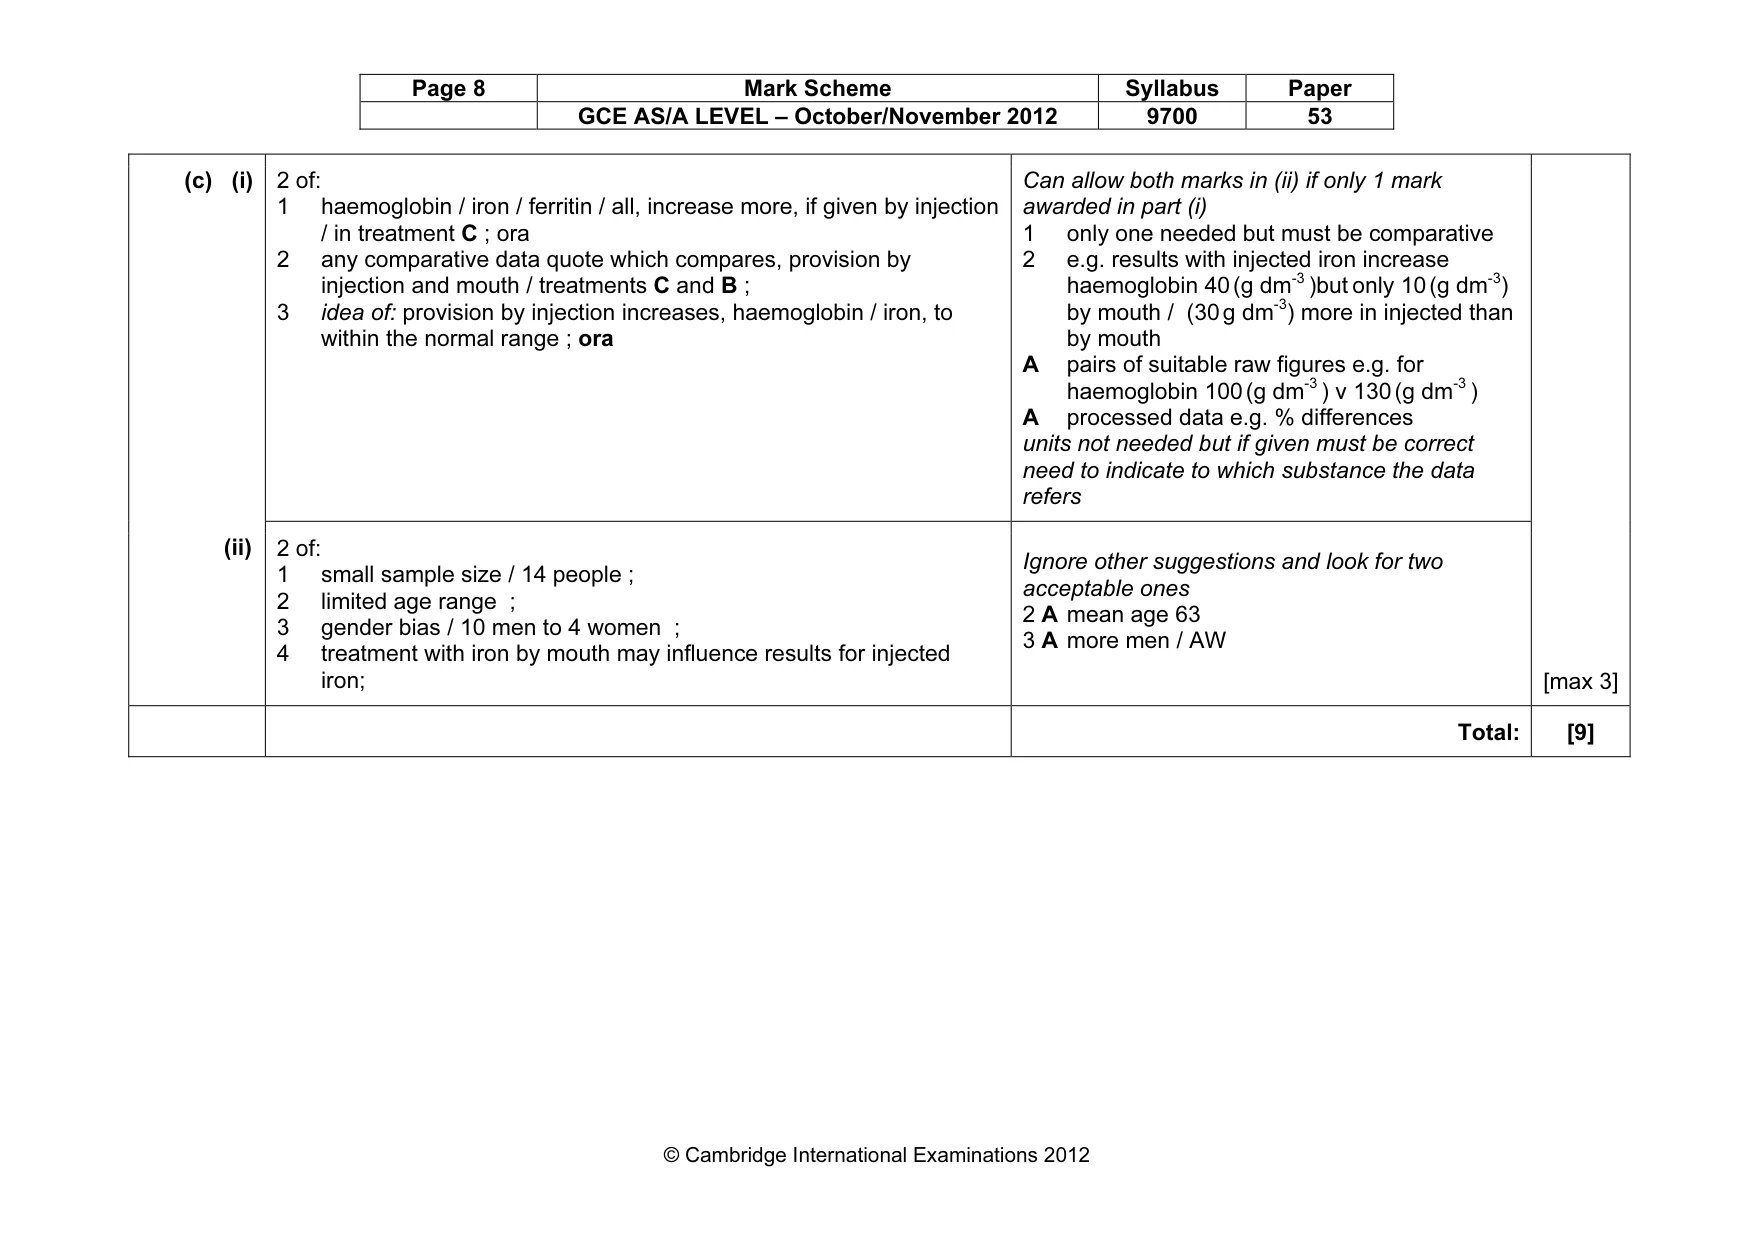
Page 8 Mark Scheme Syllabus Paper GCE AS/A LEVEL – October/November 2012 9700 53 © Cambridge International Examinations 2012 (c) (i) 2 of: 1 haemoglobin / iron / ferritin / all, increase more, if given by injection / in treatment C ; ora 2 any comparative data quote which compares, provision by injection and mouth / treatments C and B ; 3 idea of: provision by injection increases, haemoglobin / iron, to within the normal range ; ora Can allow both marks in (ii) if only 1 mark awarded in part (i) 1 only one needed but must be comparative 2 e.g. results with injected iron increase haemoglobin 40 (g dm-3 )but only 10 (g dm-3) by mouth / (30 g dm-3) more in injected than by mouth A pairs of suitable raw figures e.g. for haemoglobin 100 (g dm-3 ) v 130 (g dm-3 ) A processed data e.g. % differences units not needed but if given must be correct need to indicate to which substance the data refers (ii) 2 of: 1 small sample size / 14 people ; 2 limited age range ; 3 gender bias / 10 men to 4 women ; 4 treatment with iron by mouth may influence results for injected iron; Ignore other suggestions and look for two acceptable ones 2 A mean age 63 3 A more men / AW [max 3] Total: [9]
What you needed in this session
Cambridge’s own grade thresholds for 2012 Oct/Nov, Paper 5 · Variant 3. A higher threshold means an easier paper — the bar moves with how the cohort did.