Cambridge A Level Biology 9700 — 2003 Oct/Nov Paper 4 · Variant 1
9700/41/O/N/03
The question paper and its mark scheme, free to read here and free to download. This is Cambridge’s own paper, exactly as it was sat.
Question paper12 pages

Mark scheme
No mark scheme is in the library for this paper.
Paper as text
Question paper, page 1
This document consists of 11 printed pages and 1 blank page. SP (AT/KN) S55194/2 © UCLES 2003 [Turn over CAMBRIDGE INTERNATIONAL EXAMINATIONS General Certificate of Education Advanced Subsidiary Level and Advanced Level BIOLOGY 9700/04 Paper 4 October/November 2003 1 hour Candidates answer on the question paper. No additional materials are required. READ THESE INSTRUCTIONS FIRST Write your Centre number, candidate number and name on all the work you hand in. Write in dark blue or black pen. You may use a soft pencil for any diagrams, graphs or rough working. Do not use staples, paper clips, highlighters, glue or correction fluid. Answer all questions. The number of marks is given in brackets [ ] at the end of each question or part question. Centre Number Candidate Number Name For Examiner’s Use 1 2 3 4 5 Total
Question paper, page 2
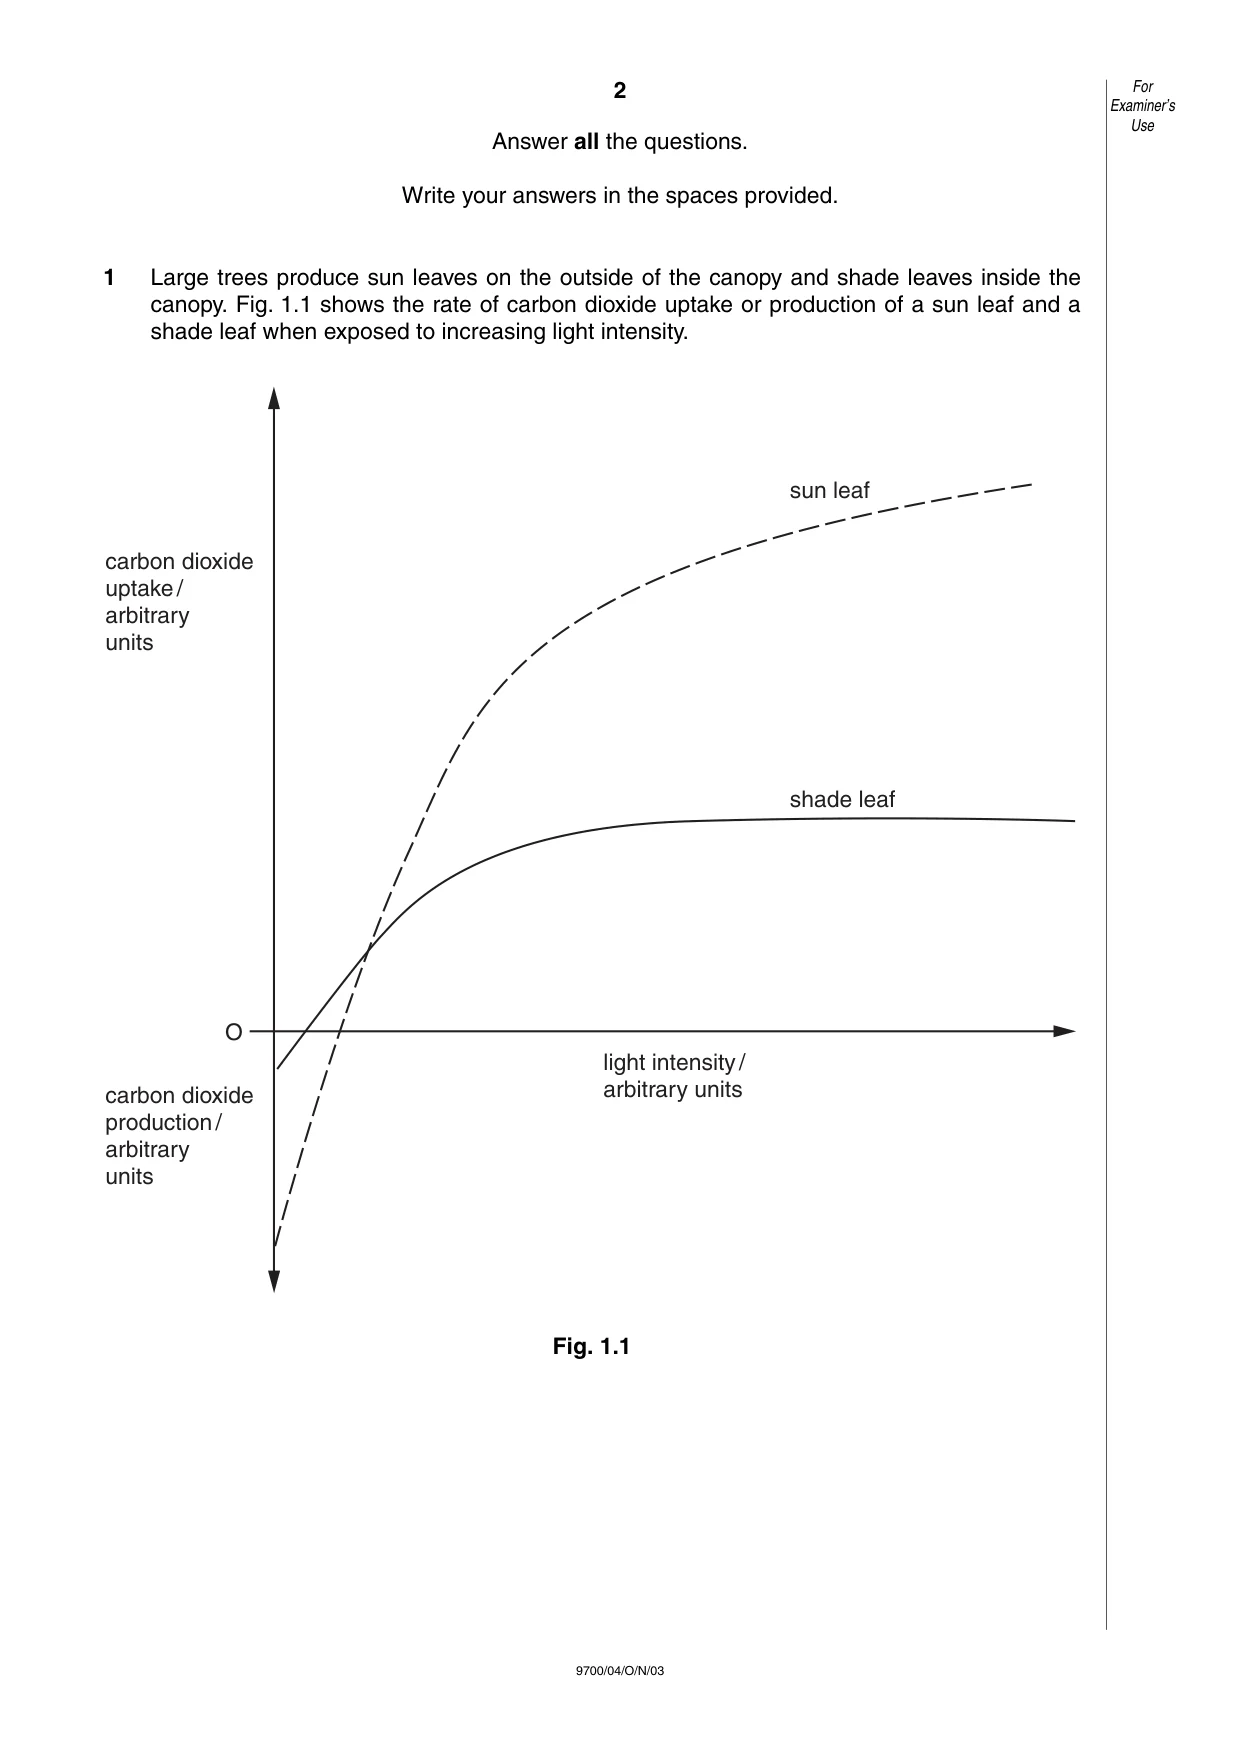
2 9700/04/O/N/03 Answer all the questions. Write your answers in the spaces provided. 1 Large trees produce sun leaves on the outside of the canopy and shade leaves inside the canopy. Fig. 1.1 shows the rate of carbon dioxide uptake or production of a sun leaf and a shade leaf when exposed to increasing light intensity. Fig. 1.1 For Examiner’s Use carbon dioxide uptake/ arbitrary units carbon dioxide production/ arbitrary units light intensity/ arbitrary units shade leaf sun leaf O
Question paper, page 3
3 9700/04/O/N/03 [Turn over (a) With reference to Fig. 1.1, describe three ways in which the sun and shade leaf differ in their response to increasing light intensity. 1 … … 2 … … 3 … …[3] (b) Explain why the carbon dioxide uptake levels off in the shade leaf as the light intensity increases. … … … …[3] (c) The results shown in Fig. 1.1 were taken at a temperature of 20 °C. Describe briefly how increasing the temperature to 25 °C would affect the results in the sun leaf. … … … …[3] [Total : 9] For Examiner’s Use
Question paper, page 4
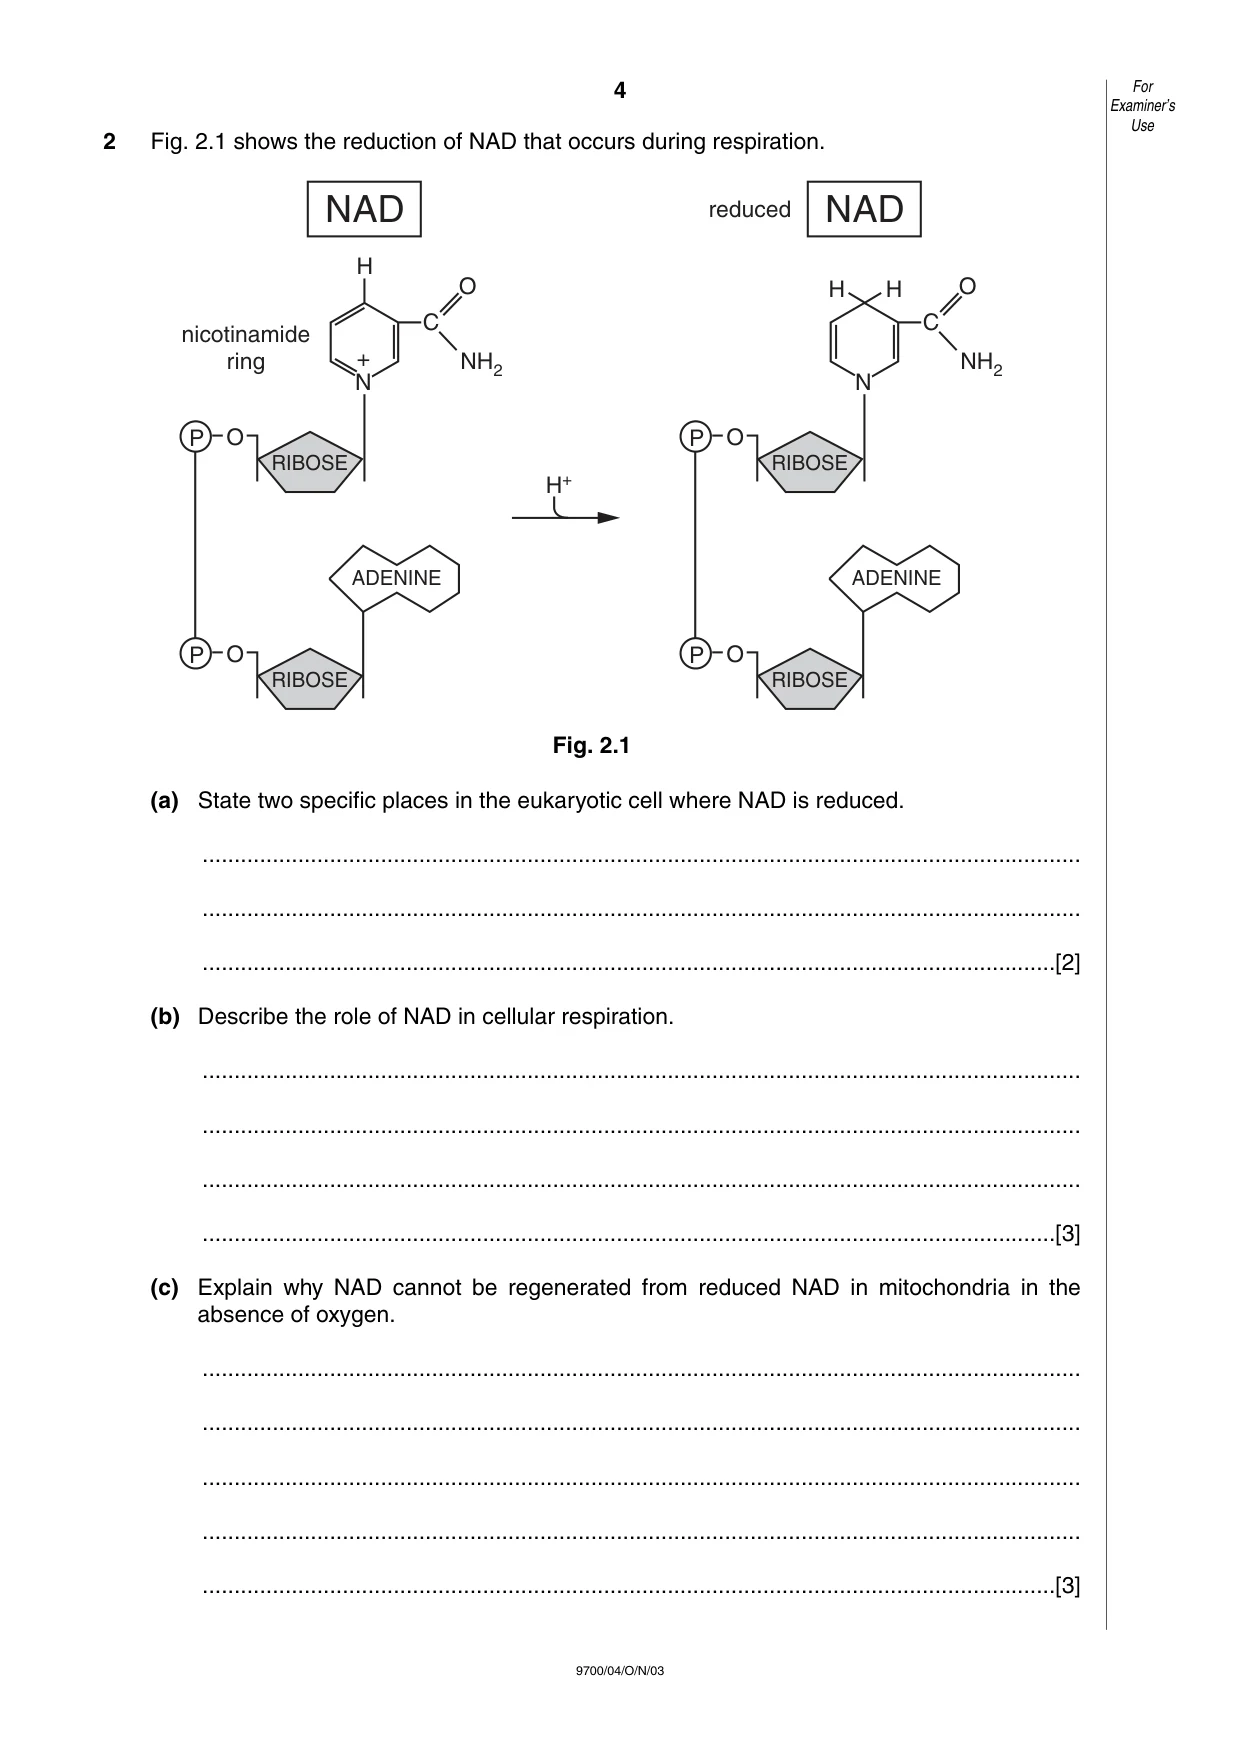
4 9700/04/O/N/03 2 Fig. 2.1 shows the reduction of NAD that occurs during respiration. Fig. 2.1 (a) State two specific places in the eukaryotic cell where NAD is reduced. … … …[2] (b) Describe the role of NAD in cellular respiration. … … … …[3] (c) Explain why NAD cannot be regenerated from reduced NAD in mitochondria in the absence of oxygen. … … … … …[3] + N NH2 H C O O P RIBOSE O P RIBOSE ADENINE nicotinamide ring NAD N NH2 H H C O O P RIBOSE O P RIBOSE ADENINE NAD H+ reduced For Examiner’s Use
Question paper, page 5
5 9700/04/O/N/03 [Turn over (d) Yeast can respire aerobically and anaerobically. When there is insufficient oxygen, yeast cells switch from aerobic to anaerobic respiration. This results in a significant increase in the rate of glucose uptake and glycolysis in the yeast cells. Suggest why the rate of glycolysis increases significantly when yeasts cells switch from aerobic to anaerobic respiration. … … …[2] [Total : 10] For Examiner’s Use
Question paper, page 6
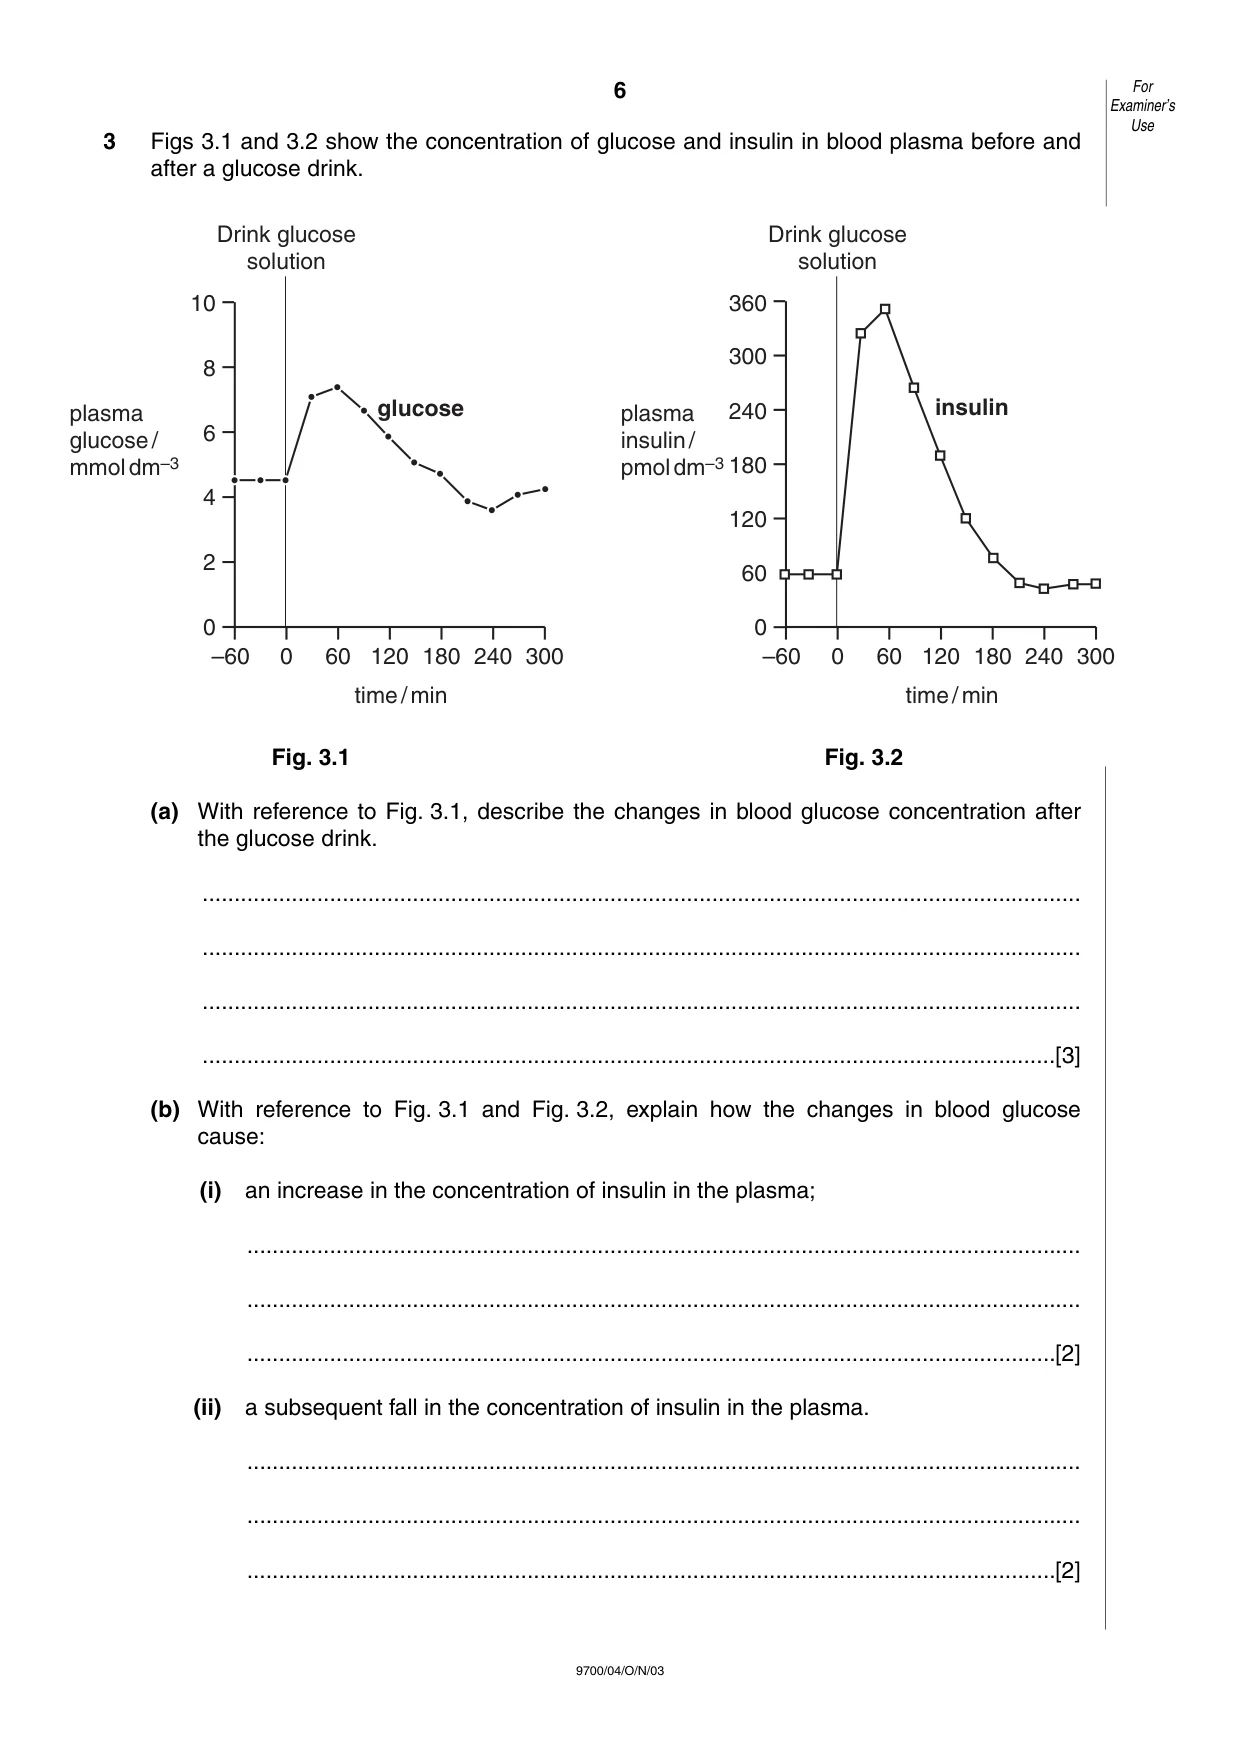
6 9700/04/O/N/03 3 Figs 3.1 and 3.2 show the concentration of glucose and insulin in blood plasma before and after a glucose drink. Fig. 3.1 Fig. 3.2 (a) With reference to Fig. 3.1, describe the changes in blood glucose concentration after the glucose drink. … … … …[3] (b) With reference to Fig. 3.1 and Fig. 3.2, explain how the changes in blood glucose cause: (i) an increase in the concentration of insulin in the plasma; … … …[2] (ii) a subsequent fall in the concentration of insulin in the plasma. … … …[2] For Examiner’s Use 10 8 6 4 2 0 plasma glucose/ mmoldm–3 –60 0 60 120 180 time/min 240 300 Drink glucose solution glucose 360 300 240 180 120 60 0 plasma insulin/ pmoldm–3 –60 0 60 120 180 time/min 240 300 Drink glucose solution insulin
Question paper, page 7
7 9700/04/O/N/03 [Turn over (c) Describe the role of the hormone glucagon in maintaining the concentration of blood glucose. … … … …[3] [Total : 10] For Examiner’s Use
Question paper, page 8
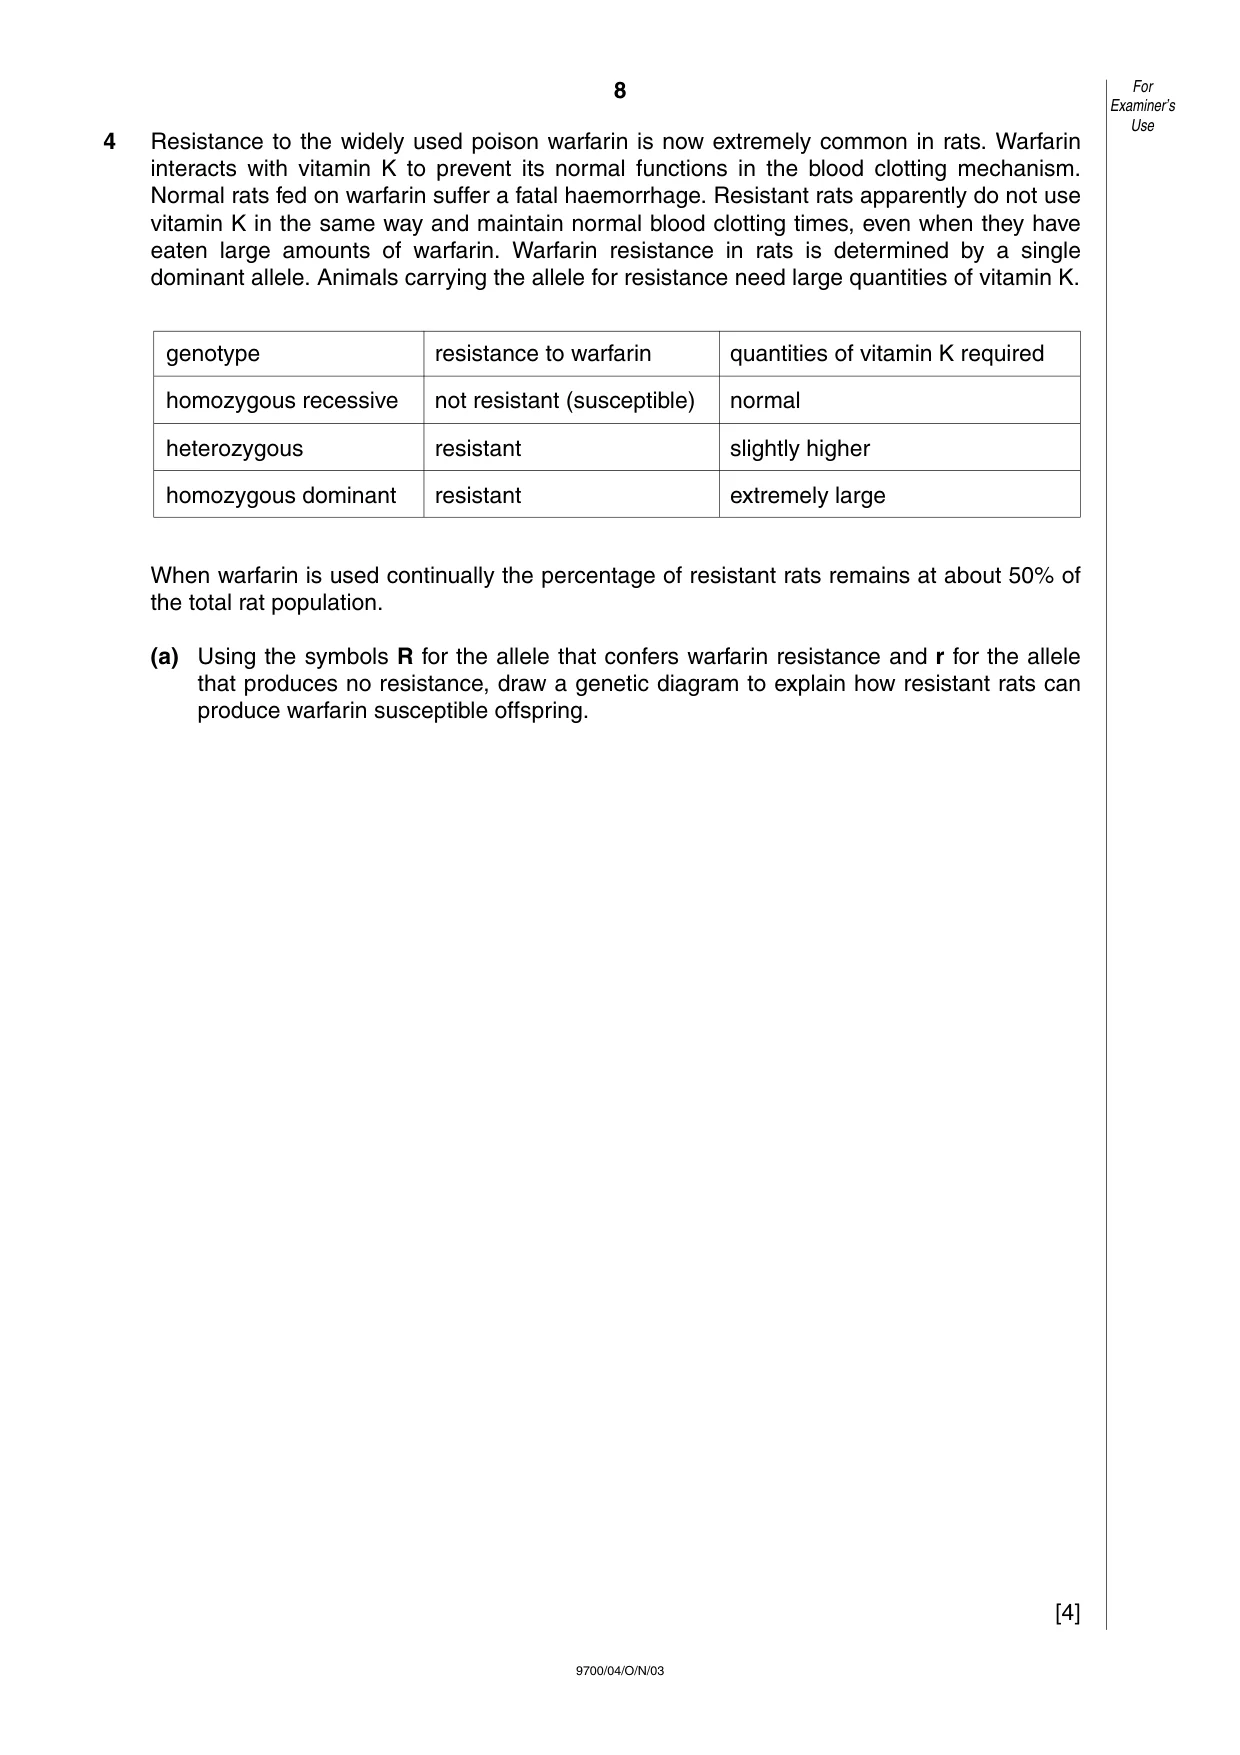
8 9700/04/O/N/03 4 Resistance to the widely used poison warfarin is now extremely common in rats. Warfarin interacts with vitamin K to prevent its normal functions in the blood clotting mechanism. Normal rats fed on warfarin suffer a fatal haemorrhage. Resistant rats apparently do not use vitamin K in the same way and maintain normal blood clotting times, even when they have eaten large amounts of warfarin. Warfarin resistance in rats is determined by a single dominant allele. Animals carrying the allele for resistance need large quantities of vitamin K. When warfarin is used continually the percentage of resistant rats remains at about 50% of the total rat population. (a) Using the symbols R for the allele that confers warfarin resistance and r for the allele that produces no resistance, draw a genetic diagram to explain how resistant rats can produce warfarin susceptible offspring. [4] For Examiner’s Use genotype resistance to warfarin quantities of vitamin K required homozygous recessive not resistant (susceptible) normal heterozygous resistant slightly higher homozygous dominant resistant extremely large
Question paper, page 9
9 9700/04/O/N/03 (b) Suggest why homozygous dominant rats are unlikely to survive in the wild. … …[1] (c) Describe how natural selection operates to maintain the proportion of resistant rats at about 50% of the total population. … … … …[3] (d) Explain, with an example, how a mutation that results in the substitution of a single base may affect the phenotype of an organism. … … … …[3] [Total : 11] For Examiner’s Use
Question paper, page 10
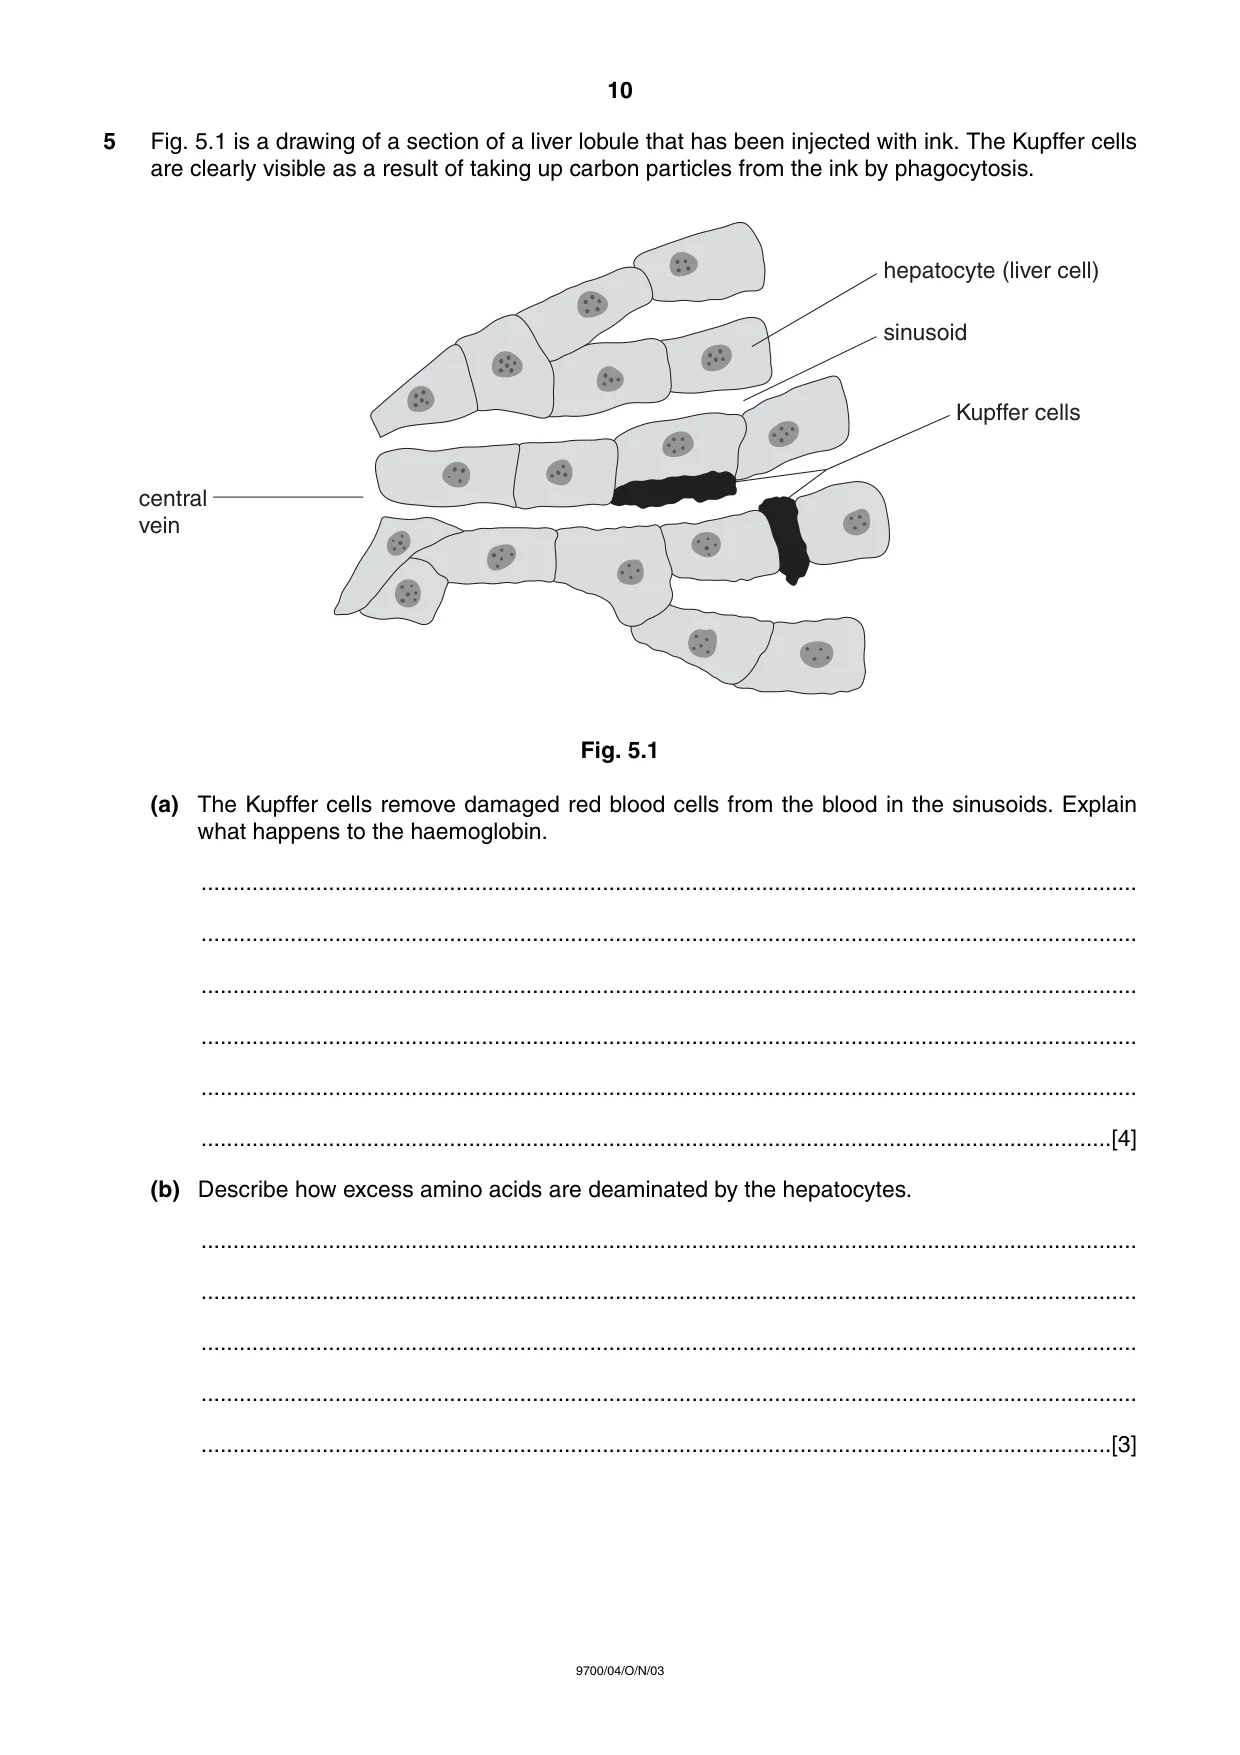
10 9700/04/O/N/03 5 Fig. 5.1 is a drawing of a section of a liver lobule that has been injected with ink. The Kupffer cells are clearly visible as a result of taking up carbon particles from the ink by phagocytosis. Fig. 5.1 (a) The Kupffer cells remove damaged red blood cells from the blood in the sinusoids. Explain what happens to the haemoglobin. … … … … … …[4] (b) Describe how excess amino acids are deaminated by the hepatocytes. … … … … …[3] hepatocyte (liver cell) sinusoid Kupffer cells central vein
Question paper, page 11
11 9700/04/O/N/03 (c) Outline the function of the hepatocytes in detoxification of a named toxic compound. … … … … …[3] [Total : 10]