Cambridge A Level Accounting 9706 — 2012 May/June Paper 2 · Variant 3
9706/23/M/J/12 · 90 marks · ≈101 min
The question paper and its mark scheme, free to read here and free to download. This is Cambridge’s own paper, exactly as it was sat.
Question paper16 pages

Mark scheme5 pages
Answers below. Sit the paper first if you are practising.
Paper as text
Question paper, page 1
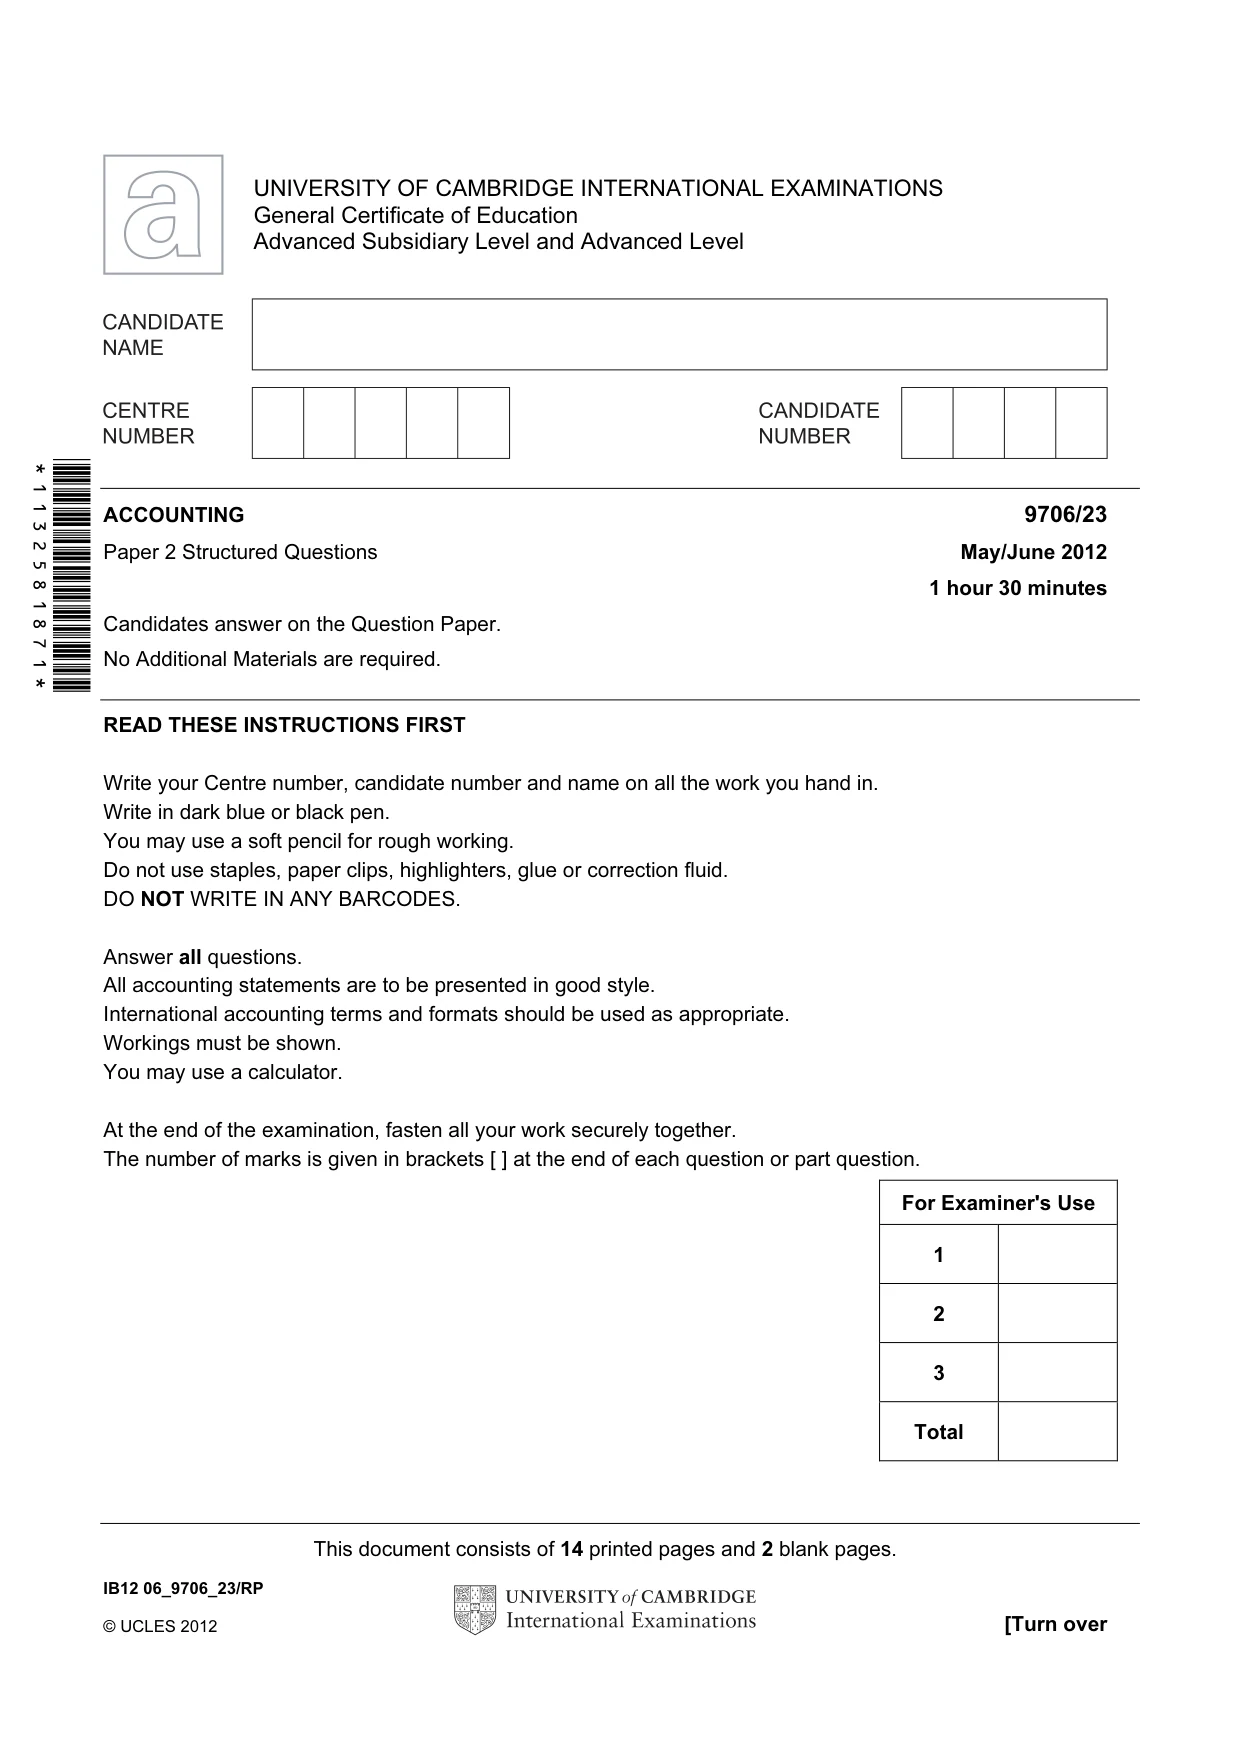
This document consists of 14 printed pages and 2 blank pages. IB12 06_9706_23/RP © UCLES 2012 [Turn over *1132581871* For Examiner's Use 1 2 3 Total UNIVERSITY OF CAMBRIDGE INTERNATIONAL EXAMINATIONS General Certificate of Education Advanced Subsidiary Level and Advanced Level ACCOUNTING 9706/23 Paper 2 Structured Questions May/June 2012 1 hour 30 minutes Candidates answer on the Question Paper. No Additional Materials are required. READ THESE INSTRUCTIONS FIRST Write your Centre number, candidate number and name on all the work you hand in. Write in dark blue or black pen. You may use a soft pencil for rough working. Do not use staples, paper clips, highlighters, glue or correction fluid. DO NOT WRITE IN ANY BARCODES. Answer all questions. All accounting statements are to be presented in good style. International accounting terms and formats should be used as appropriate. Workings must be shown. You may use a calculator. At the end of the examination, fasten all your work securely together. The number of marks is given in brackets [ ] at the end of each question or part question.
Question paper, page 2
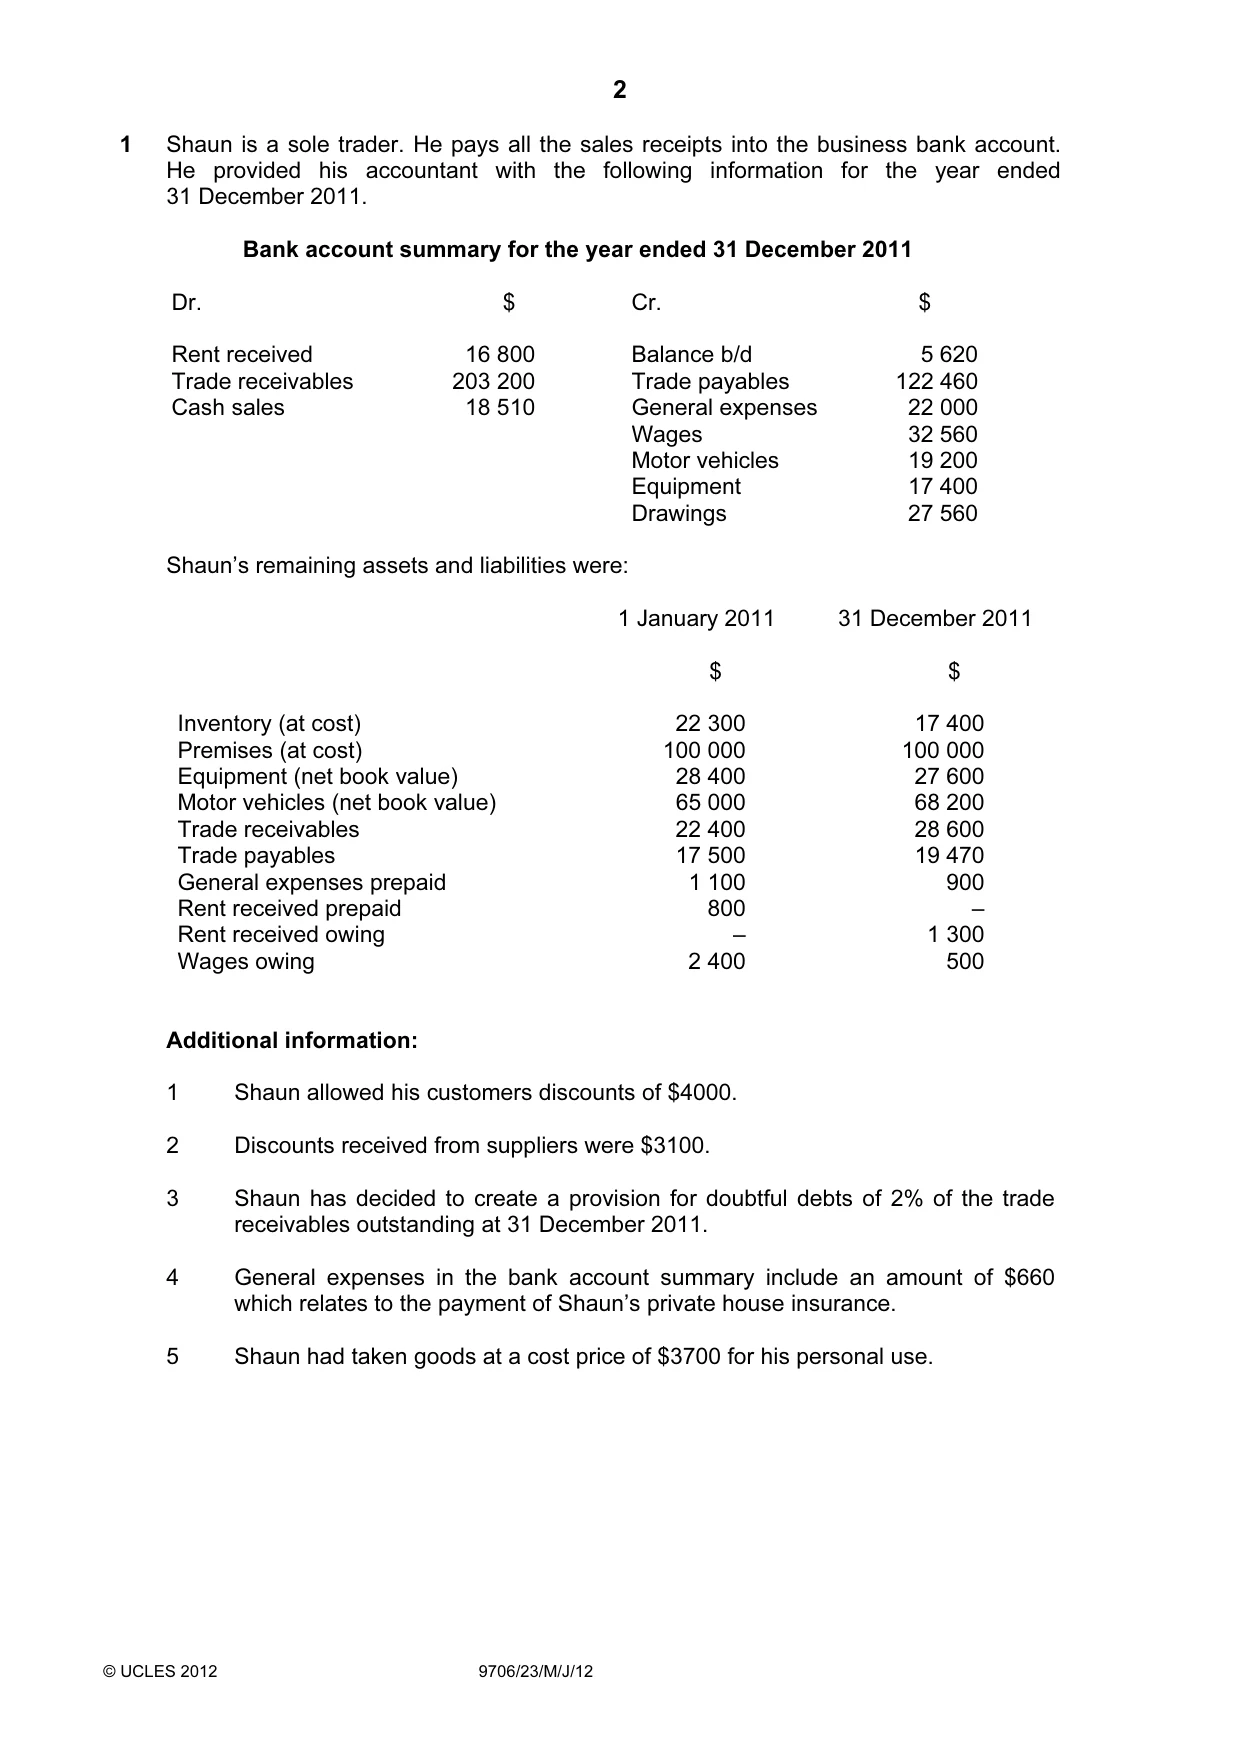
2 © UCLES 2012 9706/23/M/J/12 1 Shaun is a sole trader. He pays all the sales receipts into the business bank account. He provided his accountant with the following information for the year ended 31 December 2011. Bank account summary for the year ended 31 December 2011 Dr. $ Cr. $ Rent received 16 800 Balance b/d 5 620 Trade receivables 203 200 Trade payables 122 460 Cash sales 18 510 General expenses 22 000 Wages 32 560 Motor vehicles 19 200 Equipment 17 400 Drawings 27 560 Shaun’s remaining assets and liabilities were: 1 January 2011 31 December 2011 $ $ Inventory (at cost) 22 300 17 400 Premises (at cost) 100 000 100 000 Equipment (net book value) 28 400 27 600 Motor vehicles (net book value) 65 000 68 200 Trade receivables 22 400 28 600 Trade payables 17 500 19 470 General expenses prepaid 1 100 900 Rent received prepaid 800 – Rent received owing – 1 300 Wages owing 2 400 500 Additional information: 1 Shaun allowed his customers discounts of $4000. 2 Discounts received from suppliers were $3100. 3 Shaun has decided to create a provision for doubtful debts of 2% of the trade receivables outstanding at 31 December 2011. 4 General expenses in the bank account summary include an amount of $660 which relates to the payment of Shaun’s private house insurance. 5 Shaun had taken goods at a cost price of $3700 for his personal use.
Question paper, page 3
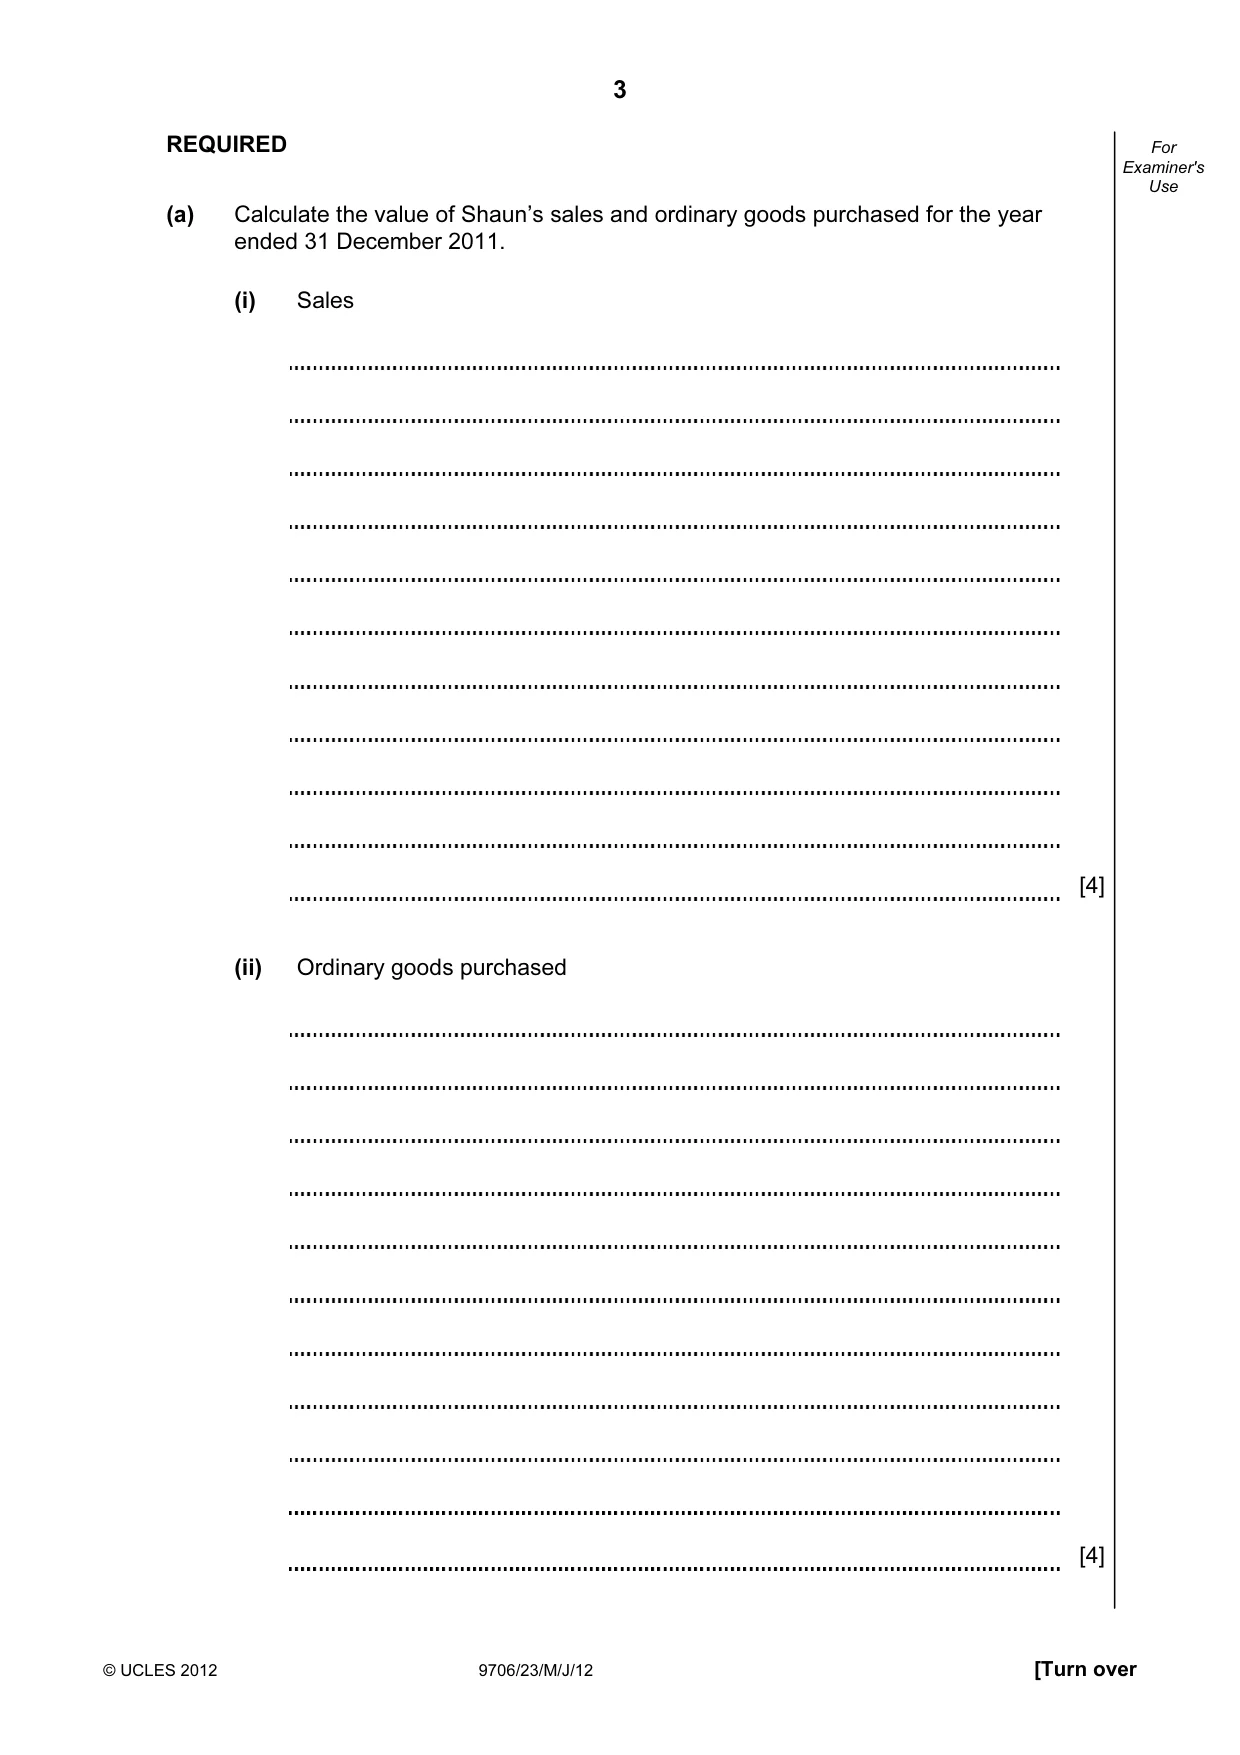
3 © UCLES 2012 9706/23/M/J/12 [Turn over For Examiner's Use REQUIRED (a) Calculate the value of Shaun’s sales and ordinary goods purchased for the year ended 31 December 2011. (i) Sales [4] (ii) Ordinary goods purchased [4]
Question paper, page 4
4 © UCLES 2012 9706/23/M/J/12 For Examiner's Use (b) Prepare Shaun’s income statement for the year ended 31 December 2011. [10]
Question paper, page 5
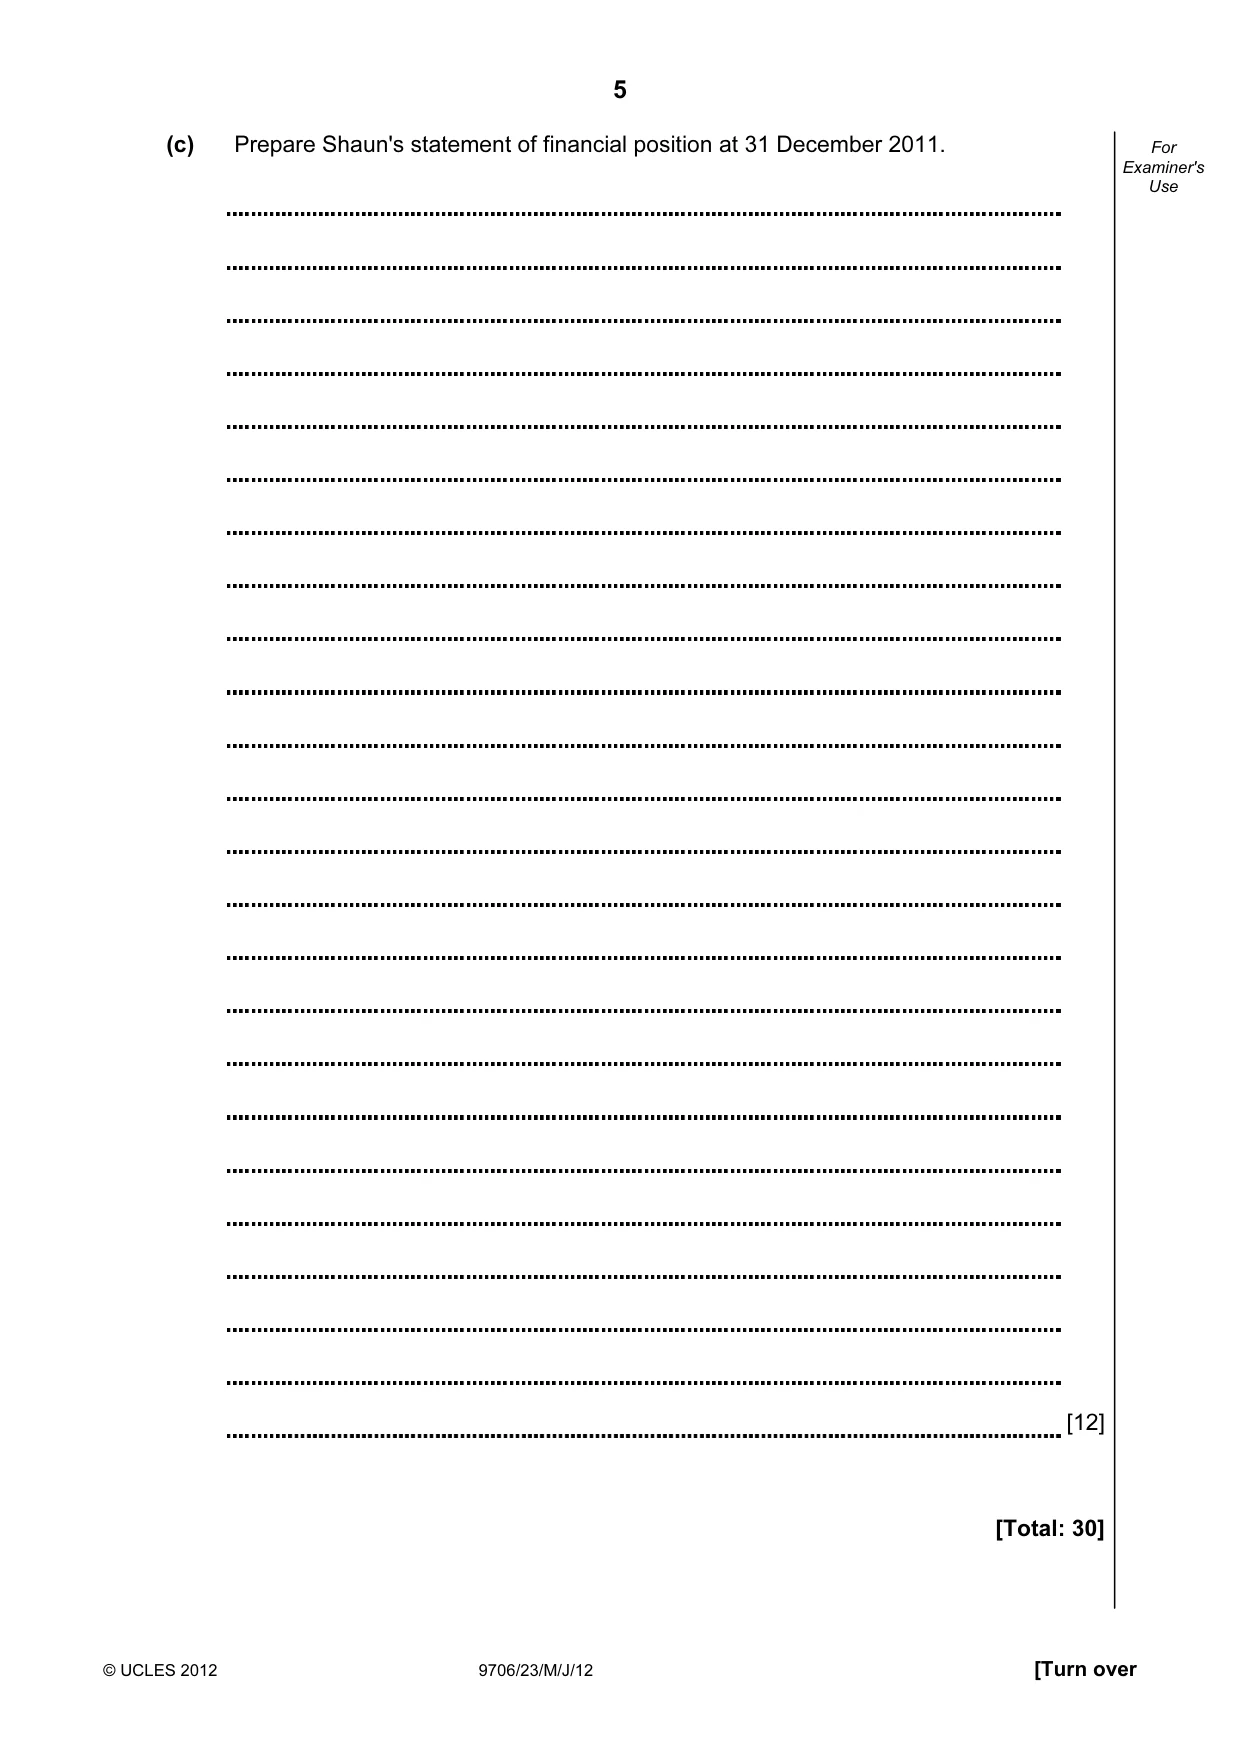
5 © UCLES 2012 9706/23/M/J/12 [Turn over For Examiner's Use (c) Prepare Shaun's statement of financial position at 31 December 2011. [12] [Total: 30]
Question paper, page 6
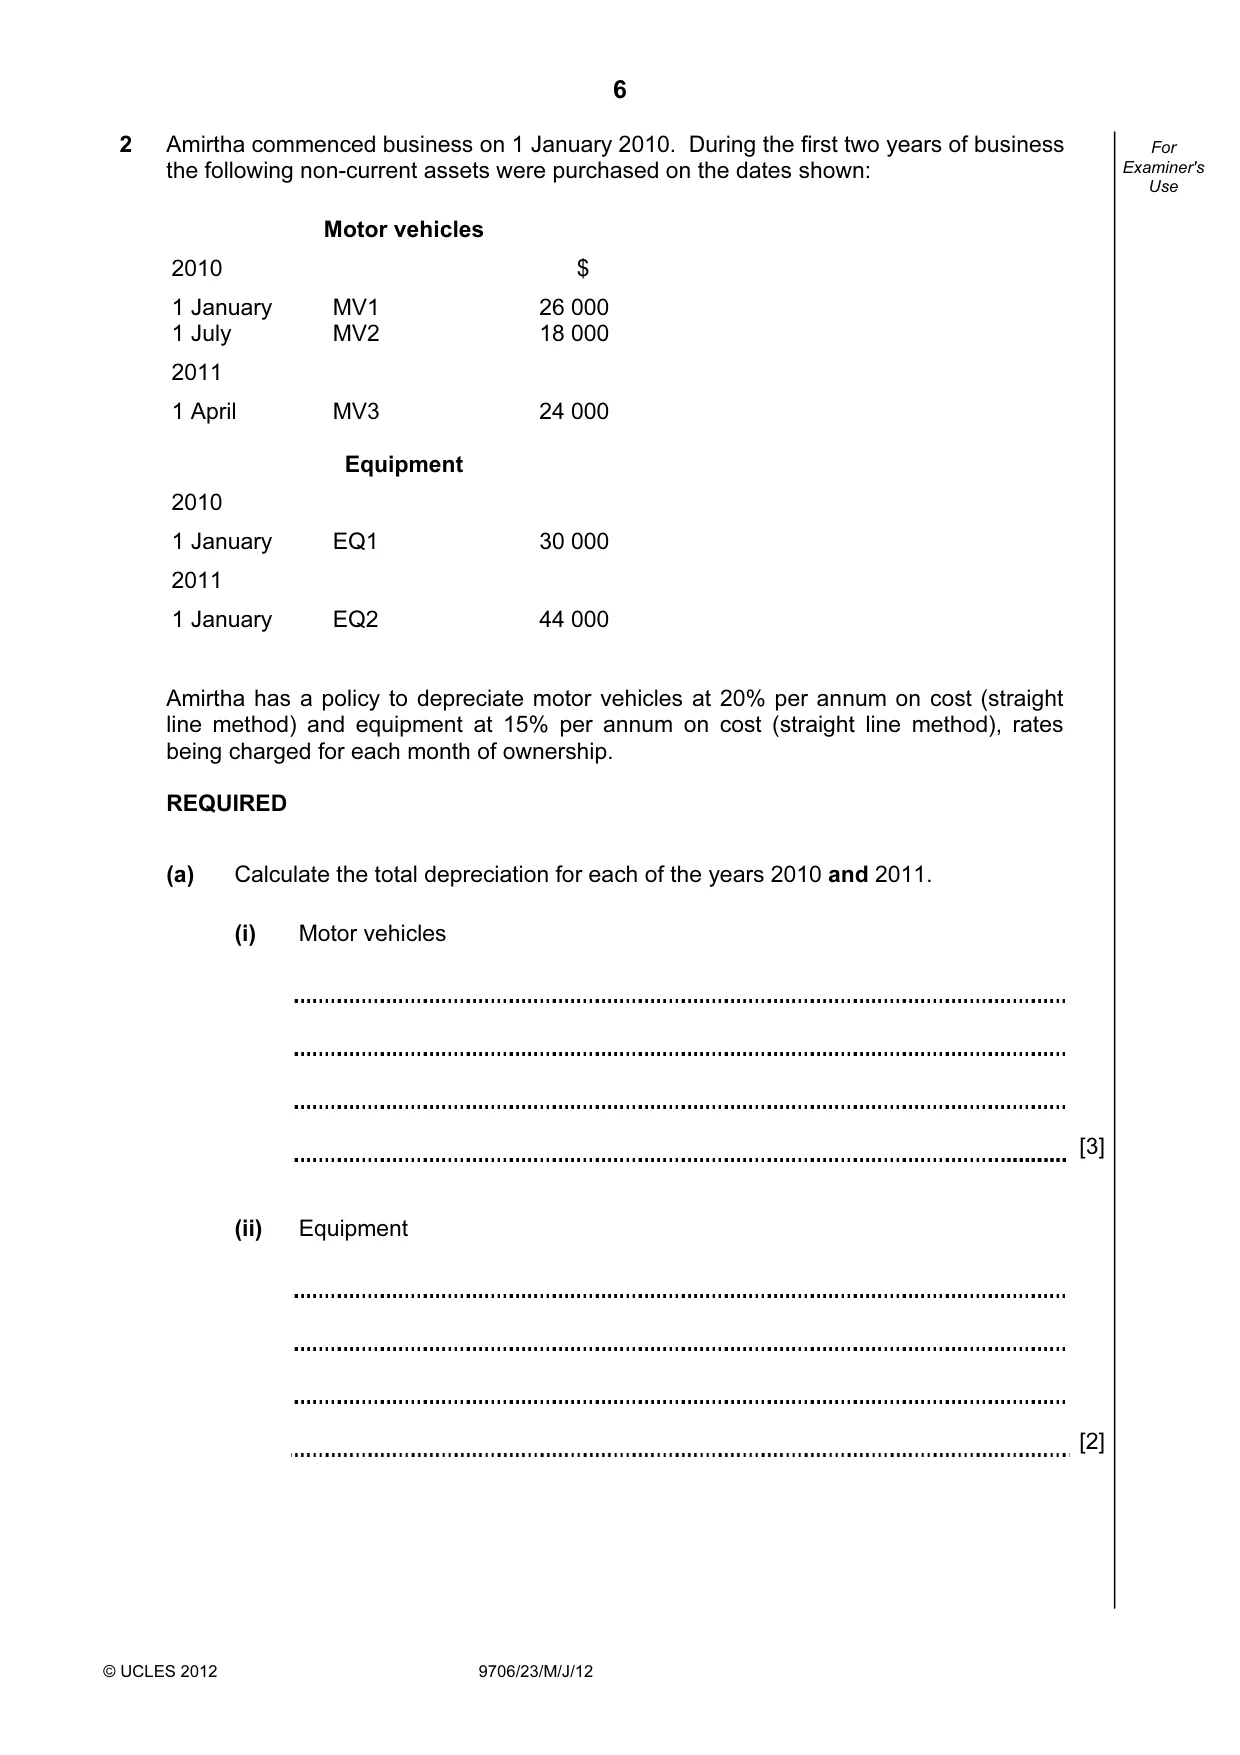
6 © UCLES 2012 9706/23/M/J/12 For Examiner's Use 2 Amirtha commenced business on 1 January 2010. During the first two years of business the following non-current assets were purchased on the dates shown: Motor vehicles 2010 $ 1 January MV1 26 000 1 July MV2 18 000 2011 1 April MV3 24 000 Equipment 2010 1 January EQ1 30 000 2011 1 January EQ2 44 000 Amirtha has a policy to depreciate motor vehicles at 20% per annum on cost (straight line method) and equipment at 15% per annum on cost (straight line method), rates being charged for each month of ownership. REQUIRED (a) Calculate the total depreciation for each of the years 2010 and 2011. (i) Motor vehicles [3] (ii) Equipment [2]
Question paper, page 7
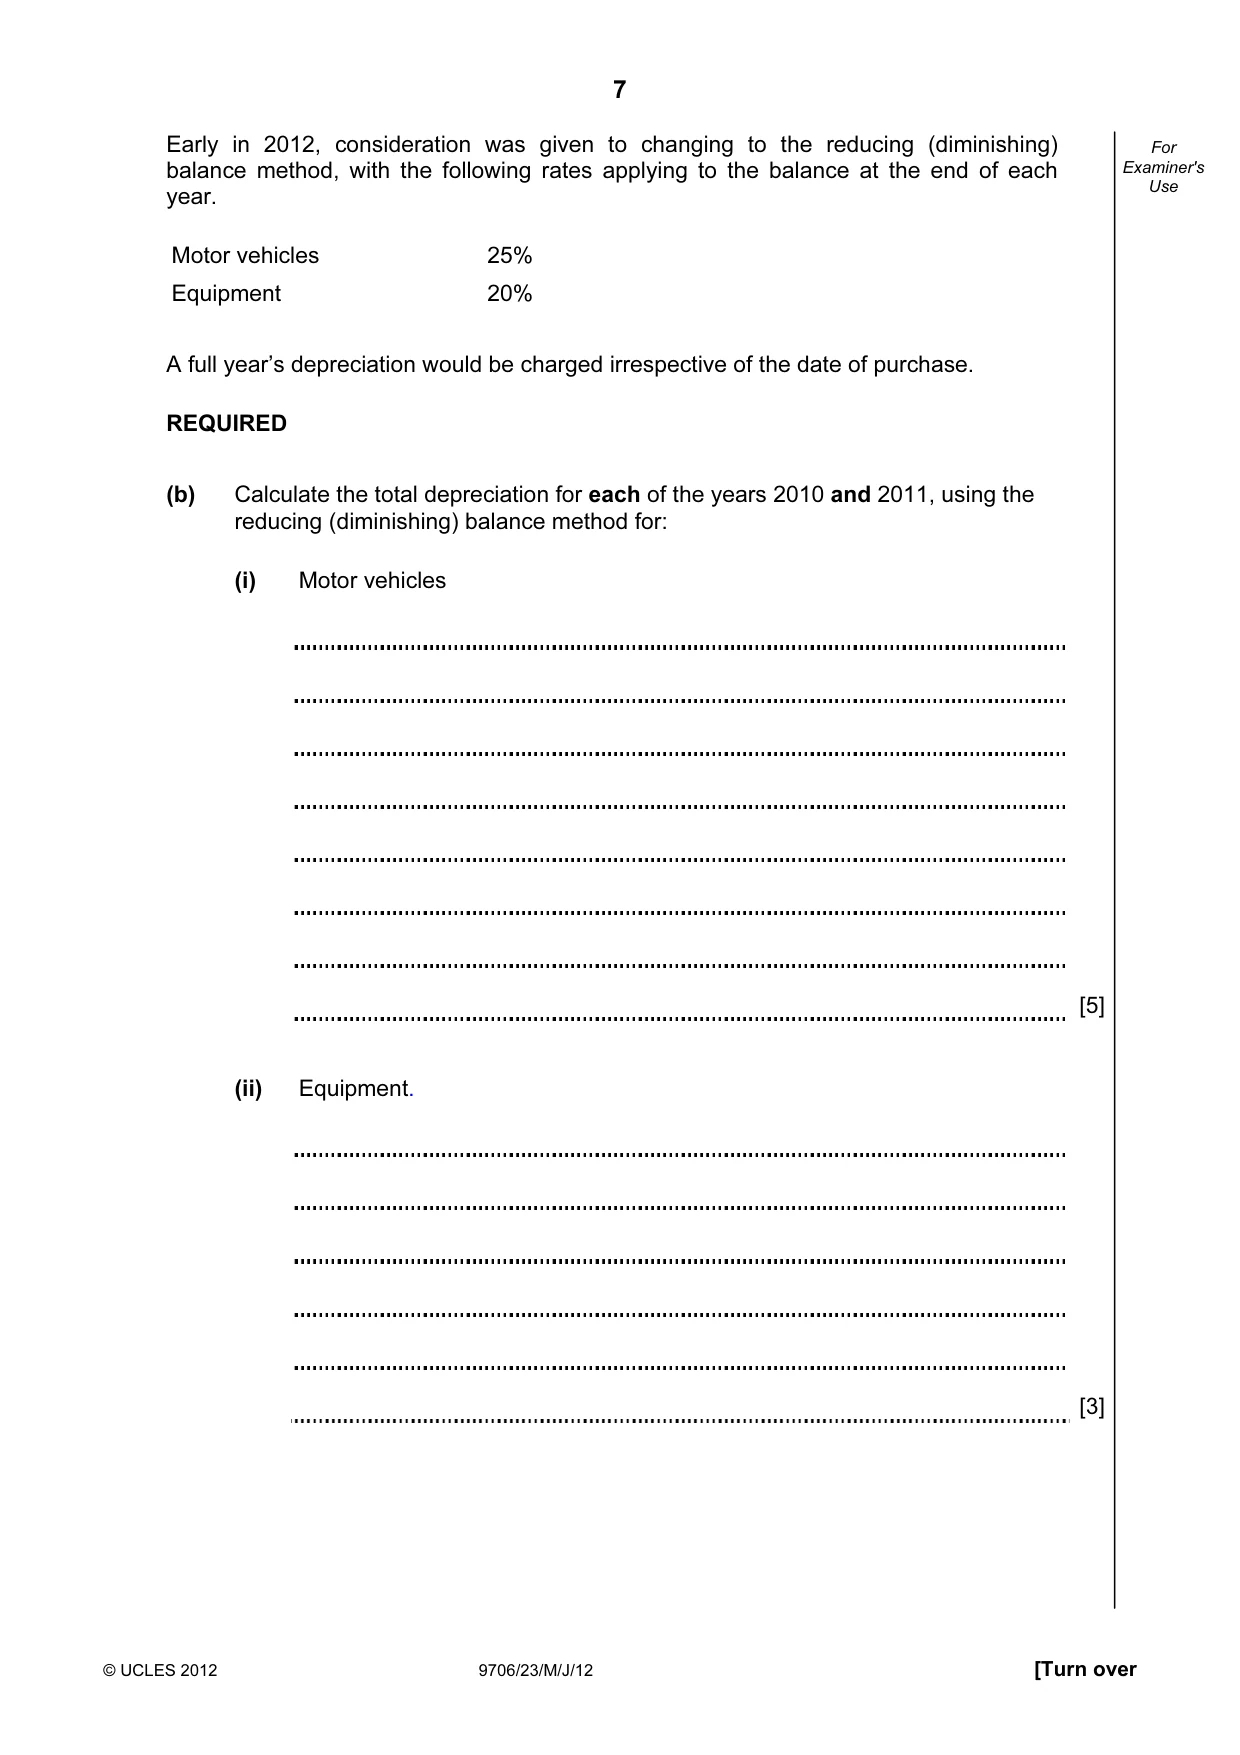
7 © UCLES 2012 9706/23/M/J/12 [Turn over For Examiner's Use Early in 2012, consideration was given to changing to the reducing (diminishing) balance method, with the following rates applying to the balance at the end of each year. Motor vehicles 25% Equipment 20% A full year’s depreciation would be charged irrespective of the date of purchase. REQUIRED (b) Calculate the total depreciation for each of the years 2010 and 2011, using the reducing (diminishing) balance method for: (i) Motor vehicles [5] (ii) Equipment. [3]
Question paper, page 8
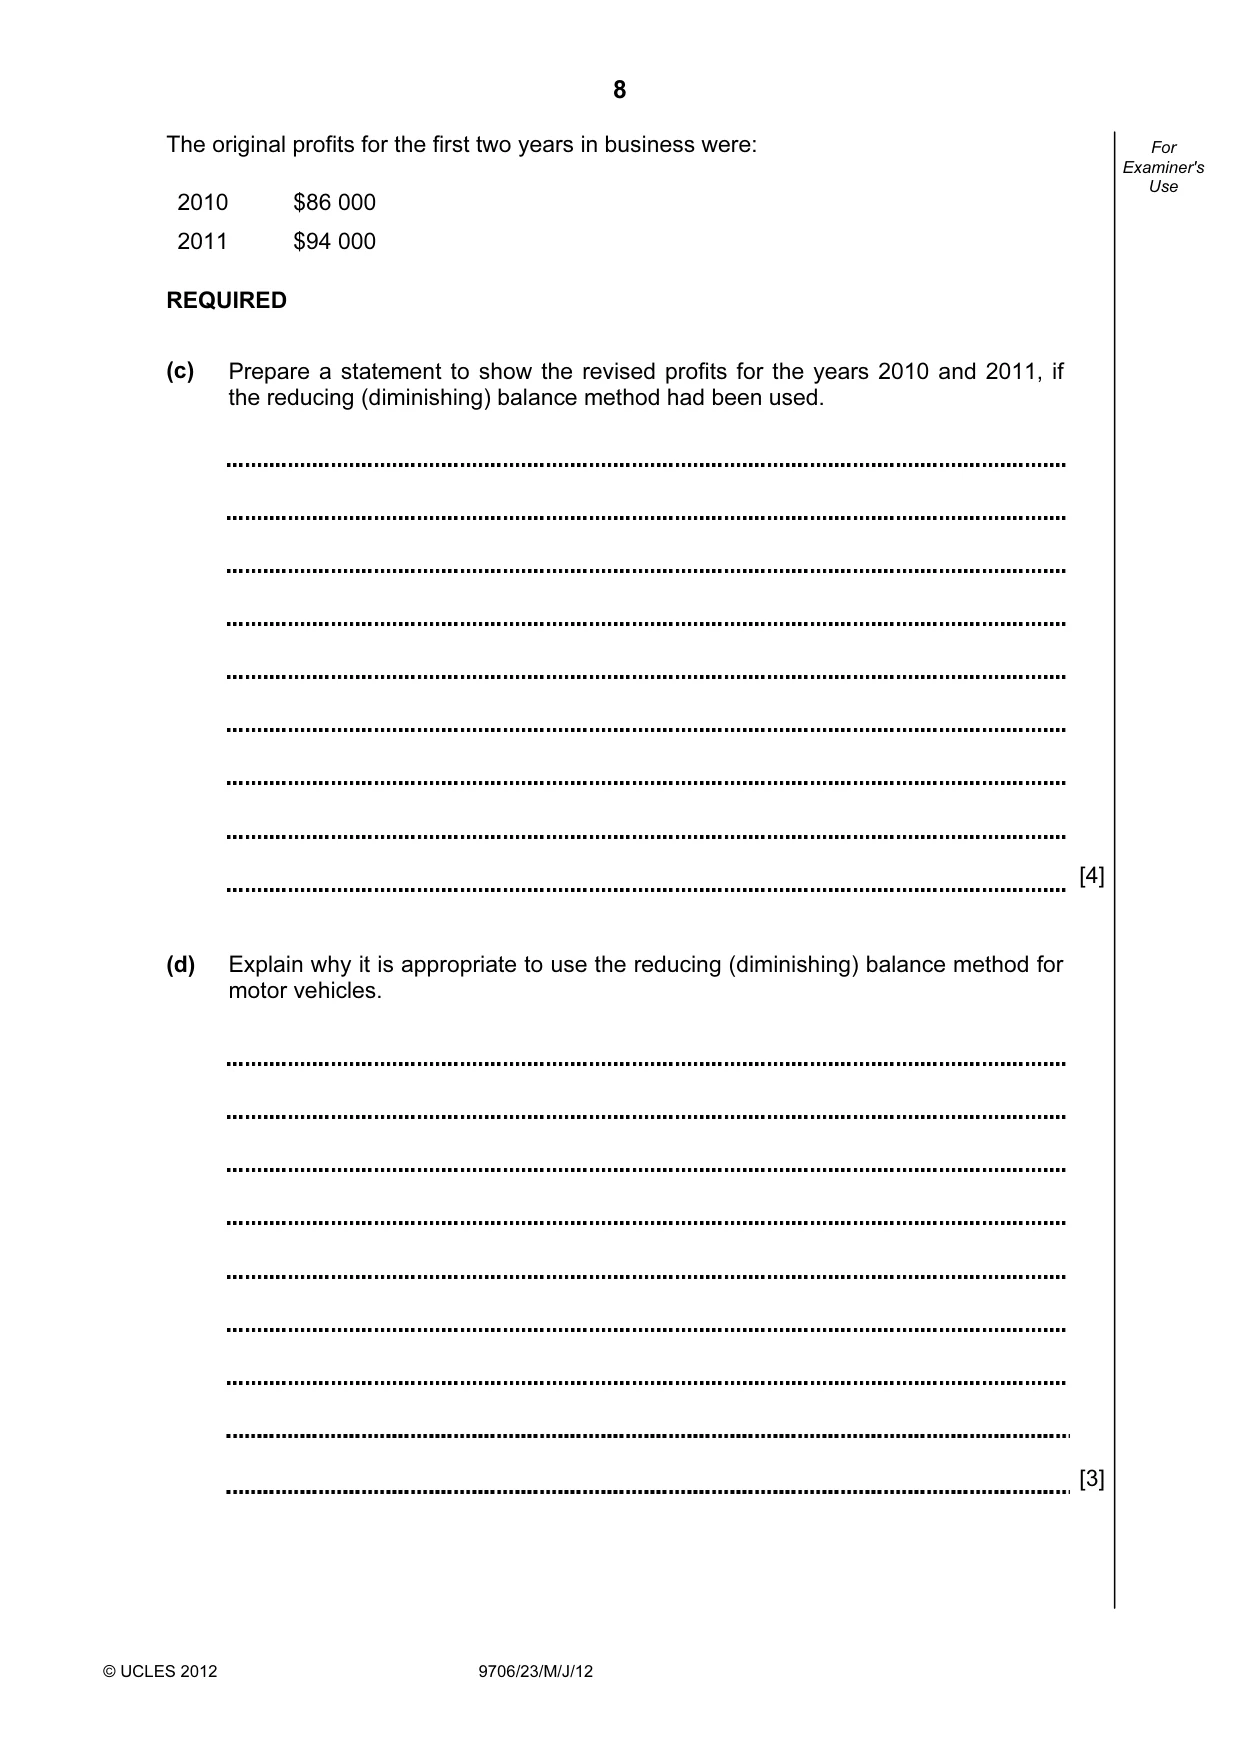
8 © UCLES 2012 9706/23/M/J/12 For Examiner's Use The original profits for the first two years in business were: 2010 $86 000 2011 $94 000 REQUIRED (c) Prepare a statement to show the revised profits for the years 2010 and 2011, if the reducing (diminishing) balance method had been used. [4] (d) Explain why it is appropriate to use the reducing (diminishing) balance method for motor vehicles. [3]
Question paper, page 9
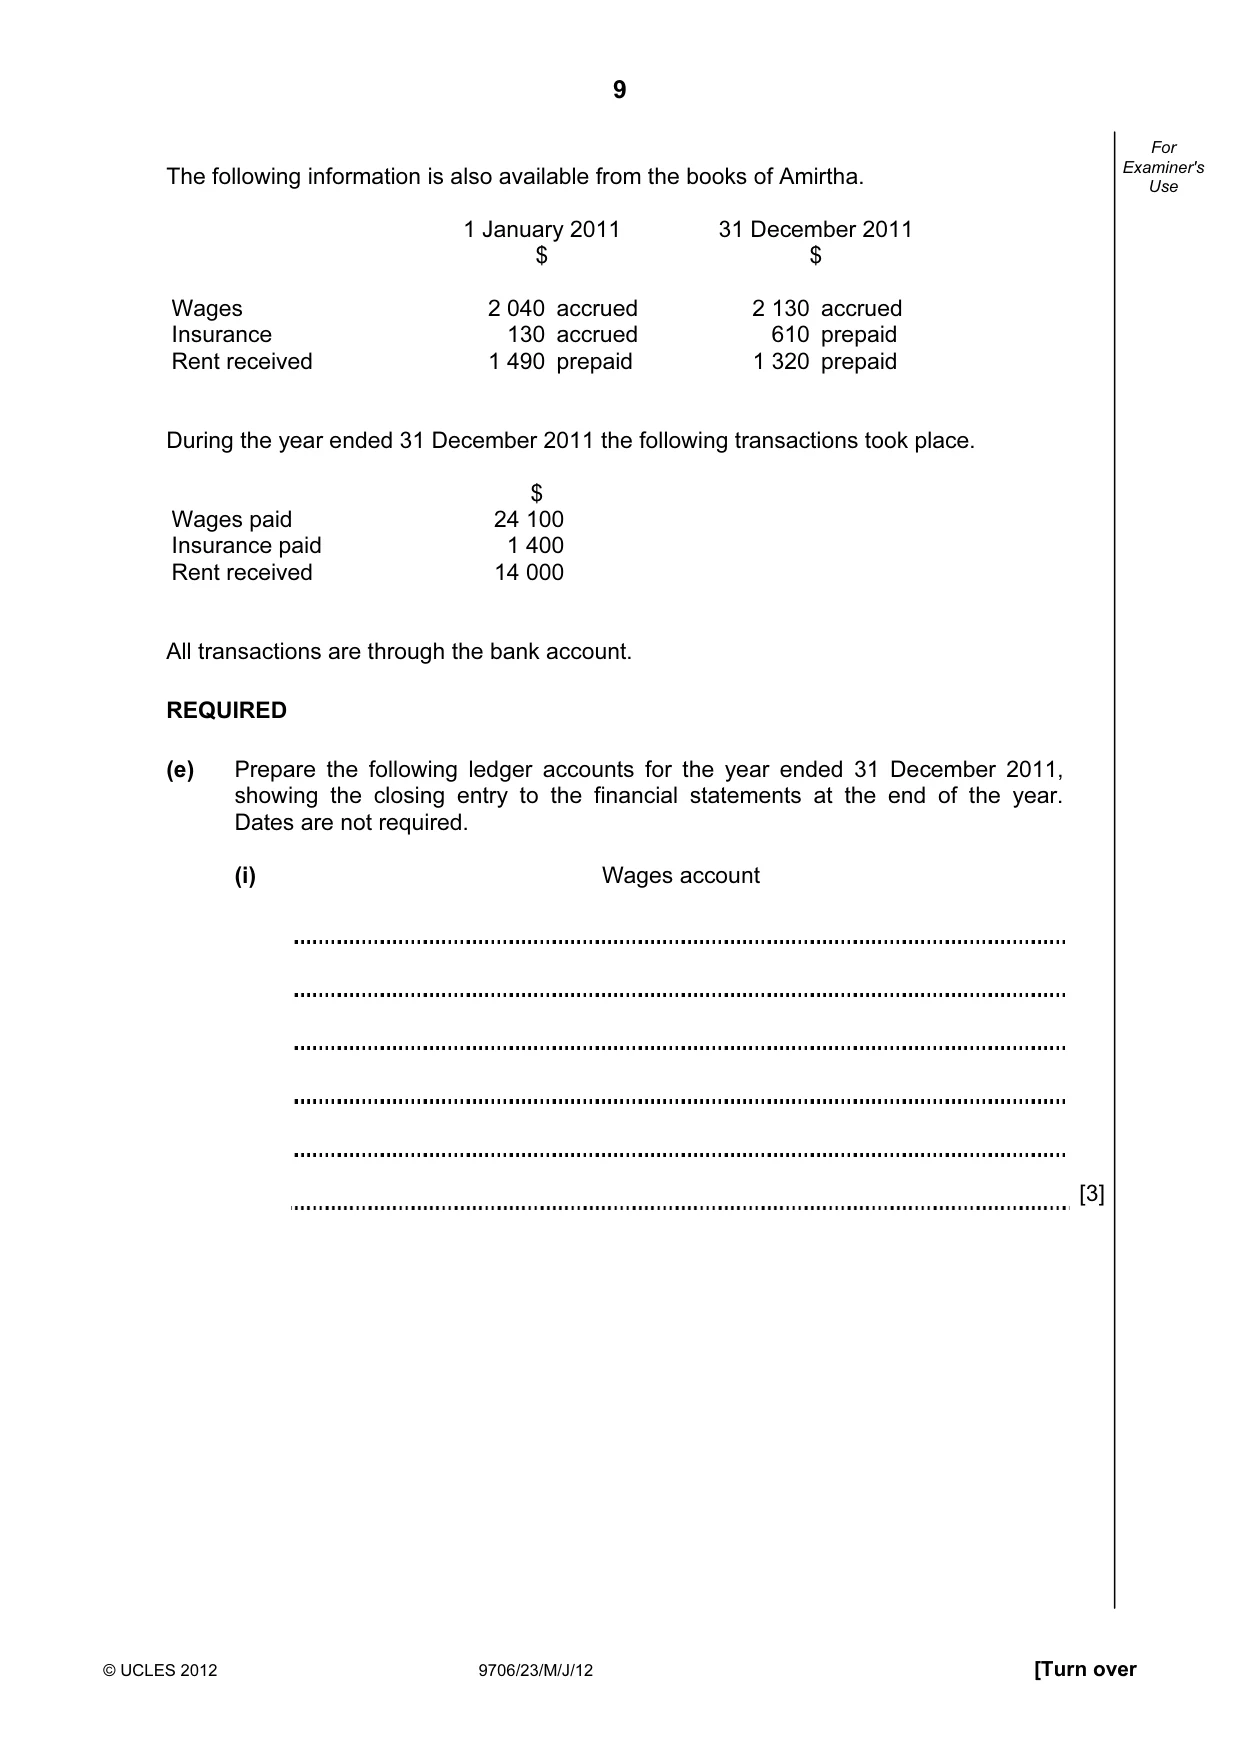
9 © UCLES 2012 9706/23/M/J/12 [Turn over For Examiner's Use The following information is also available from the books of Amirtha. 1 January 2011 31 December 2011 $ $ Wages 2 040 accrued 2 130 accrued Insurance 130 accrued 610 prepaid Rent received 1 490 prepaid 1 320 prepaid During the year ended 31 December 2011 the following transactions took place. $ Wages paid 24 100 Insurance paid 1 400 Rent received 14 000 All transactions are through the bank account. REQUIRED (e) Prepare the following ledger accounts for the year ended 31 December 2011, showing the closing entry to the financial statements at the end of the year. Dates are not required. (i) Wages account [3]
Question paper, page 10
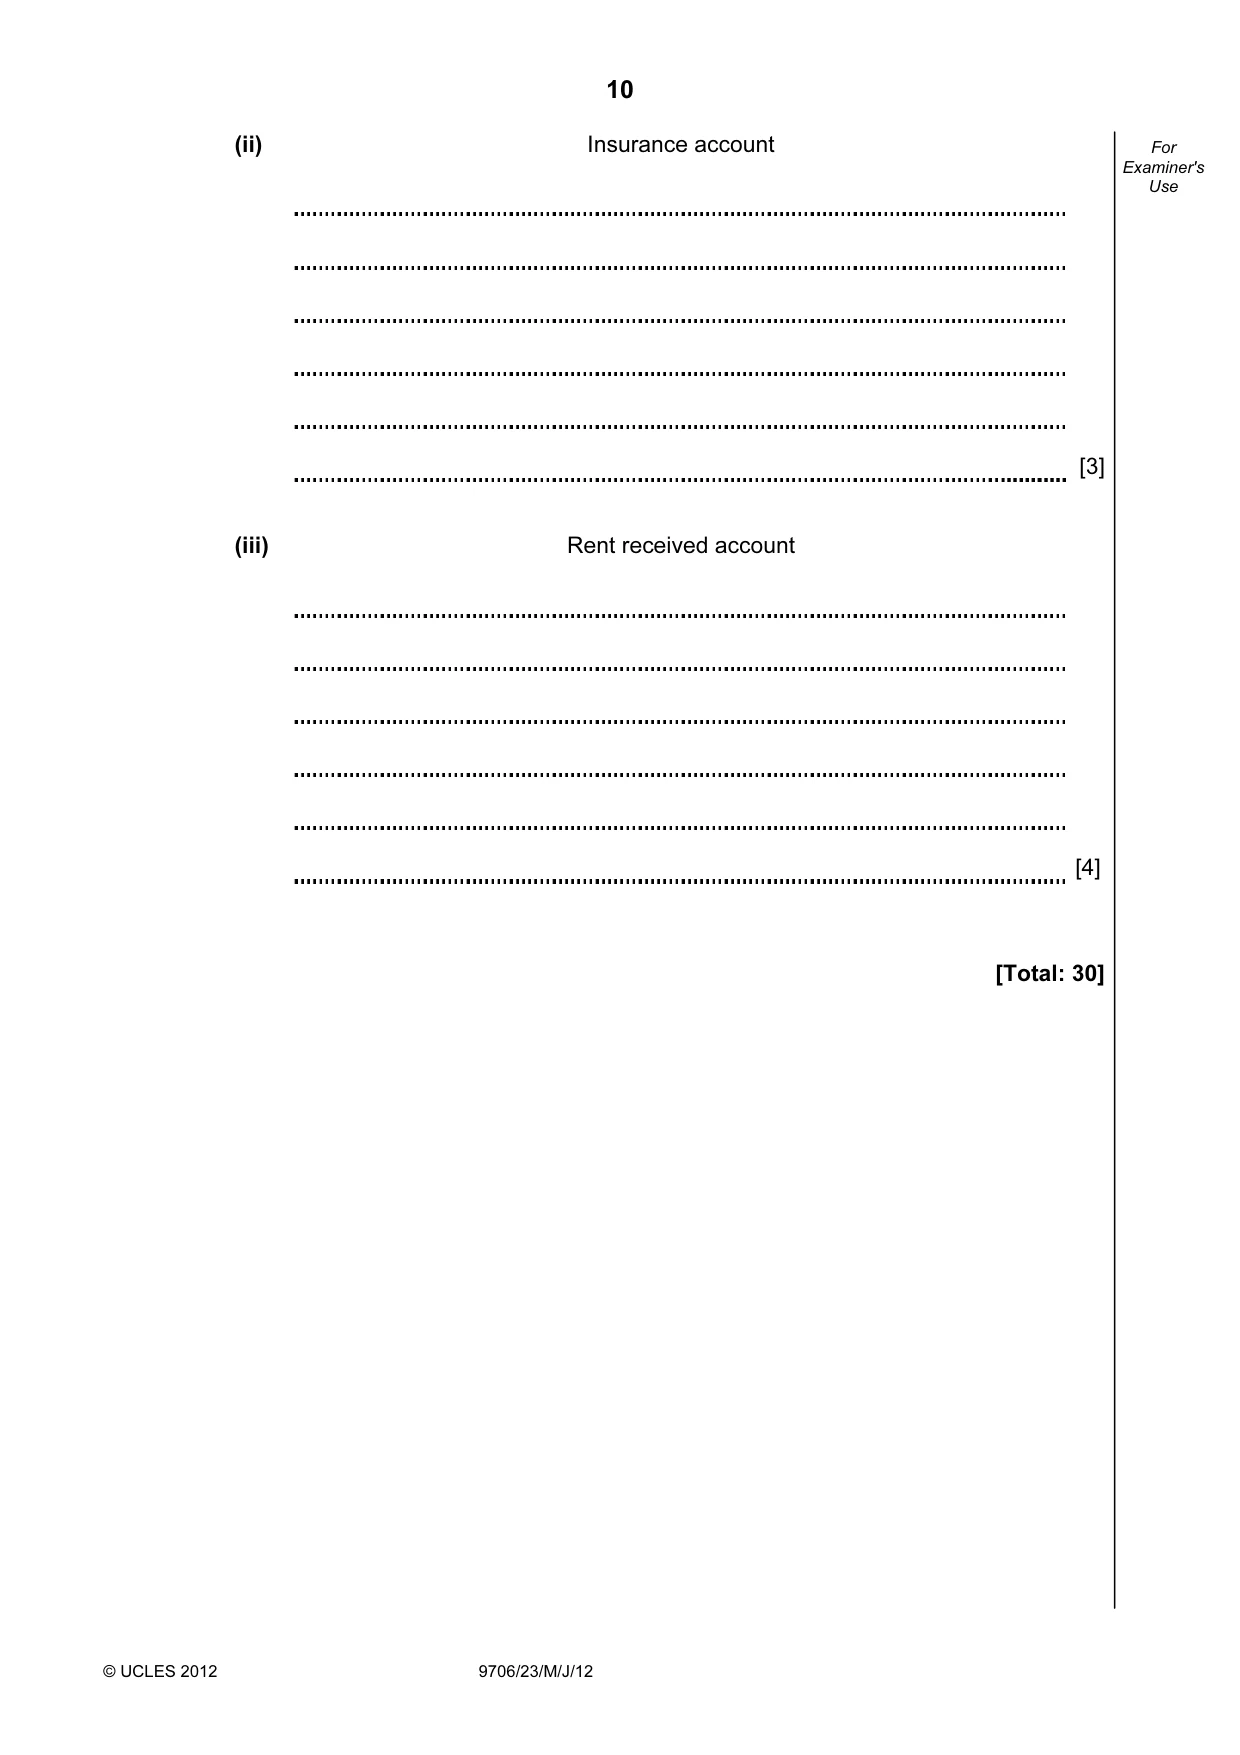
10 © UCLES 2012 9706/23/M/J/12 For Examiner's Use (ii) Insurance account [3] (iii) Rent received account [4] [Total: 30]
Question paper, page 11
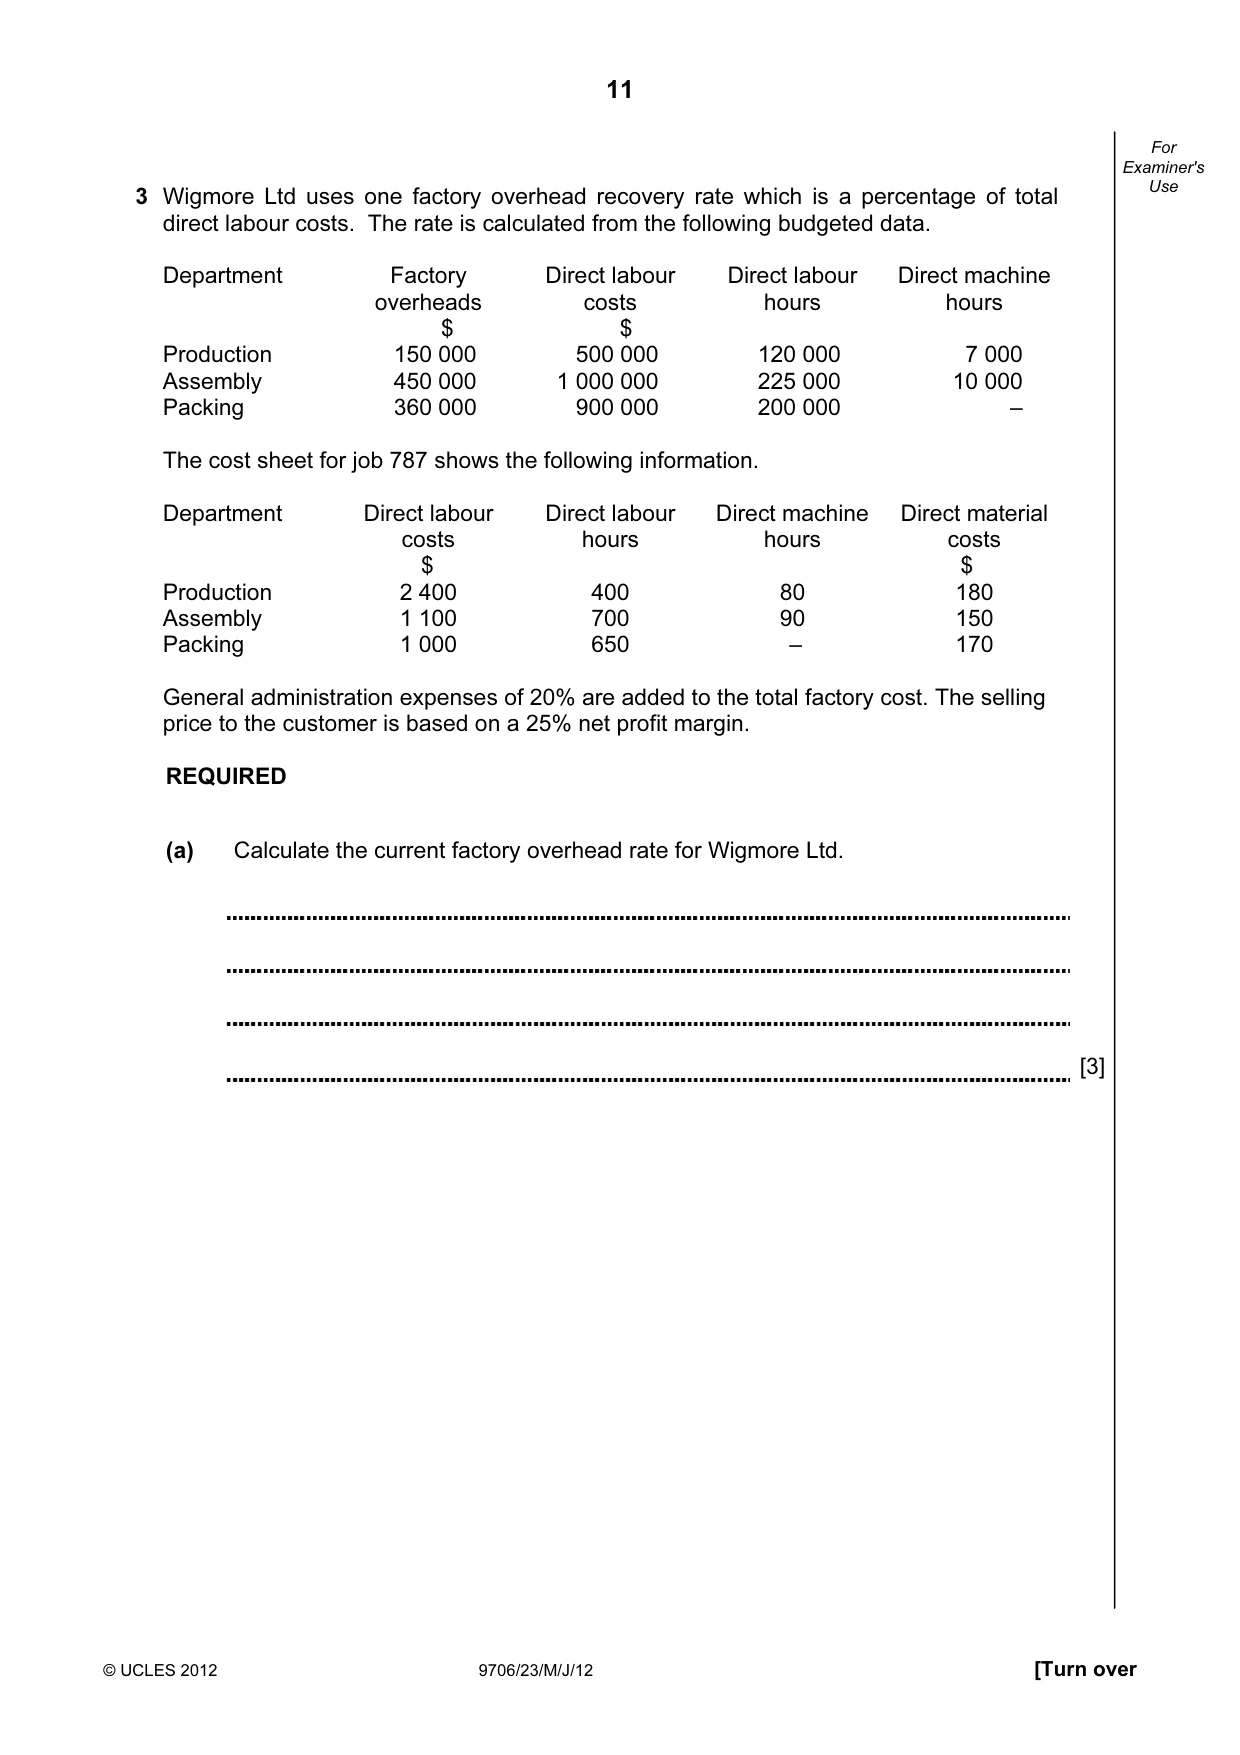
11 © UCLES 2012 9706/23/M/J/12 [Turn over For Examiner's Use 3 Wigmore Ltd uses one factory overhead recovery rate which is a percentage of total direct labour costs. The rate is calculated from the following budgeted data. Department Factory overheads Direct labour costs Direct labour hours Direct machine hours $ $ Production 150 000 500 000 120 000 7 000 Assembly 450 000 1 000 000 225 000 10 000 Packing 360 000 900 000 200 000 – The cost sheet for job 787 shows the following information. Department Direct labour costs Direct labour hours Direct machine hours Direct material costs $ $ Production 2 400 400 80 180 Assembly 1 100 700 90 150 Packing 1 000 650 – 170 General administration expenses of 20% are added to the total factory cost. The selling price to the customer is based on a 25% net profit margin. REQUIRED (a) Calculate the current factory overhead rate for Wigmore Ltd. [3]
Question paper, page 12
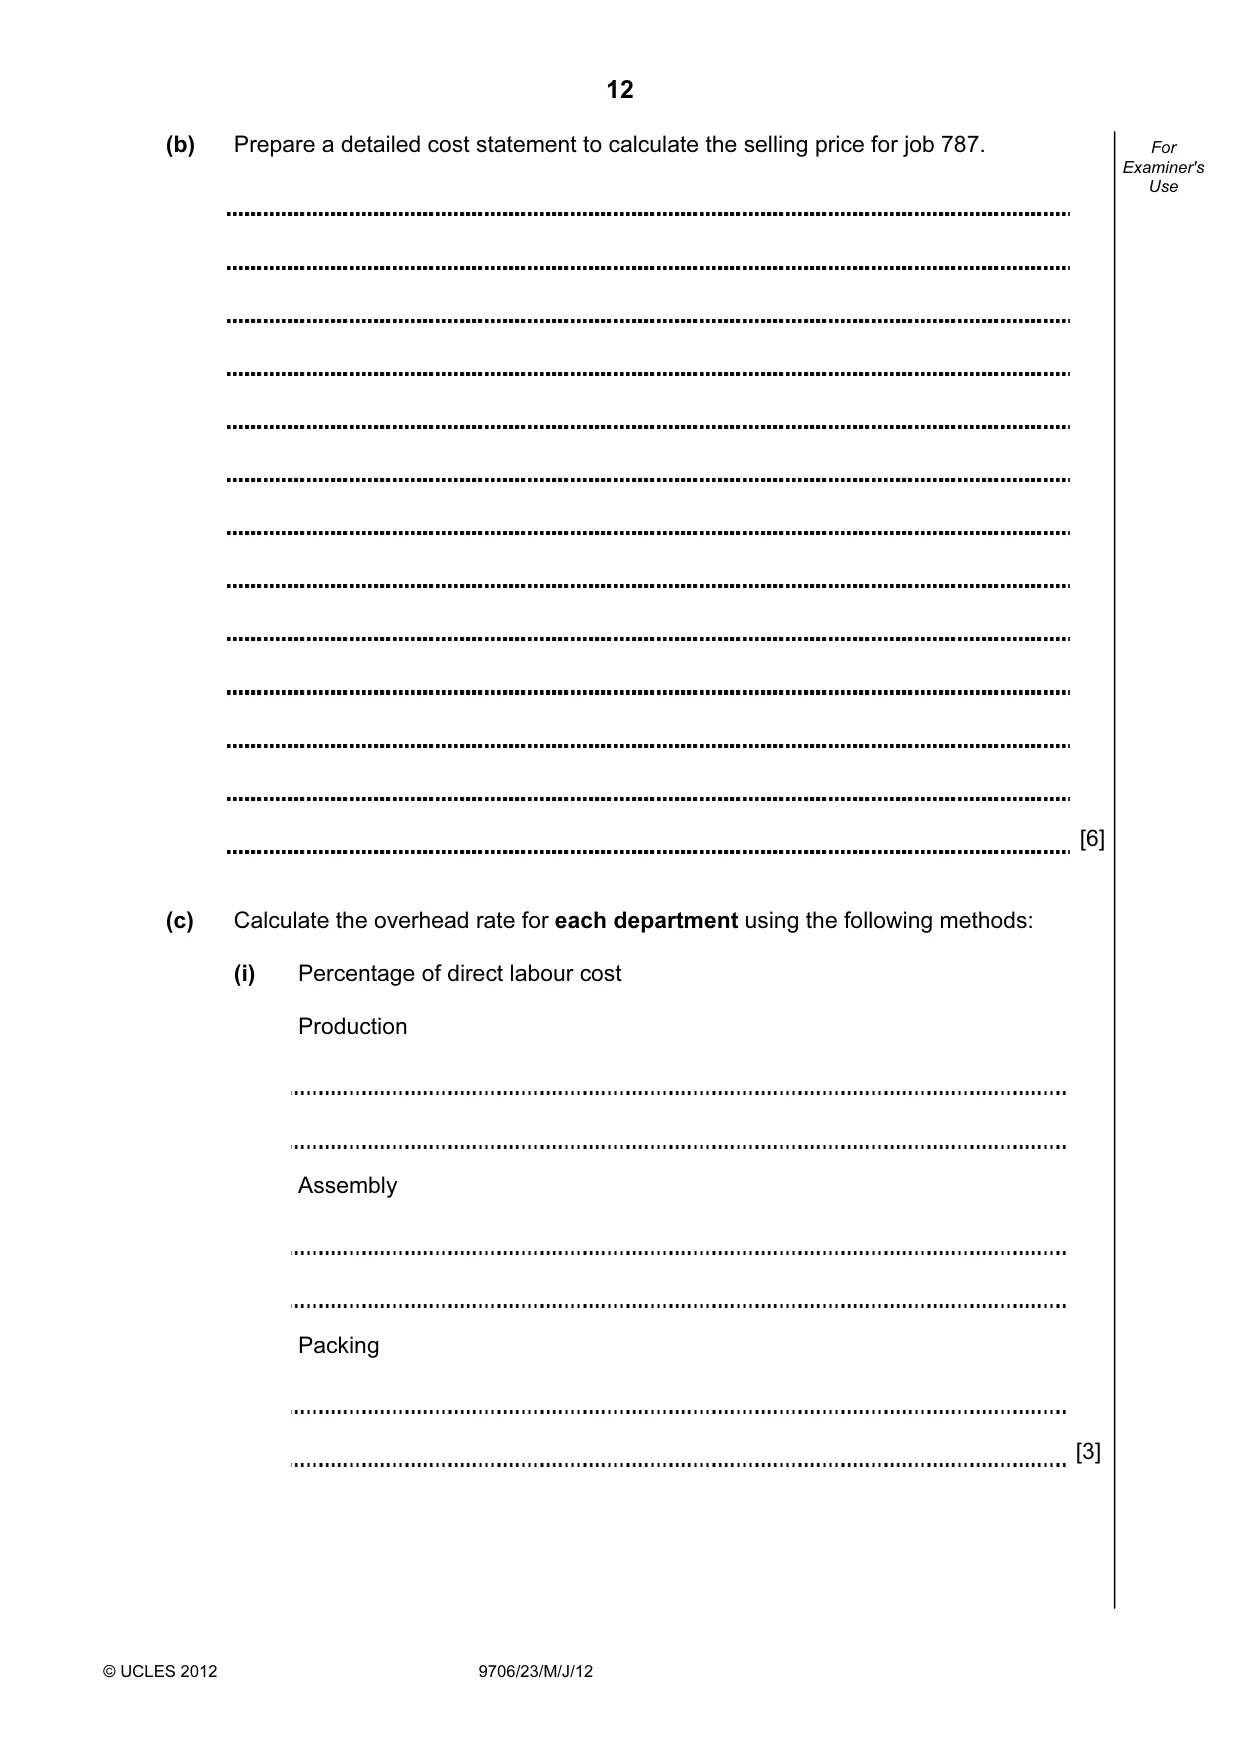
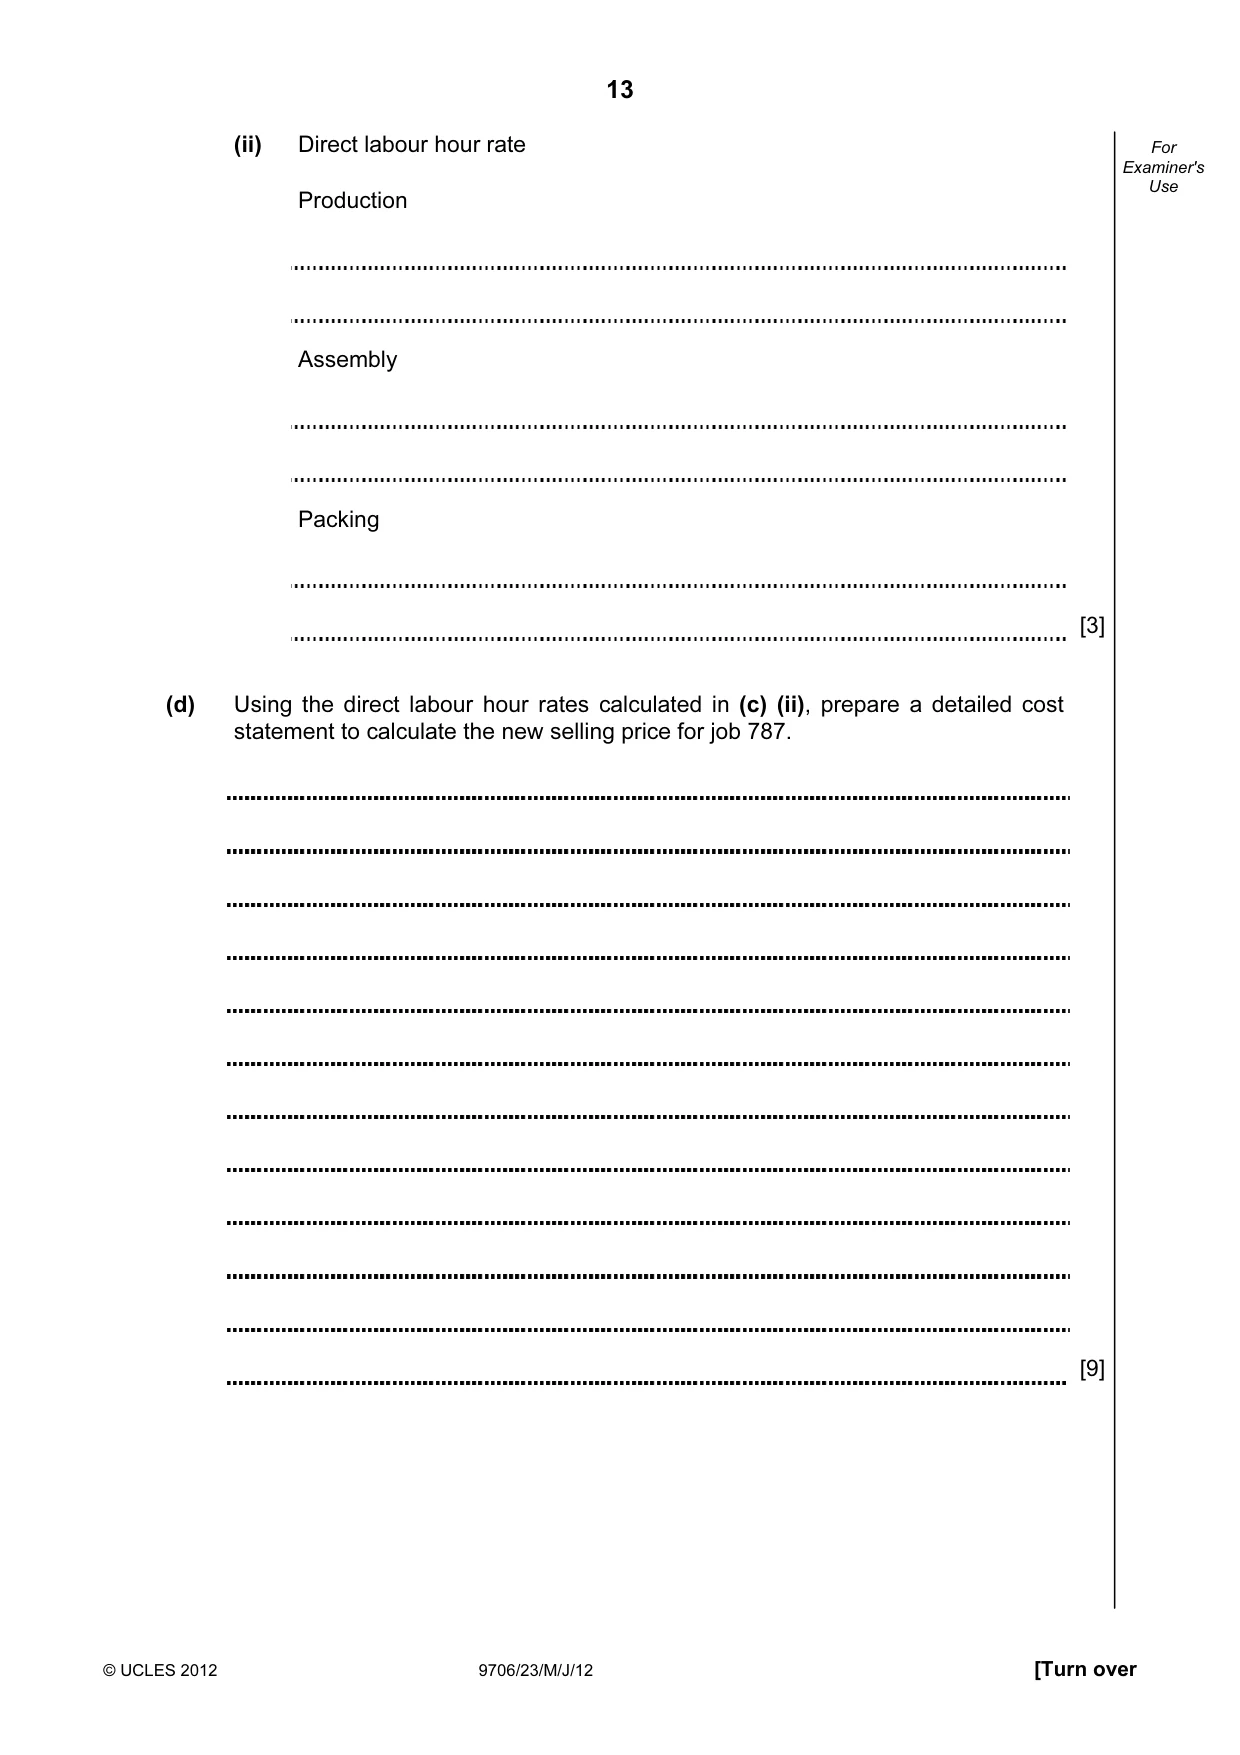
12 © UCLES 2012 9706/23/M/J/12 For Examiner's Use (b) Prepare a detailed cost statement to calculate the selling price for job 787. [6] (c) Calculate the overhead rate for each department using the following methods: (i) Percentage of direct labour cost Production Assembly Packing [3]
Question paper, page 13
13 © UCLES 2012 9706/23/M/J/12 [Turn over For Examiner's Use (ii) Direct labour hour rate Production Assembly Packing [3] (d) Using the direct labour hour rates calculated in (c) (ii), prepare a detailed cost statement to calculate the new selling price for job 787. [9]
Question paper, page 14
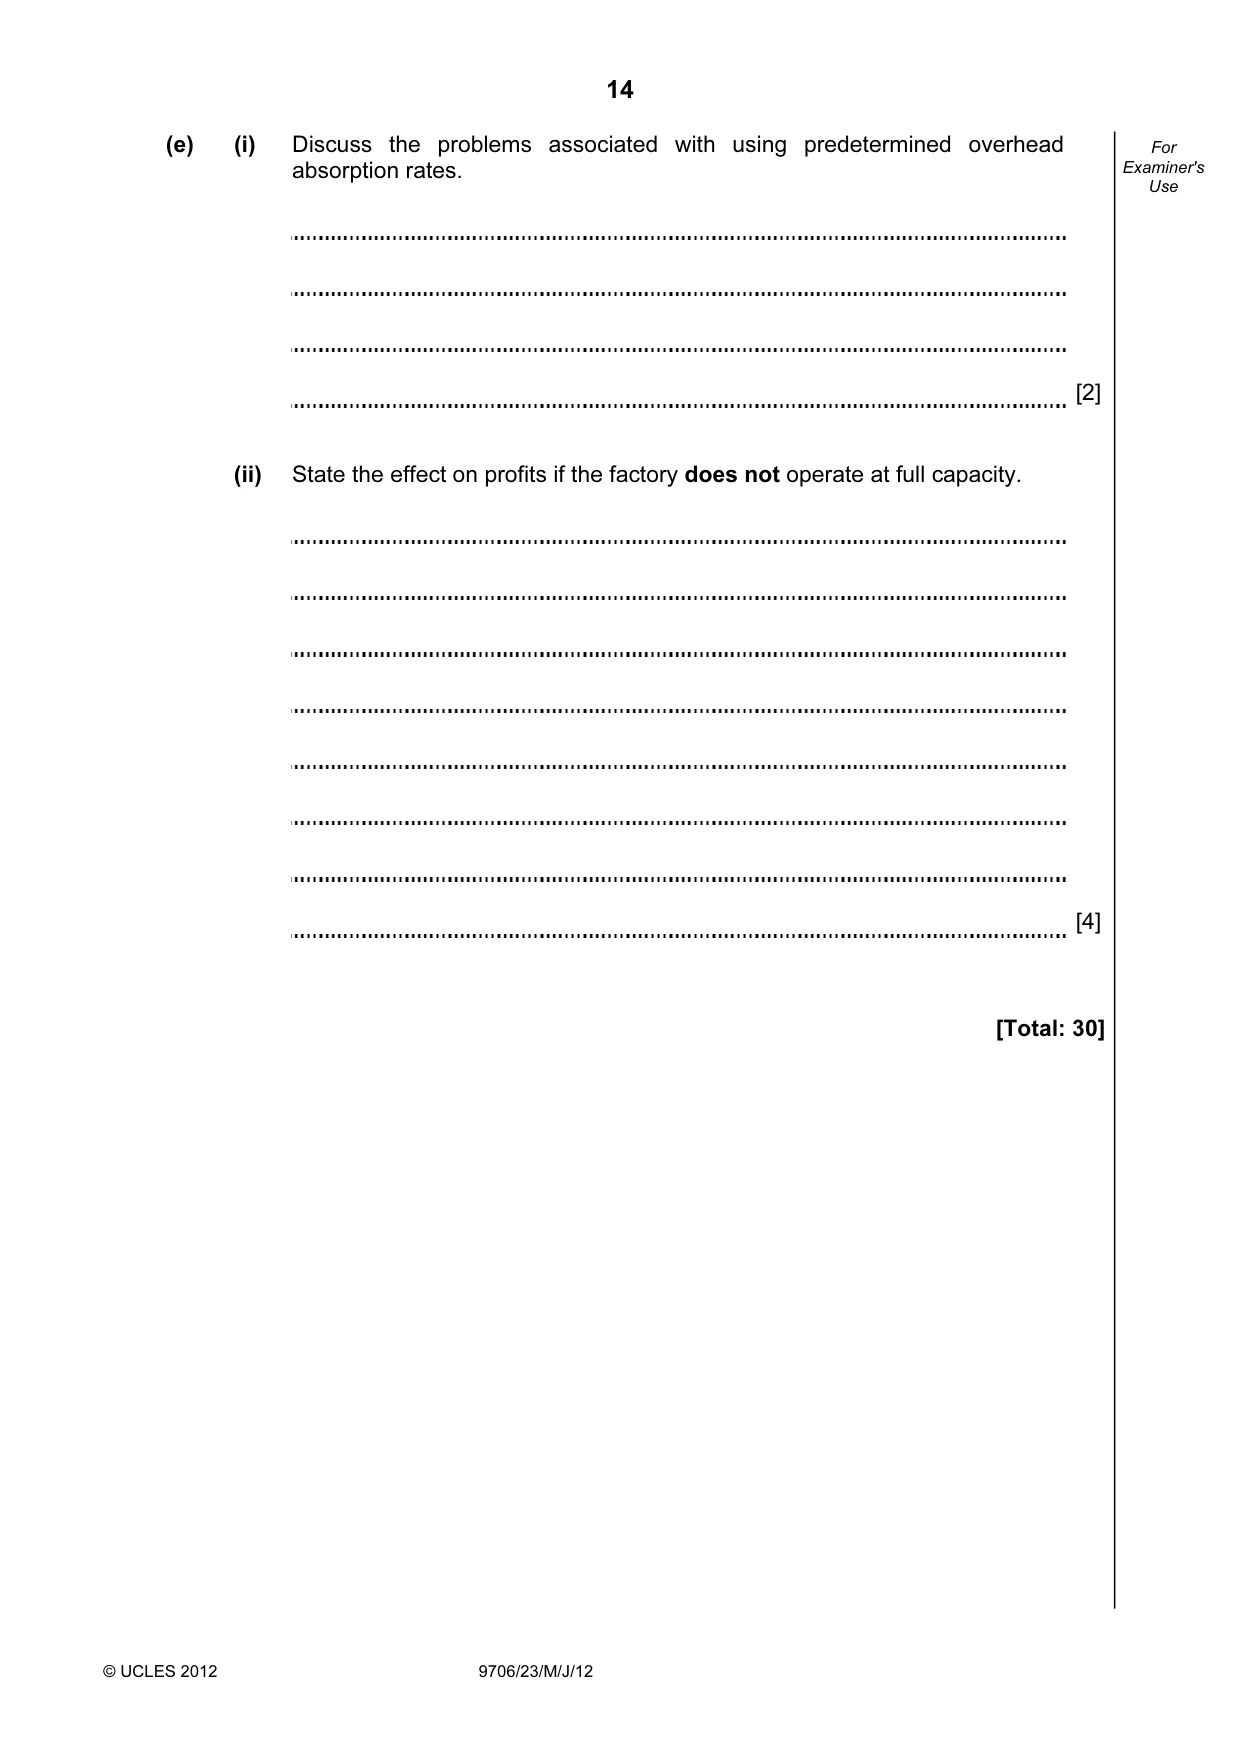
14 © UCLES 2012 9706/23/M/J/12 For Examiner's Use (e) (i) Discuss the problems associated with using predetermined overhead absorption rates. [2] (ii) State the effect on profits if the factory does not operate at full capacity. [4] [Total: 30]
Question paper, page 15
15 © UCLES 2012 9706/23/M/J/12 BLANK PAGE
Question paper, page 16
16 Permission to reproduce items where third-party owned material protected by copyright is included has been sought and cleared where possible. Every reasonable effort has been made by the publisher (UCLES) to trace copyright holders, but if any items requiring clearance have unwittingly been included, the publisher will be pleased to make amends at the earliest possible opportunity. University of Cambridge International Examinations is part of the Cambridge Assessment Group. Cambridge Assessment is the brand name of University of Cambridge Local Examinations Syndicate (UCLES), which is itself a department of the University of Cambridge. © UCLES 2012 9706/23/M/J/12 BLANK PAGE
Mark scheme, page 1
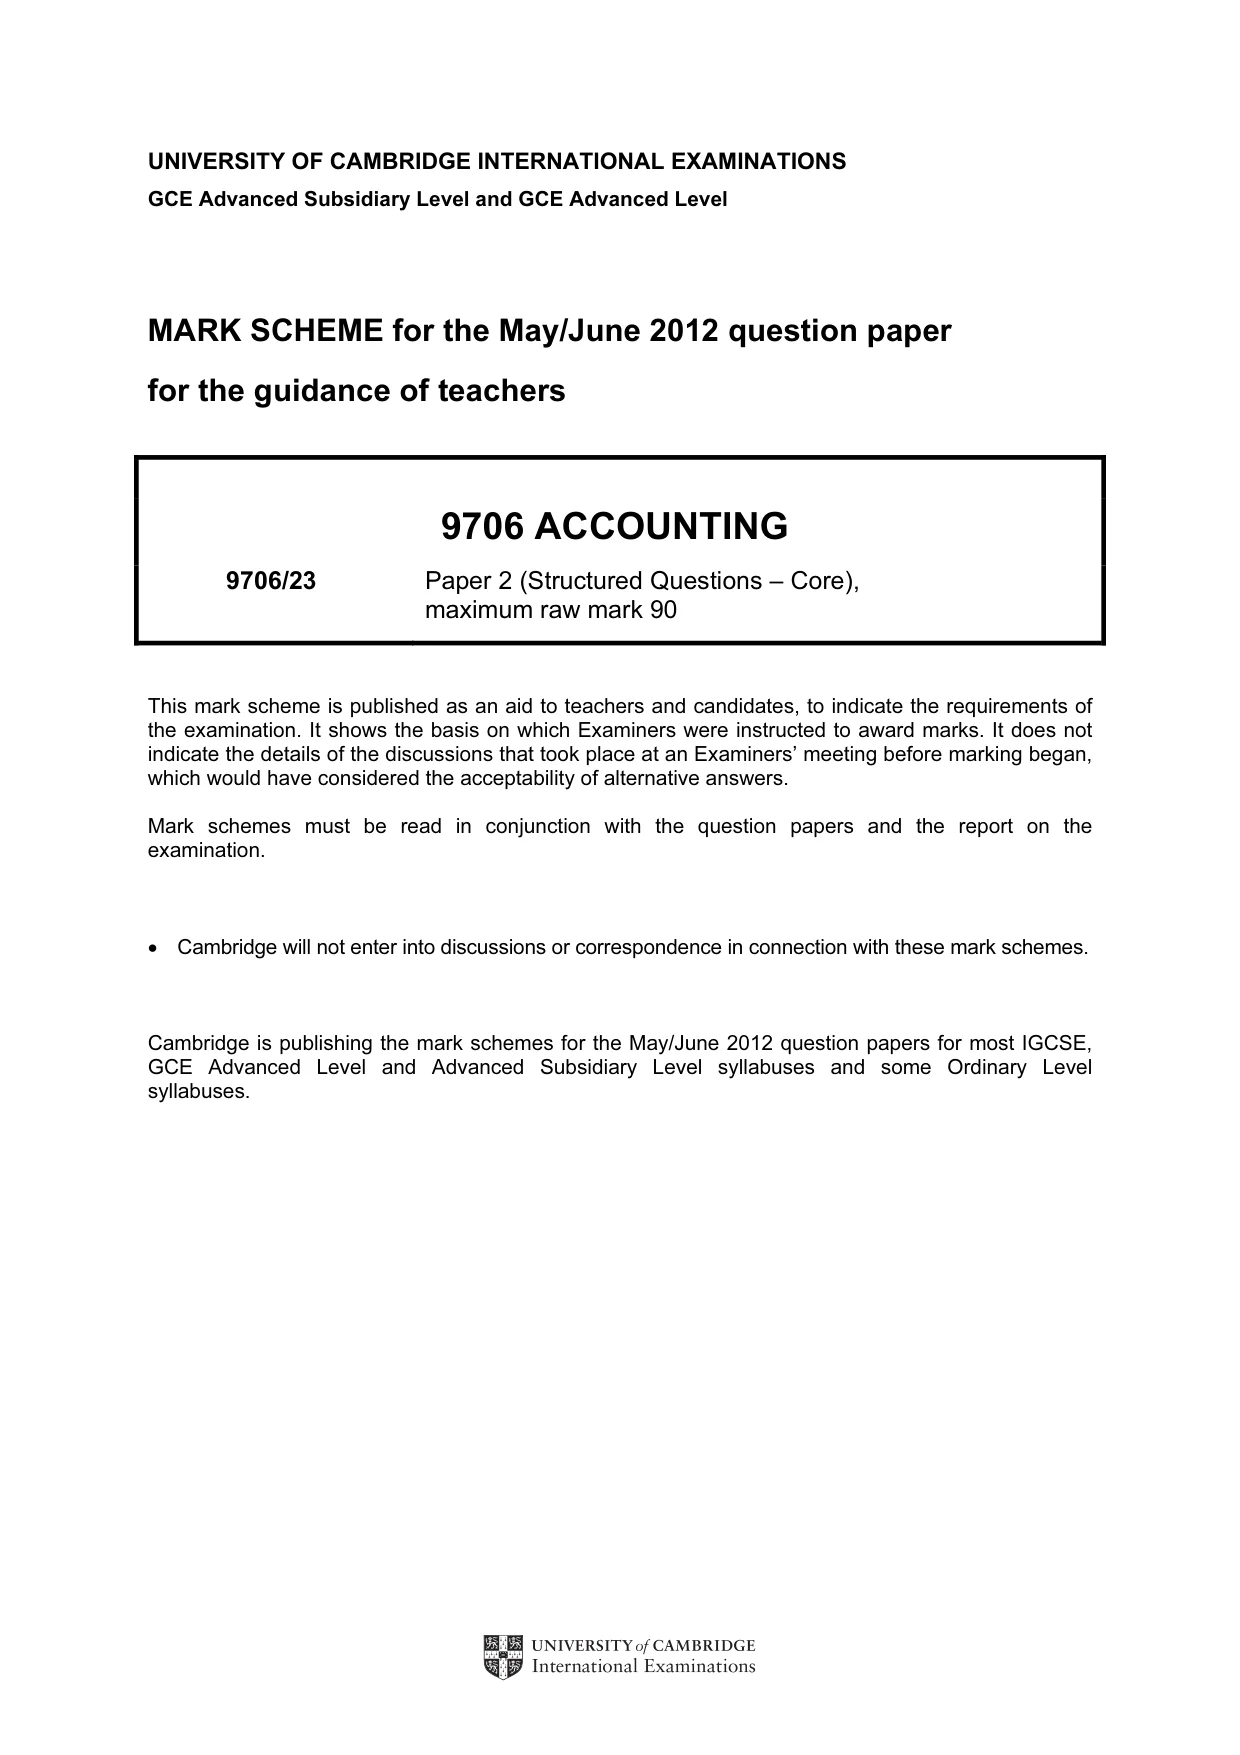
UNIVERSITY OF CAMBRIDGE INTERNATIONAL EXAMINATIONS GCE Advanced Subsidiary Level and GCE Advanced Level MARK SCHEME for the May/June 2012 question paper for the guidance of teachers 9706 ACCOUNTING 9706/23 Paper 2 (Structured Questions – Core), maximum raw mark 90 This mark scheme is published as an aid to teachers and candidates, to indicate the requirements of the examination. It shows the basis on which Examiners were instructed to award marks. It does not indicate the details of the discussions that took place at an Examiners’ meeting before marking began, which would have considered the acceptability of alternative answers. Mark schemes must be read in conjunction with the question papers and the report on the examination. • Cambridge will not enter into discussions or correspondence in connection with these mark schemes. Cambridge is publishing the mark schemes for the May/June 2012 question papers for most IGCSE, GCE Advanced Level and Advanced Subsidiary Level syllabuses and some Ordinary Level syllabuses.
Mark scheme, page 2
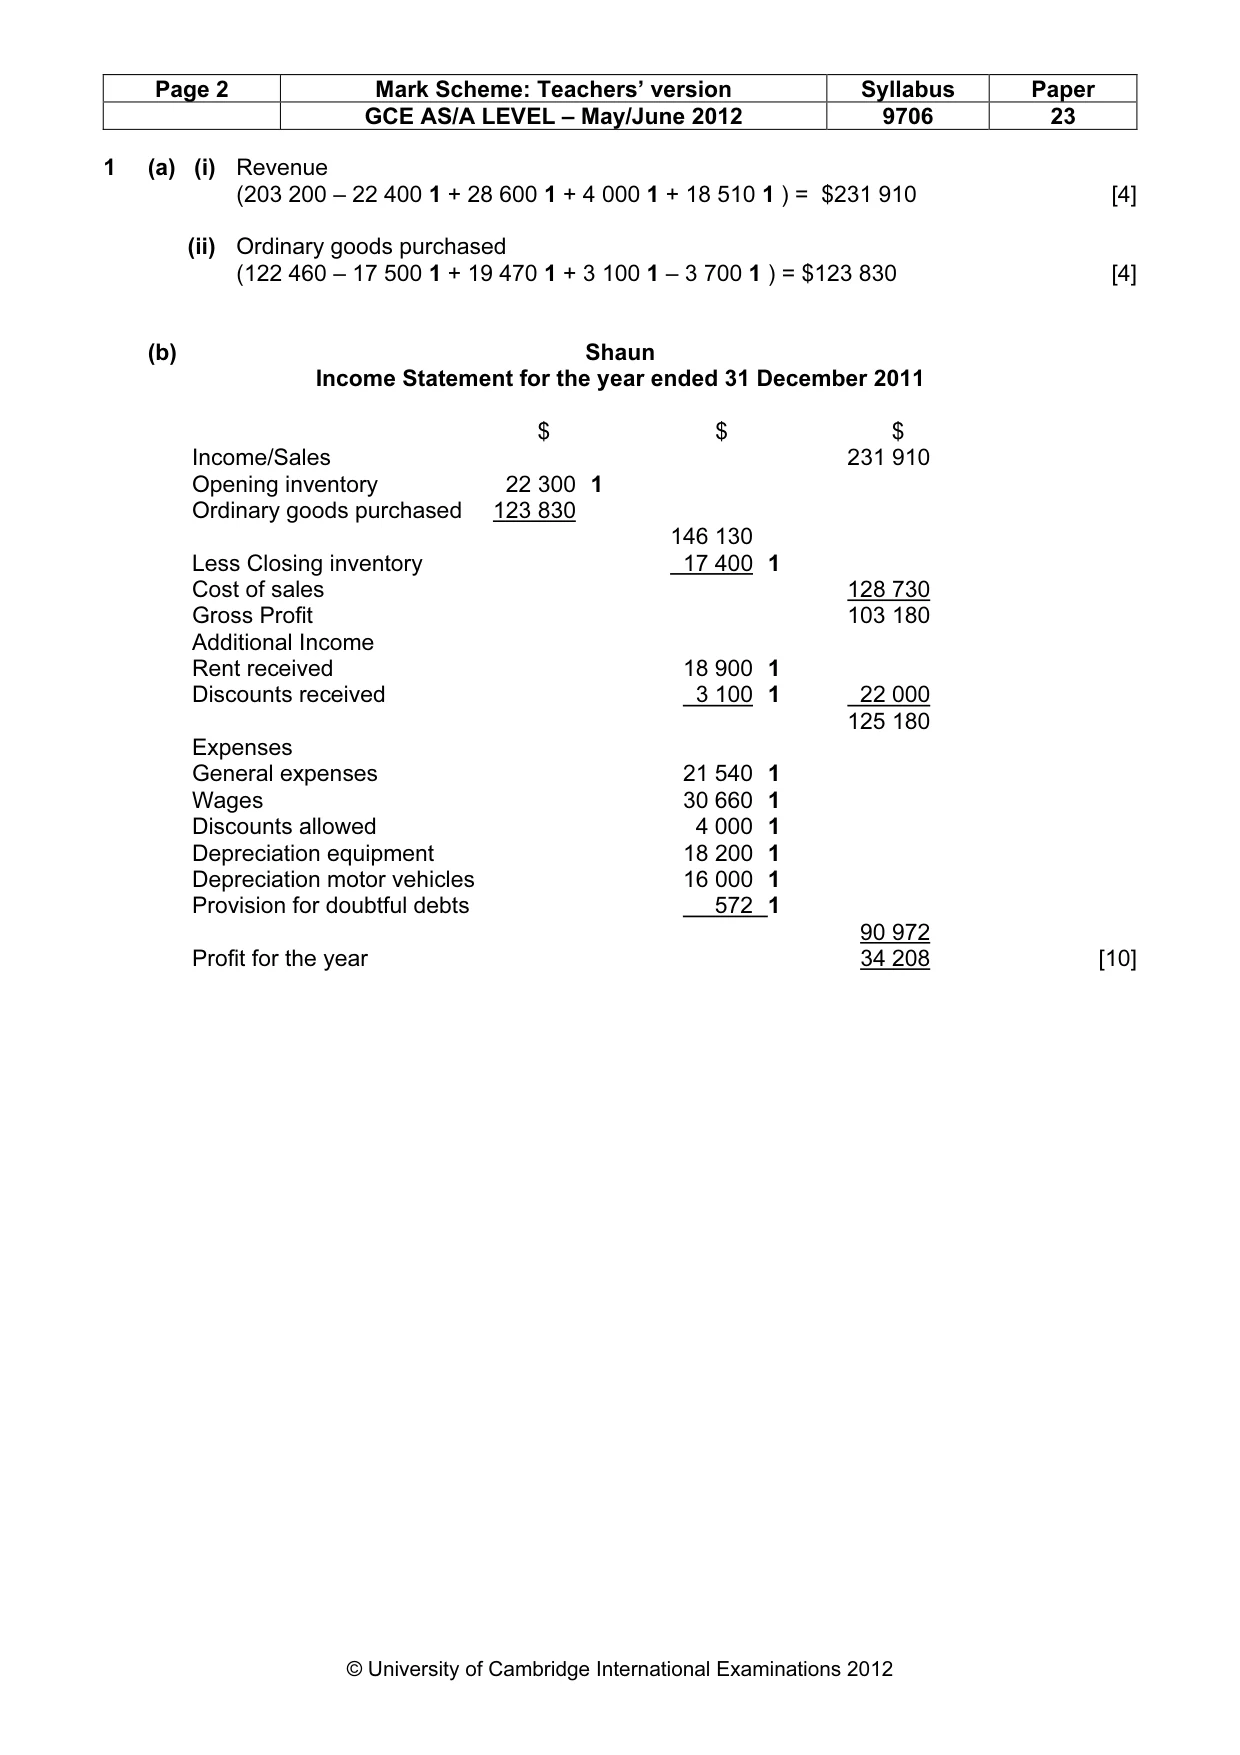
Page 2 Mark Scheme: Teachers’ version Syllabus Paper GCE AS/A LEVEL – May/June 2012 9706 23 © University of Cambridge International Examinations 2012 1 (a) (i) Revenue (203 200 – 22 400 1 + 28 600 1 + 4 000 1 + 18 510 1 ) = $231 910 [4] (ii) Ordinary goods purchased (122 460 – 17 500 1 + 19 470 1 + 3 100 1 – 3 700 1 ) = $123 830 [4] (b) Shaun Income Statement for the year ended 31 December 2011 $ $ $ Income/Sales 231 910 Opening inventory 22 300 1 Ordinary goods purchased 123 830 146 130 Less Closing inventory 17 400 1 Cost of sales 128 730 Gross Profit 103 180 Additional Income Rent received 18 900 1 Discounts received 3 100 1 22 000 125 180 Expenses General expenses 21 540 1 Wages 30 660 1 Discounts allowed 4 000 1 Depreciation equipment 18 200 1 Depreciation motor vehicles 16 000 1 Provision for doubtful debts 572 1 90 972 Profit for the year 34 208 [10]
Mark scheme, page 3
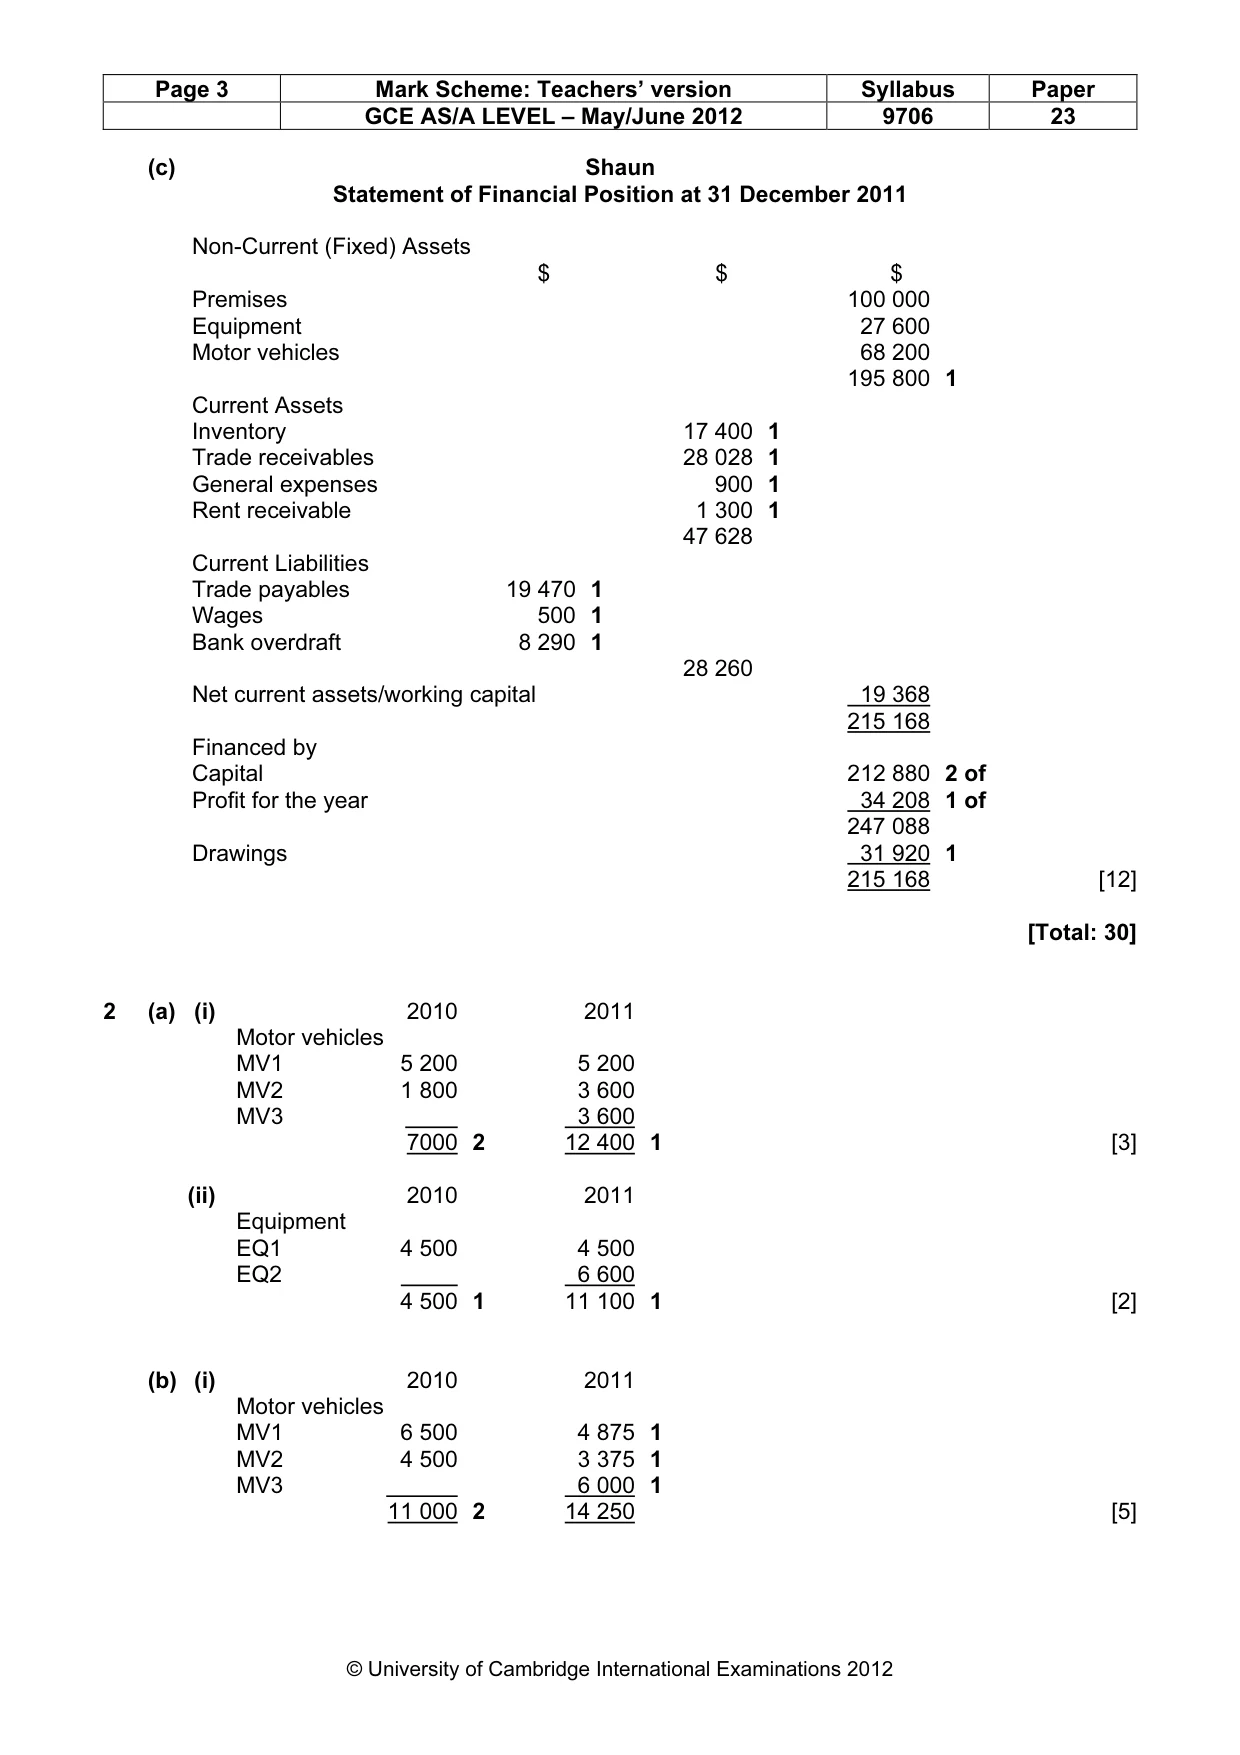
Page 3 Mark Scheme: Teachers’ version Syllabus Paper GCE AS/A LEVEL – May/June 2012 9706 23 © University of Cambridge International Examinations 2012 (c) Shaun Statement of Financial Position at 31 December 2011 Non-Current (Fixed) Assets $ $ $ Premises 100 000 Equipment 27 600 Motor vehicles 68 200 195 800 1 Current Assets Inventory 17 400 1 Trade receivables 28 028 1 General expenses 900 1 Rent receivable 1 300 1 47 628 Current Liabilities Trade payables 19 470 1 Wages 500 1 Bank overdraft 8 290 1 28 260 Net current assets/working capital 19 368 215 168 Financed by Capital 212 880 2 of Profit for the year 34 208 1 of 247 088 Drawings 31 920 1 215 168 [12] [Total: 30] 2 (a) (i) 2010 2011 Motor vehicles MV1 5 200 5 200 MV2 1 800 3 600 MV3 3 600 7000 2 12 400 1 [3] (ii) 2010 2011 Equipment EQ1 4 500 4 500 EQ2 6 600 4 500 1 11 100 1 [2] (b) (i) 2010 2011 Motor vehicles MV1 6 500 4 875 1 MV2 4 500 3 375 1 MV3 6 000 1 11 000 2 14 250 [5]
Mark scheme, page 4
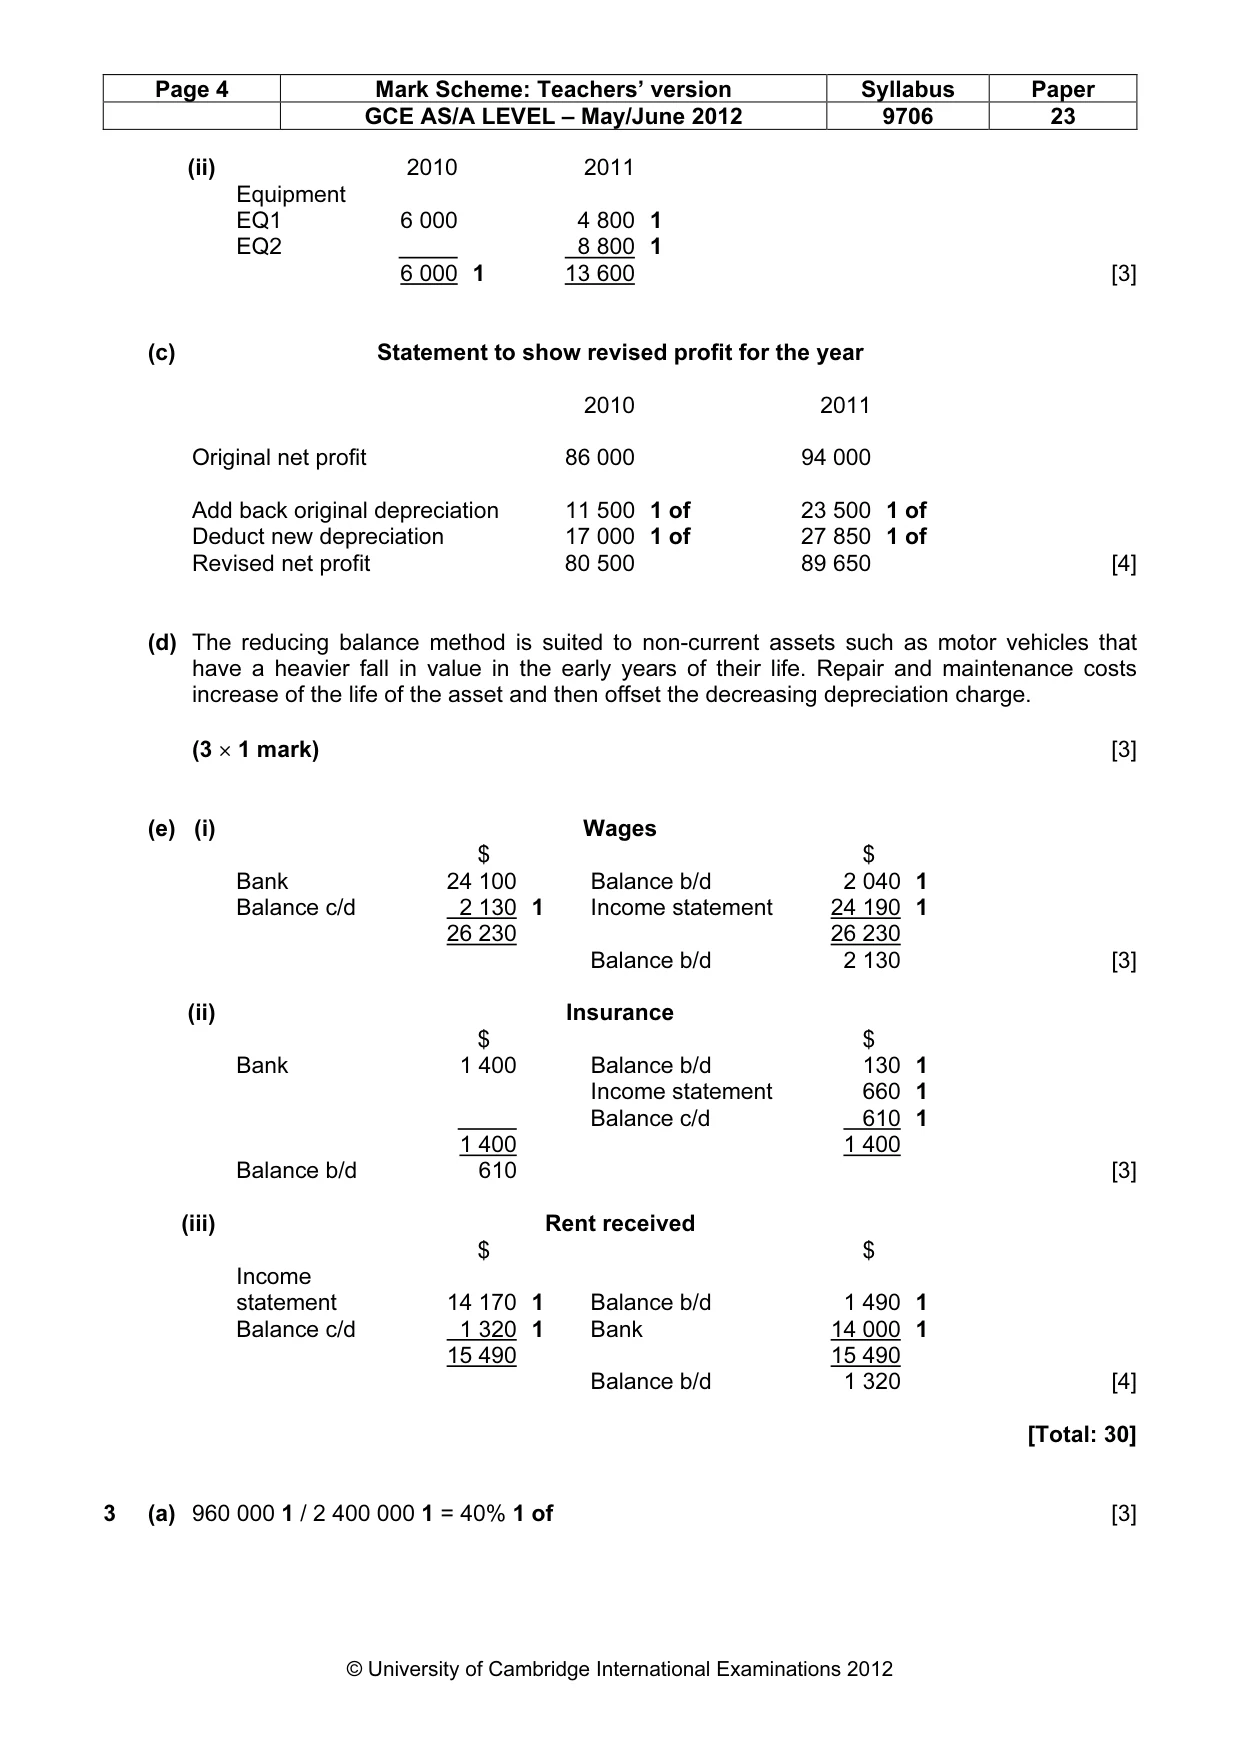
Page 4 Mark Scheme: Teachers’ version Syllabus Paper GCE AS/A LEVEL – May/June 2012 9706 23 © University of Cambridge International Examinations 2012 (ii) 2010 2011 Equipment EQ1 6 000 4 800 1 EQ2 8 800 1 6 000 1 13 600 [3] (c) Statement to show revised profit for the year 2010 2011 Original net profit 86 000 94 000 Add back original depreciation 11 500 1 of 23 500 1 of Deduct new depreciation 17 000 1 of 27 850 1 of Revised net profit 80 500 89 650 [4] (d) The reducing balance method is suited to non-current assets such as motor vehicles that have a heavier fall in value in the early years of their life. Repair and maintenance costs increase of the life of the asset and then offset the decreasing depreciation charge. (3 × 1 mark) [3] (e) (i) Wages $ $ Bank 24 100 Balance b/d 2 040 1 Balance c/d 2 130 1 Income statement 24 190 1 26 230 26 230 Balance b/d 2 130 [3] (ii) Insurance $ $ Bank 1 400 Balance b/d 130 1 Income statement 660 1 Balance c/d 610 1 1 400 1 400 Balance b/d 610 [3] (iii) Rent received $ $ Income statement 14 170 1 Balance b/d 1 490 1 Balance c/d 1 320 1 Bank 14 000 1 15 490 15 490 Balance b/d 1 320 [4] [Total: 30] 3 (a) 960 000 1 / 2 400 000 1 = 40% 1 of [3]
Mark scheme, page 5
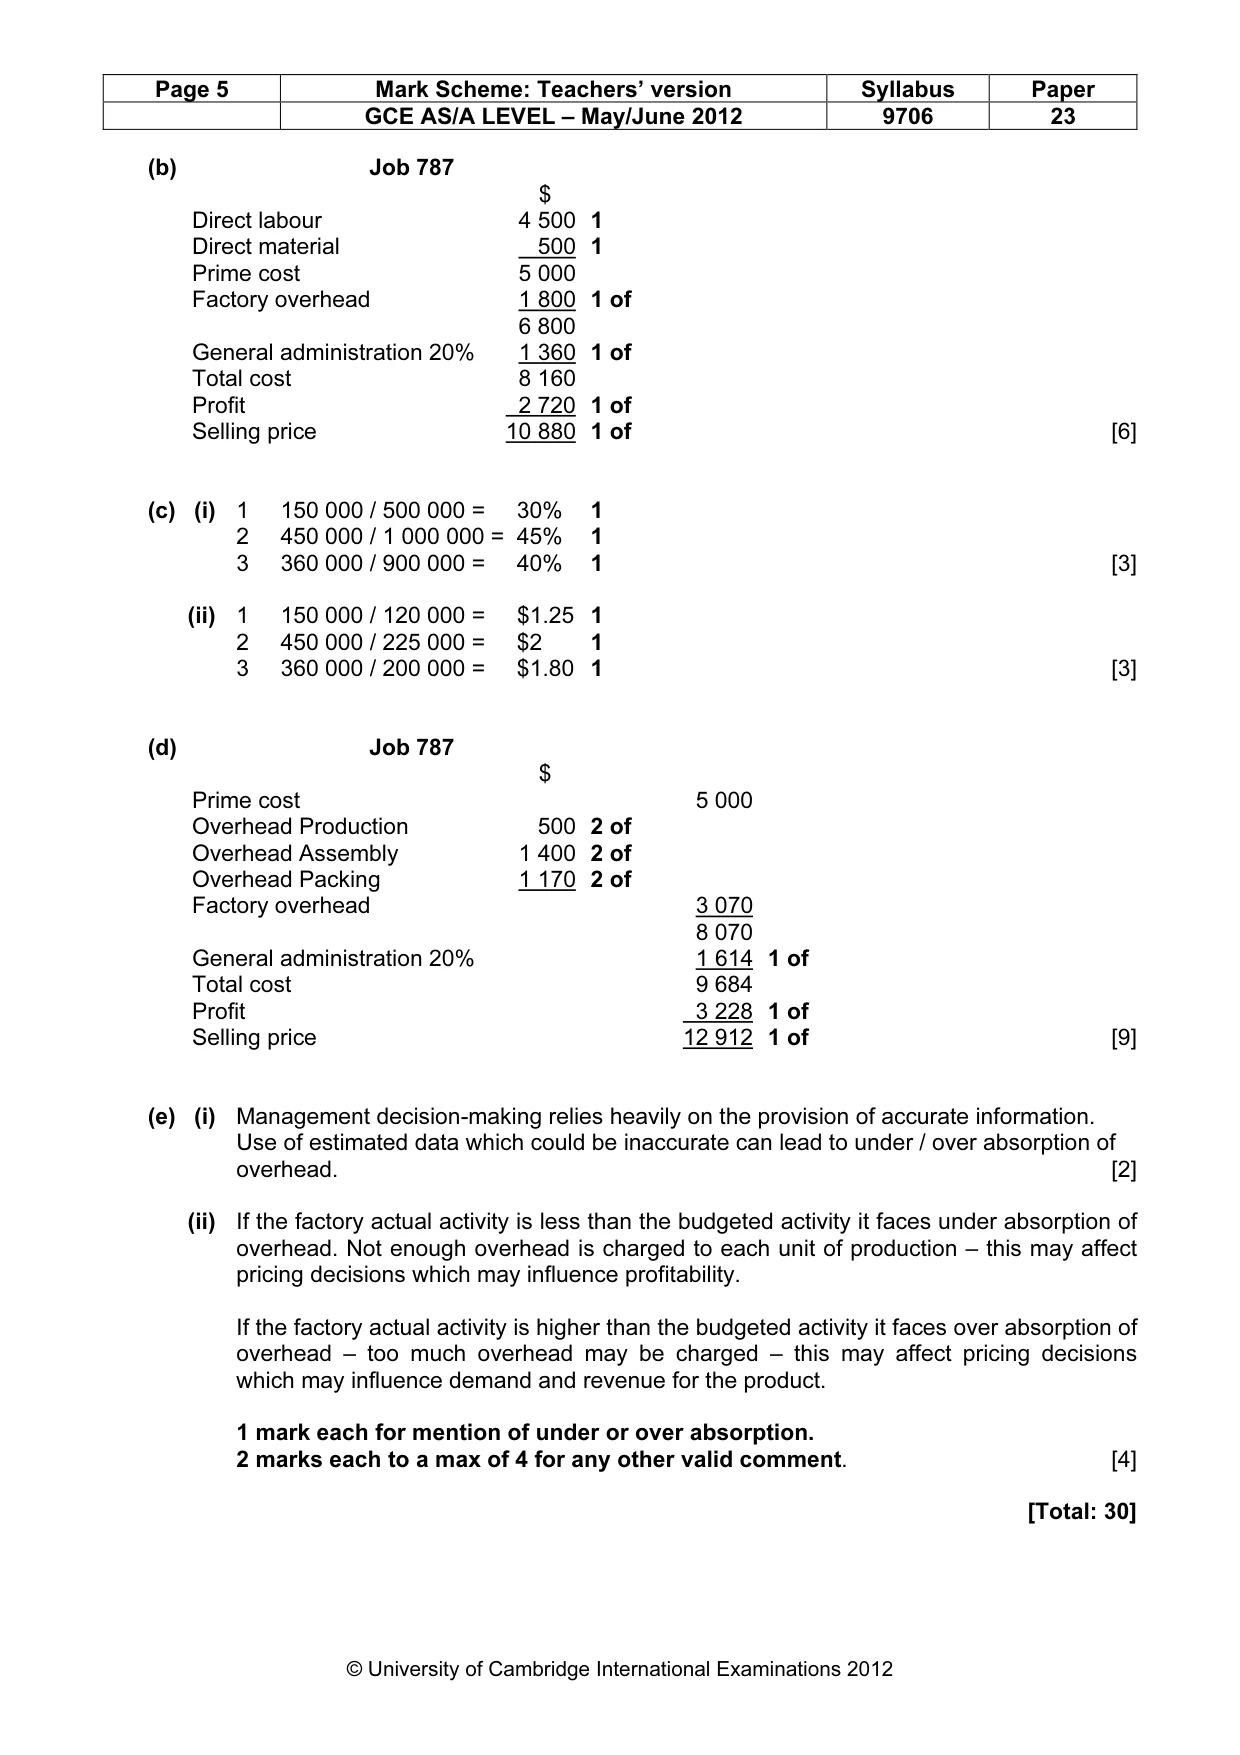
Page 5 Mark Scheme: Teachers’ version Syllabus Paper GCE AS/A LEVEL – May/June 2012 9706 23 © University of Cambridge International Examinations 2012 (b) Job 787 $ Direct labour 4 500 1 Direct material 500 1 Prime cost 5 000 Factory overhead 1 800 1 of 6 800 General administration 20% 1 360 1 of Total cost 8 160 Profit 2 720 1 of Selling price 10 880 1 of [6] (c) (i) 1 150 000 / 500 000 = 30% 1 2 450 000 / 1 000 000 = 45% 1 3 360 000 / 900 000 = 40% 1 [3] (ii) 1 150 000 / 120 000 = $1.25 1 2 450 000 / 225 000 = $2 1 3 360 000 / 200 000 = $1.80 1 [3] (d) Job 787 $ Prime cost 5 000 Overhead Production 500 2 of Overhead Assembly 1 400 2 of Overhead Packing 1 170 2 of Factory overhead 3 070 8 070 General administration 20% 1 614 1 of Total cost 9 684 Profit 3 228 1 of Selling price 12 912 1 of [9] (e) (i) Management decision-making relies heavily on the provision of accurate information. Use of estimated data which could be inaccurate can lead to under / over absorption of overhead. [2] (ii) If the factory actual activity is less than the budgeted activity it faces under absorption of overhead. Not enough overhead is charged to each unit of production – this may affect pricing decisions which may influence profitability. If the factory actual activity is higher than the budgeted activity it faces over absorption of overhead – too much overhead may be charged – this may affect pricing decisions which may influence demand and revenue for the product. 1 mark each for mention of under or over absorption. 2 marks each to a max of 4 for any other valid comment. [4] [Total: 30]
What you needed in this session
Cambridge’s own grade thresholds for 2012 May/June, Paper 2 · Variant 3. A higher threshold means an easier paper — the bar moves with how the cohort did.