Cambridge IGCSE Sciences - Co-ordinated (Double) 0654 — 2023 May/June Paper 6 · Variant 2
0654/62/M/J/23 · 7 questions · 60 marks · ≈68 min
The question paper and its mark scheme, free to read here and free to download. This is Cambridge’s own paper, exactly as it was sat.
Question paper24 pages






Mark scheme12 pages
Answers below. Sit the paper first if you are practising.
Questions as text
Q1 · A student investigates the effect of plants and animals on their aqueous environment
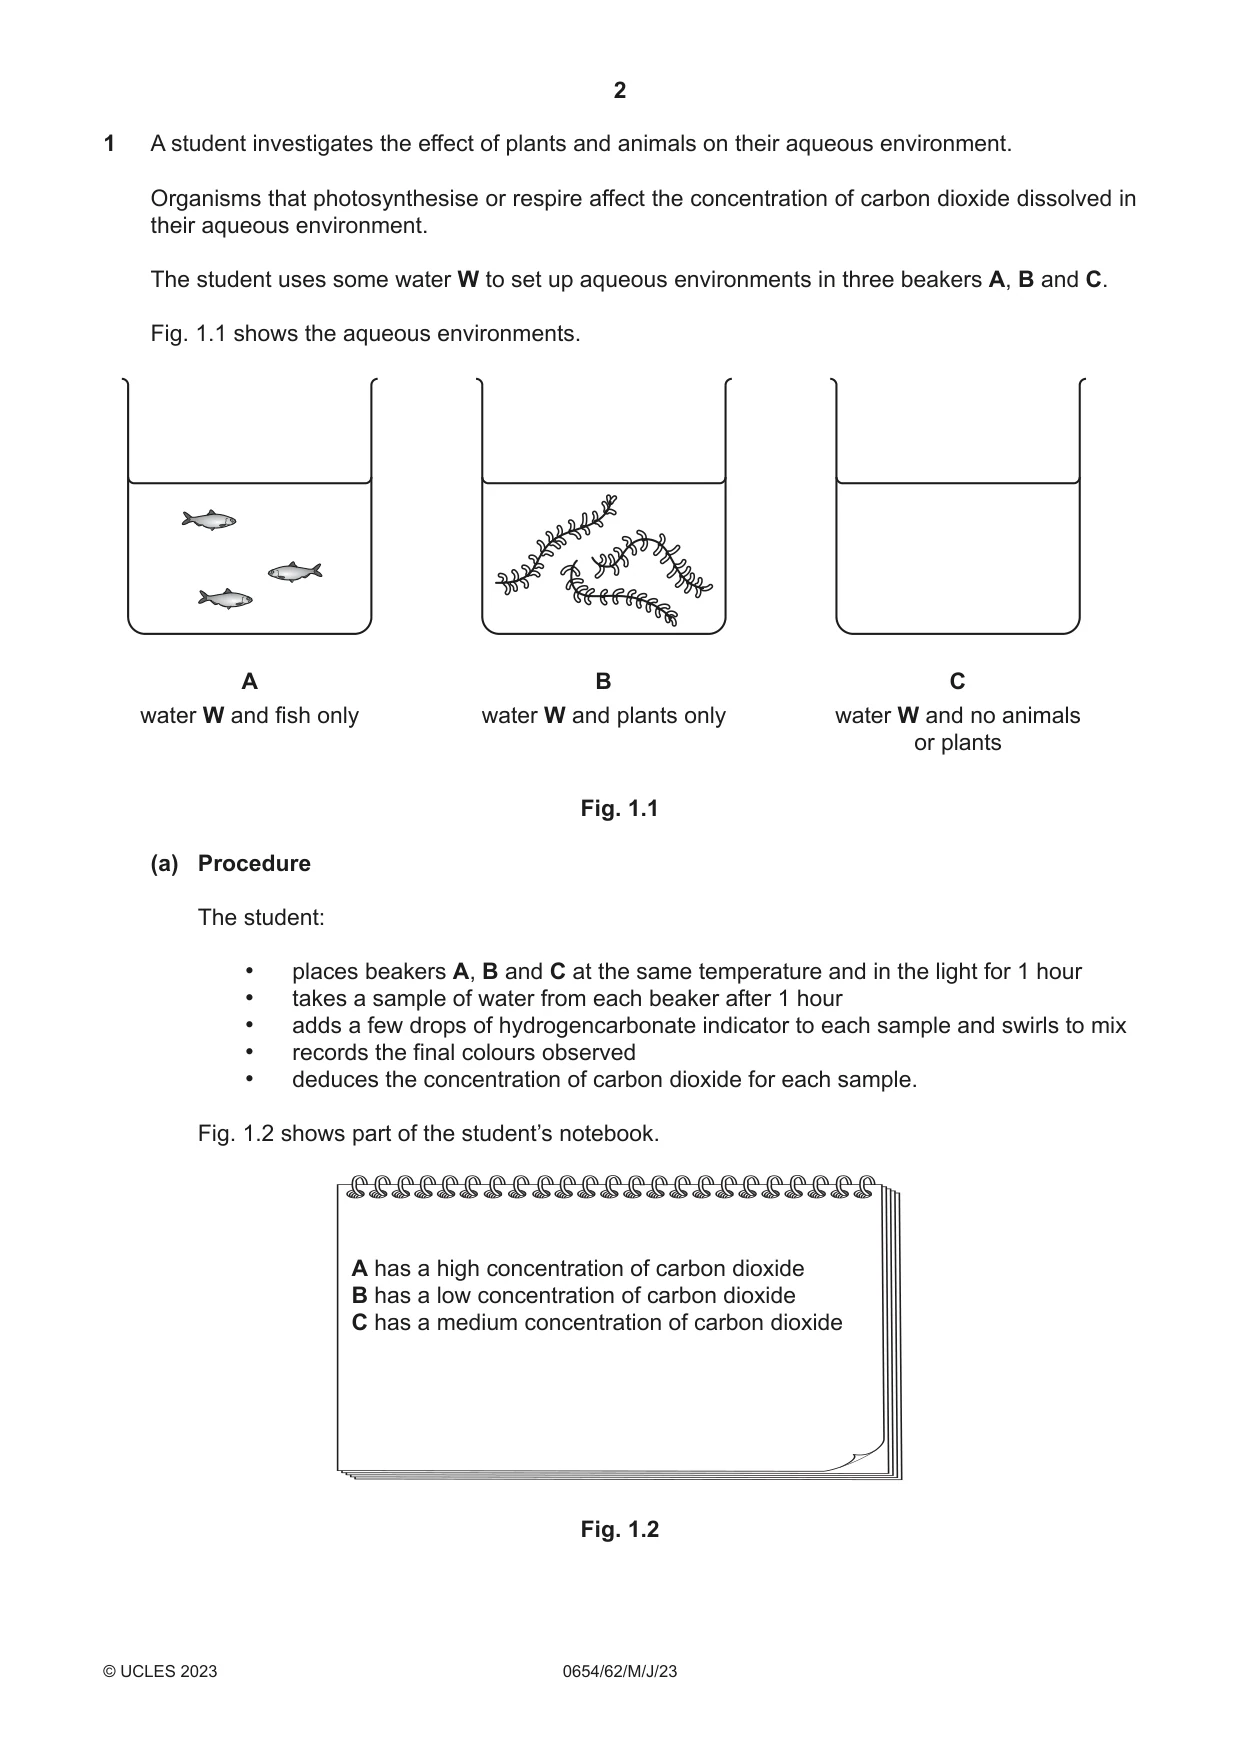
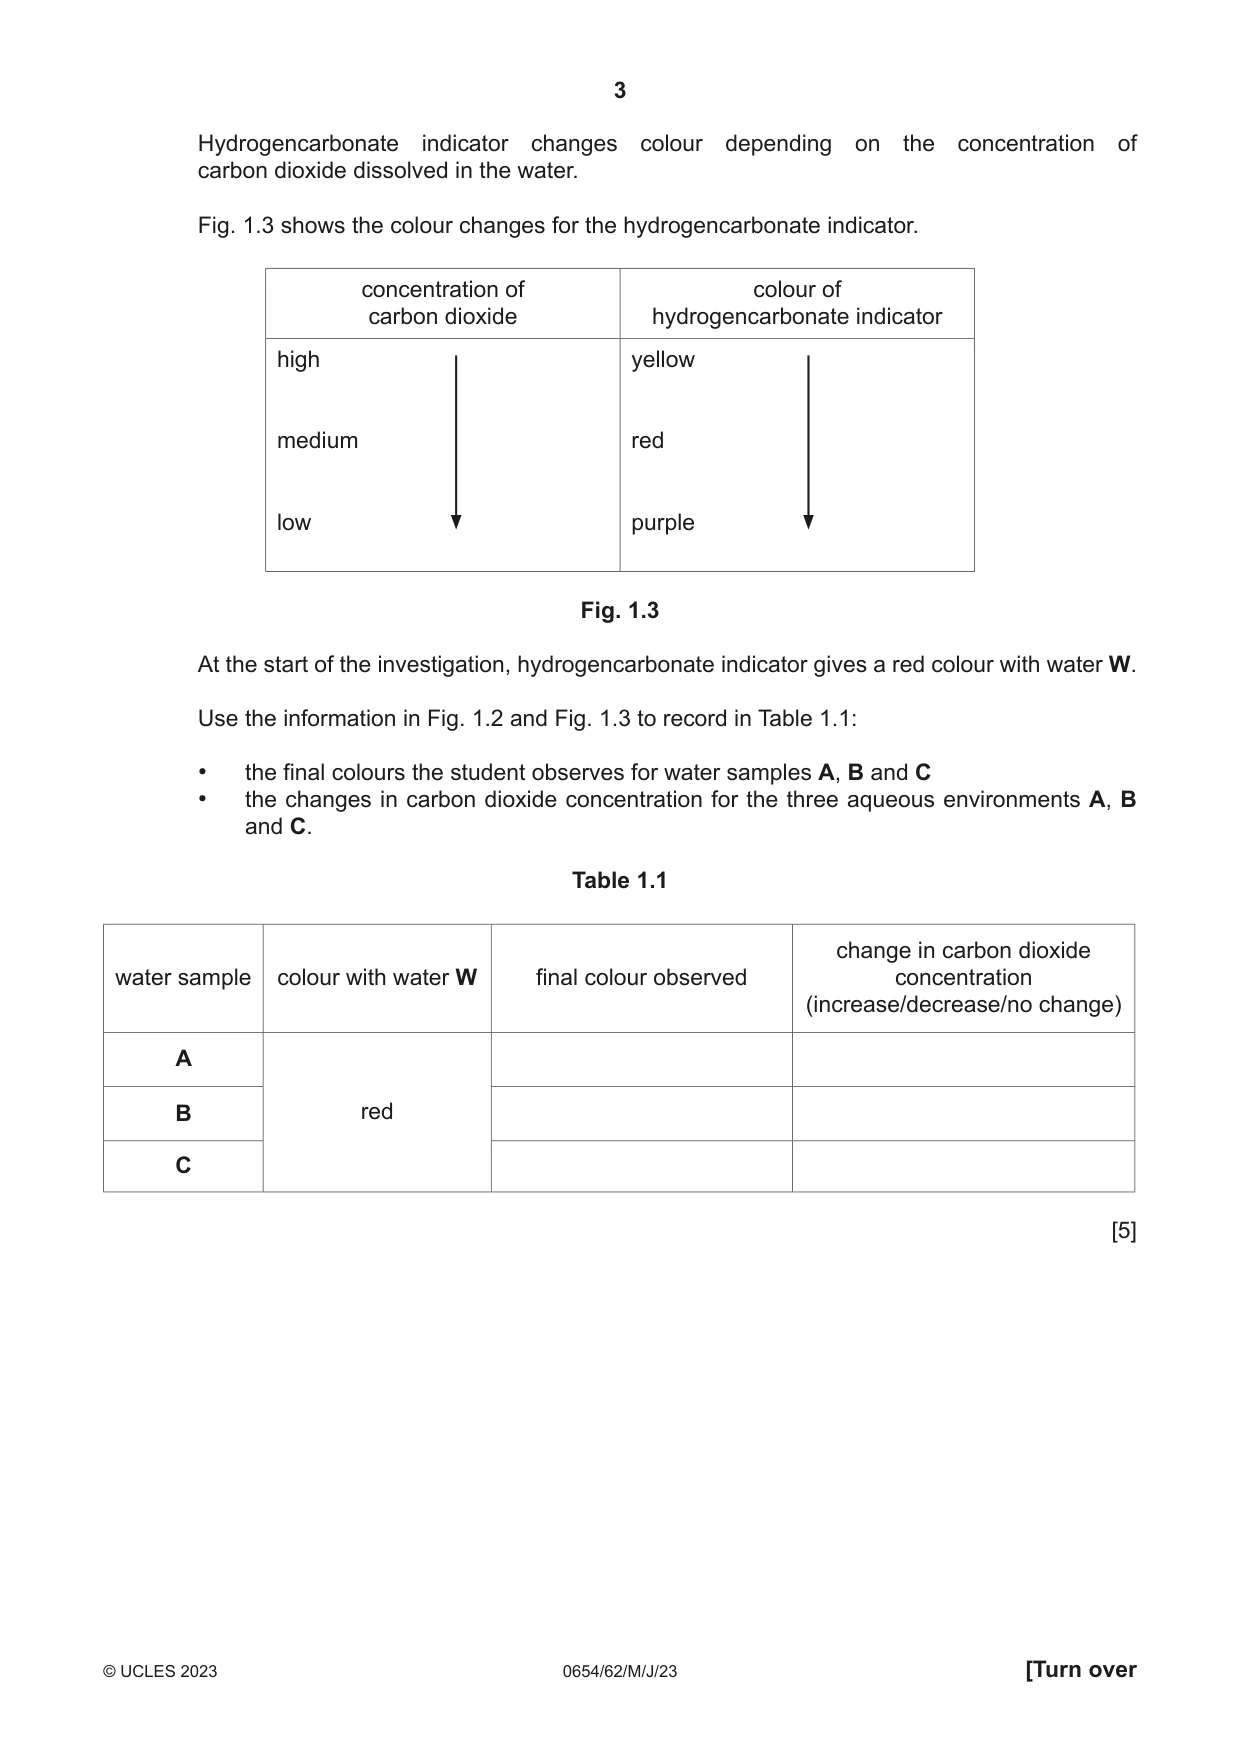
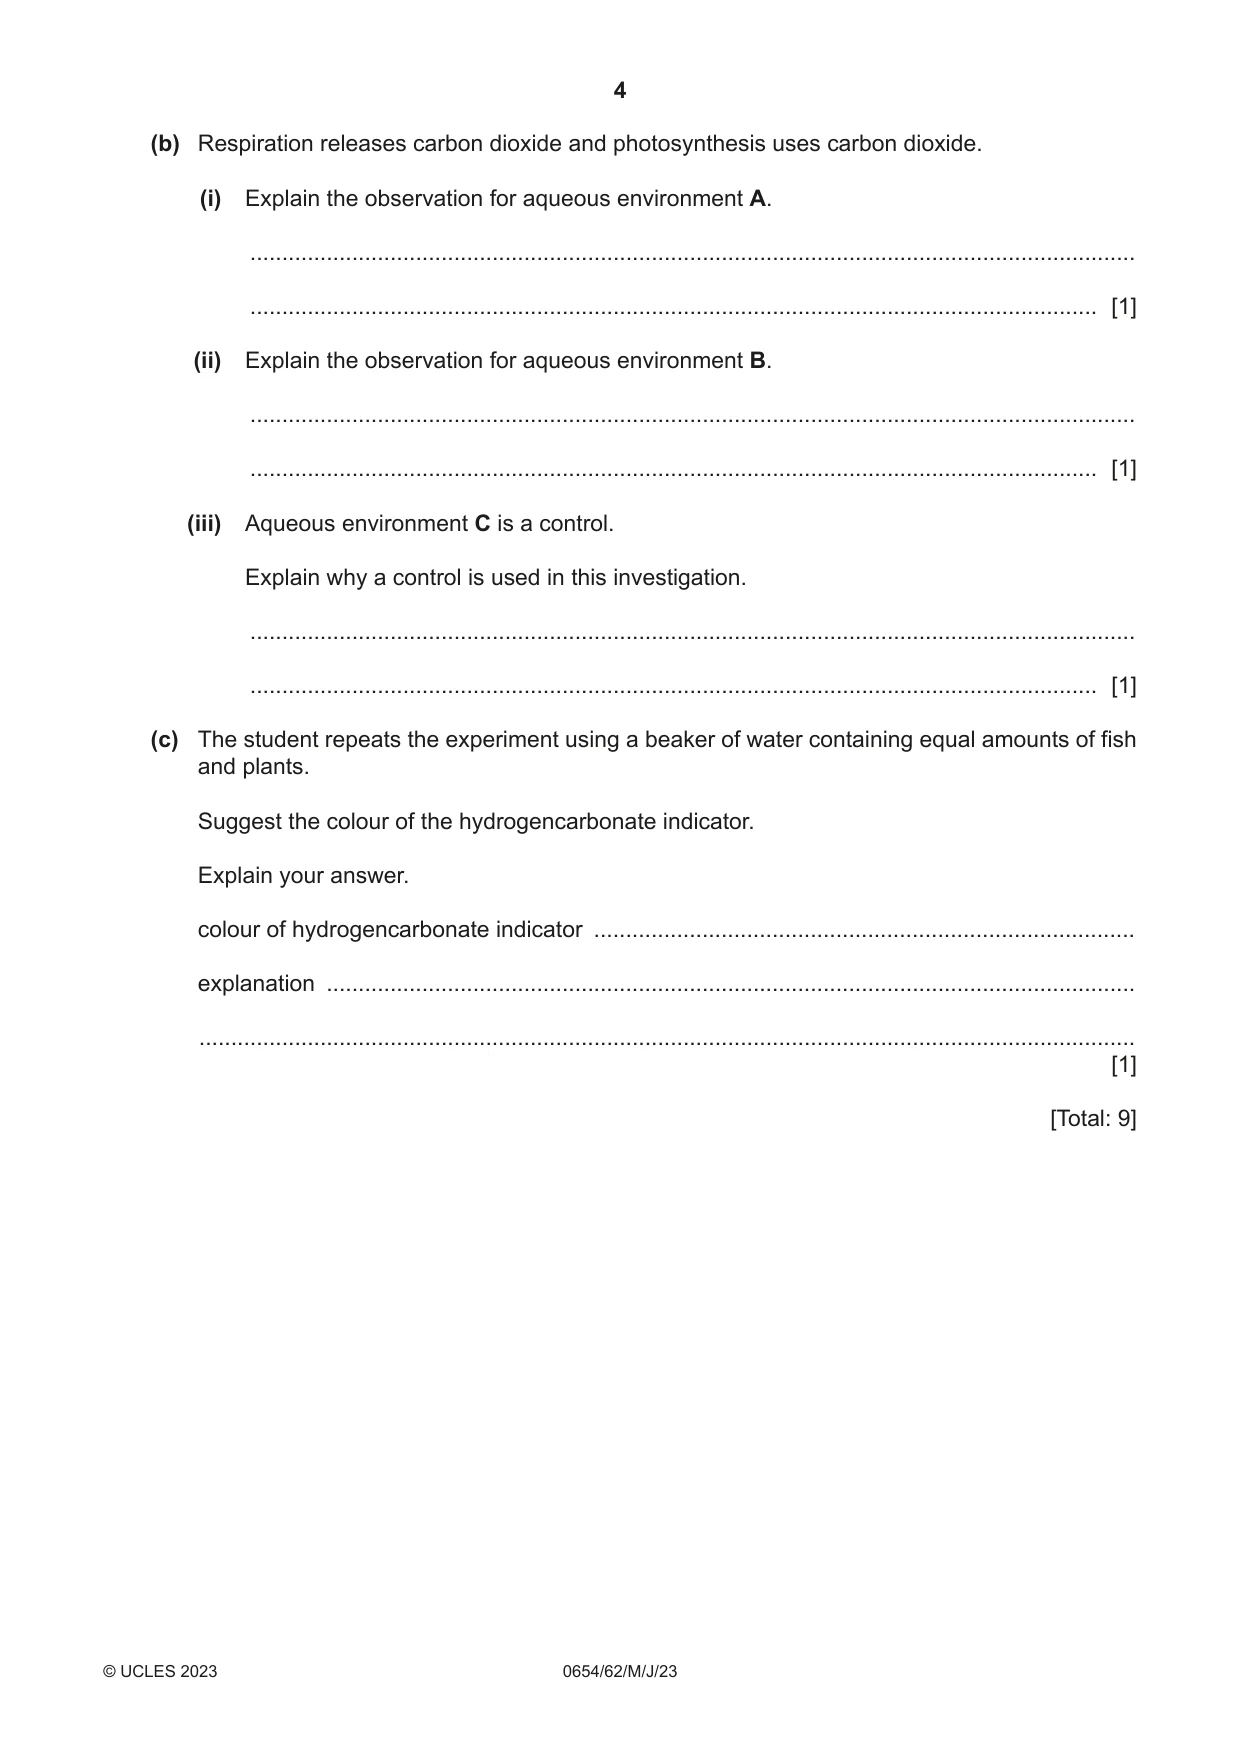
1 A student investigates the effect of plants and animals on their aqueous environment. Organisms that photosynthesise or respire affect the concentration of carbon dioxide dissolved in their aqueous environment. The student uses some water W to set up aqueous environments in three beakers A, B and C. Fig. 1.1 shows the aqueous environments. A B C water W and fish only water W and plants only water W and no animals or plants Fig. 1.1 (a) Procedure The student: • places beakers A, B and C at the same temperature and in the light for 1 hour • takes a sample of water from each beaker after 1 hour • adds a few drops of hydrogencarbonate indicator to each sample and swirls to mix • records the final colours observed • deduces the concentration of carbon dioxide for each sample. Fig. 1.2 shows part of the student’s notebook. A has a high concentration of carbon dioxide B has a low concentration of carbon dioxide C has a medium concentration of carbon dioxide Fig. 1.2 Hydrogencarbonate indicator changes colour depending on the concentration of carbon dioxide dissolved in the water. Fig. 1.3 shows the colour changes for the hydrogencarbonate indicator. concentration of colour of carbon dioxide hydrogencarbonate indicator high yellow medium red low purple Fig. 1.3 At the start of the investigation, hydrogencarbonate indicator gives a red colour with water W. Use the information in Fig. 1.2 and Fig. 1.3 to record in Table 1.1: • the final colours the student observes for water samples A, B and C • the changes in carbon dioxide concentration for the three aqueous environments A, B and C. Table 1.1 change in carbon dioxide water sample colour with water W final colour observed concentration (increase/decrease/no change) A B red C [5] (b) Respiration releases carbon dioxide and photosynthesis uses carbon dioxide. (i) Explain the observation for aqueous environment A. ........................................................................................................................................... ..................................................................................................................................... [1] (ii) Explain the observation for aqueous environment B. ........................................................................................................................................... ..................................................................................................................................... [1] (iii) Aqueous environment C is a control. Explain why a control is used in this investigation. ........................................................................................................................................... ..................................................................................................................................... [1] (c) The student repeats the experiment using a beaker of water containing equal amounts of fish and plants. Suggest the colour of the hydrogencarbonate indicator. Explain your answer. colour of hydrogencarbonate indicator ..................................................................................... explanation ............................................................................................................................... ................................................................................................................................................... [1] [Total: 9]
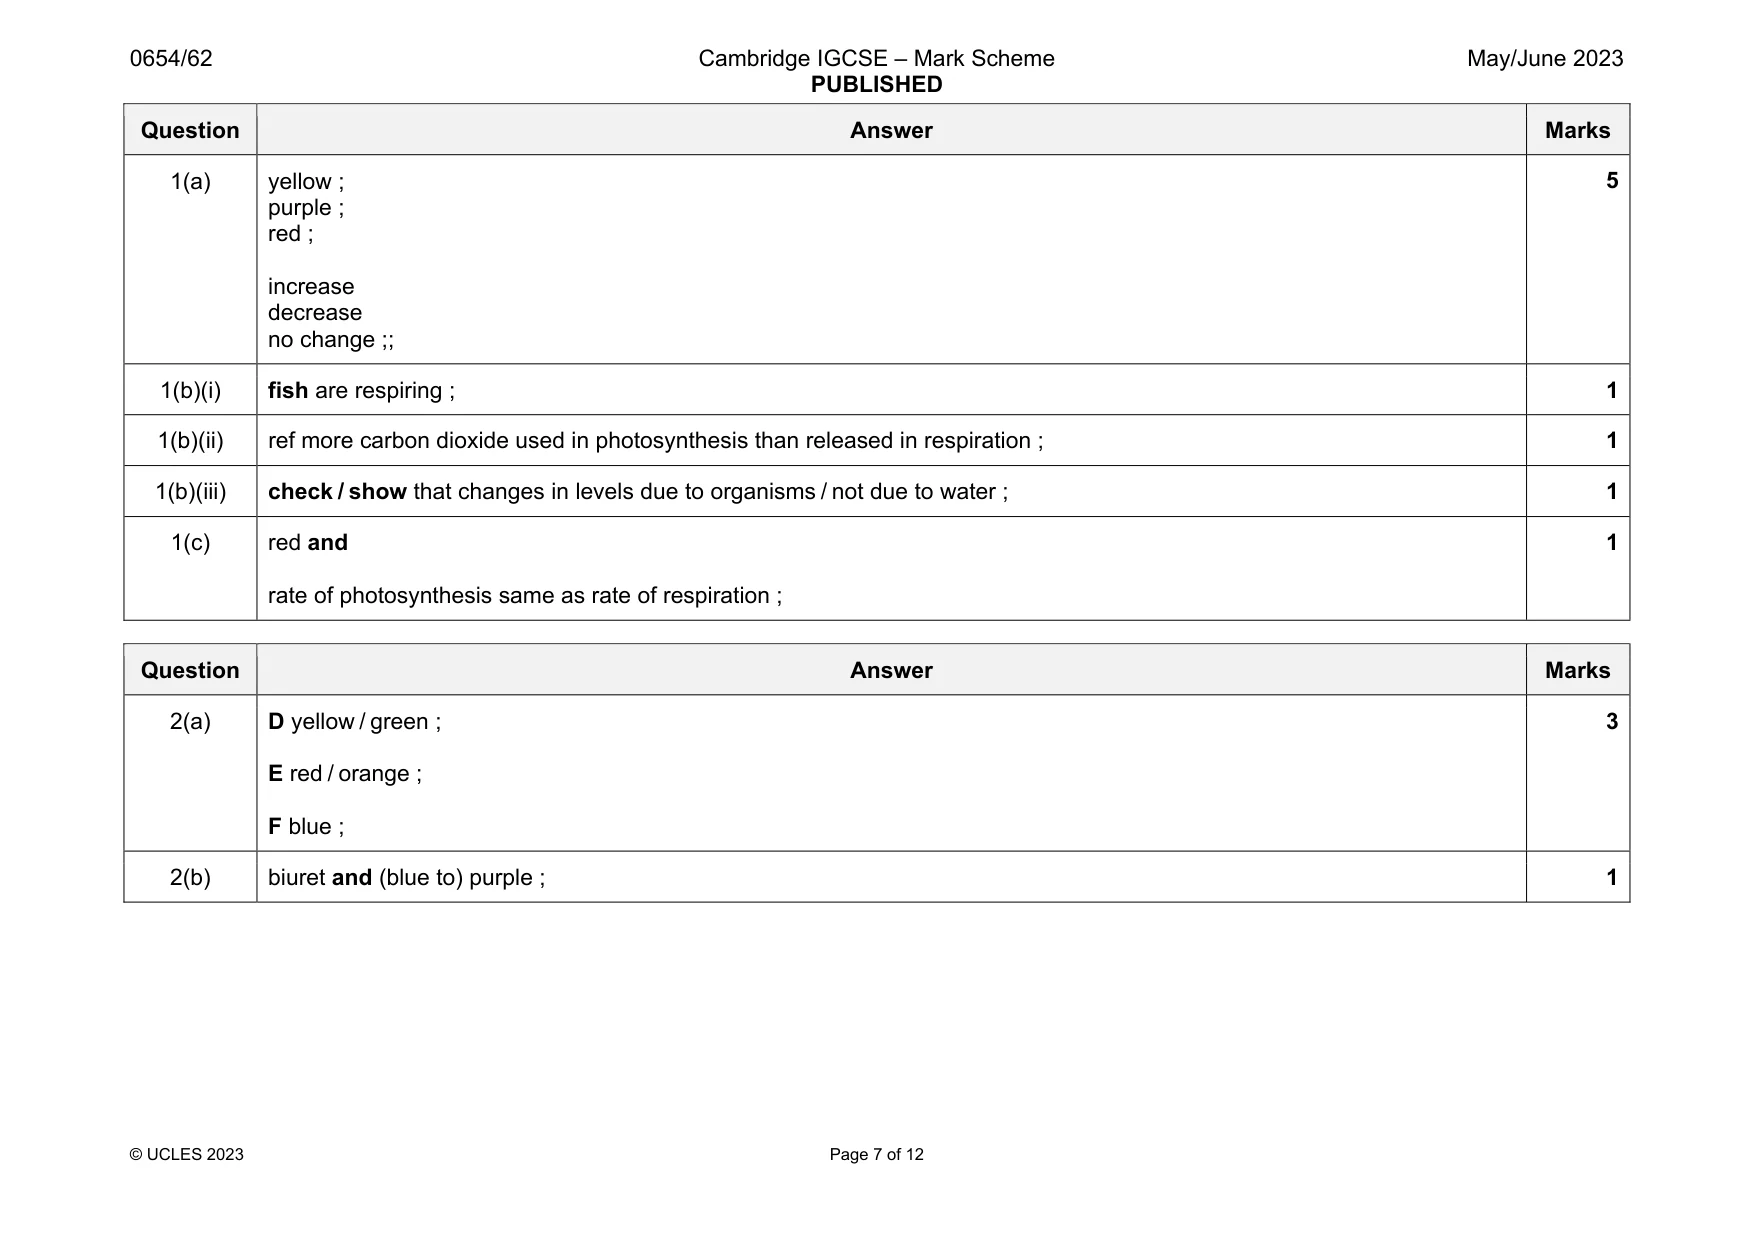
Mark scheme: 1(a) yellow ; purple ; red ; increase decrease no change ;; 1(b)(i) fish are respiring ; 1 1(b)(ii) ref more carbon dioxide used in photosynthesis than released in respiration ; 1 1(b)(iii) check / show that changes in levels due to organisms / not due to water ; 1 1(c) red and rate of photosynthesis same as rate of respiration ; 1
Q2 · A student investigates three nutrient solutions D, E and F for the presence of reducing…
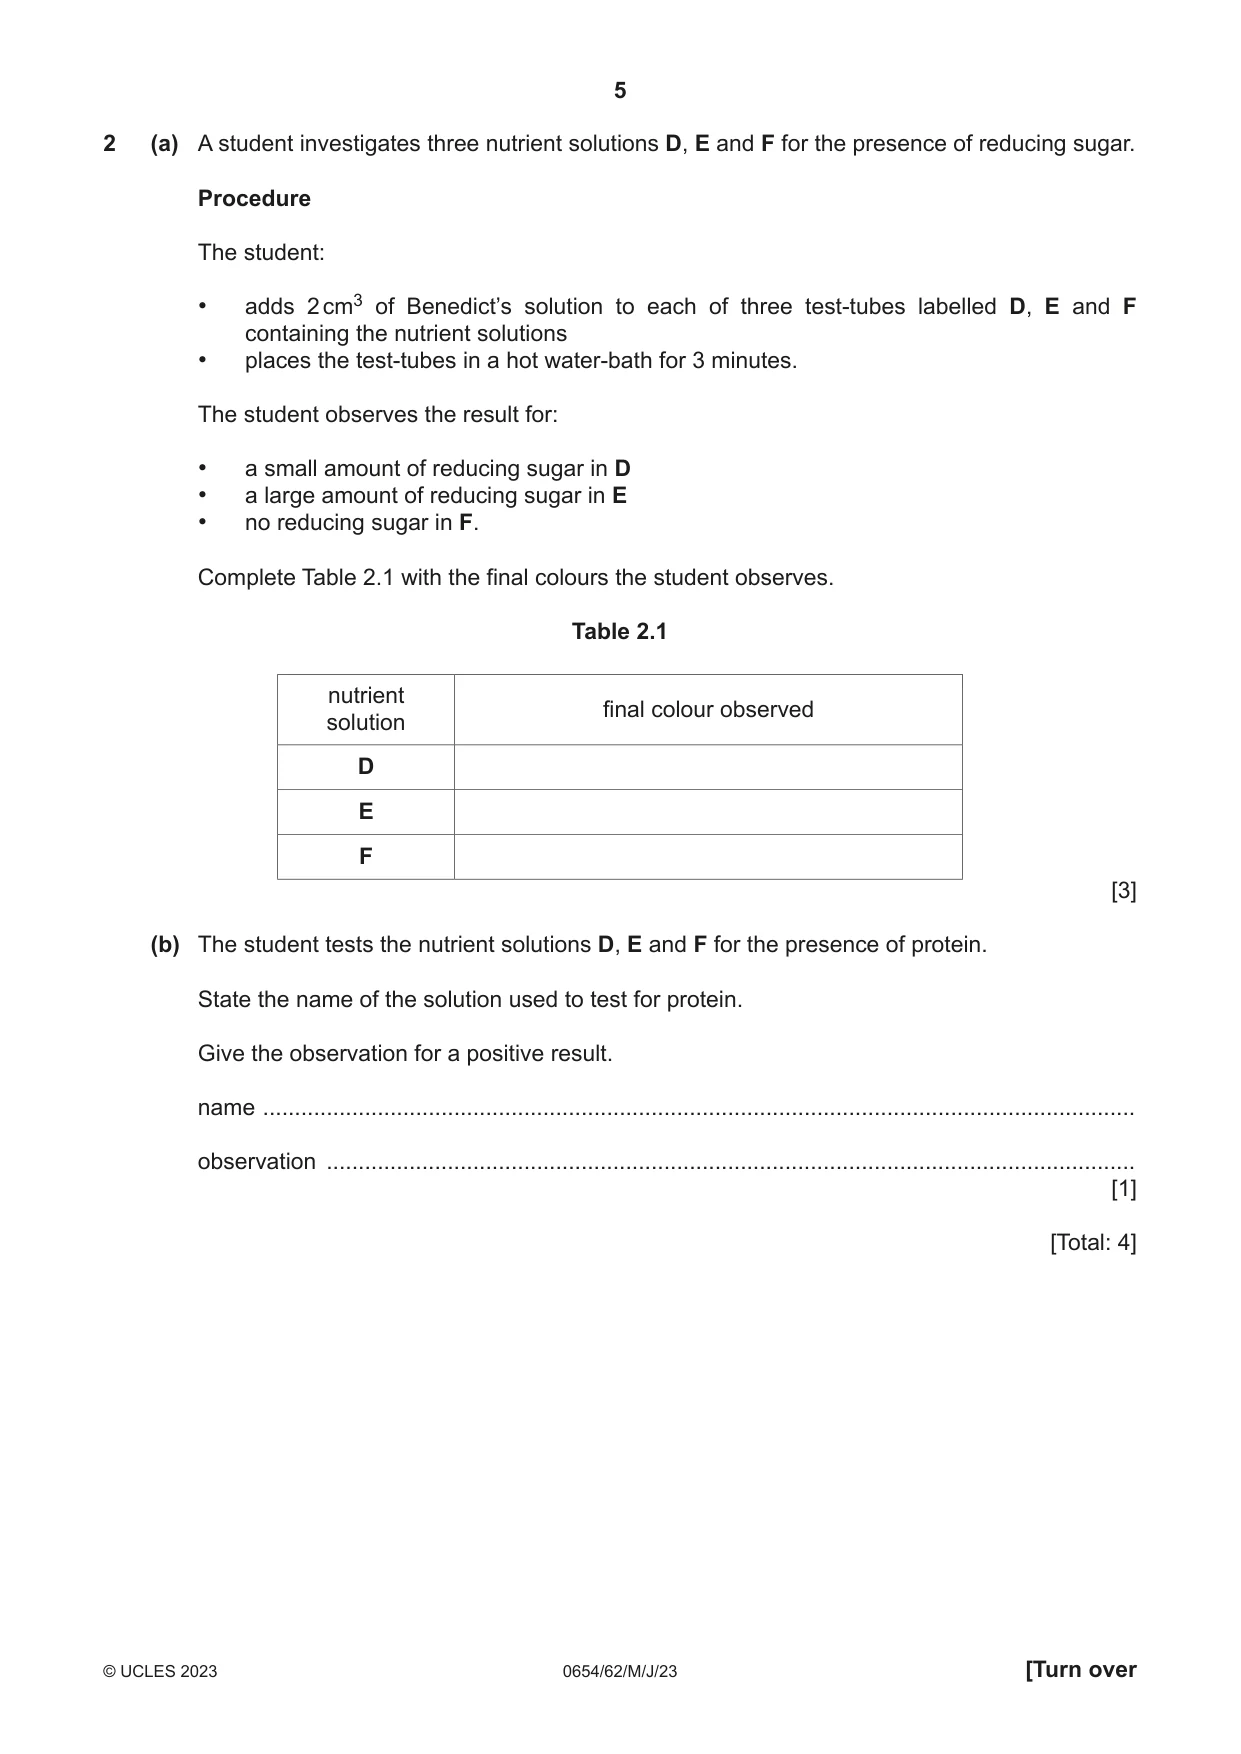
2 (a) A student investigates three nutrient solutions D, E and F for the presence of reducing sugar. Procedure The student: • adds 2 cm3 of Benedict’s solution to each of three test-tubes labelled D, E and F containing the nutrient solutions • places the test-tubes in a hot water-bath for 3 minutes. The student observes the result for: • a small amount of reducing sugar in D • a large amount of reducing sugar in E • no reducing sugar in F. Complete Table 2.1 with the final colours the student observes. Table 2.1 nutrient final colour observed solution D E F [3] (b) The student tests the nutrient solutions D, E and F for the presence of protein. State the name of the solution used to test for protein. Give the observation for a positive result. name ......................................................................................................................................... observation ............................................................................................................................... [1] [Total: 4]
Mark scheme: 2(a) D yellow / green ; E red / orange ; F blue ; 2(b) biuret and (blue to) purple ; 1
Q3 · The seeds of a sycamore tree are shown in Fig
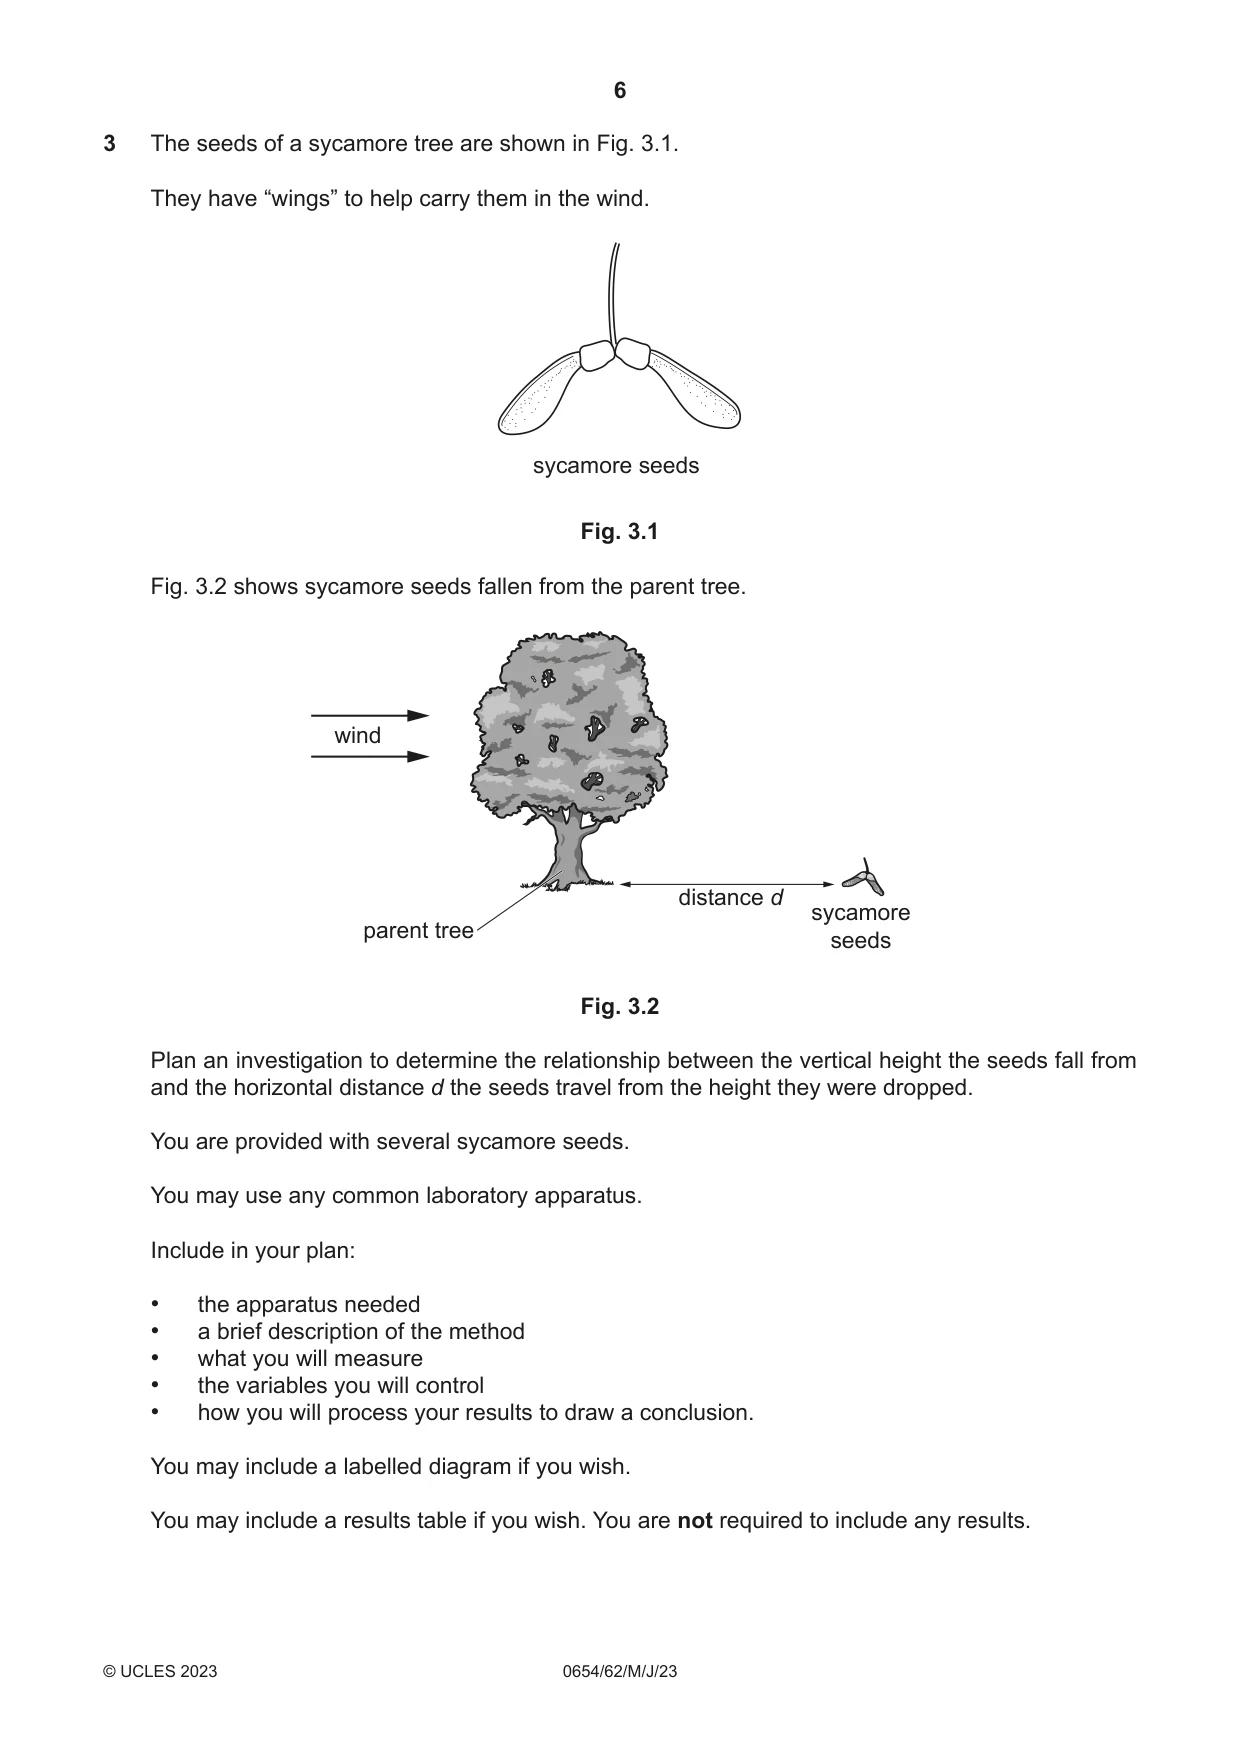
3 The seeds of a sycamore tree are shown in Fig. 3.1. They have “wings” to help carry them in the wind. sycamore seeds Fig. 3.1 Fig. 3.2 shows sycamore seeds fallen from the parent tree. wind distance d sycamore parent tree seeds Fig. 3.2 Plan an investigation to determine the relationship between the vertical height the seeds fall from and the horizontal distance d the seeds travel from the height they were dropped. You are provided with several sycamore seeds. You may use any common laboratory apparatus. Include in your plan: • the apparatus needed • a brief description of the method • what you will measure • the variables you will control • how you will process your results to draw a conclusion. You may include a labelled diagram if you wish. You may include a results table if you wish. You are not required to include any results. .......................................................................................................................................................... .......................................................................................................................................................... .......................................................................................................................................................... .......................................................................................................................................................... .......................................................................................................................................................... .......................................................................................................................................................... .......................................................................................................................................................... .......................................................................................................................................................... .......................................................................................................................................................... .......................................................................................................................................................... .......................................................................................................................................................... .......................................................................................................................................................... .......................................................................................................................................................... .......................................................................................................................................................... .......................................................................................................................................................... .......................................................................................................................................................... .......................................................................................................................................................... .......................................................................................................................................................... .......................................................................................................................................................... .......................................................................................................................................................... .................................................................................................................................................... [7]
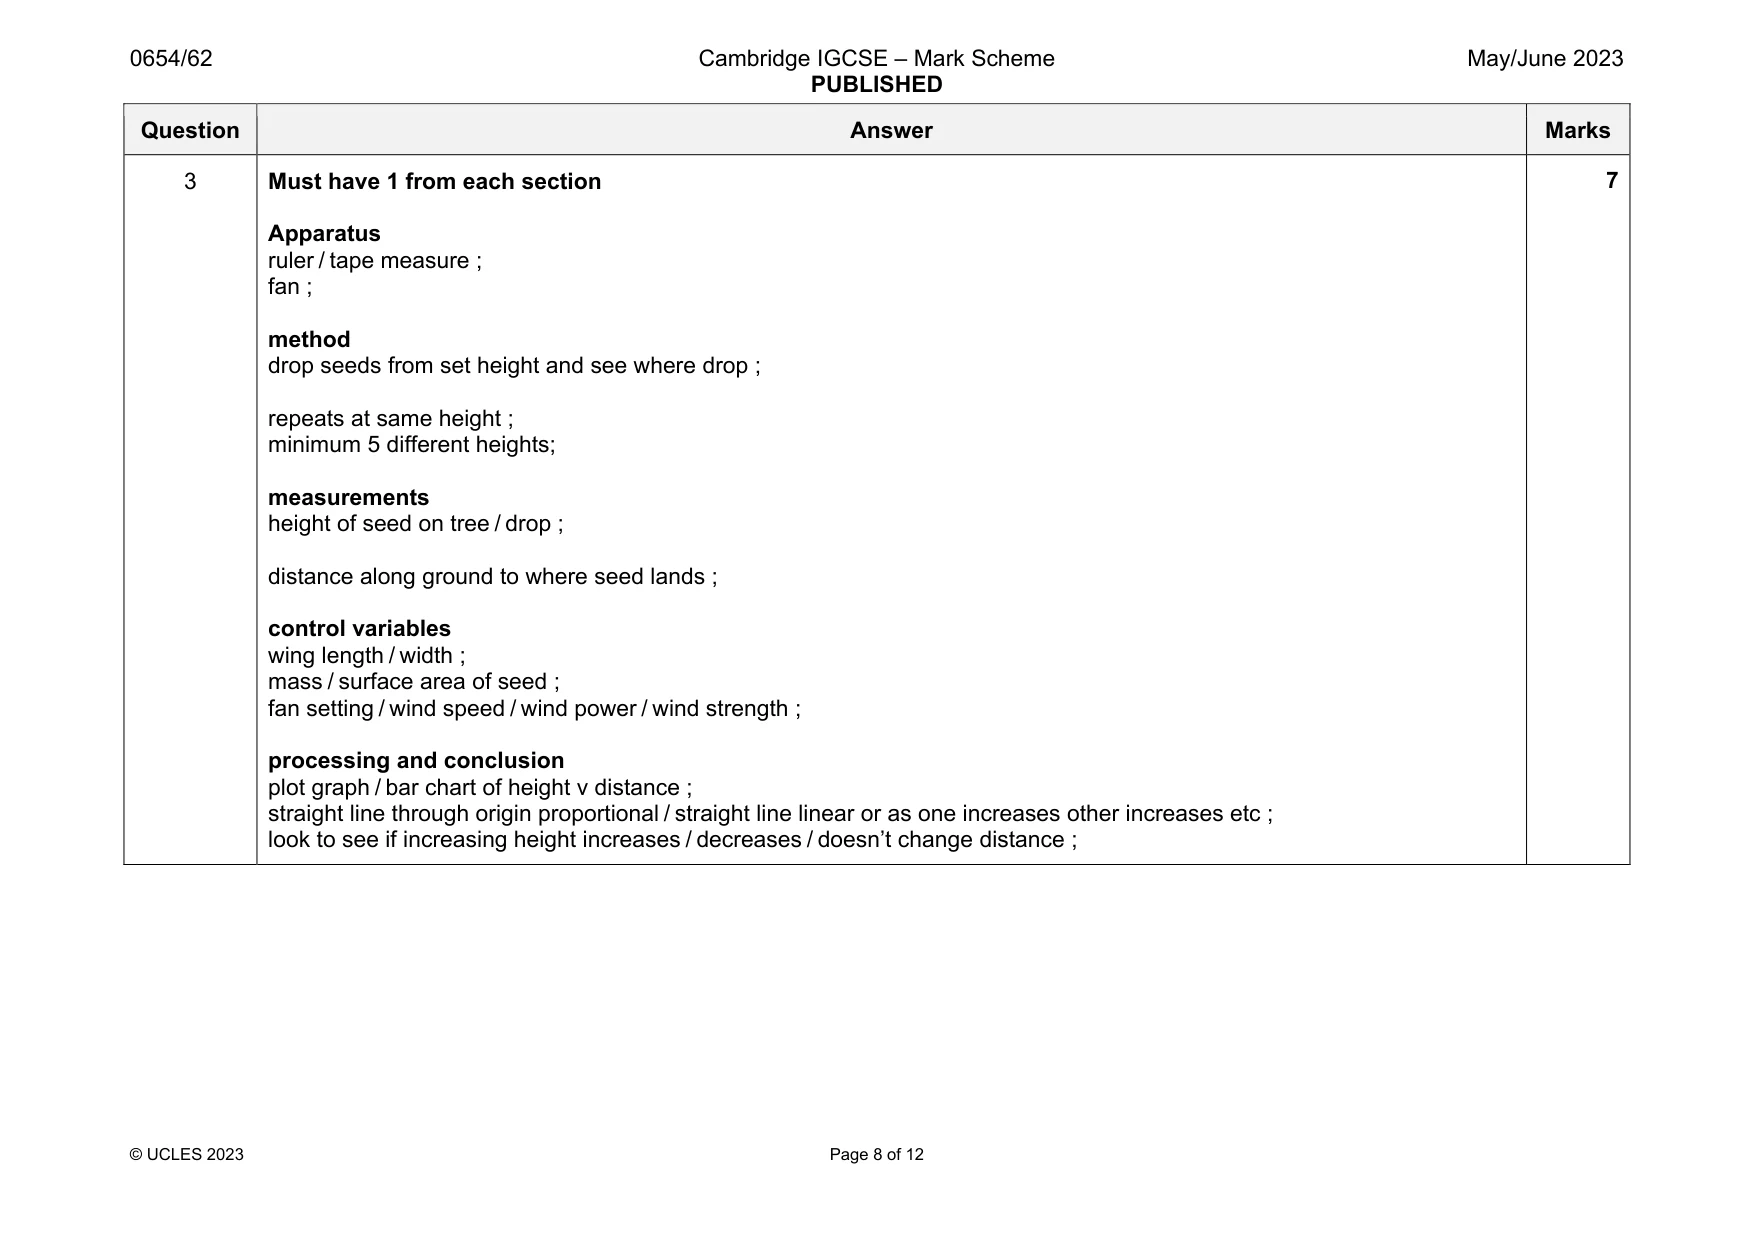
Mark scheme: 3 Must have 1 from each section Apparatus ruler / tape measure ; fan ; method drop seeds from set height and see where drop ; repeats at same height ; minimum 5 different heights; measurements height of seed on tree / drop ; distance along ground to where seed lands ; control variables wing length / width ; mass / surface area of seed ; fan setting / wind speed / wind power / wind strength ; processing and conclusion plot graph / bar chart of height v distance ; straight line through origin proportional / straight line linear or as one increases other increases etc ; look to see if increasing height increases / decreases / doesn’t change distance ;
Q4 · A student investigates the rate of reaction between solutions H and K
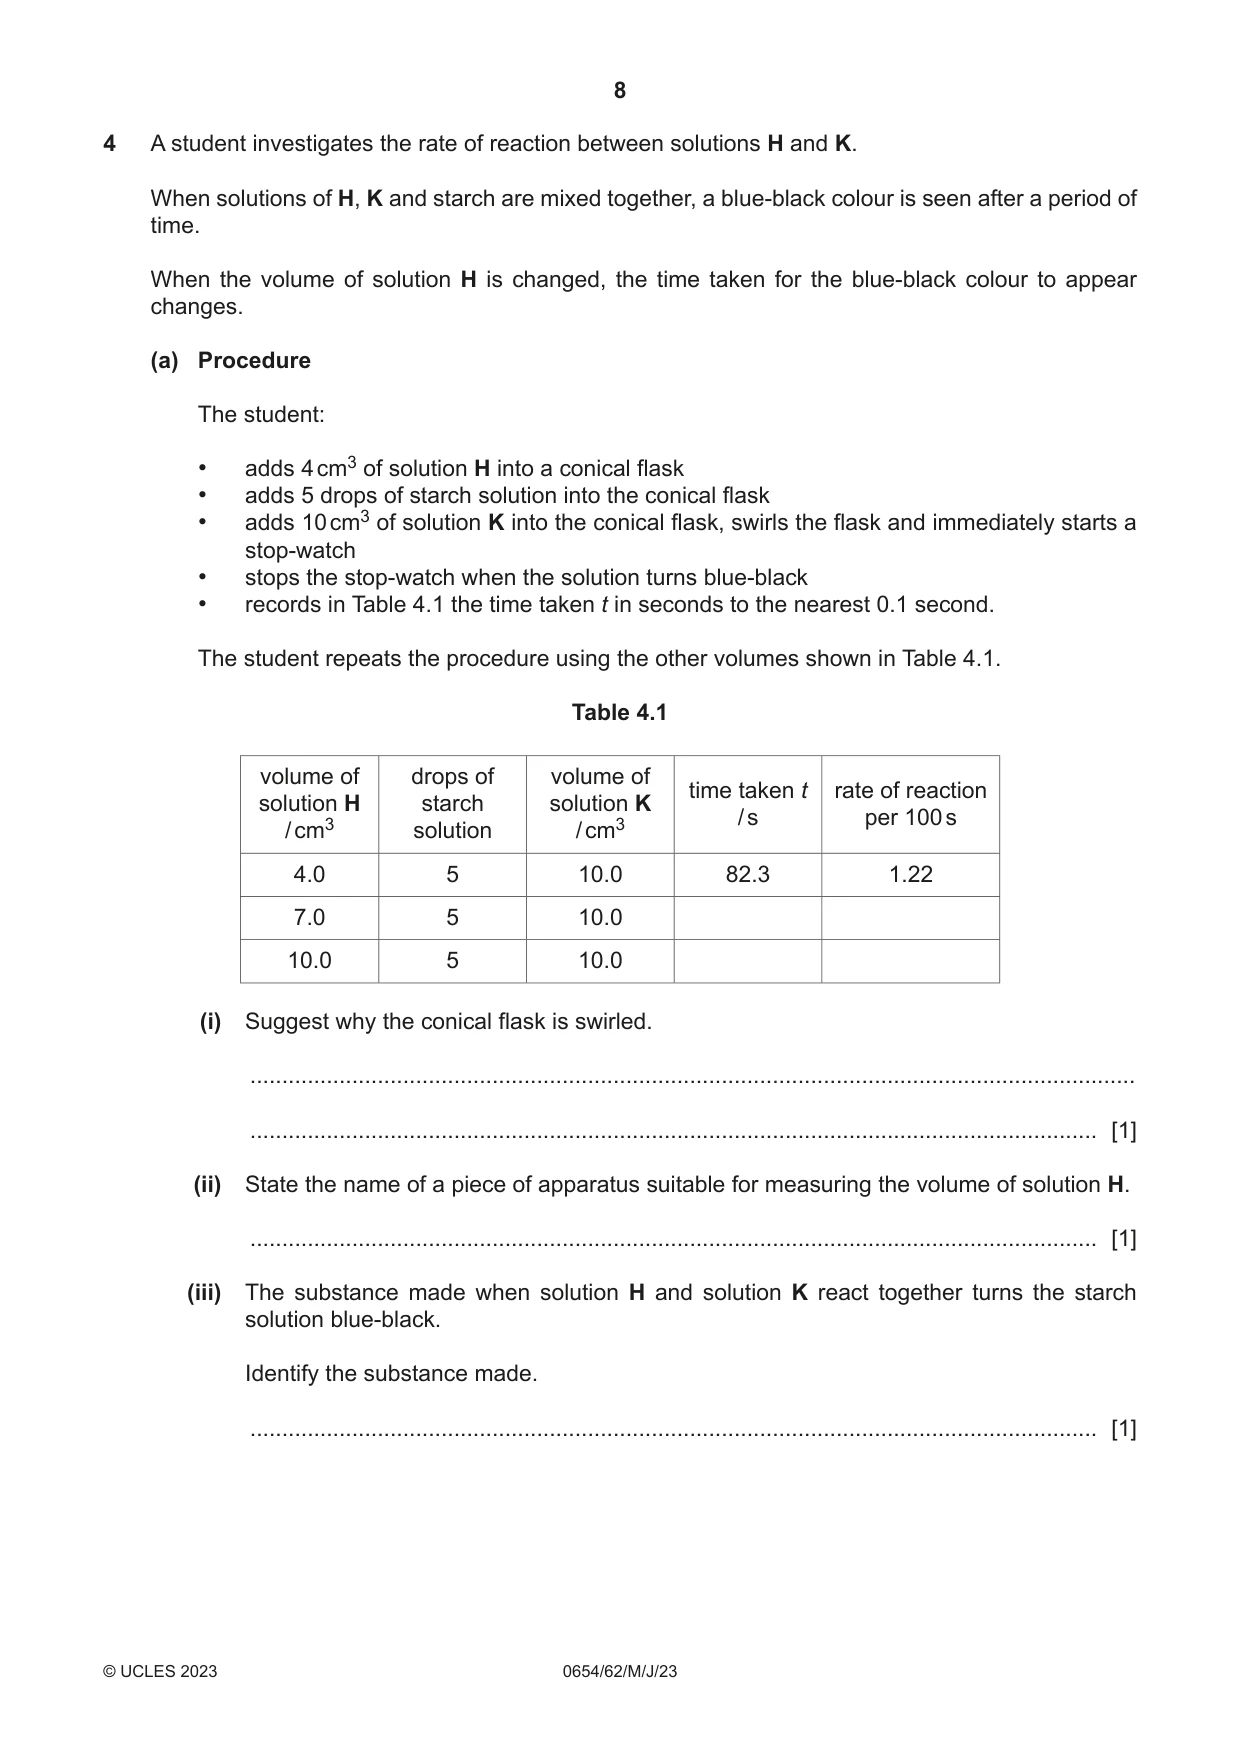
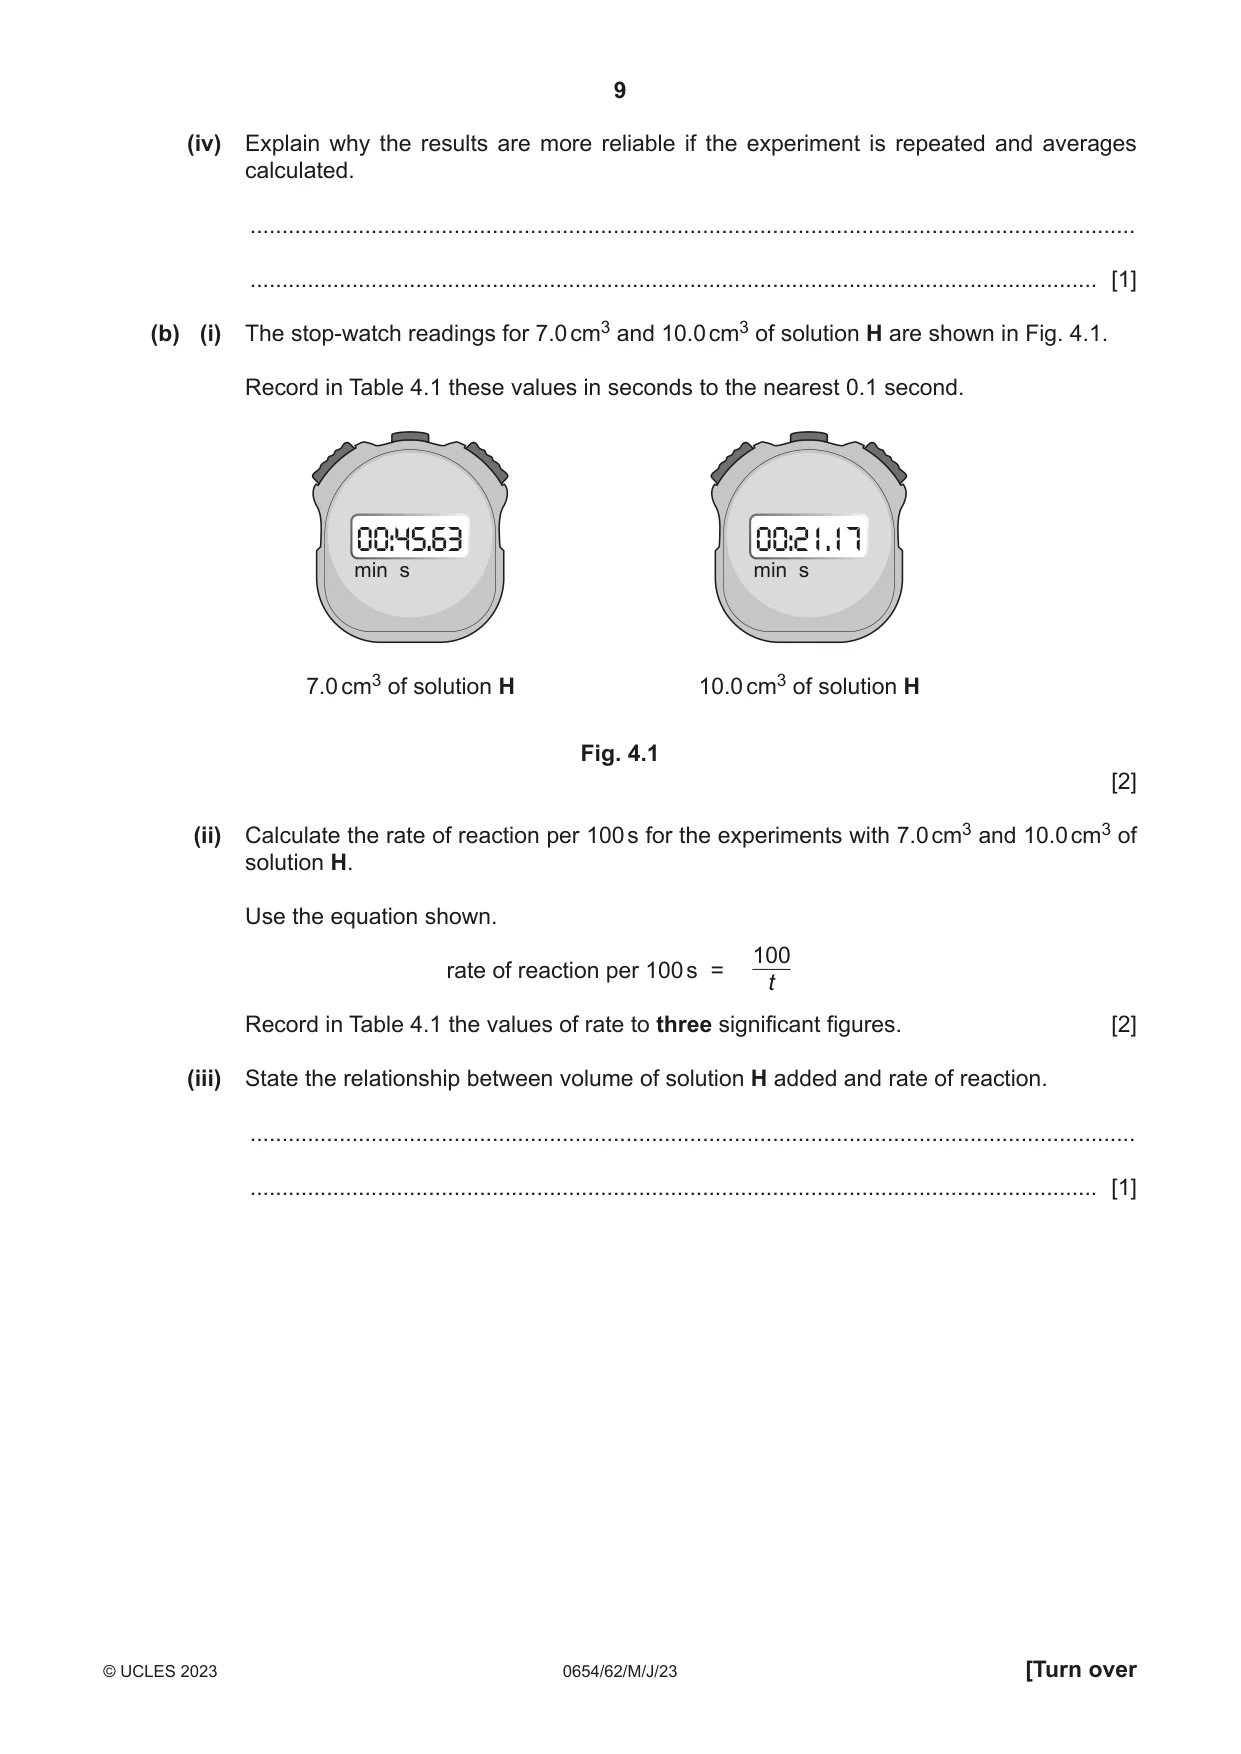
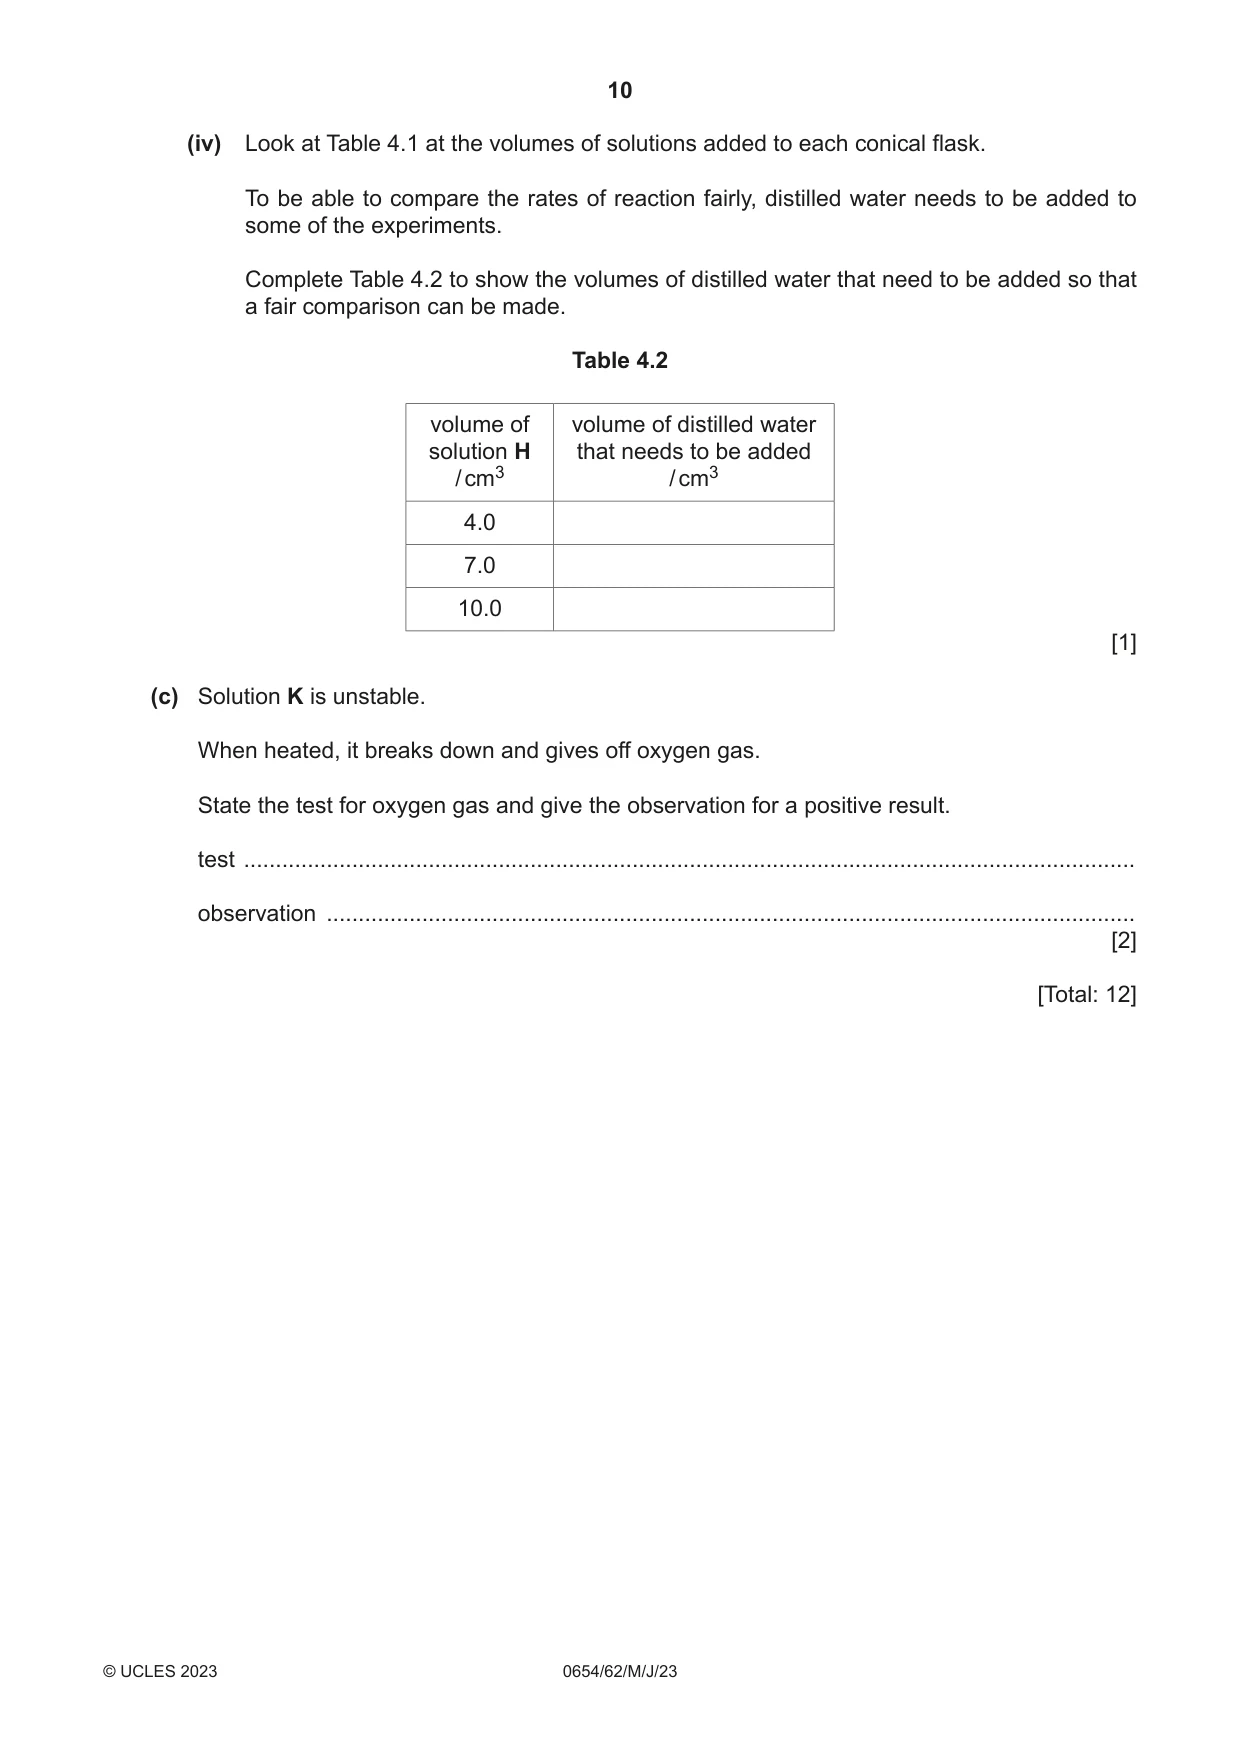
4 A student investigates the rate of reaction between solutions H and K. When solutions of H, K and starch are mixed together, a blue-black colour is seen after a period of time. When the volume of solution H is changed, the time taken for the blue-black colour to appear changes. (a) Procedure The student: • adds 4 cm3 of solution H into a conical flask • adds 5 drops of starch solution into the conical flask • adds 10 cm3 of solution K into the conical flask, swirls the flask and immediately starts a stop-watch • stops the stop-watch when the solution turns blue-black • records in Table 4.1 the time taken t in seconds to the nearest 0.1 second. The student repeats the procedure using the other volumes shown in Table 4.1. Table 4.1 volume of drops of volume of time taken t rate of reaction solution H starch solution K / s per 100 s / cm3 solution / cm3 4.0 5 10.0 82.3 1.22 7.0 5 10.0 10.0 5 10.0 (i) Suggest why the conical flask is swirled. ........................................................................................................................................... ..................................................................................................................................... [1] (ii) State the name of a piece of apparatus suitable for measuring the volume of solution H. ..................................................................................................................................... [1] (iii) The substance made when solution H and solution K react together turns the starch solution blue-black. Identify the substance made. ..................................................................................................................................... [1] (iv) Explain why the results are more reliable if the experiment is repeated and averages calculated. ........................................................................................................................................... ..................................................................................................................................... [1] (b) (i) The stop-watch readings for 7.0 cm3 and 10.0 cm3 of solution H are shown in Fig. 4.1. Record in Table 4.1 these values in seconds to the nearest 0.1 second. 00:45.63 00:21.17 min s min s 7.0 cm3 of solution H 10.0 cm3 of solution H Fig. 4.1 [2] (ii) Calculate the rate of reaction per 100 s for the experiments with 7.0 cm3 and 10.0 cm3 of solution H. Use the equation shown. 100 rate of reaction per 100 s = t Record in Table 4.1 the values of rate to three significant figures. [2] (iii) State the relationship between volume of solution H added and rate of reaction. ........................................................................................................................................... ..................................................................................................................................... [1] (iv) Look at Table 4.1 at the volumes of solutions added to each conical flask. To be able to compare the rates of reaction fairly, distilled water needs to be added to some of the experiments. Complete Table 4.2 to show the volumes of distilled water that need to be added so that a fair comparison can be made. Table 4.2 volume of volume of distilled water solution H that needs to be added / cm3 / cm3 4.0 7.0 10.0 [1] (c) Solution K is unstable. When heated, it breaks down and gives off oxygen gas. State the test for oxygen gas and give the observation for a positive result. test ............................................................................................................................................ observation ............................................................................................................................... [2] [Total: 12]
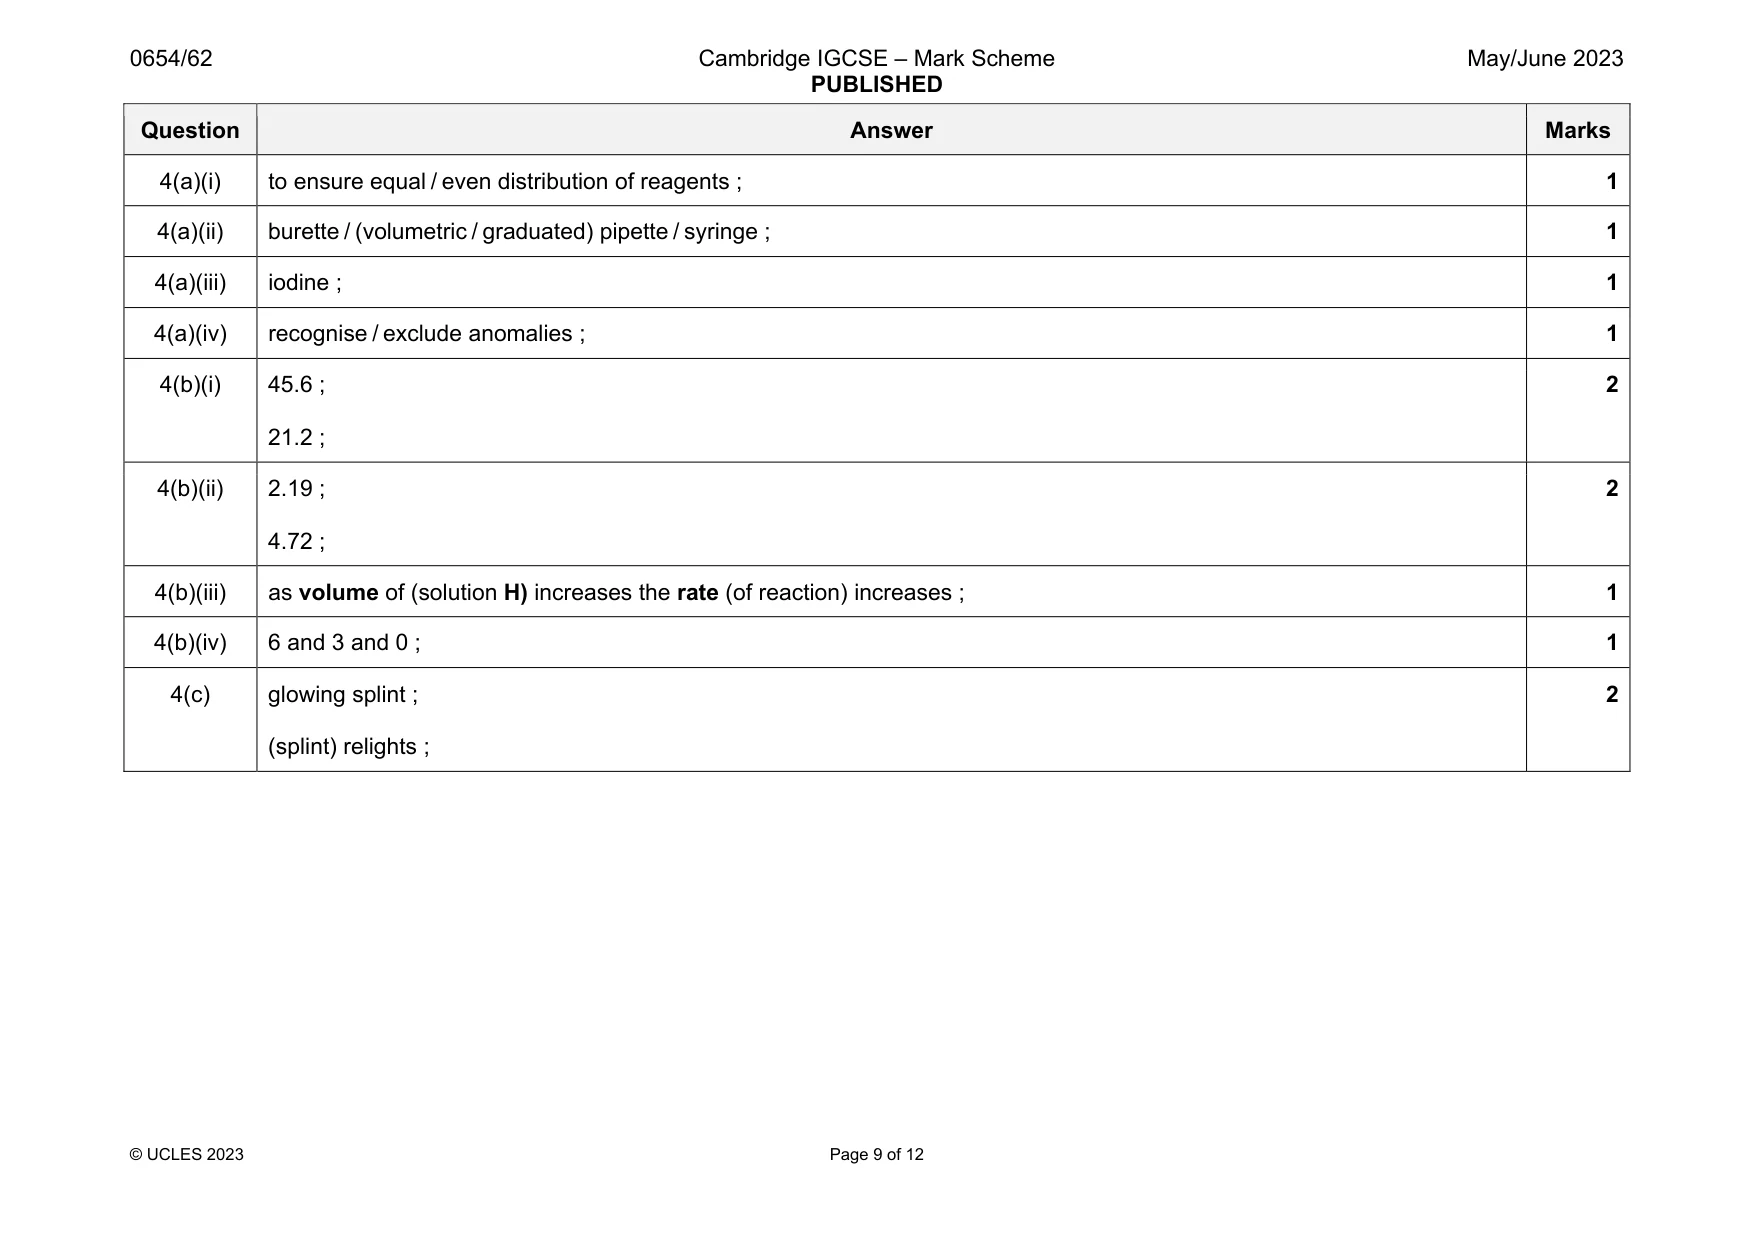
Mark scheme: 4(a)(i) to ensure equal / even distribution of reagents ; 1 4(a)(ii) burette / (volumetric / graduated) pipette / syringe ; 1 4(a)(iii) iodine ; 1 4(a)(iv) recognise / exclude anomalies ; 1 4(b)(i) 45.6 ; 21.2 ; 2 4(b)(ii) 2.19 ; 4.72 ; 2 4(b)(iii) as volume of (solution H) increases the rate (of reaction) increases ; 1 4(b)(iv) 6 and 3 and 0 ; 1 4(c) glowing splint ; (splint) relights ; 2
Q5 · A student identifies the ions present in solution L and in solution M
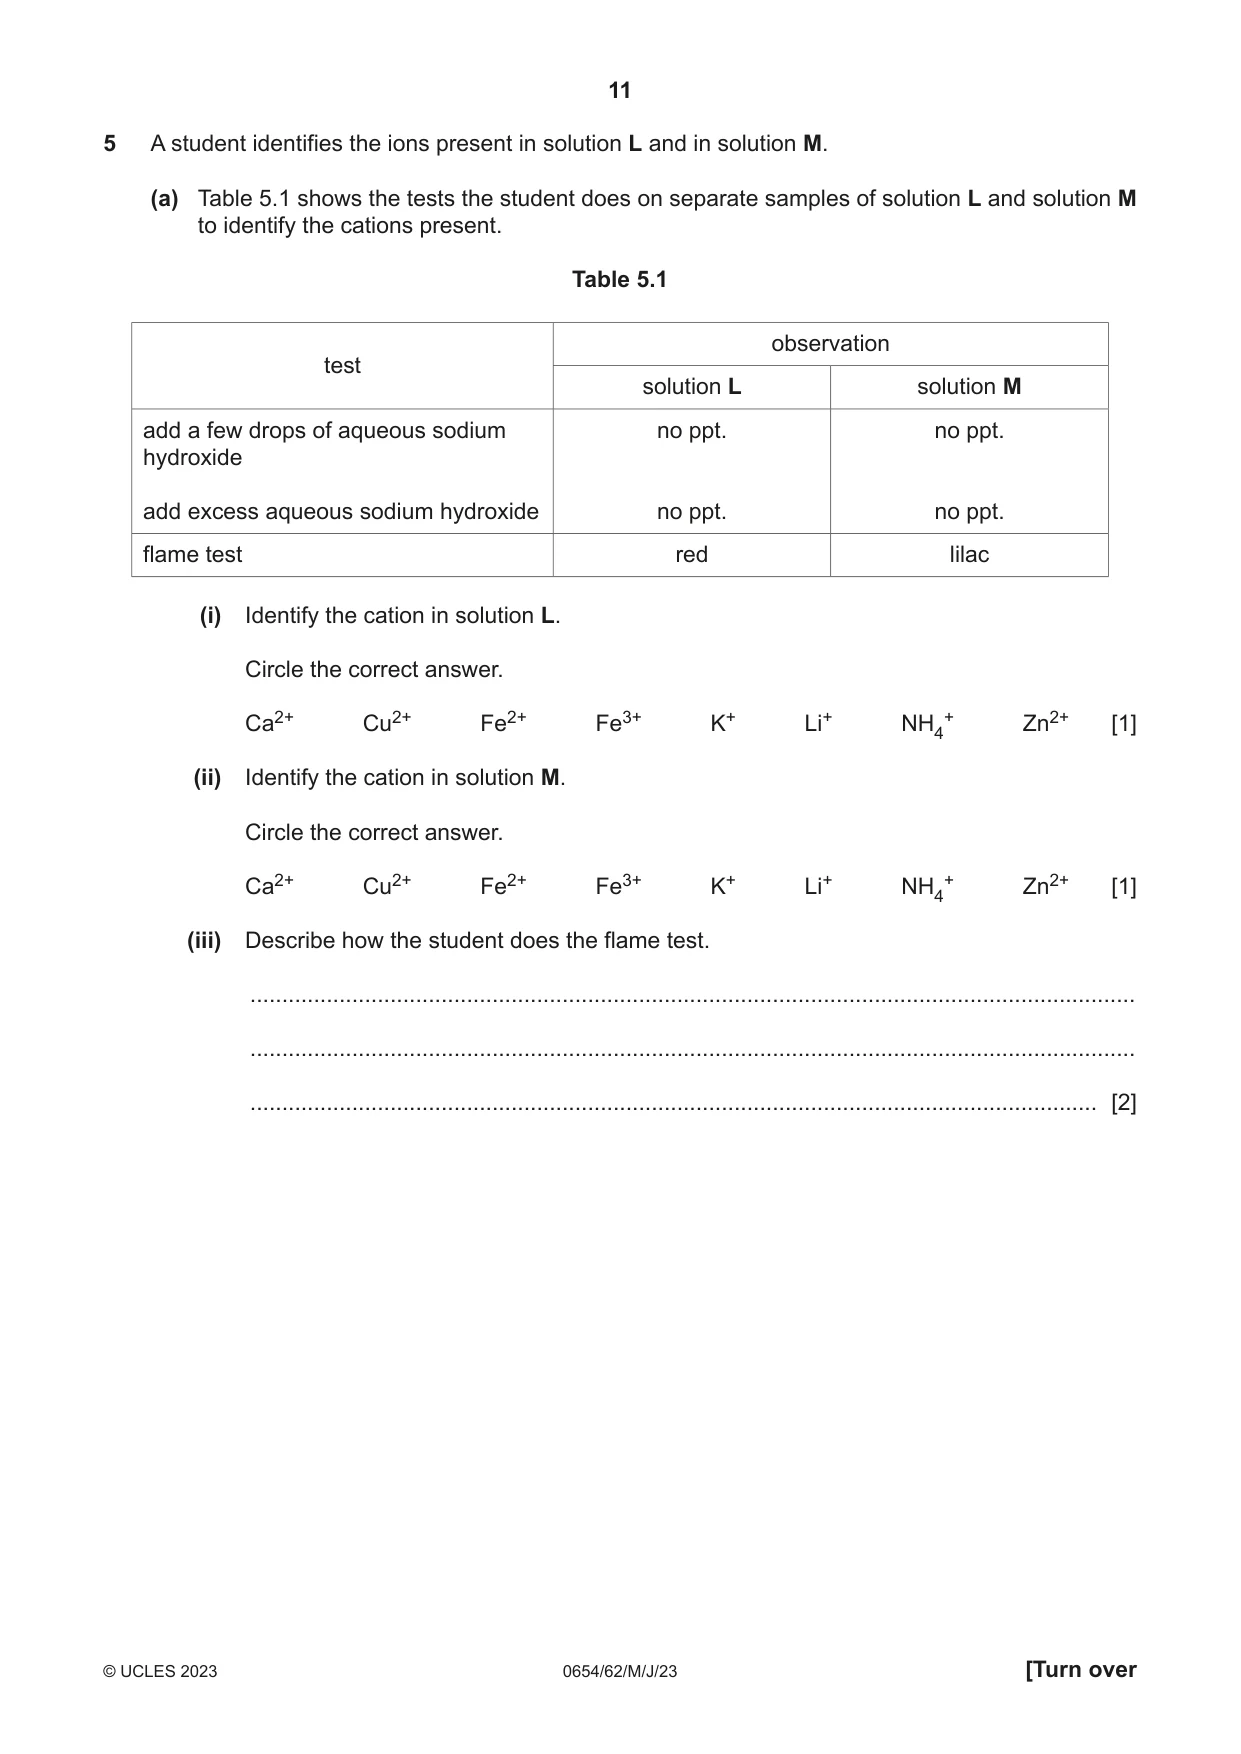
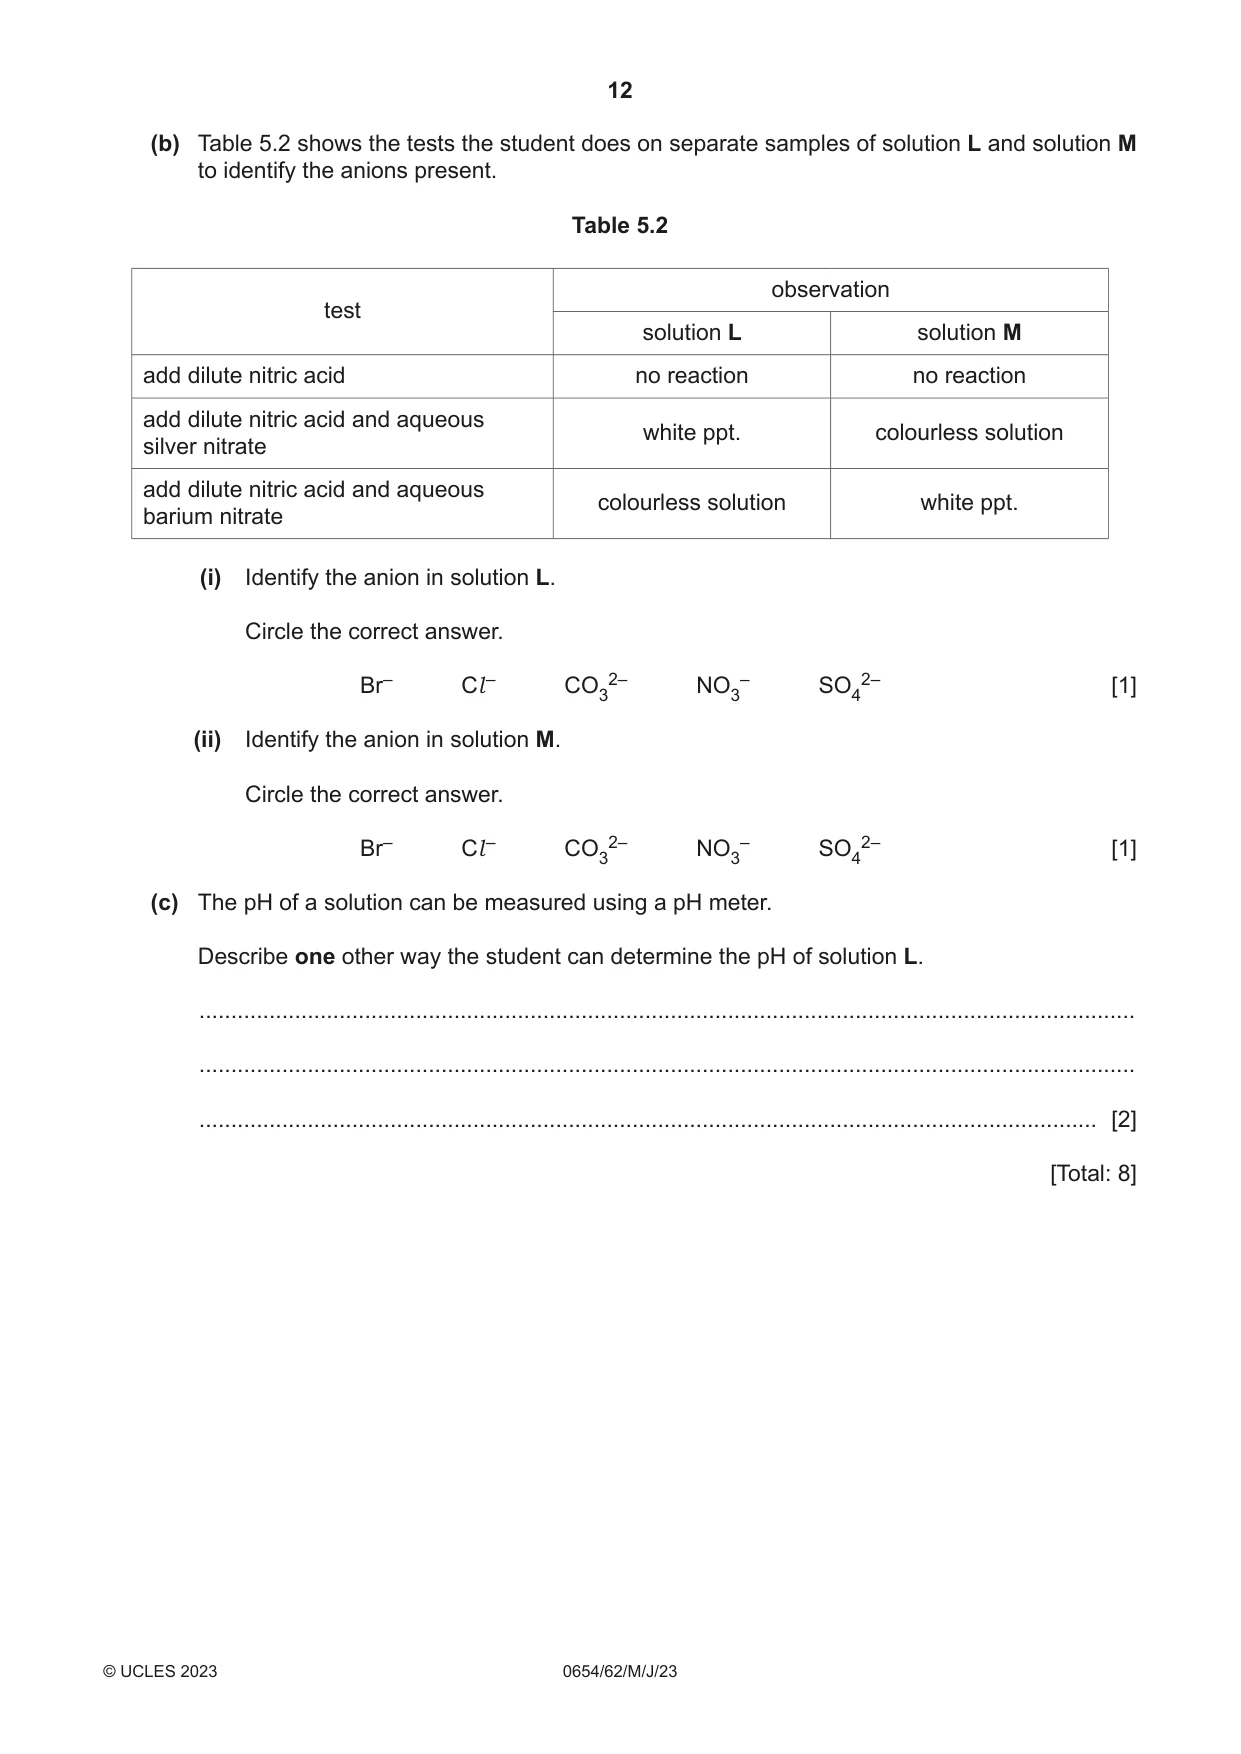
5 A student identifies the ions present in solution L and in solution M. (a) Table 5.1 shows the tests the student does on separate samples of solution L and solution M to identify the cations present. Table 5.1 observation test solution L solution M add a few drops of aqueous sodium no ppt. no ppt. hydroxide add excess aqueous sodium hydroxide no ppt. no ppt. flame test red lilac (i) Identify the cation in solution L. Circle the correct answer. Ca2+ Cu2+ Fe2+ Fe3+ K+ Li+ NH4+ Zn2+ [1] (ii) Identify the cation in solution M. Circle the correct answer. Ca2+ Cu2+ Fe2+ Fe3+ K+ Li+ NH4+ Zn2+ [1] (iii) Describe how the student does the flame test. ........................................................................................................................................... ........................................................................................................................................... ..................................................................................................................................... [2] (b) Table 5.2 shows the tests the student does on separate samples of solution L and solution M to identify the anions present. Table 5.2 observation test solution L solution M add dilute nitric acid no reaction no reaction add dilute nitric acid and aqueous white ppt. colourless solutionsilver nitrate add dilute nitric acid and aqueous colourless solution white ppt.barium nitrate (i) Identify the anion in solution L. Circle the correct answer. Br– Cl – CO32– NO3– SO42– [1] (ii) Identify the anion in solution M. Circle the correct answer. Br– Cl – CO32– NO3– SO42– [1] (c) The pH of a solution can be measured using a pH meter. Describe one other way the student can determine the pH of solution L. ................................................................................................................................................... ................................................................................................................................................... ............................................................................................................................................. [2] [Total: 8]
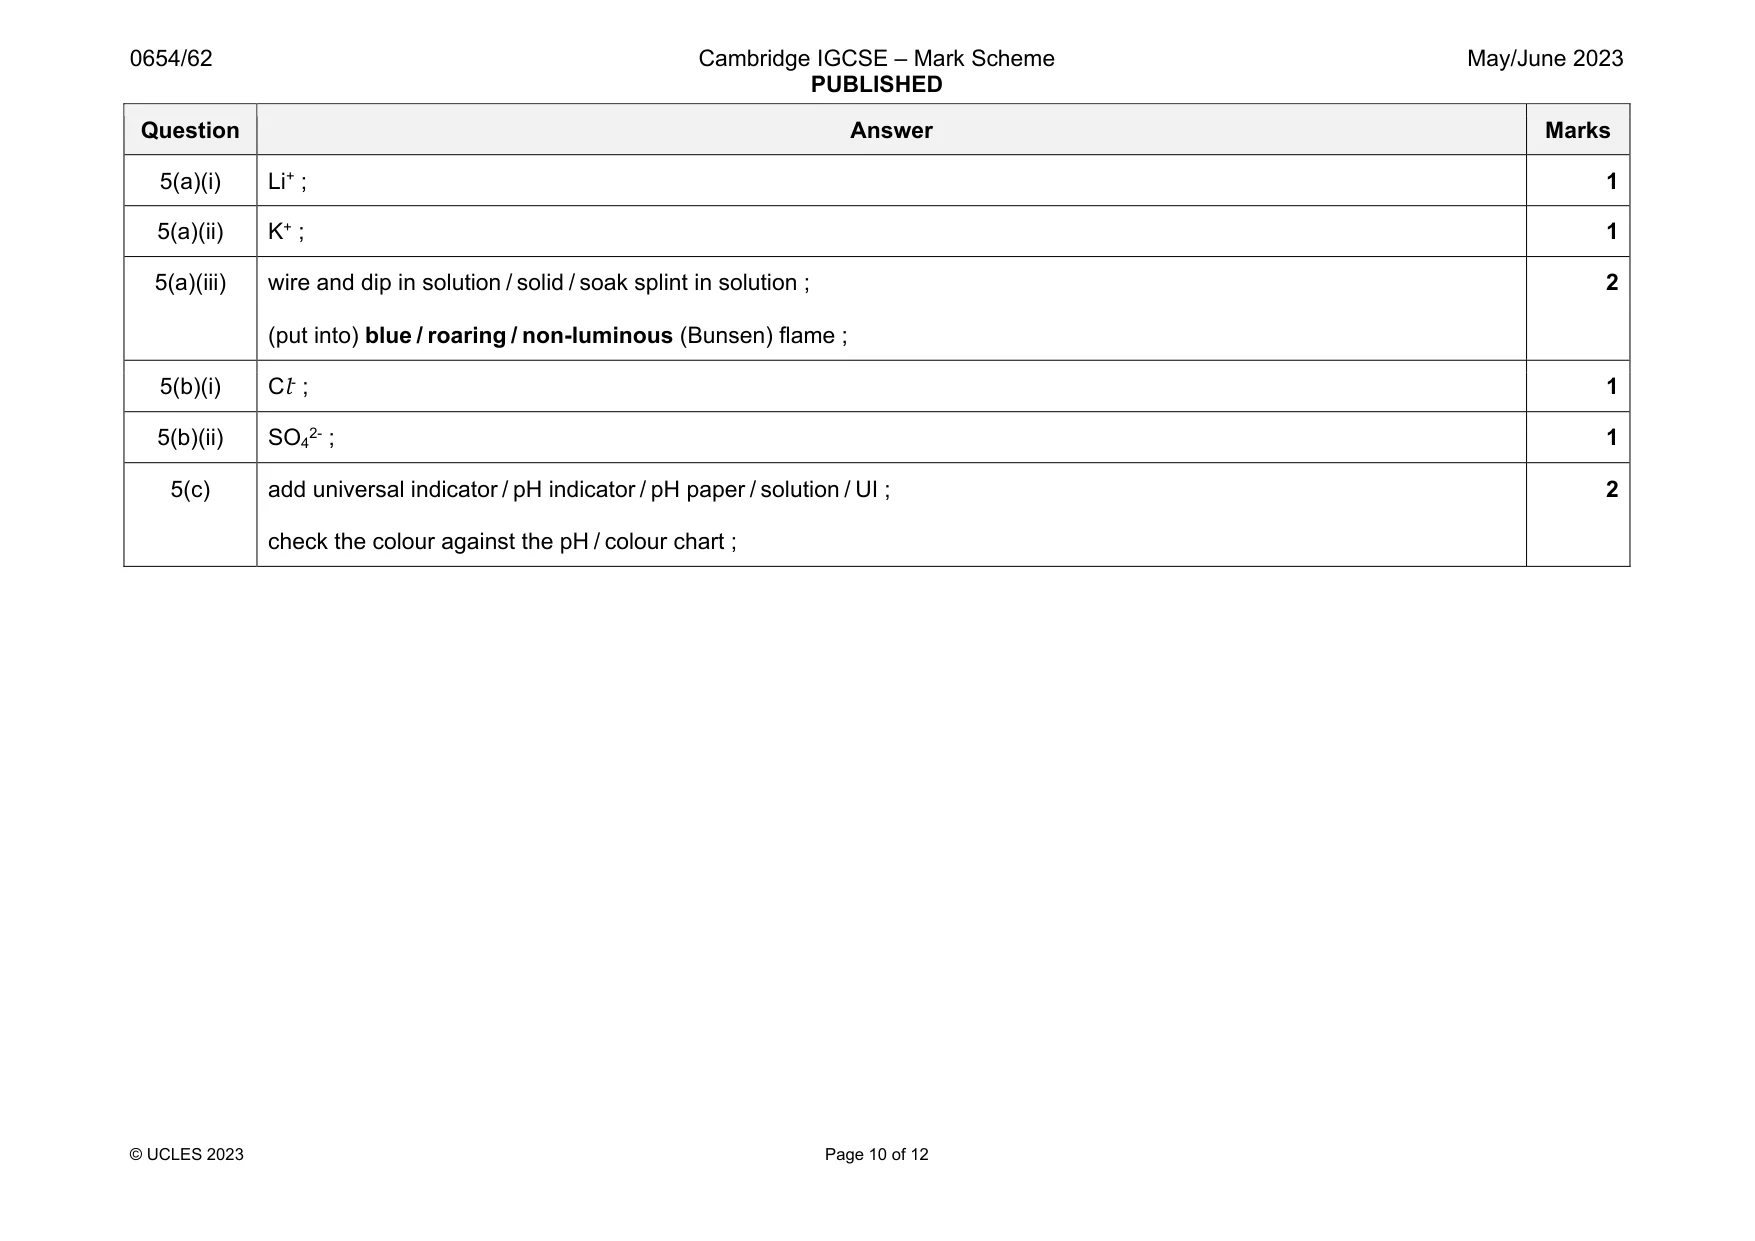
Mark scheme: 5(a)(i) Li+ ; 1 5(a)(ii) K+ ; 1 5(a)(iii) wire and dip in solution / solid / soak splint in solution ; (put into) blue / roaring / non-luminous (Bunsen) flame ; 2 5(b)(i) Cl- ; 1 5(b)(ii) SO42- ; 1 5(c) add universal indicator / pH indicator / pH paper / solution / UI ; check the colour against the pH / colour chart ; 2
Q6 · A student measures the mass M of an object using a balancing method
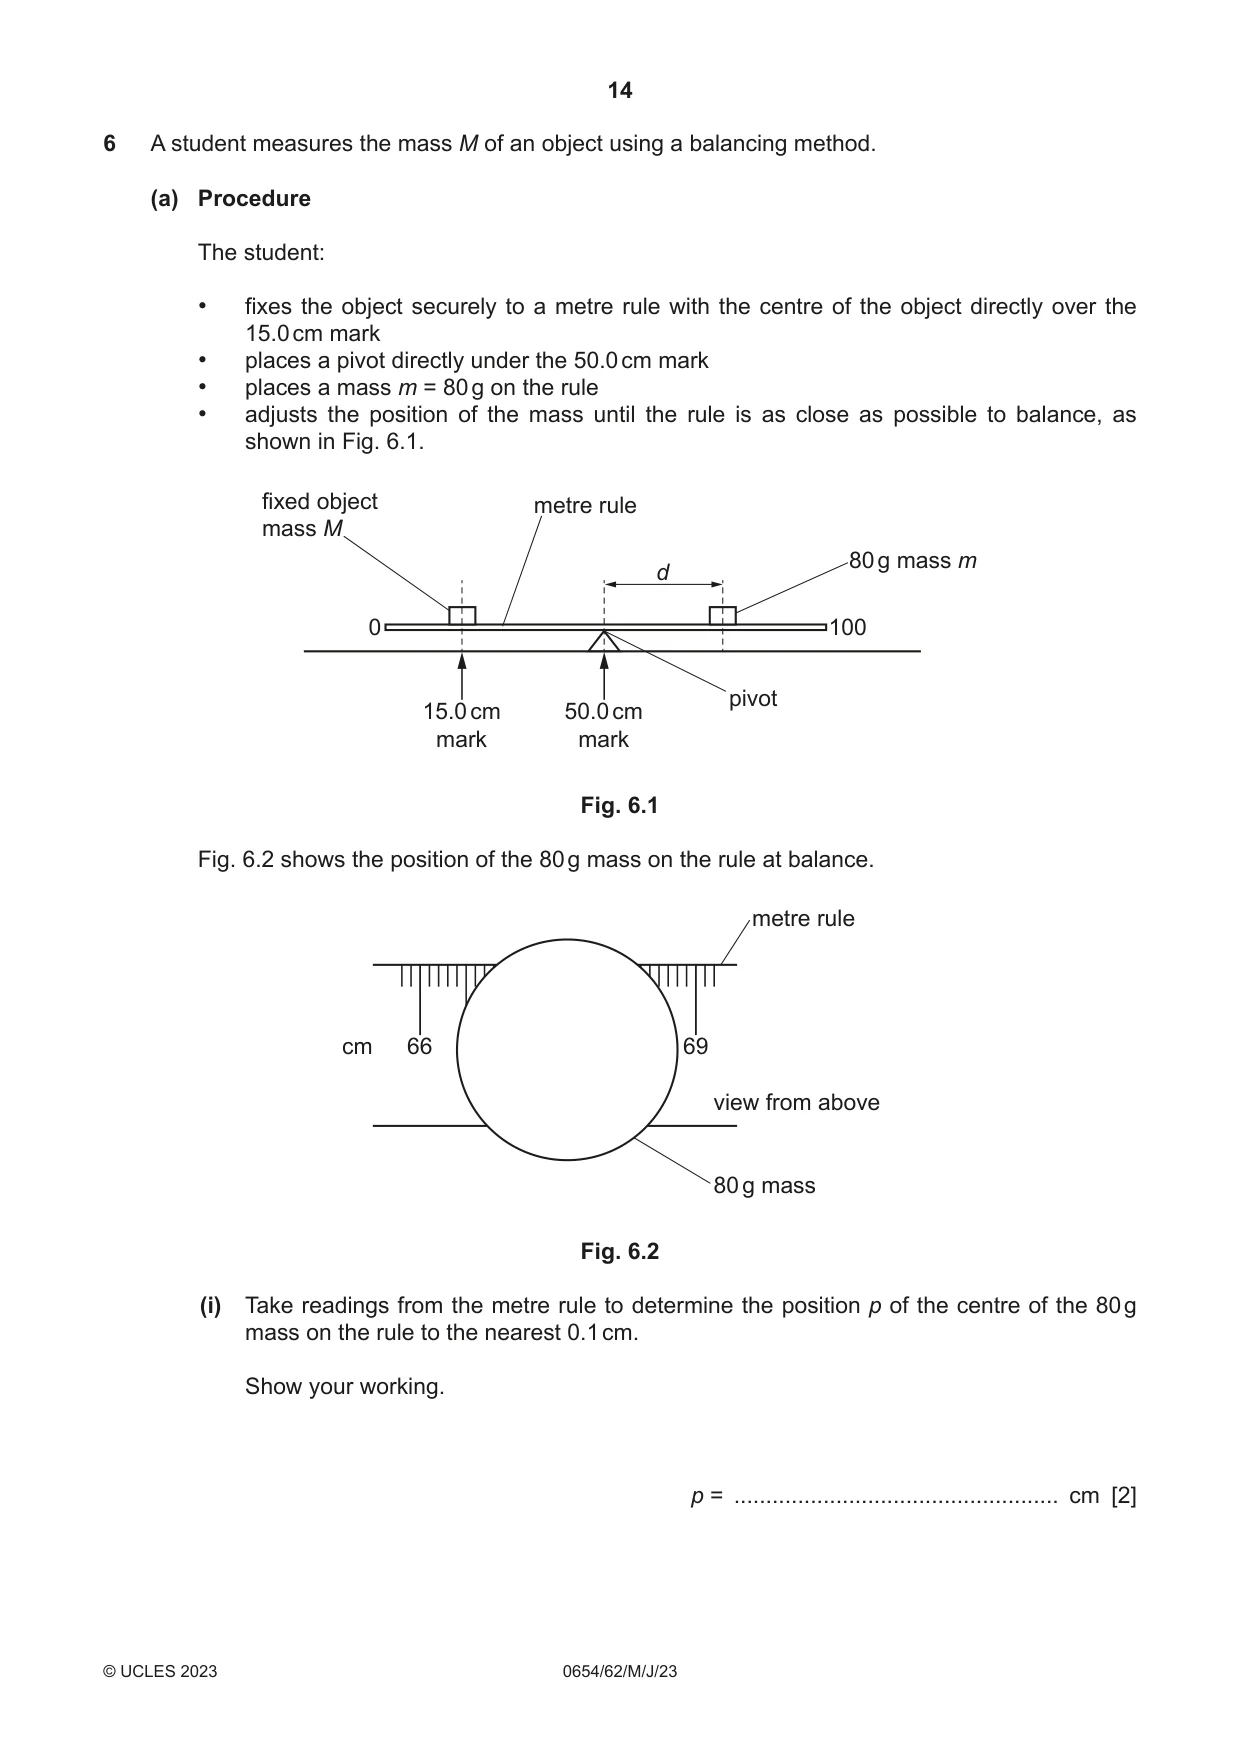
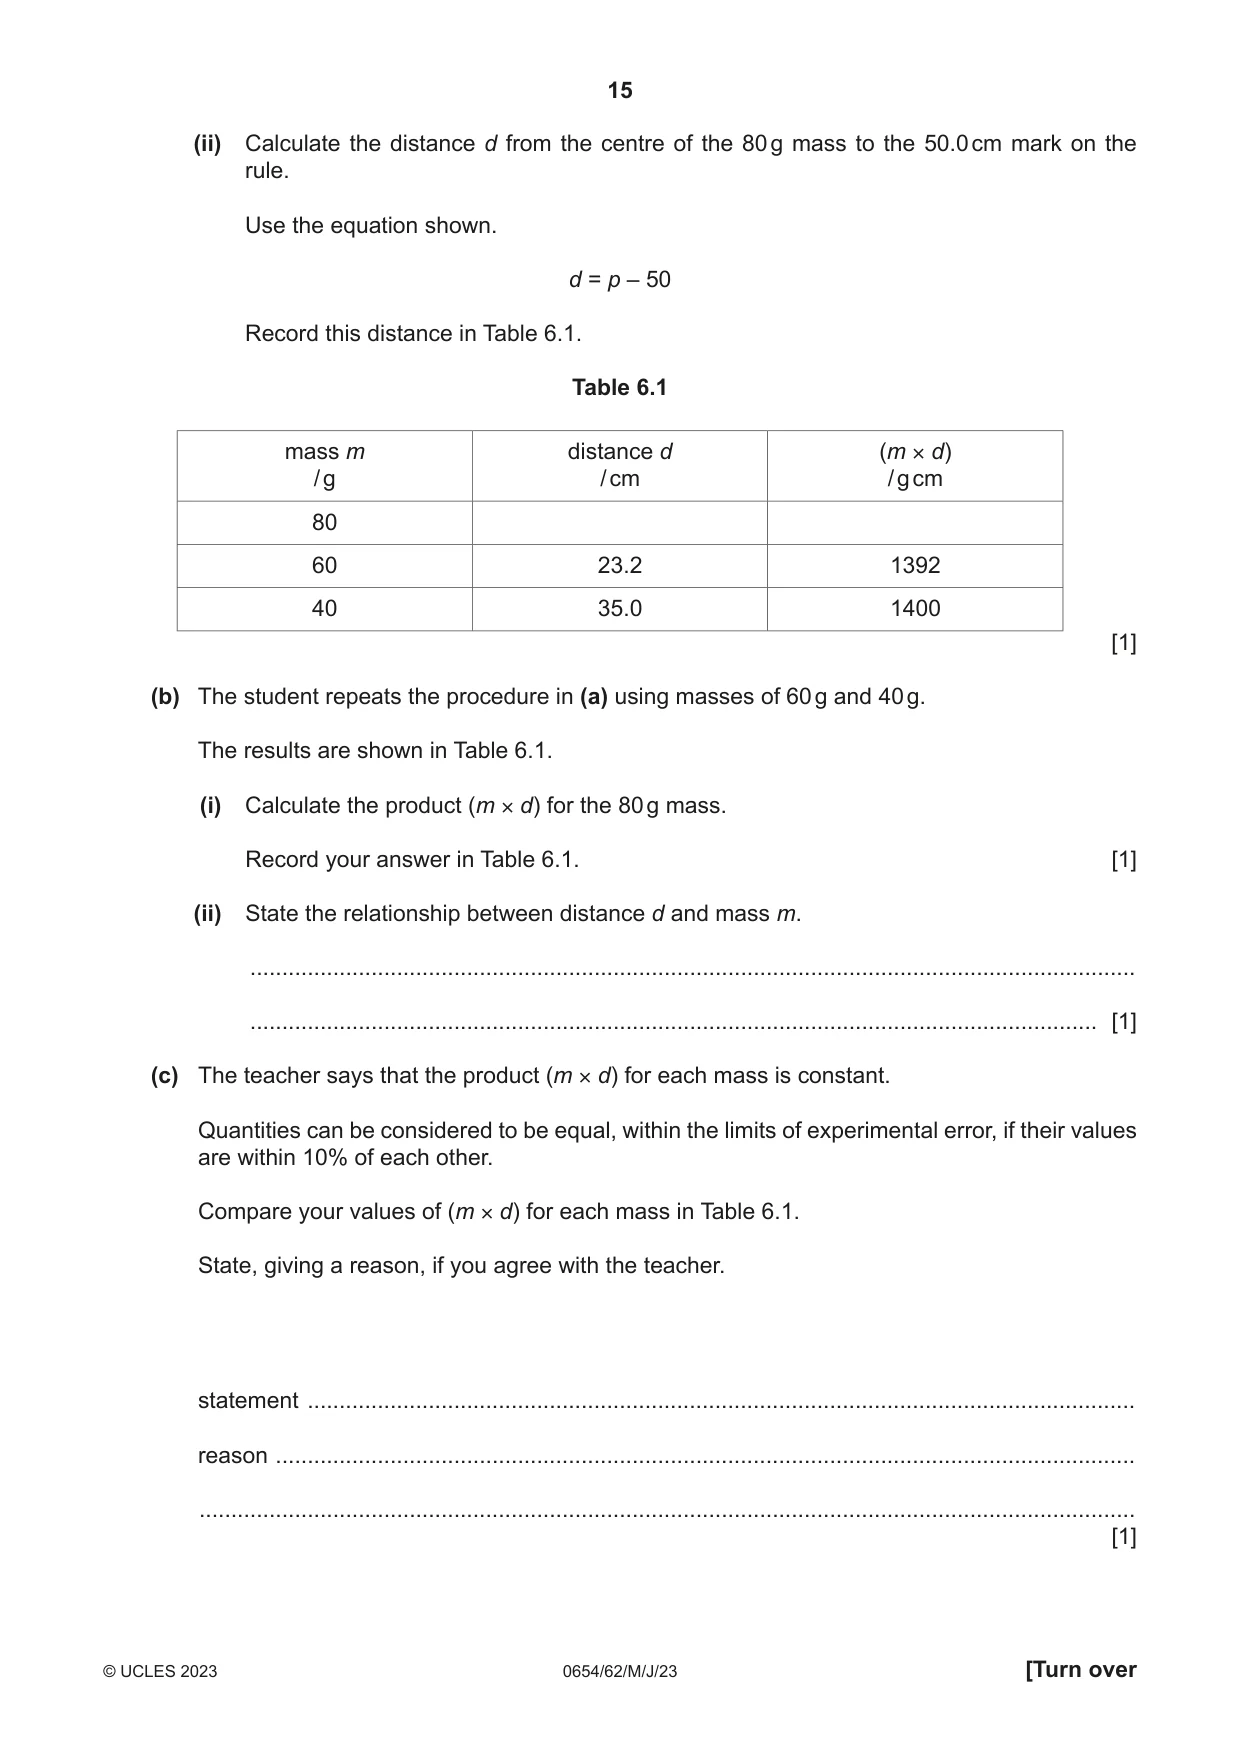
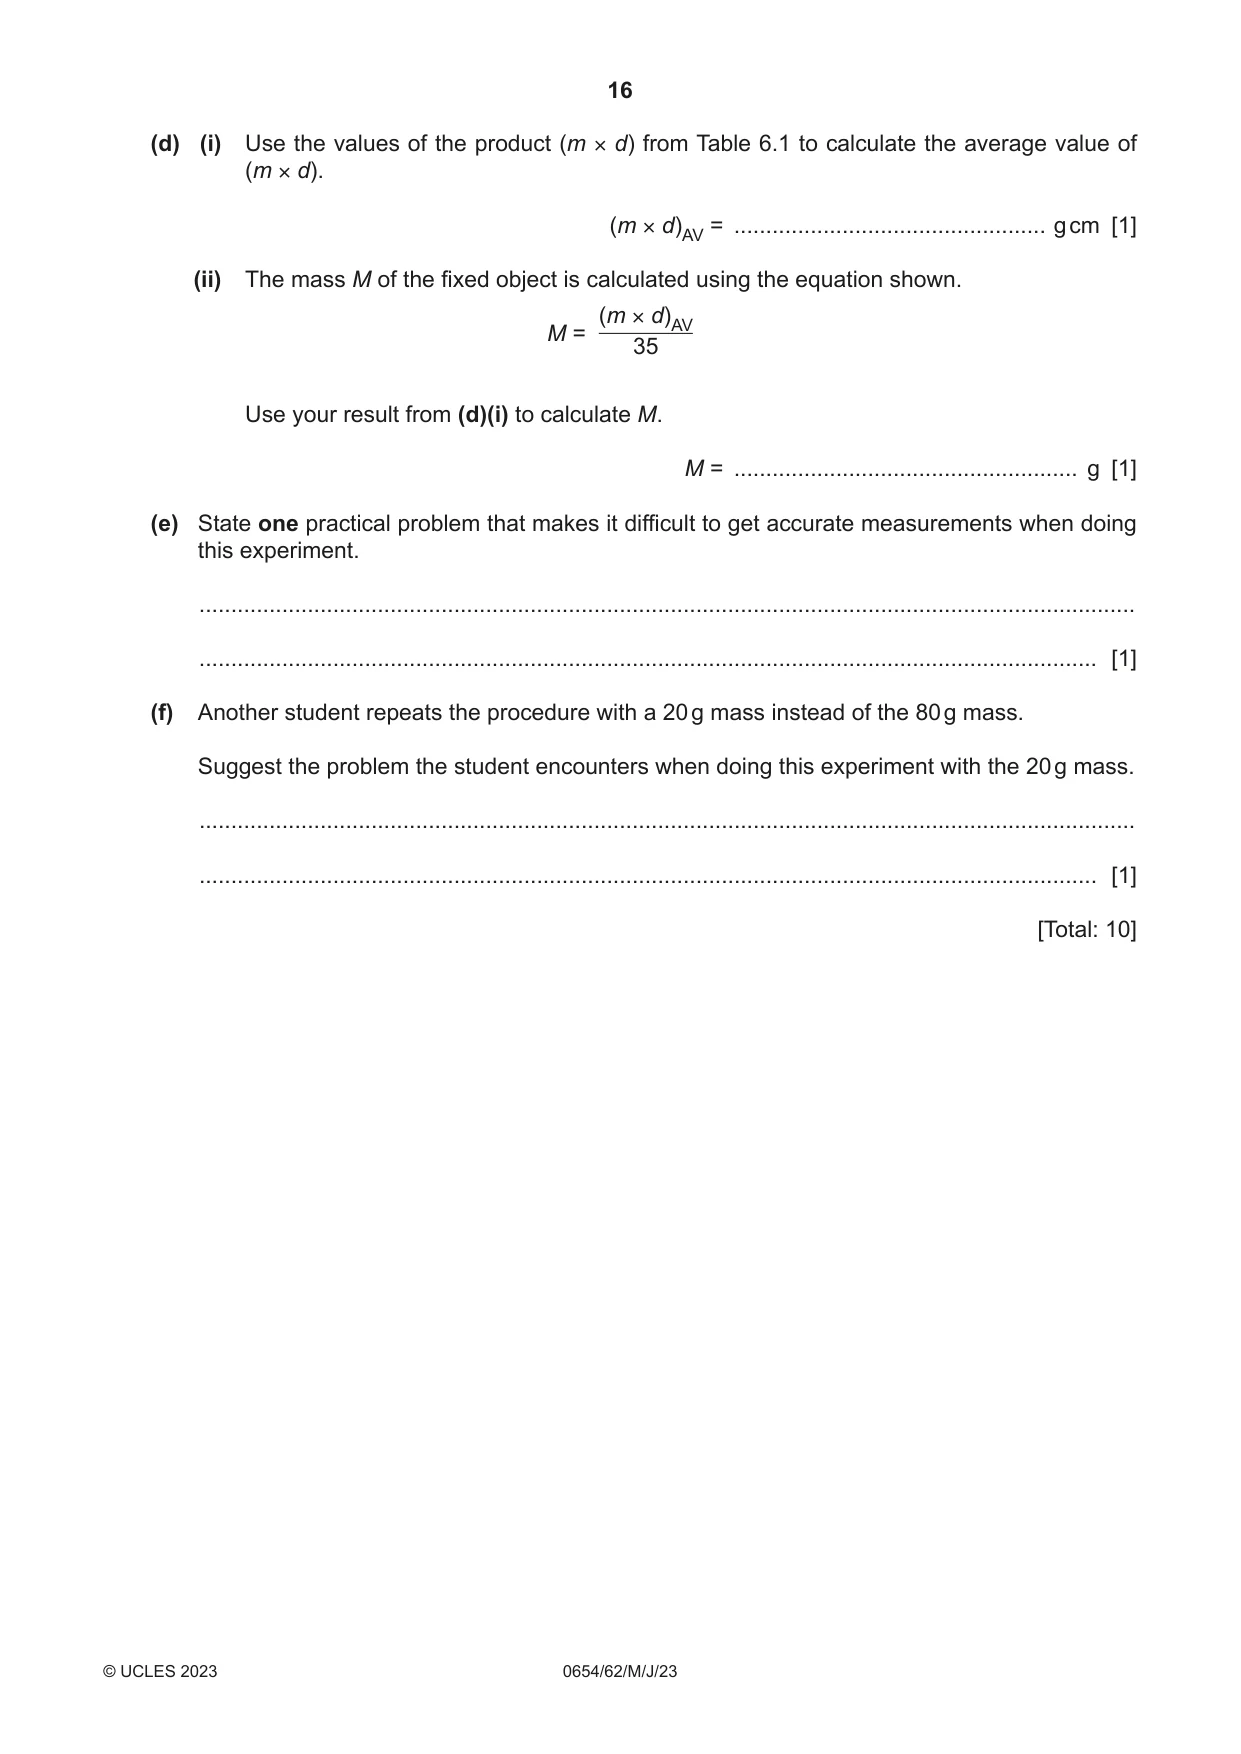
6 A student measures the mass M of an object using a balancing method. (a) Procedure The student: • fixes the object securely to a metre rule with the centre of the object directly over the 15.0 cm mark • places a pivot directly under the 50.0 cm mark • places a mass m = 80 g on the rule • adjusts the position of the mass until the rule is as close as possible to balance, as shown in Fig. 6.1. fixed object metre rule mass M 80 g mass m d 0 100 pivot 15.0 cm 50.0 cm mark mark Fig. 6.1 Fig. 6.2 shows the position of the 80 g mass on the rule at balance. metre rule cm 66 69 view from above 80 g mass Fig. 6.2 (i) Take readings from the metre rule to determine the position p of the centre of the 80 g mass on the rule to the nearest 0.1 cm. Show your working. p = ................................................... cm [2] (ii) Calculate the distance d from the centre of the 80 g mass to the 50.0 cm mark on the rule. Use the equation shown. d = p – 50 Record this distance in Table 6.1. Table 6.1 mass m distance d (m × d) / g / cm / g cm 80 60 23.2 1392 40 35.0 1400 [1] (b) The student repeats the procedure in (a) using masses of 60 g and 40 g. The results are shown in Table 6.1. (i) Calculate the product (m × d) for the 80 g mass. Record your answer in Table 6.1. [1] (ii) State the relationship between distance d and mass m. ........................................................................................................................................... ..................................................................................................................................... [1] (c) The teacher says that the product (m × d) for each mass is constant. Quantities can be considered to be equal, within the limits of experimental error, if their values are within 10% of each other. Compare your values of (m × d) for each mass in Table 6.1. State, giving a reason, if you agree with the teacher. statement .................................................................................................................................. reason ....................................................................................................................................... ................................................................................................................................................... [1] (d) (i) Use the values of the product (m × d) from Table 6.1 to calculate the average value of (m × d). (m × d)AV = ................................................. g cm [1] (ii) The mass M of the fixed object is calculated using the equation shown. (m × d)AV M = 35 Use your result from (d)(i) to calculate M. M = ...................................................... g [1] (e) State one practical problem that makes it difficult to get accurate measurements when doing this experiment. ................................................................................................................................................... ............................................................................................................................................. [1] (f) Another student repeats the procedure with a 20 g mass instead of the 80 g mass. Suggest the problem the student encounters when doing this experiment with the 20 g mass. ................................................................................................................................................... ............................................................................................................................................. [1] [Total: 10]
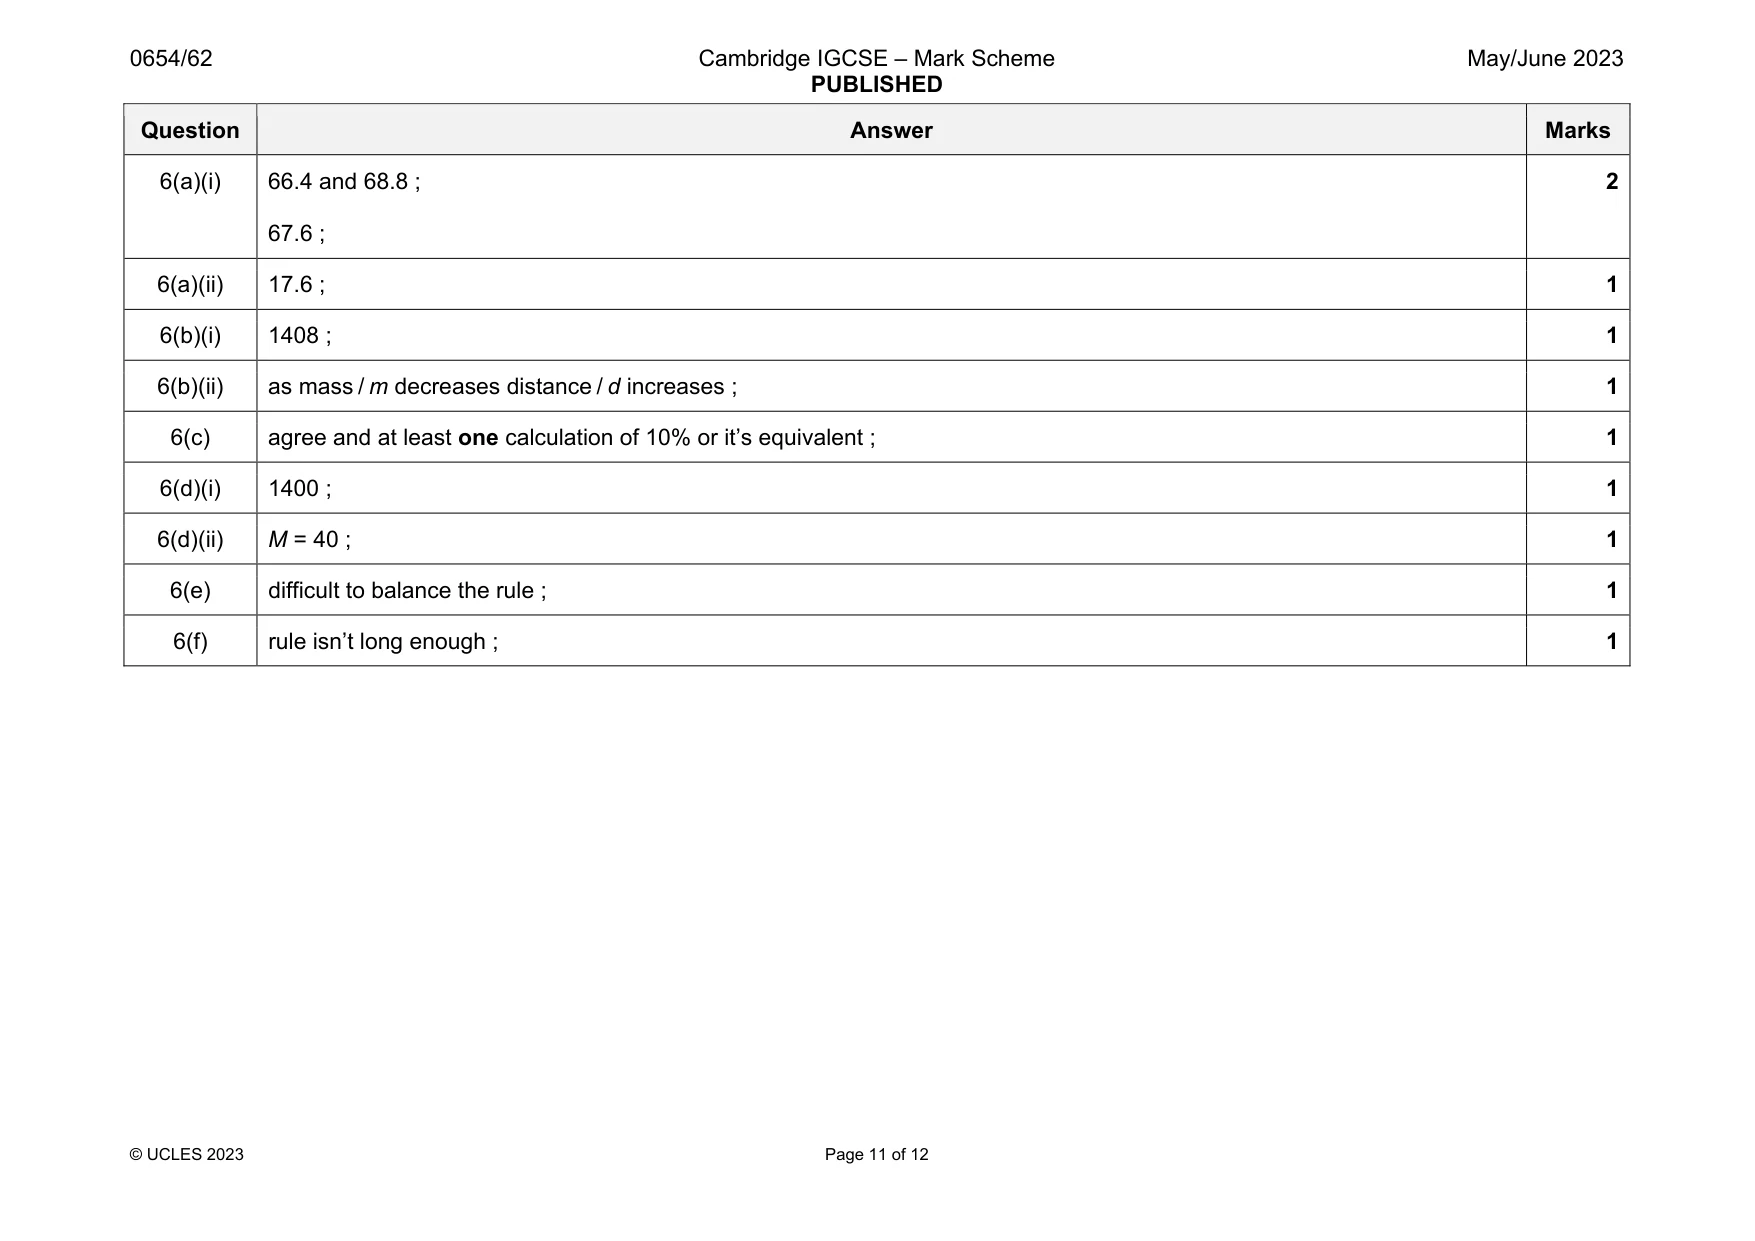
Mark scheme: 6(a)(i) 66.4 and 68.8 ; 67.6 ; 2 6(a)(ii) 17.6 ; 1 6(b)(i) 1408 ; 1 6(b)(ii) as mass / m decreases distance / d increases ; 1 6(c) agree and at least one calculation of 10% or it’s equivalent ; 1 6(d)(i) 1400 ; 1 6(d)(ii) M = 40 ; 1 6(e) difficult to balance the rule ; 1 6(f) rule isn’t long enough ; 1
Q7 · A student investigates the image formed by a convex lens
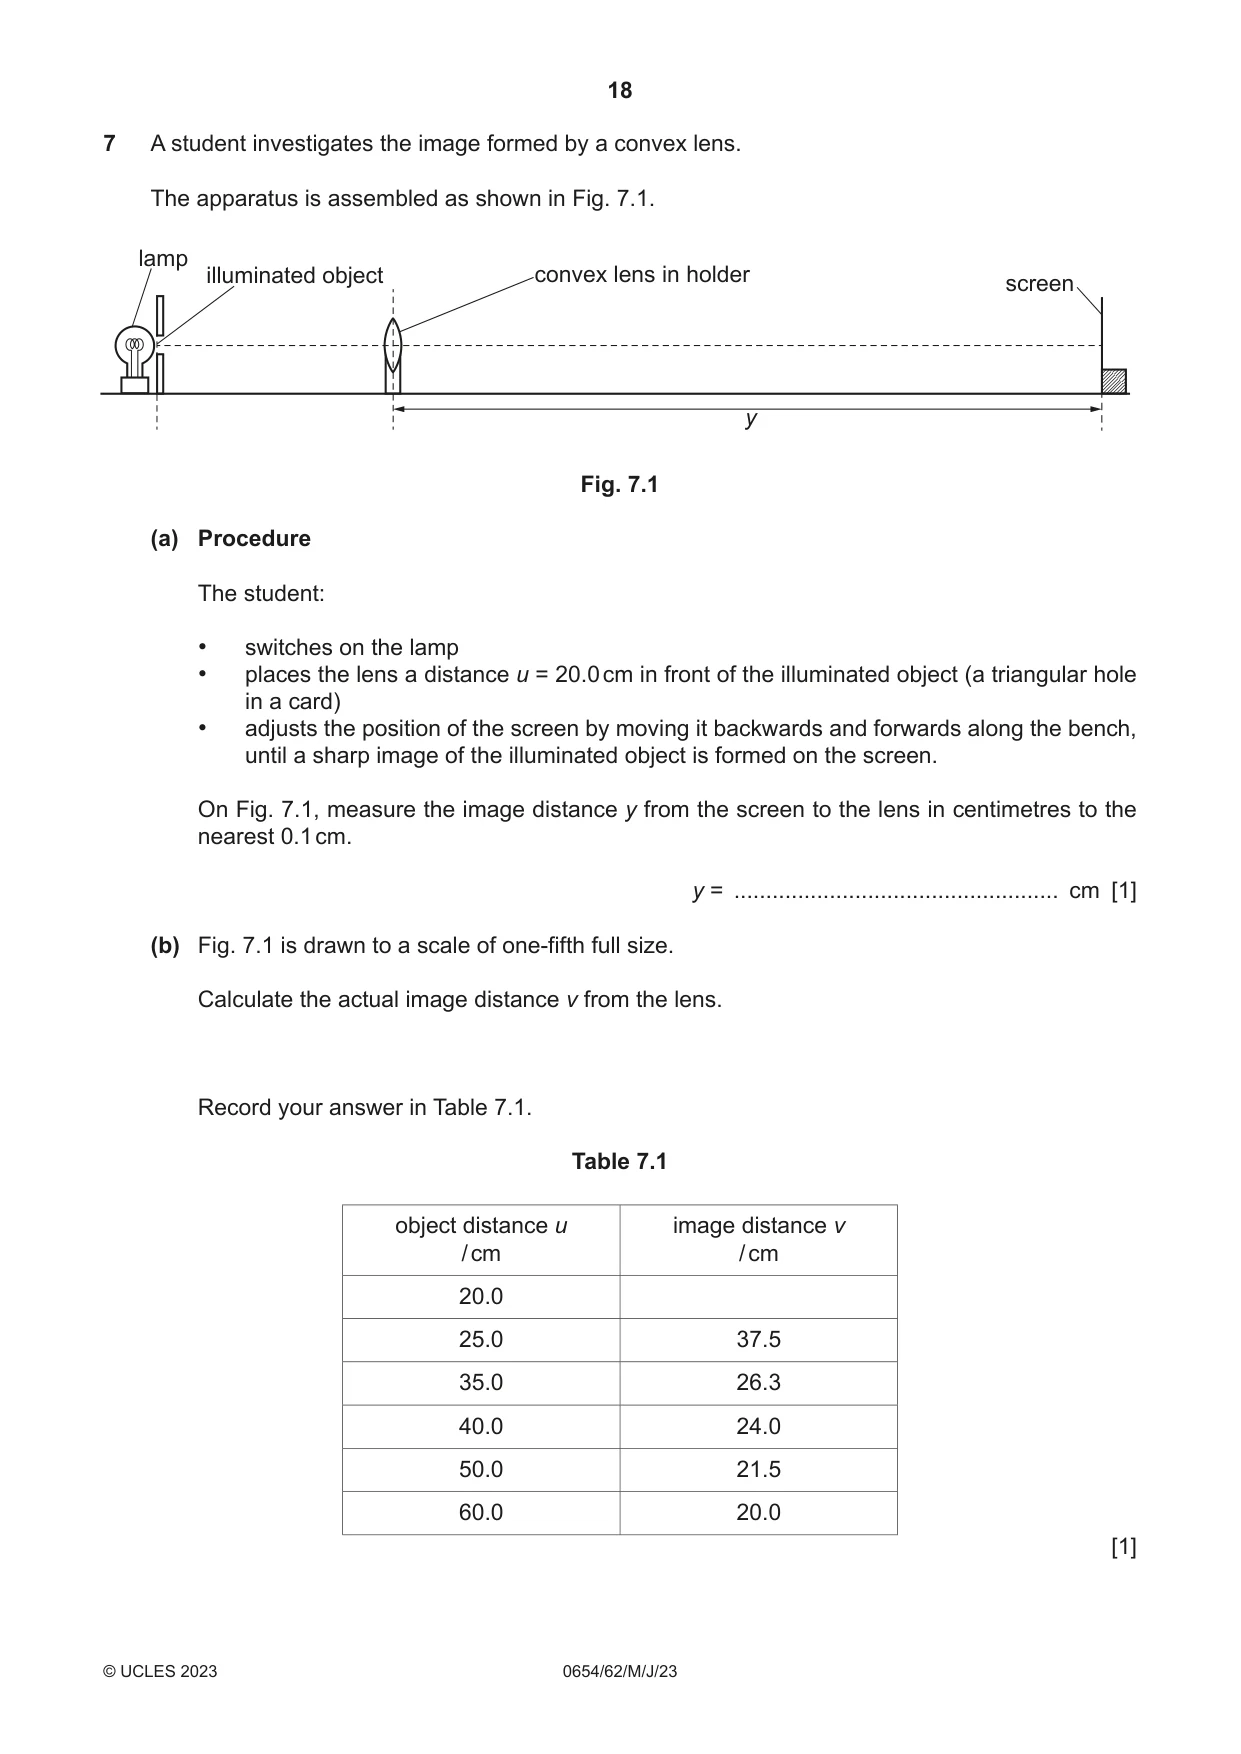
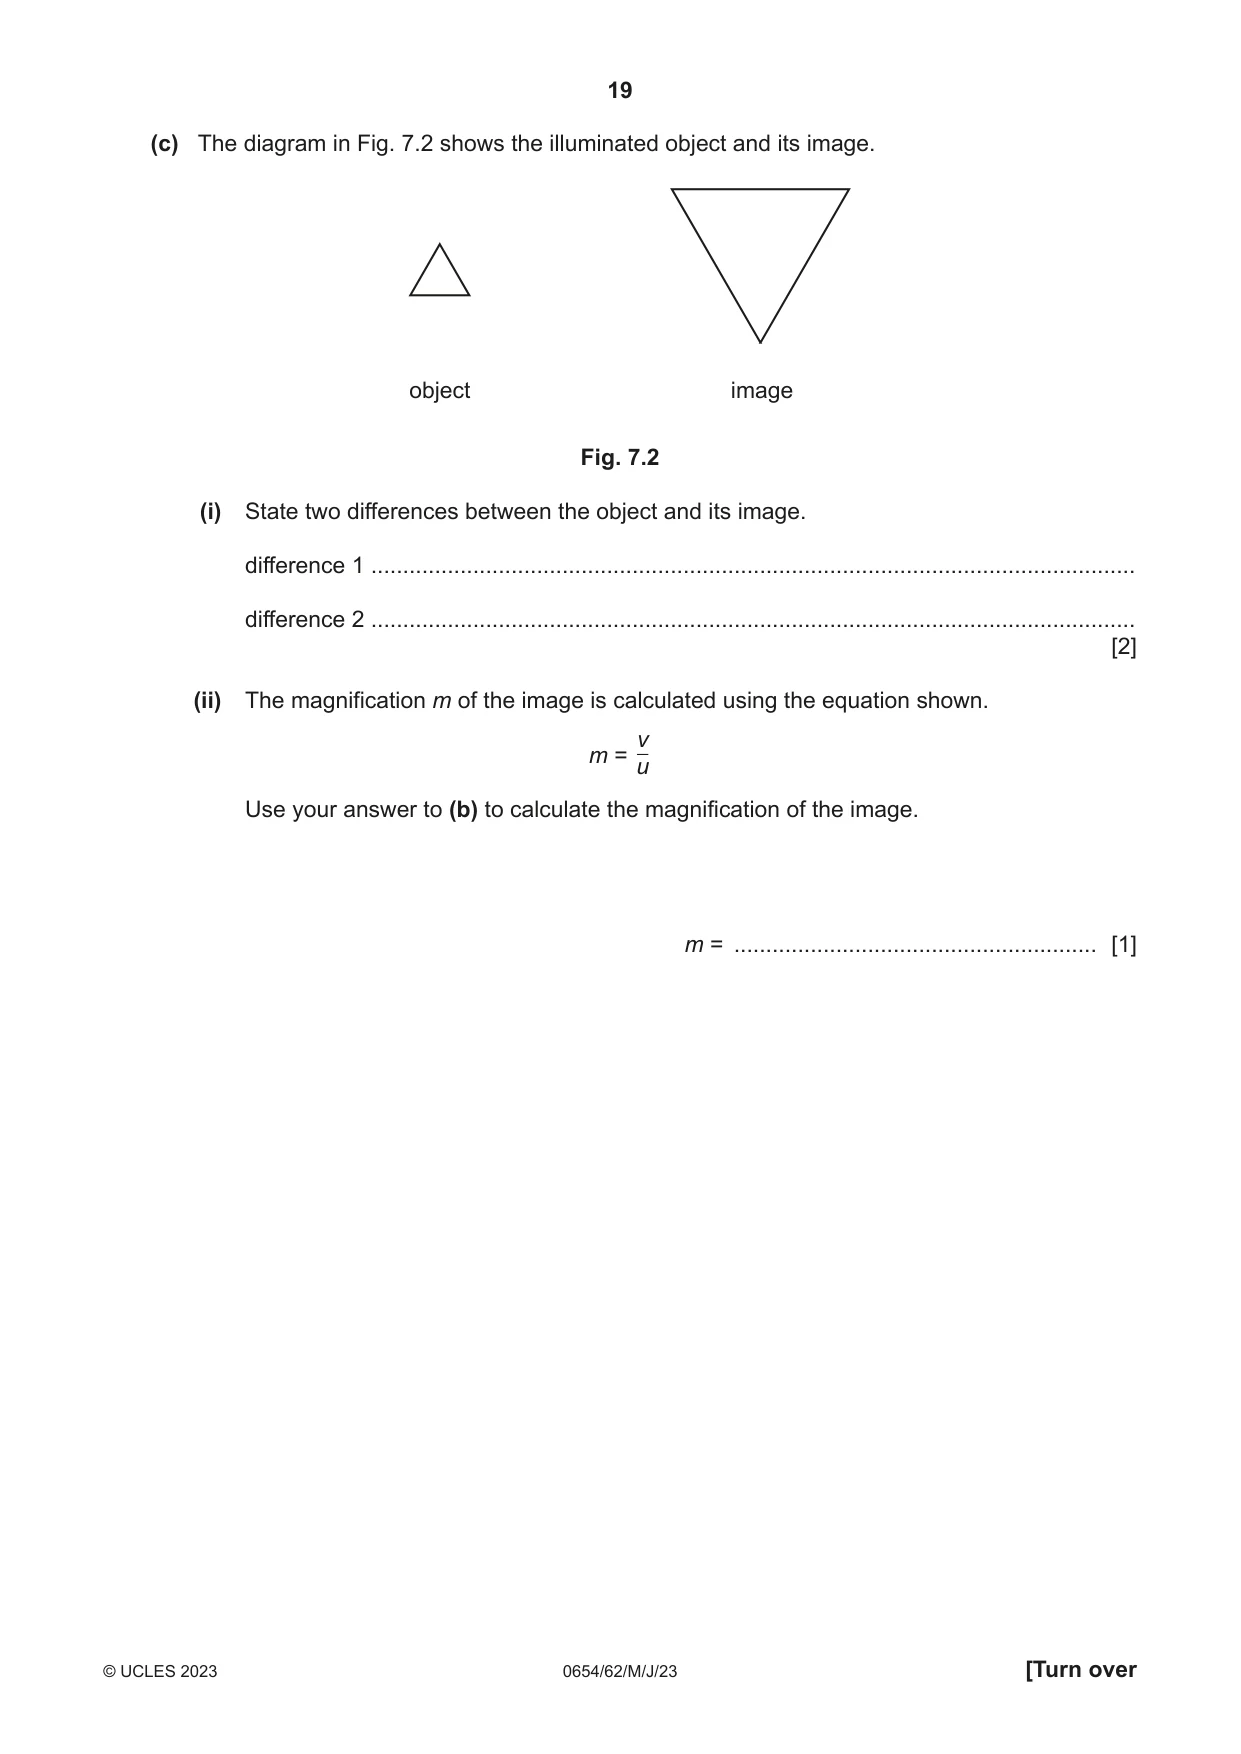
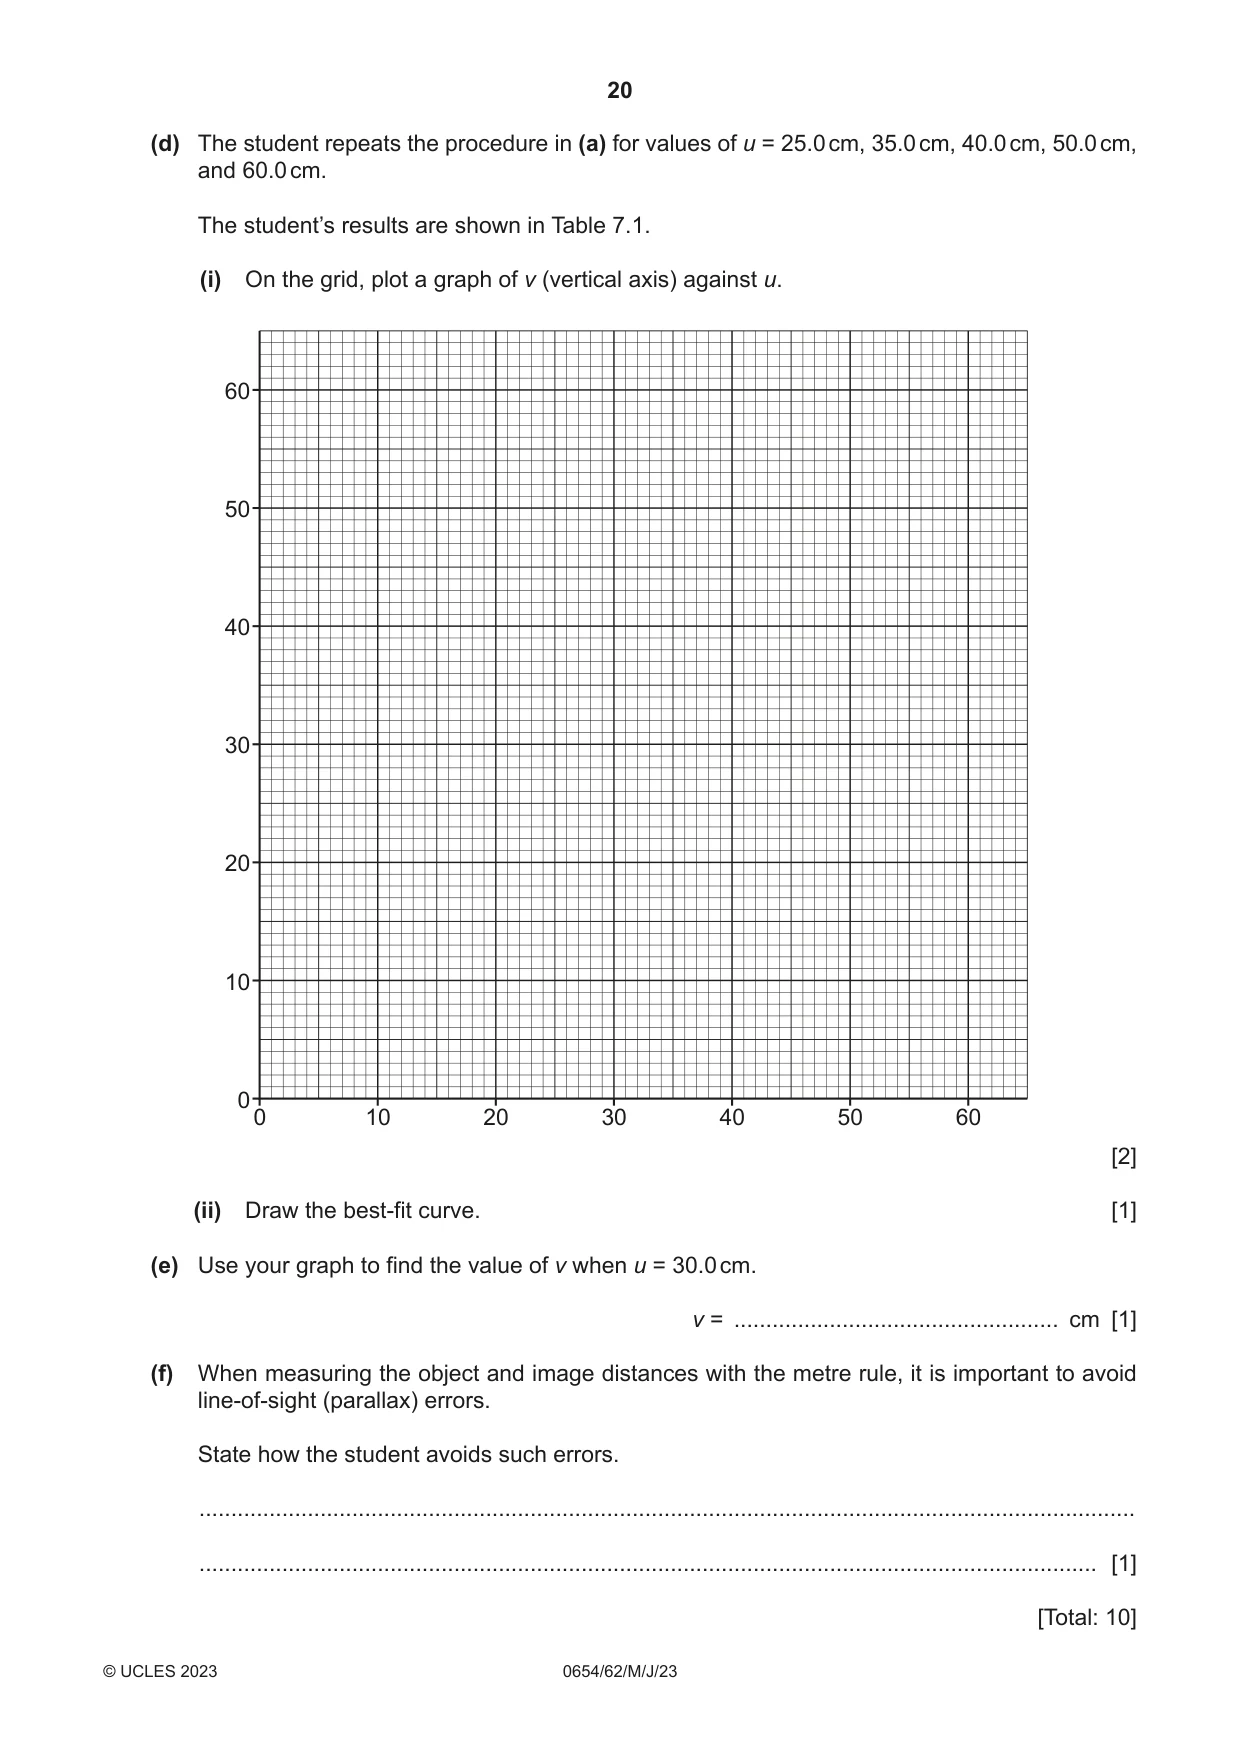
7 A student investigates the image formed by a convex lens. The apparatus is assembled as shown in Fig. 7.1. lamp illuminated object convex lens in holder screen y Fig. 7.1 (a) Procedure The student: • switches on the lamp • places the lens a distance u = 20.0 cm in front of the illuminated object (a triangular hole in a card) • adjusts the position of the screen by moving it backwards and forwards along the bench, until a sharp image of the illuminated object is formed on the screen. On Fig. 7.1, measure the image distance y from the screen to the lens in centimetres to the nearest 0.1 cm. y = ................................................... cm [1] (b) Fig. 7.1 is drawn to a scale of one-fifth full size. Calculate the actual image distance v from the lens. Record your answer in Table 7.1. Table 7.1 object distance u image distance v / cm / cm 20.0 25.0 37.5 35.0 26.3 40.0 24.0 50.0 21.5 60.0 20.0 [1] (c) The diagram in Fig. 7.2 shows the illuminated object and its image. object image Fig. 7.2 (i) State two differences between the object and its image. difference 1 ........................................................................................................................ difference 2 ........................................................................................................................ [2] (ii) The magnification m of the image is calculated using the equation shown. v m = u Use your answer to (b) to calculate the magnification of the image. m = ......................................................... [1] (d) The student repeats the procedure in (a) for values of u = 25.0 cm, 35.0 cm, 40.0 cm, 50.0 cm, and 60.0 cm. The student’s results are shown in Table 7.1. (i) On the grid, plot a graph of v (vertical axis) against u. 60 50 40 30 20 10 00 10 20 30 40 50 60 [2] (ii) Draw the best-fit curve. [1] (e) Use your graph to find the value of v when u = 30.0 cm. v = ................................................... cm [1] (f) When measuring the object and image distances with the metre rule, it is important to avoid line-of-sight (parallax) errors. State how the student avoids such errors. ................................................................................................................................................... ............................................................................................................................................. [1] [Total: 10]
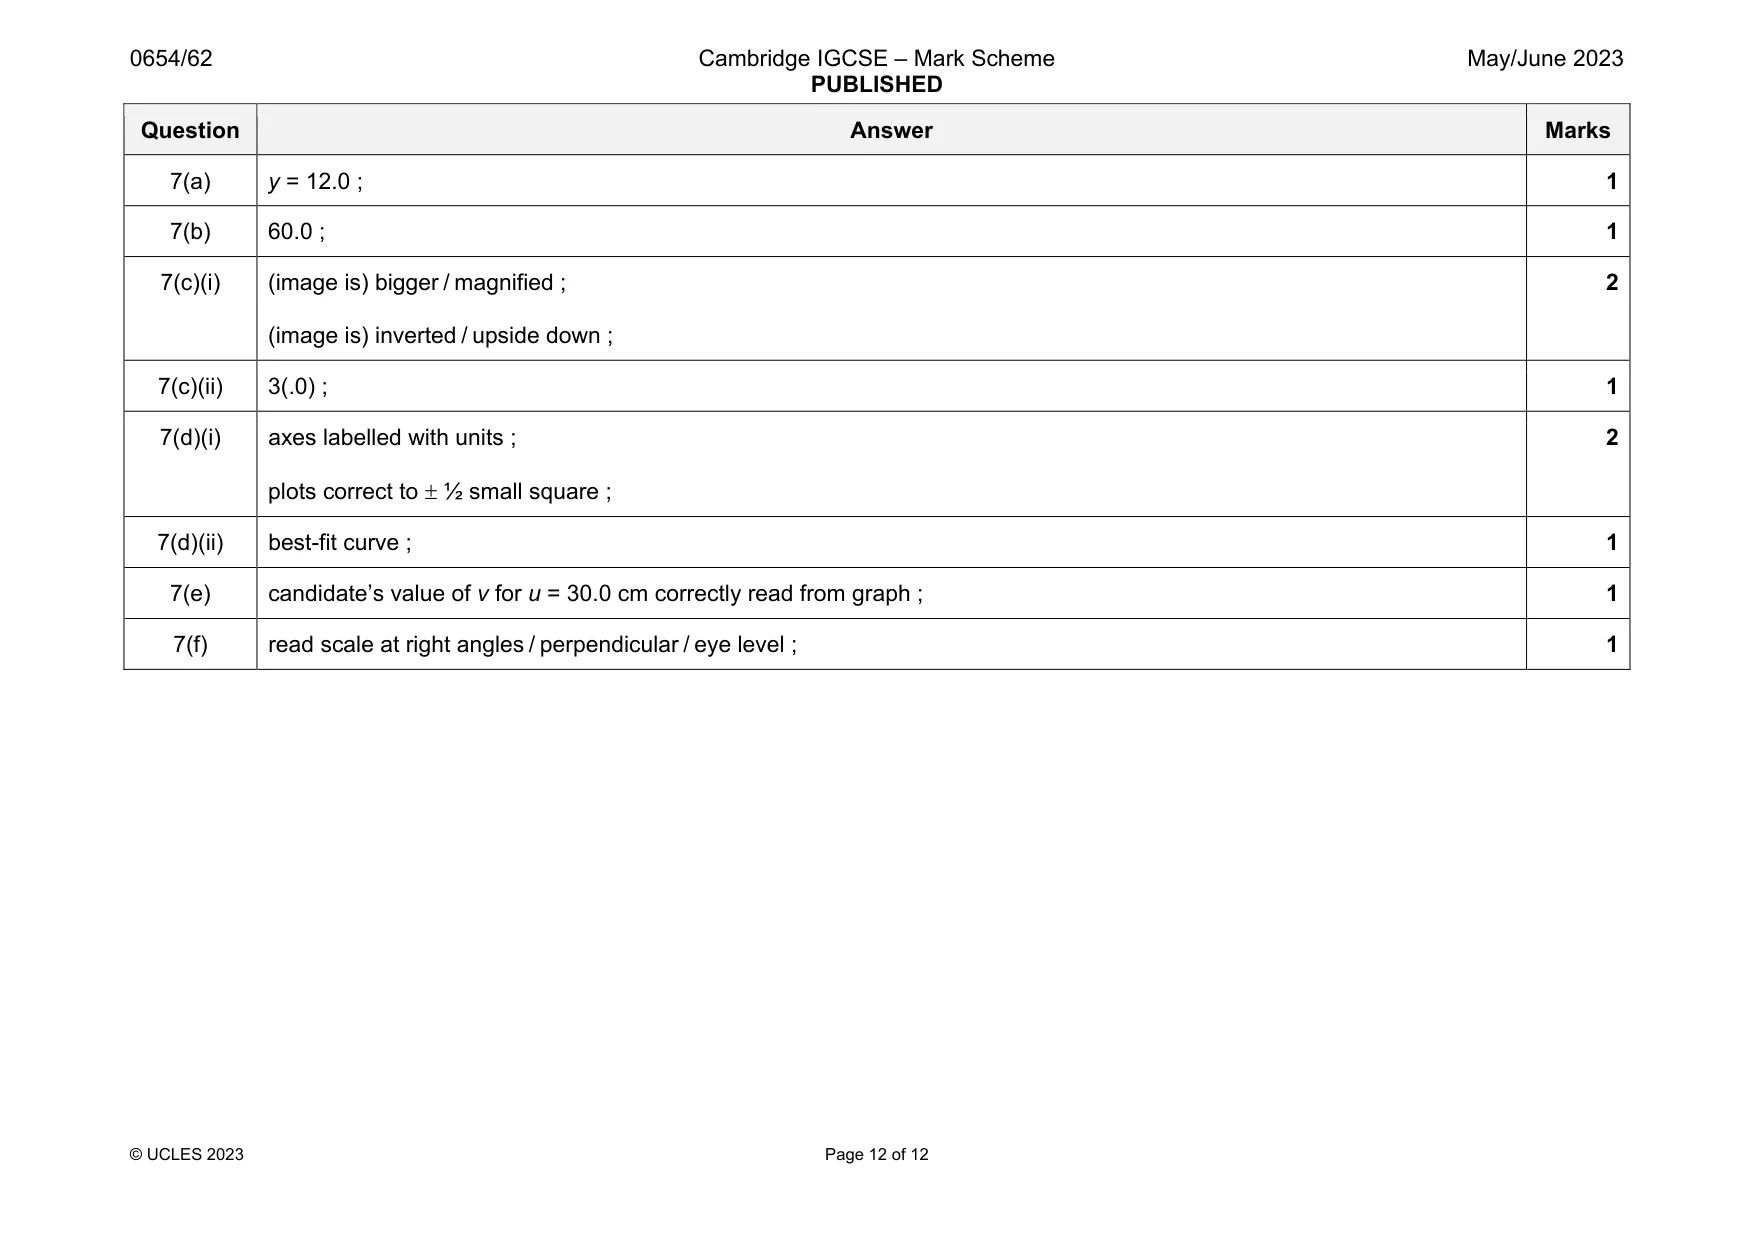
Mark scheme: 7(a) y = 12.0 ; 1 7(b) 60.0 ; 1 7(c)(i) (image is) bigger / magnified ; (image is) inverted / upside down ; 2 7(c)(ii) 3(.0) ; 1 7(d)(i) axes labelled with units ; plots correct to ½ small square ; 2 7(d)(ii) best-fit curve ; 1 7(e) candidate’s value of v for u = 30.0 cm correctly read from graph ; 1 7(f) read scale at right angles / perpendicular / eye level ; 1
What was in this paper
The subtopics covered by these 7 questions, and how many questions each got. Open one in a new tab to see every Cambridge question on it.
What you needed in this session
Cambridge’s own grade thresholds for 2023 May/June, Paper 6 · Variant 2. A higher threshold means an easier paper — the bar moves with how the cohort did.