Cambridge IGCSE Sciences - Co-ordinated (Double) 0654 — 2022 Feb/March Paper 6 · Variant 2
0654/62/F/M/22 · 6 questions · 60 marks · ≈68 min
The question paper and its mark scheme, free to read here and free to download. This is Cambridge’s own paper, exactly as it was sat.
Question paper24 pages



Mark scheme10 pages
Answers below. Sit the paper first if you are practising.
Questions as text
Q1 · A flower with some of the petals removed
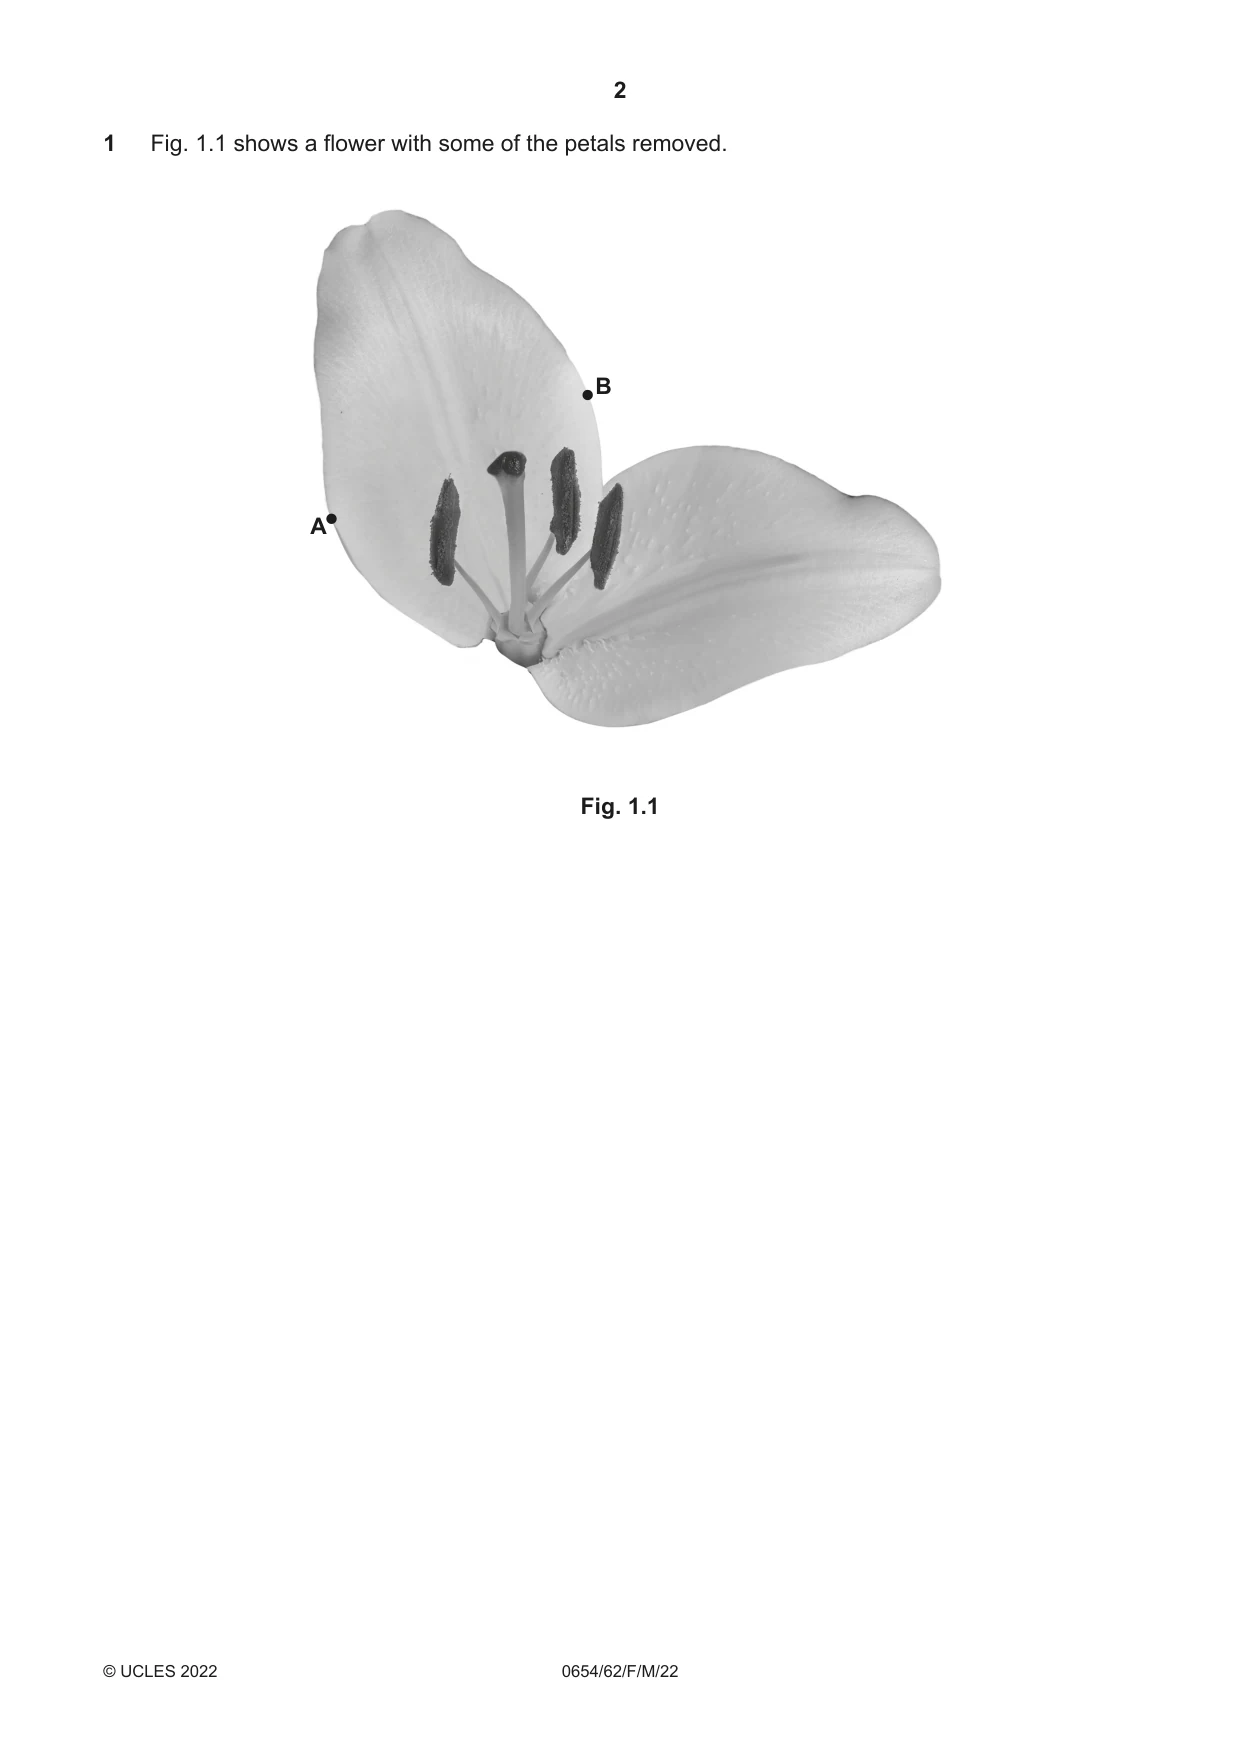
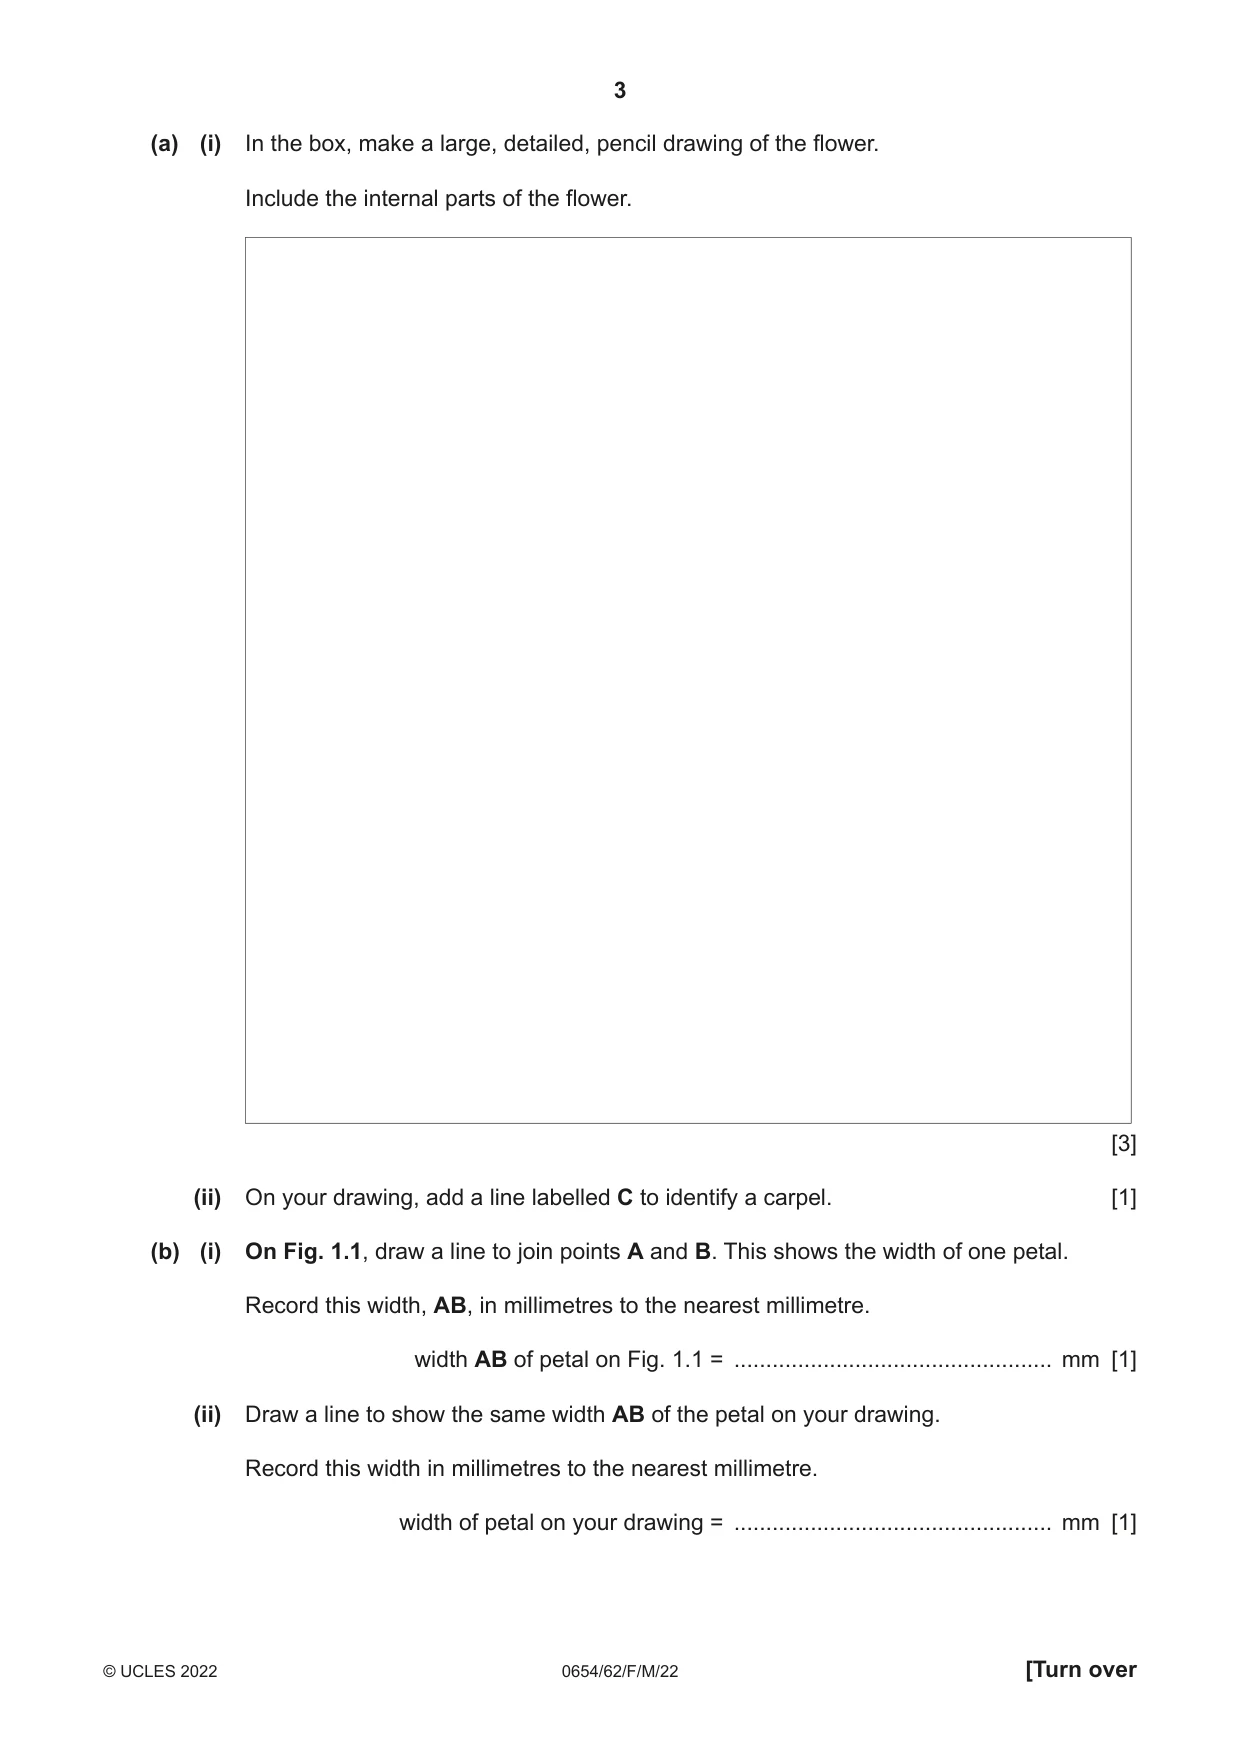
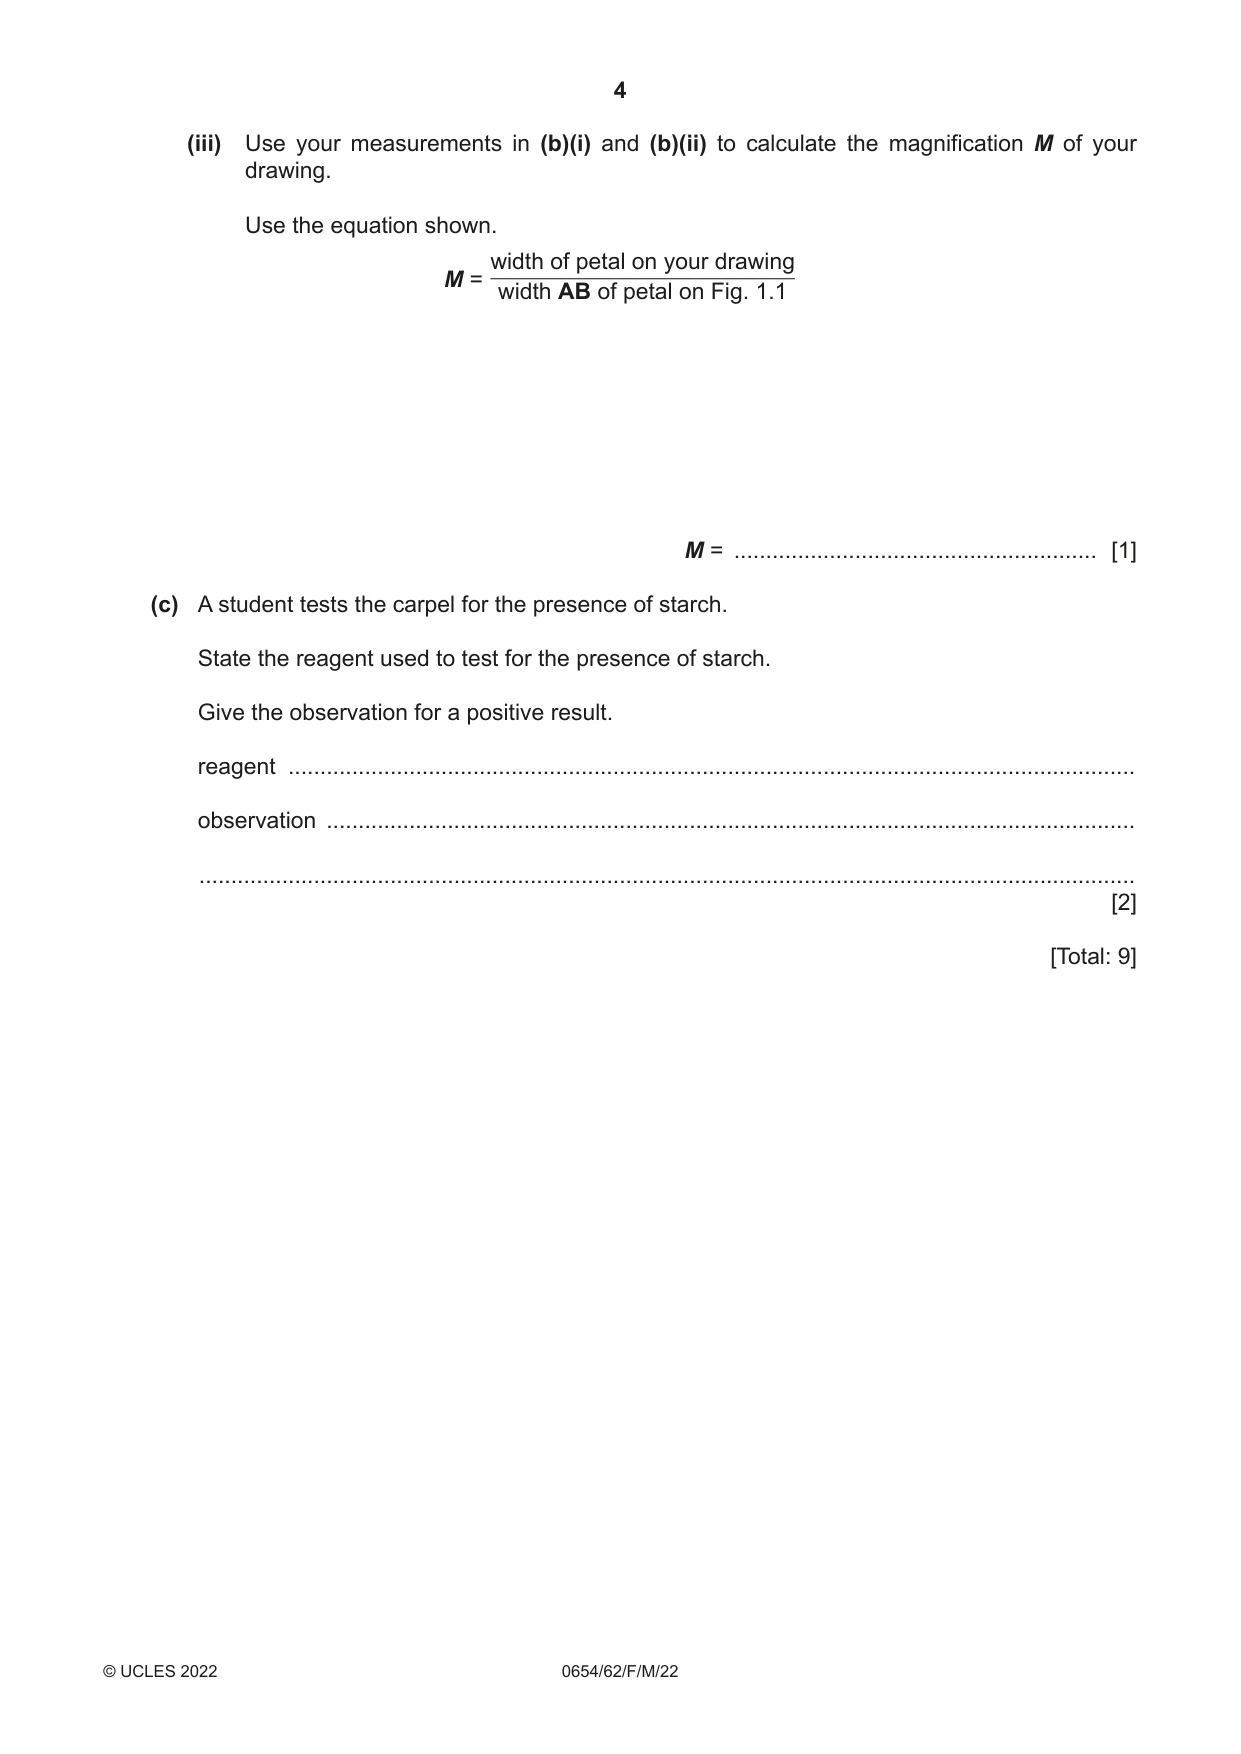
1 Fig. 1.1 shows a flower with some of the petals removed. B A Fig. 1.1 (a) (i) In the box, make a large, detailed, pencil drawing of the flower. Include the internal parts of the flower. [3] (ii) On your drawing, add a line labelled C to identify a carpel. [1] (b) (i) On Fig. 1.1, draw a line to join points A and B. This shows the width of one petal. Record this width, AB, in millimetres to the nearest millimetre. width AB of petal on Fig. 1.1 = .................................................. mm [1] (ii) Draw a line to show the same width AB of the petal on your drawing. Record this width in millimetres to the nearest millimetre. width of petal on your drawing = .................................................. mm [1] (iii) Use your measurements in (b)(i) and (b)(ii) to calculate the magnification M of your drawing. Use the equation shown. width of petal on your drawing M = width AB of petal on Fig. 1.1 M = ......................................................... [1] (c) A student tests the carpel for the presence of starch. State the reagent used to test for the presence of starch. Give the observation for a positive result. reagent ..................................................................................................................................... observation ............................................................................................................................... ................................................................................................................................................... [2] [Total: 9]
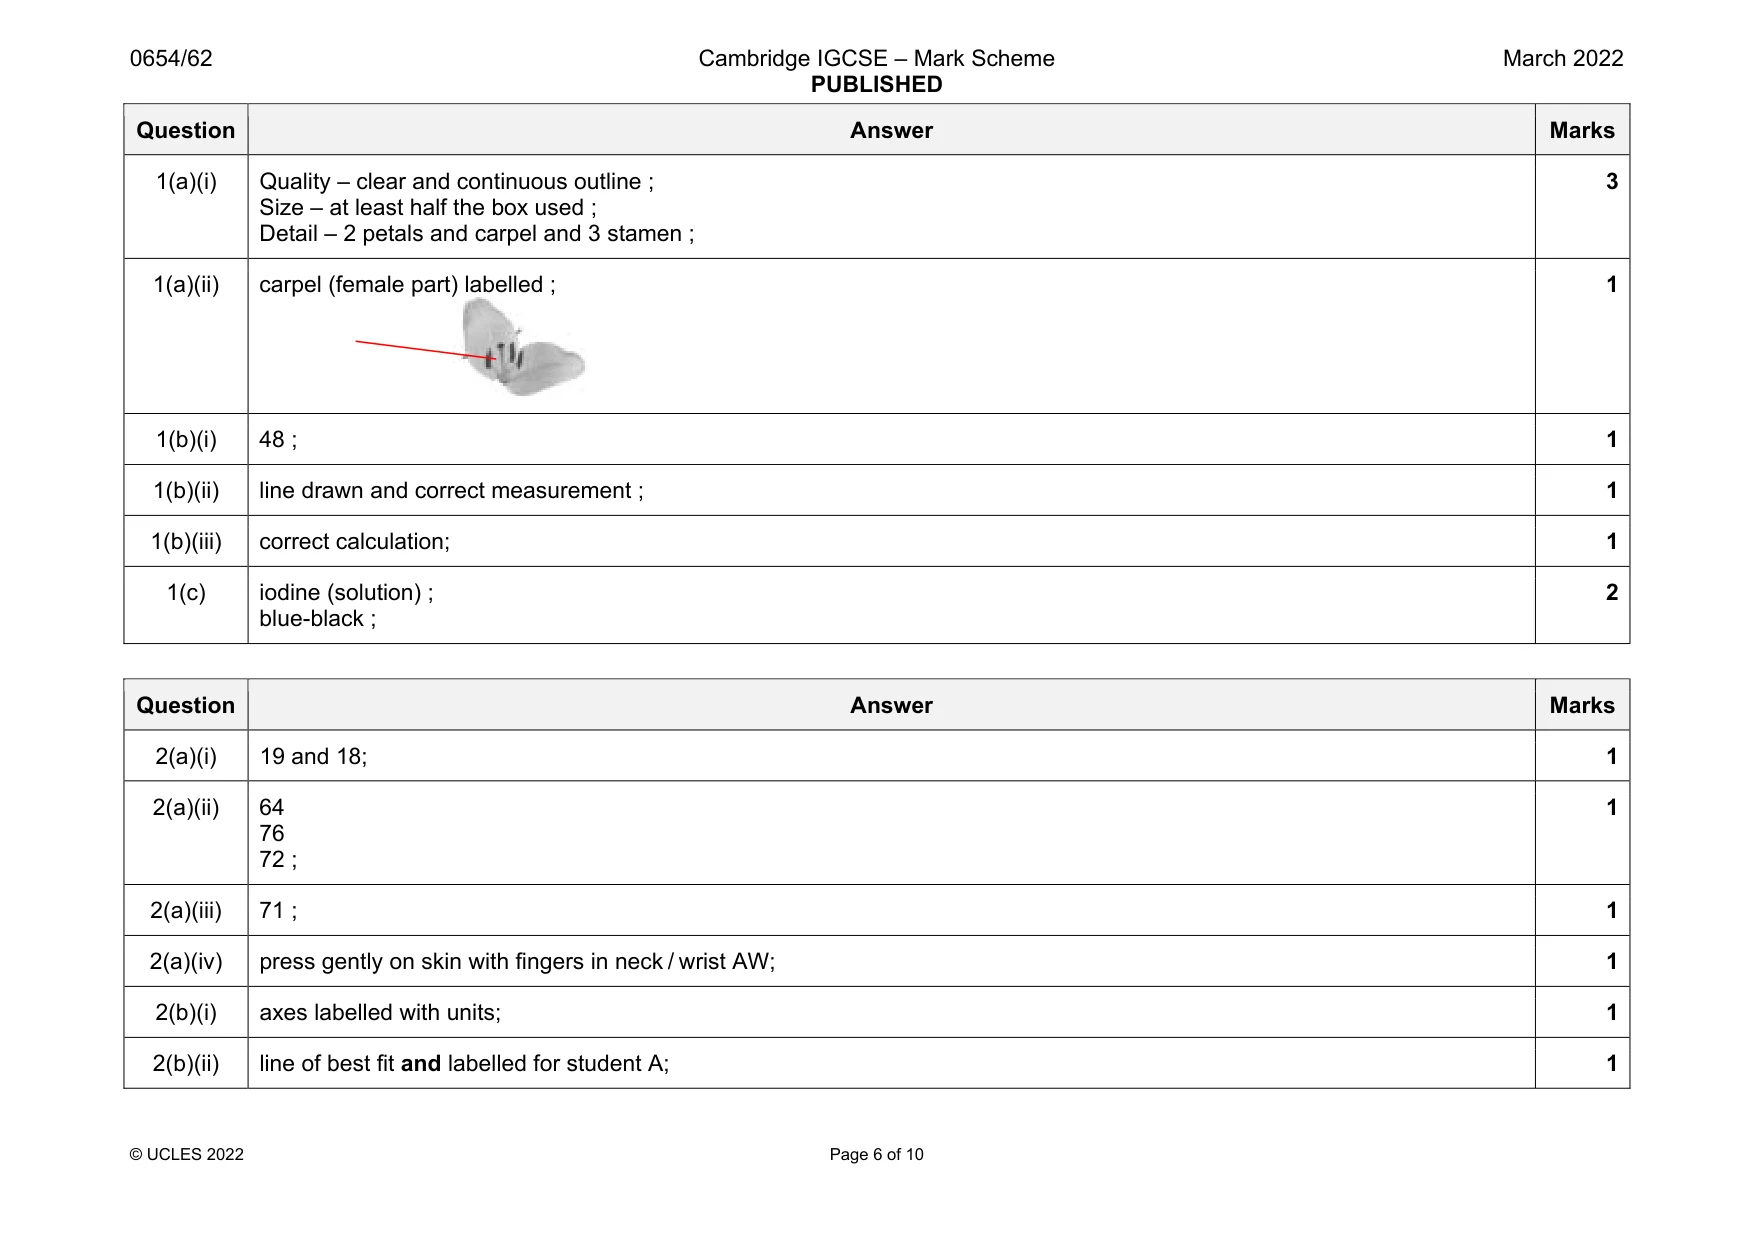
Mark scheme: 1(a)(i) Quality – clear and continuous outline ; Size – at least half the box used ; Detail – 2 petals and carpel and 3 stamen ; 3 1(a)(ii) carpel (female part) labelled ; 1 1(b)(i) 48 ; 1 1(b)(ii) line drawn and correct measurement ; 1 1(b)(iii) correct calculation; 1 1(c) iodine (solution) ; blue-black ; 2
Q2 · A student investigates the effect of exercise on pulse rate
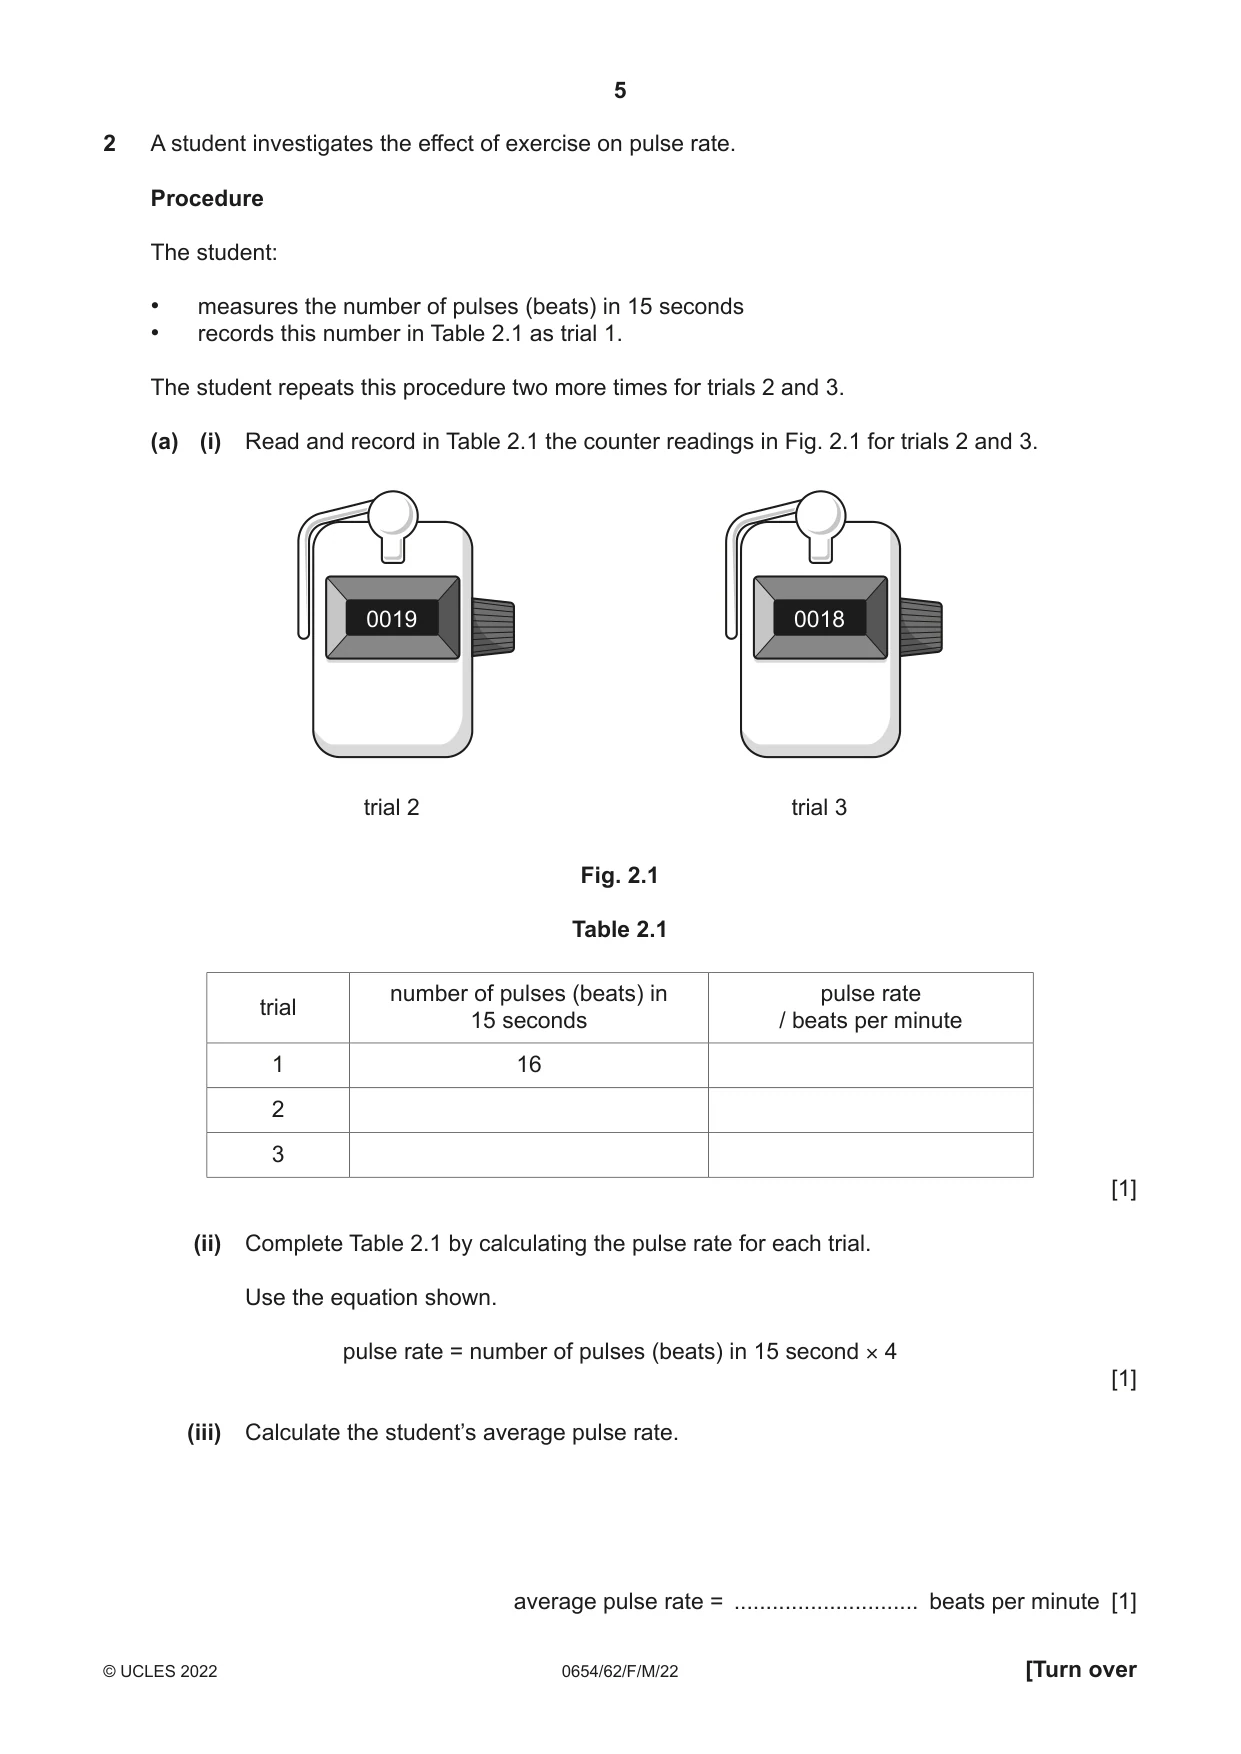
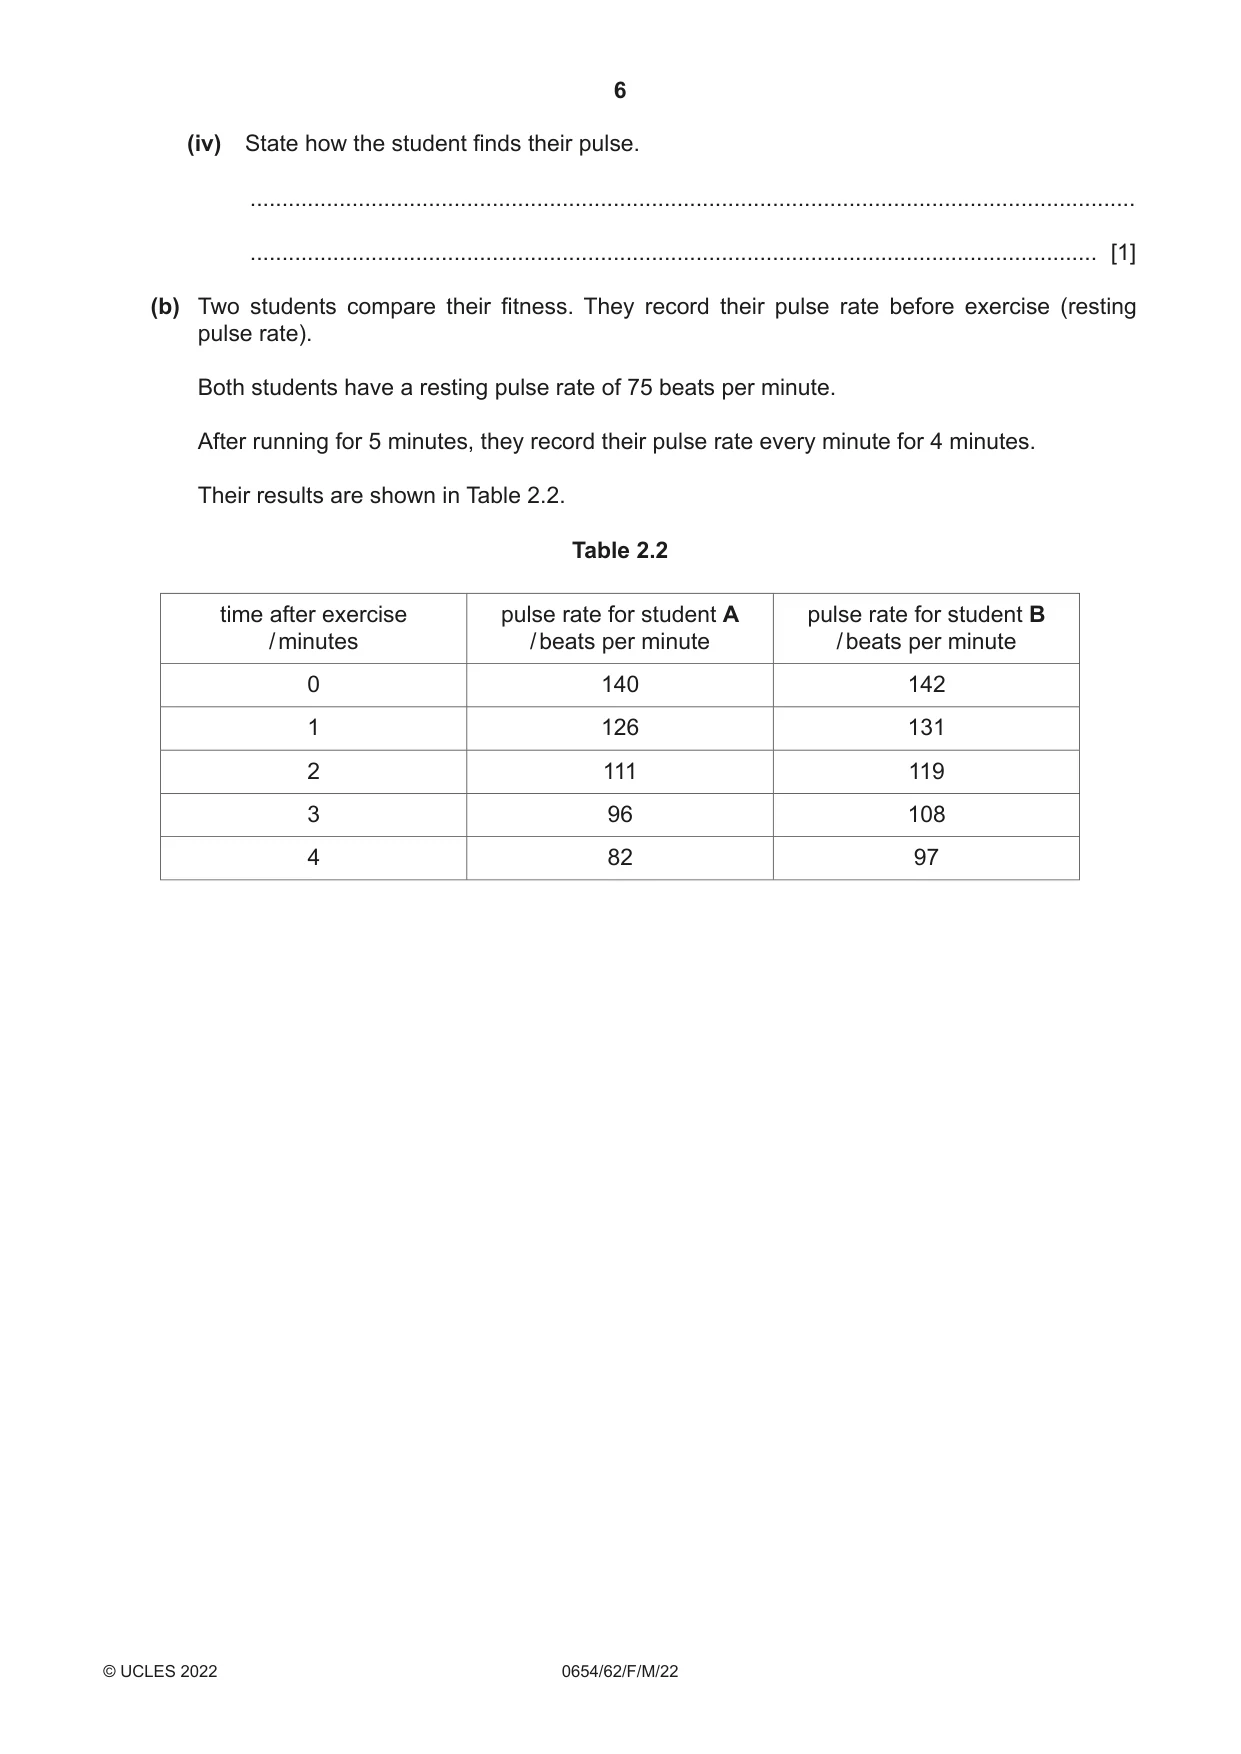
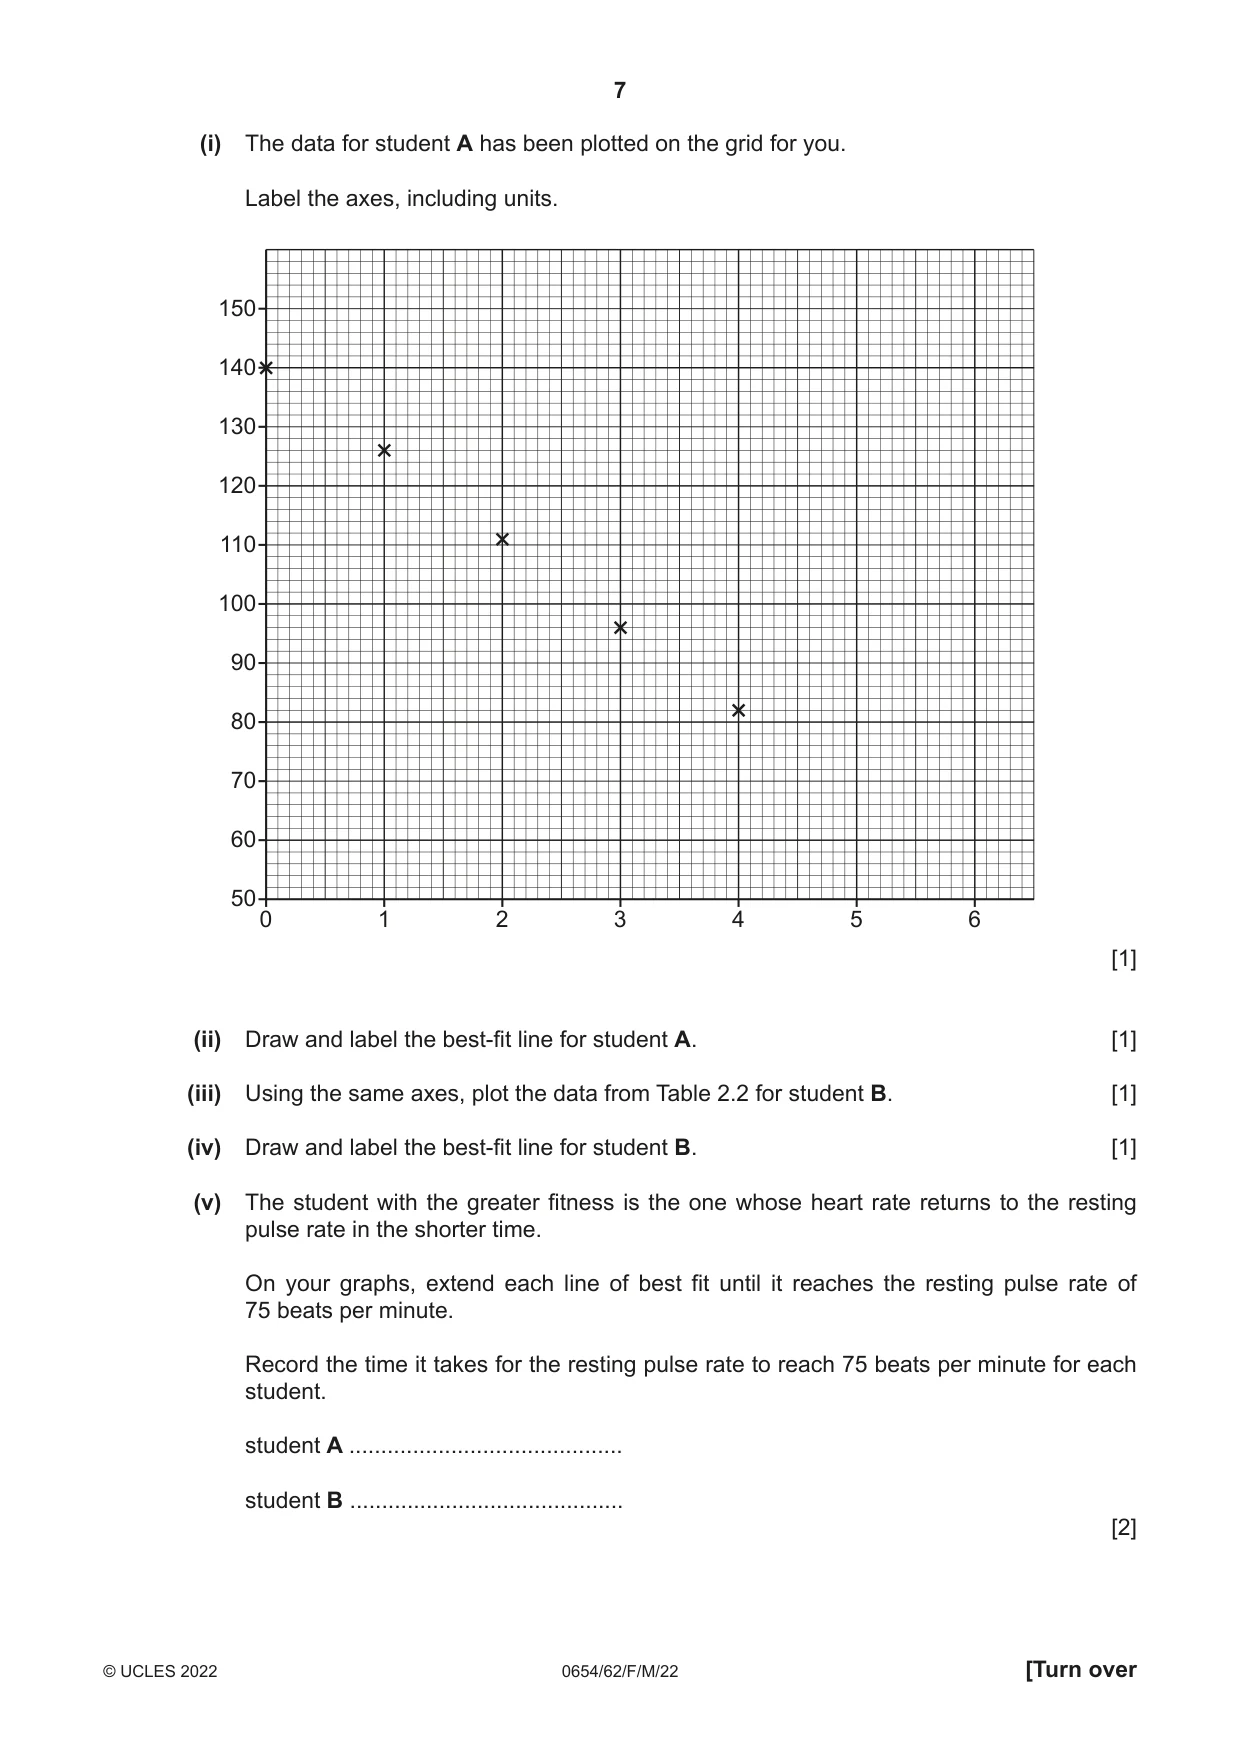
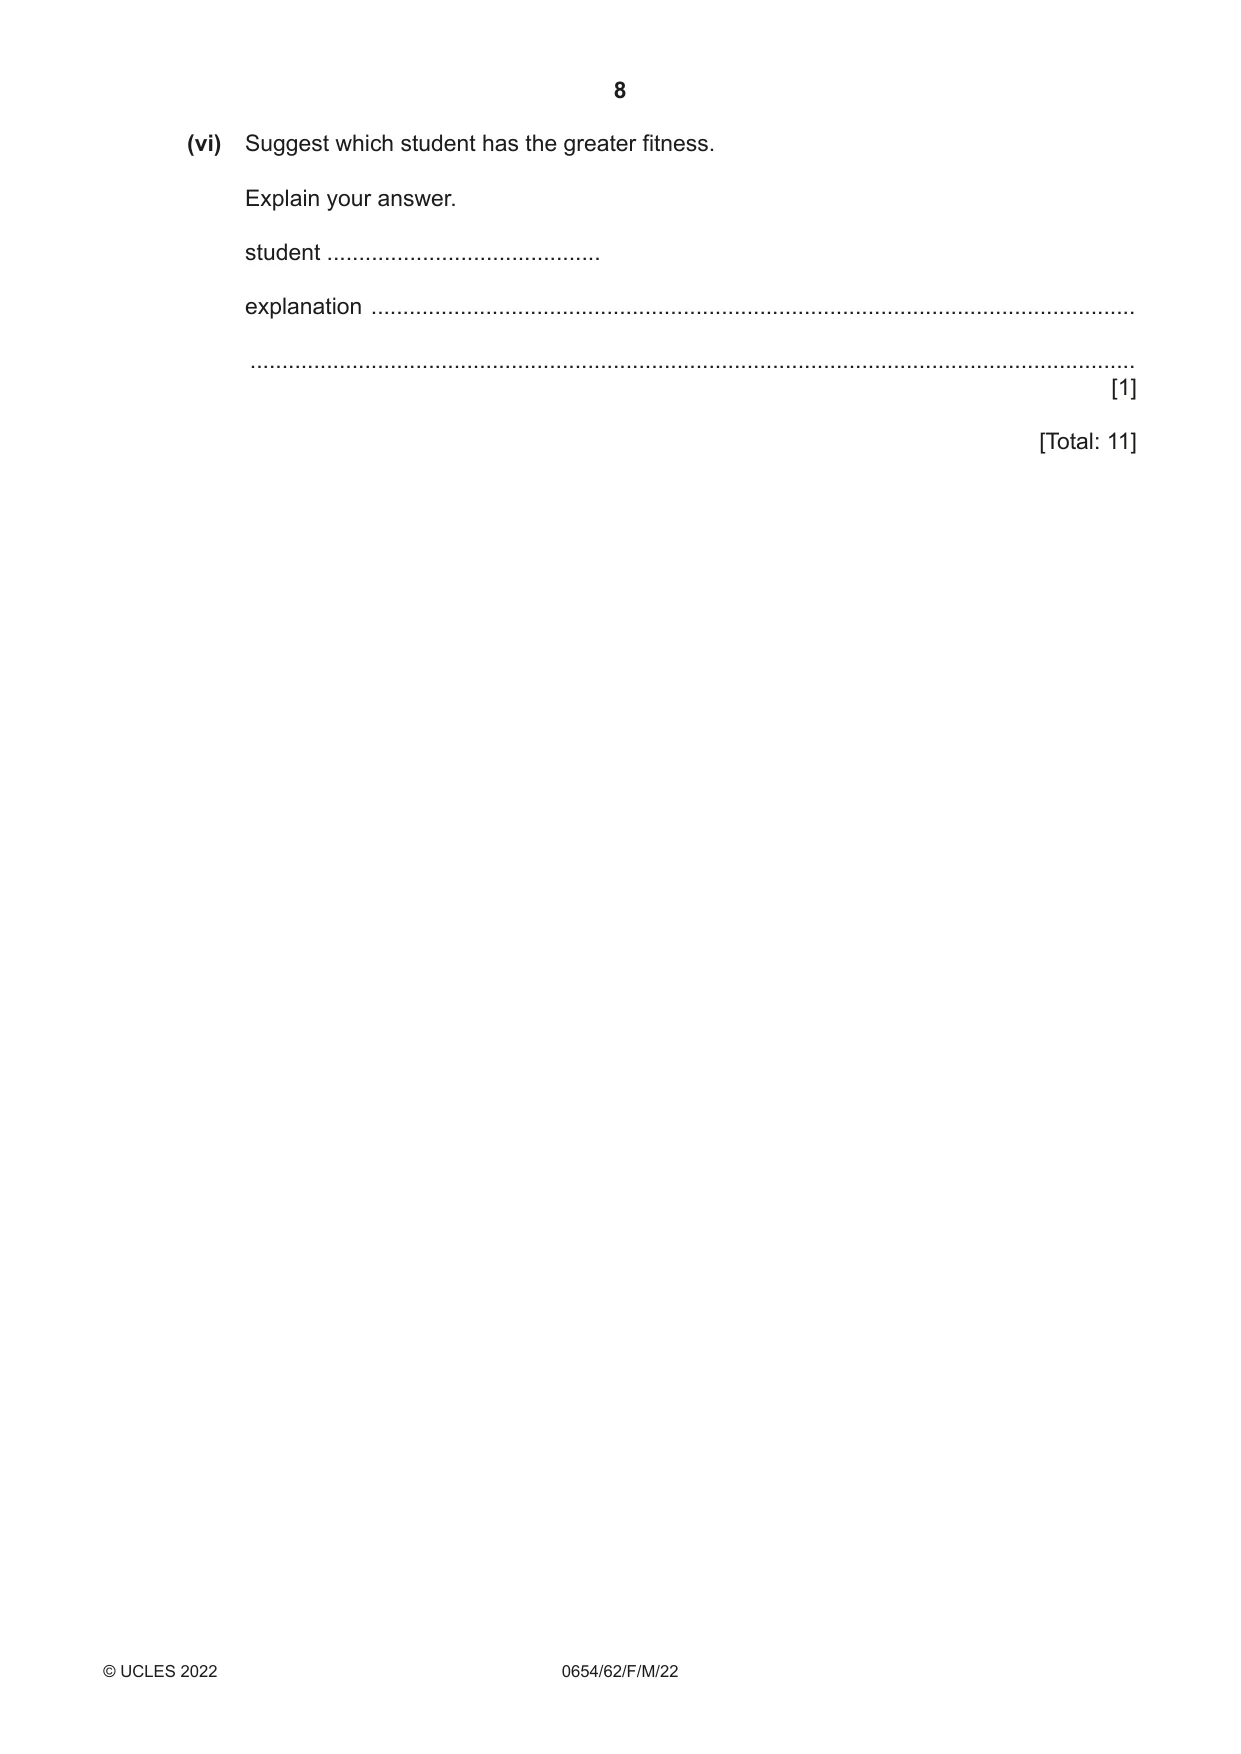
2 A student investigates the effect of exercise on pulse rate. Procedure The student: • measures the number of pulses (beats) in 15 seconds • records this number in Table 2.1 as trial 1. The student repeats this procedure two more times for trials 2 and 3. (a) (i) Read and record in Table 2.1 the counter readings in Fig. 2.1 for trials 2 and 3. 0019 0018 trial 2 trial 3 Fig. 2.1 Table 2.1 number of pulses (beats) in pulse rate trial 15 seconds / beats per minute 1 16 2 3 [1] (ii) Complete Table 2.1 by calculating the pulse rate for each trial. Use the equation shown. pulse rate = number of pulses (beats) in 15 second × 4 [1] (iii) Calculate the student’s average pulse rate. average pulse rate = ............................. beats per minute [1] (iv) State how the student finds their pulse. ........................................................................................................................................... ..................................................................................................................................... [1] (b) Two students compare their fitness. They record their pulse rate before exercise (resting pulse rate). Both students have a resting pulse rate of 75 beats per minute. After running for 5 minutes, they record their pulse rate every minute for 4 minutes. Their results are shown in Table 2.2. Table 2.2 time after exercise pulse rate for student A pulse rate for student B / minutes / beats per minute / beats per minute 0 140 142 1 126 131 2 111 119 3 96 108 4 82 97 (i) The data for student A has been plotted on the grid for you. Label the axes, including units. 150 140 130 120 110 100 90 80 70 60 50 0 1 2 3 4 5 6 [1] (ii) Draw and label the best-fit line for student A. [1] (iii) Using the same axes, plot the data from Table 2.2 for student B. [1] (iv) Draw and label the best-fit line for student B. [1] (v) The student with the greater fitness is the one whose heart rate returns to the resting pulse rate in the shorter time. On your graphs, extend each line of best fit until it reaches the resting pulse rate of 75 beats per minute. Record the time it takes for the resting pulse rate to reach 75 beats per minute for each student. student A ........................................... student B ........................................... [2] (vi) Suggest which student has the greater fitness. Explain your answer. student ........................................... explanation ........................................................................................................................ ........................................................................................................................................... [1] [Total: 11]
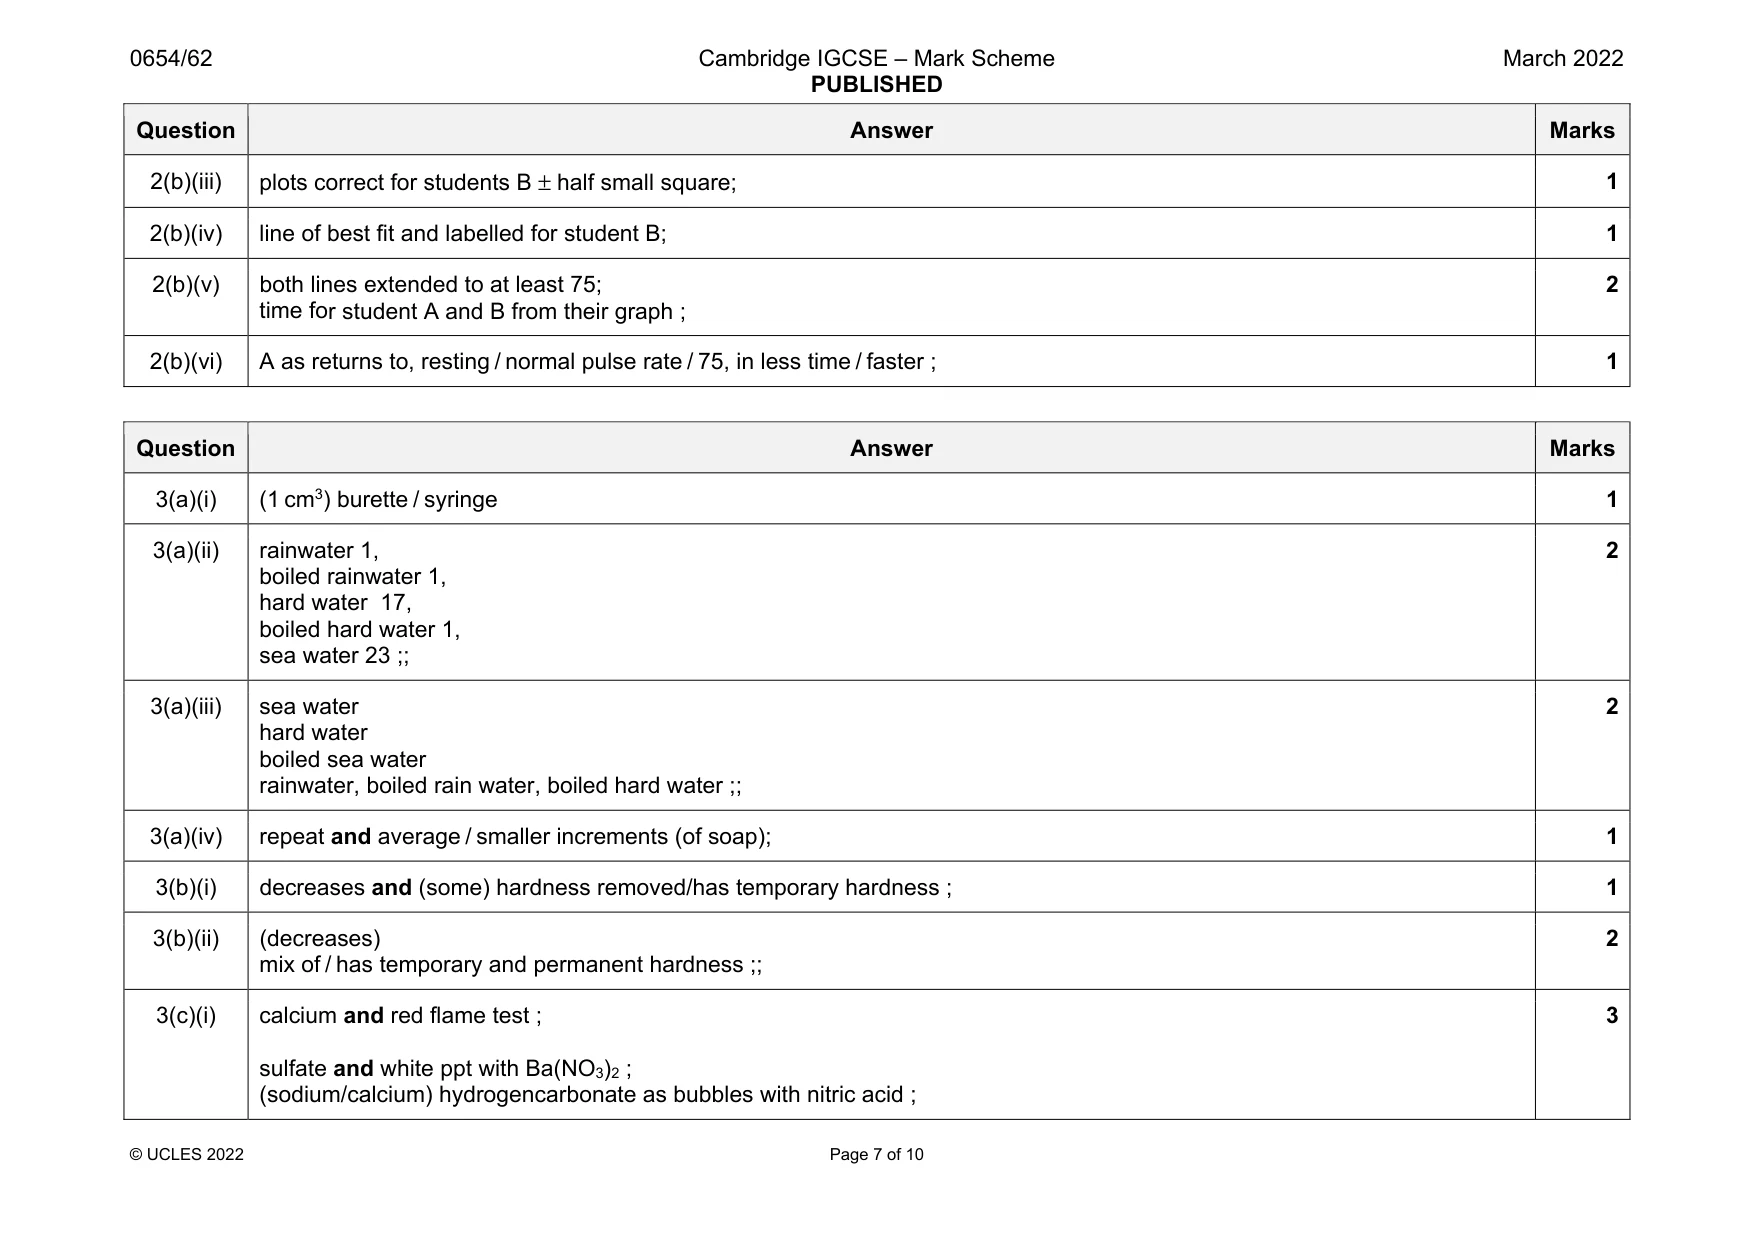
Mark scheme: 2(a)(i) 19 and 18; 1 2(a)(ii) 64 76 72 ; 1 2(a)(iii) 71 ; 1 2(a)(iv) press gently on skin with fingers in neck / wrist AW; 1 2(b)(i) axes labelled with units; 1 2(b)(ii) line of best fit and labelled for student A; 1 Question Answer Marks 2(b)(iii) plots correct for students B ± half small square; 1 2(b)(iv) line of best fit and labelled for student B; 1 2(b)(v) both lines extended to at least 75; time for student A and B from their graph ; 2 2(b)(vi) A as returns to, resting / normal pulse rate / 75, in less time / faster ; 1
Q3 · A student tests some water samples with soap solution
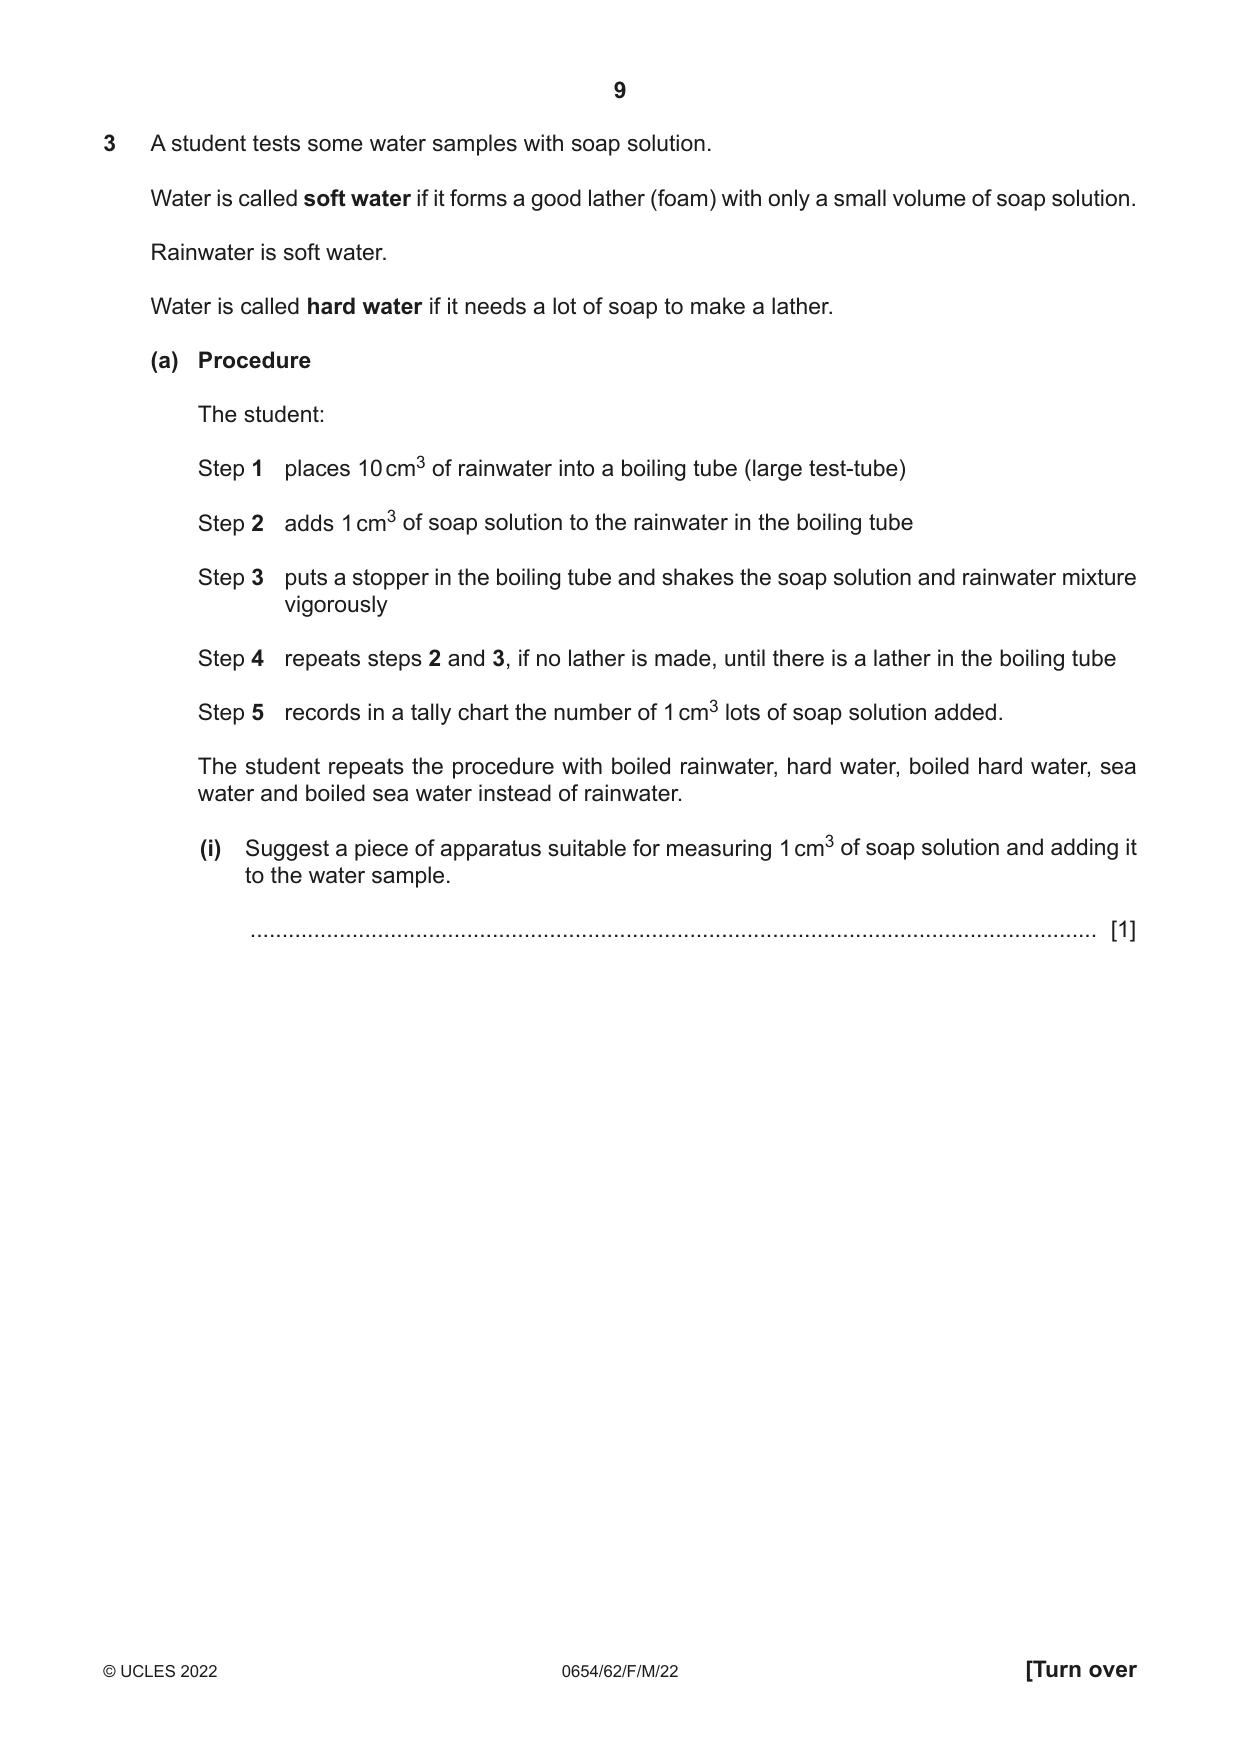
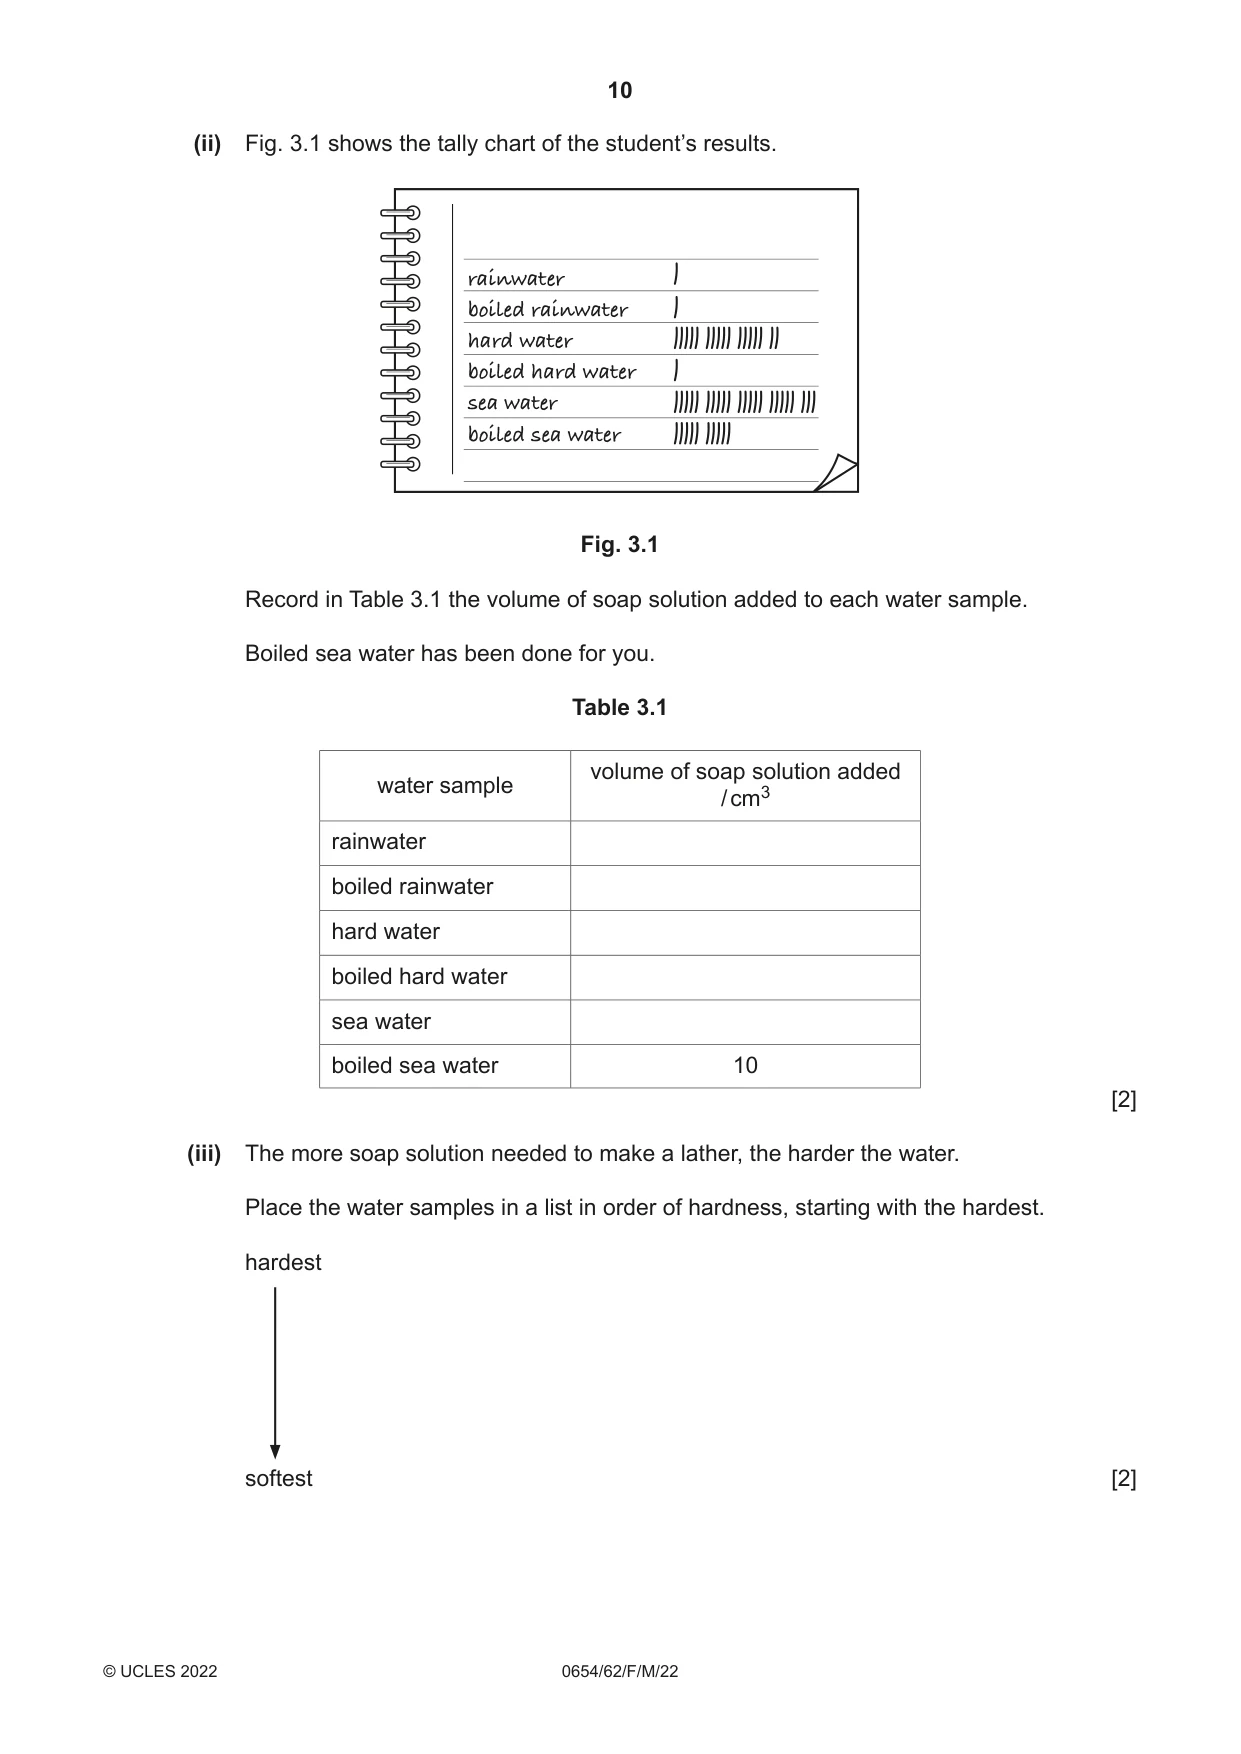
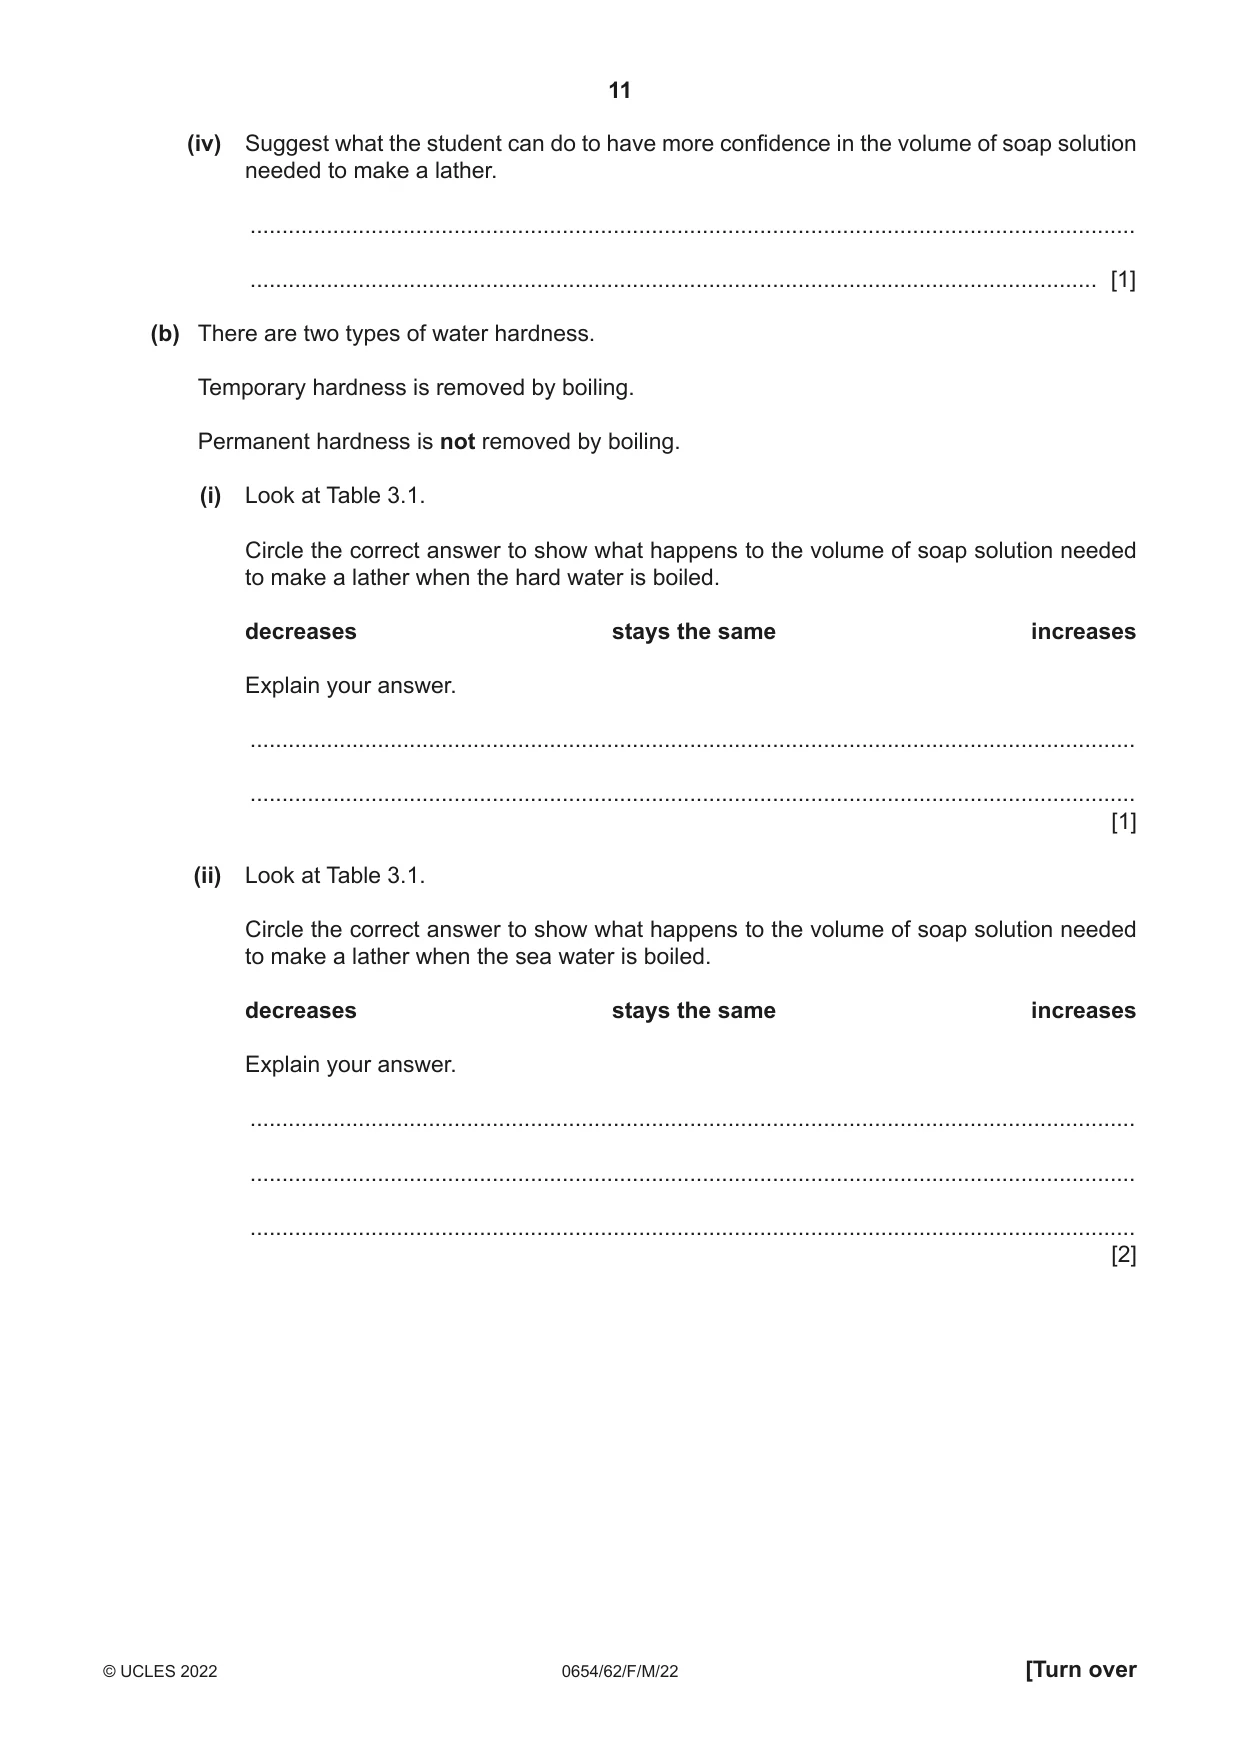
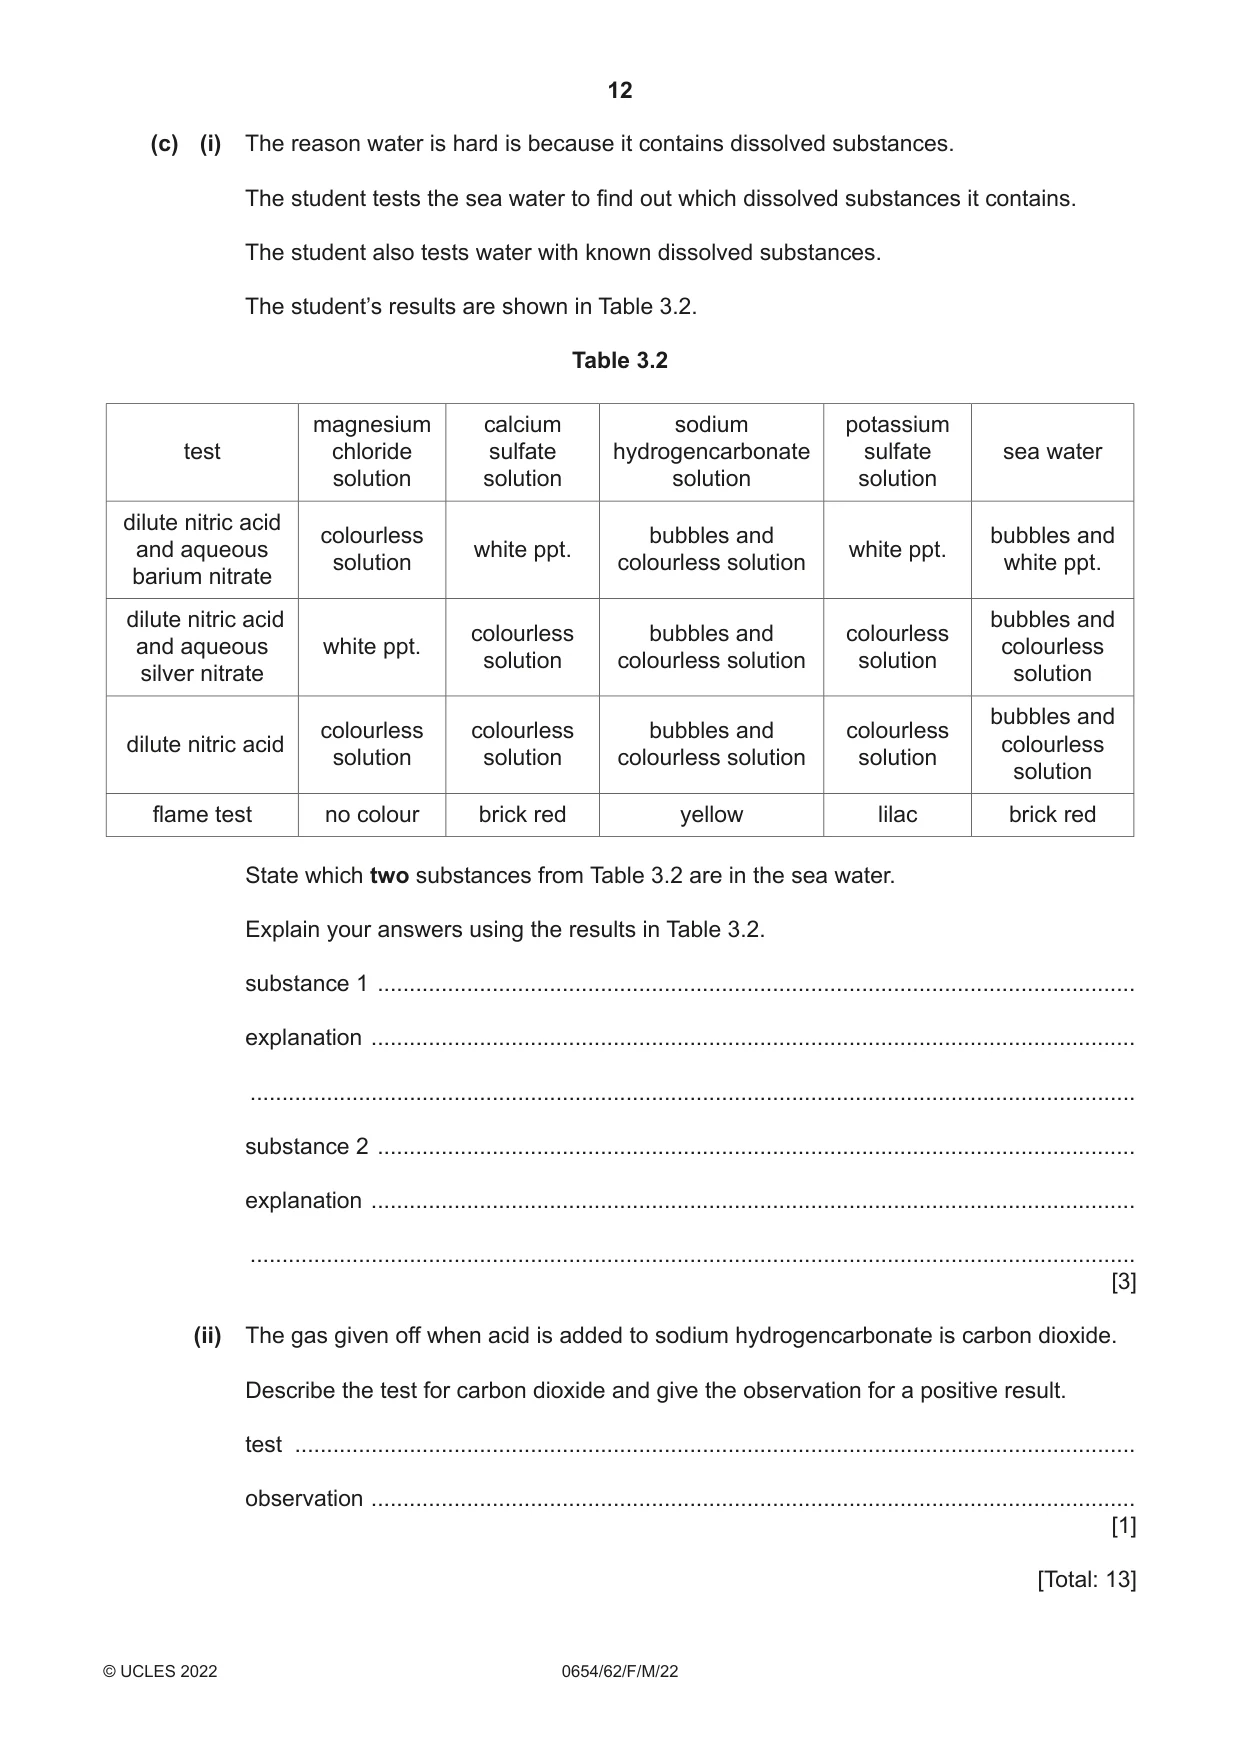
3 A student tests some water samples with soap solution. Water is called soft water if it forms a good lather (foam) with only a small volume of soap solution. Rainwater is soft water. Water is called hard water if it needs a lot of soap to make a lather. (a) Procedure The student: Step 1 places 10 cm3 of rainwater into a boiling tube (large test-tube) Step 2 adds 1 cm3 of soap solution to the rainwater in the boiling tube Step 3 puts a stopper in the boiling tube and shakes the soap solution and rainwater mixture vigorously Step 4 repeats steps 2 and 3, if no lather is made, until there is a lather in the boiling tube Step 5 records in a tally chart the number of 1 cm3 lots of soap solution added. The student repeats the procedure with boiled rainwater, hard water, boiled hard water, sea water and boiled sea water instead of rainwater. (i) Suggest a piece of apparatus suitable for measuring 1 cm3 of soap solution and adding it to the water sample. ..................................................................................................................................... [1] (ii) Fig. 3.1 shows the tally chart of the student’s results. rainwater boiled rainwater hard water boiled hard water sea water boiled sea water Fig. 3.1 Record in Table 3.1 the volume of soap solution added to each water sample. Boiled sea water has been done for you. Table 3.1 volume of soap solution added water sample / cm3 rainwater boiled rainwater hard water boiled hard water sea water boiled sea water 10 [2] (iii) The more soap solution needed to make a lather, the harder the water. Place the water samples in a list in order of hardness, starting with the hardest. hardest softest [2] (iv) Suggest what the student can do to have more confidence in the volume of soap solution needed to make a lather. ........................................................................................................................................... ..................................................................................................................................... [1] (b) There are two types of water hardness. Temporary hardness is removed by boiling. Permanent hardness is not removed by boiling. (i) Look at Table 3.1. Circle the correct answer to show what happens to the volume of soap solution needed to make a lather when the hard water is boiled. decreases stays the same increases Explain your answer. ........................................................................................................................................... ........................................................................................................................................... [1] (ii) Look at Table 3.1. Circle the correct answer to show what happens to the volume of soap solution needed to make a lather when the sea water is boiled. decreases stays the same increases Explain your answer. ........................................................................................................................................... ........................................................................................................................................... ........................................................................................................................................... [2] (c) (i) The reason water is hard is because it contains dissolved substances. The student tests the sea water to find out which dissolved substances it contains. The student also tests water with known dissolved substances. The student’s results are shown in Table 3.2. Table 3.2 magnesium calcium sodium potassium test chloride sulfate hydrogencarbonate sulfate sea water solution solution solution solution dilute nitric acid colourless bubbles and bubbles and and aqueous white ppt. white ppt. solution colourless solution white ppt. barium nitrate dilute nitric acid bubbles and colourless bubbles and colourless and aqueous white ppt. colourless solution colourless solution solution silver nitrate solution bubbles and colourless colourless bubbles and colourlessdilute nitric acid colourless solution solution colourless solution solution solution flame test no colour brick red yellow lilac brick red State which two substances from Table 3.2 are in the sea water. Explain your answers using the results in Table 3.2. substance 1 ....................................................................................................................... explanation ........................................................................................................................ ........................................................................................................................................... substance 2 ....................................................................................................................... explanation ........................................................................................................................ ........................................................................................................................................... [3] (ii) The gas given off when acid is added to sodium hydrogencarbonate is carbon dioxide. Describe the test for carbon dioxide and give the observation for a positive result. test .................................................................................................................................... observation ........................................................................................................................ [1] [Total: 13]
Mark scheme: 3(a)(i) (1 cm3) burette / syringe 1 3(a)(ii) rainwater 1, boiled rainwater 1, hard water 17, boiled hard water 1, sea water 23 ;; 2 3(a)(iii) sea water hard water boiled sea water rainwater, boiled rain water, boiled hard water ;; 2 3(a)(iv) repeat and average / smaller increments (of soap); 1 3(b)(i) decreases and (some) hardness removed/has temporary hardness ; 1 3(b)(ii) (decreases) mix of / has temporary and permanent hardness ;; 2 3(c)(i) calcium and red flame test ; sulfate and white ppt with Ba(NO3)2 ; (sodium/calcium) hydrogencarbonate as bubbles with nitric acid ; 3 Question Answer Marks 3(c)(ii) limewater and white precipitate ; 1
Q4 · Hard water contains many dissolved solids
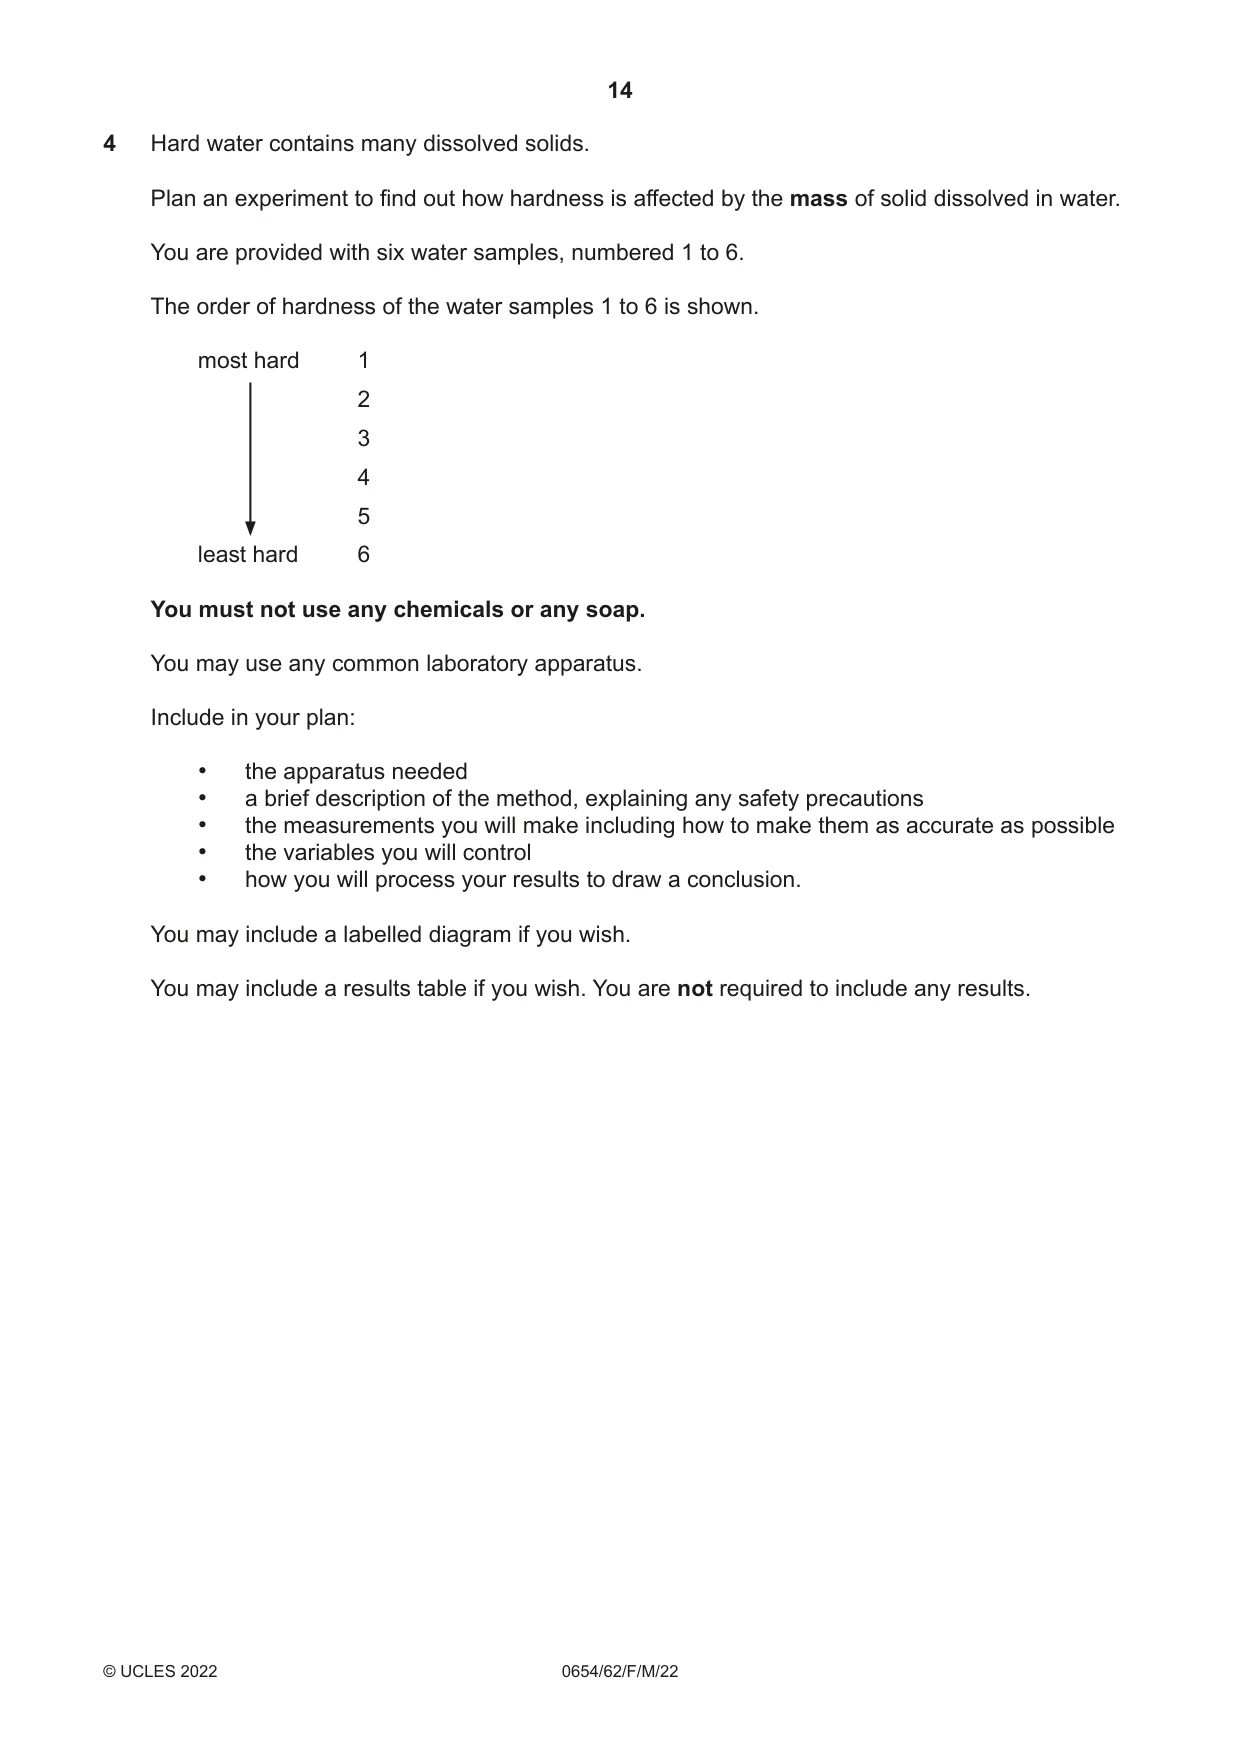
4 Hard water contains many dissolved solids. Plan an experiment to find out how hardness is affected by the mass of solid dissolved in water. You are provided with six water samples, numbered 1 to 6. The order of hardness of the water samples 1 to 6 is shown. most hard 1 2 3 4 5 least hard 6 You must not use any chemicals or any soap. You may use any common laboratory apparatus. Include in your plan: • the apparatus needed • a brief description of the method, explaining any safety precautions • the measurements you will make including how to make them as accurate as possible • the variables you will control • how you will process your results to draw a conclusion. You may include a labelled diagram if you wish. You may include a results table if you wish. You are not required to include any results. .......................................................................................................................................................... .......................................................................................................................................................... .......................................................................................................................................................... .......................................................................................................................................................... .......................................................................................................................................................... .......................................................................................................................................................... .......................................................................................................................................................... .......................................................................................................................................................... .......................................................................................................................................................... .......................................................................................................................................................... .......................................................................................................................................................... .......................................................................................................................................................... .......................................................................................................................................................... .......................................................................................................................................................... .......................................................................................................................................................... .......................................................................................................................................................... .......................................................................................................................................................... .......................................................................................................................................................... .......................................................................................................................................................... .......................................................................................................................................................... .................................................................................................................................................... [7]
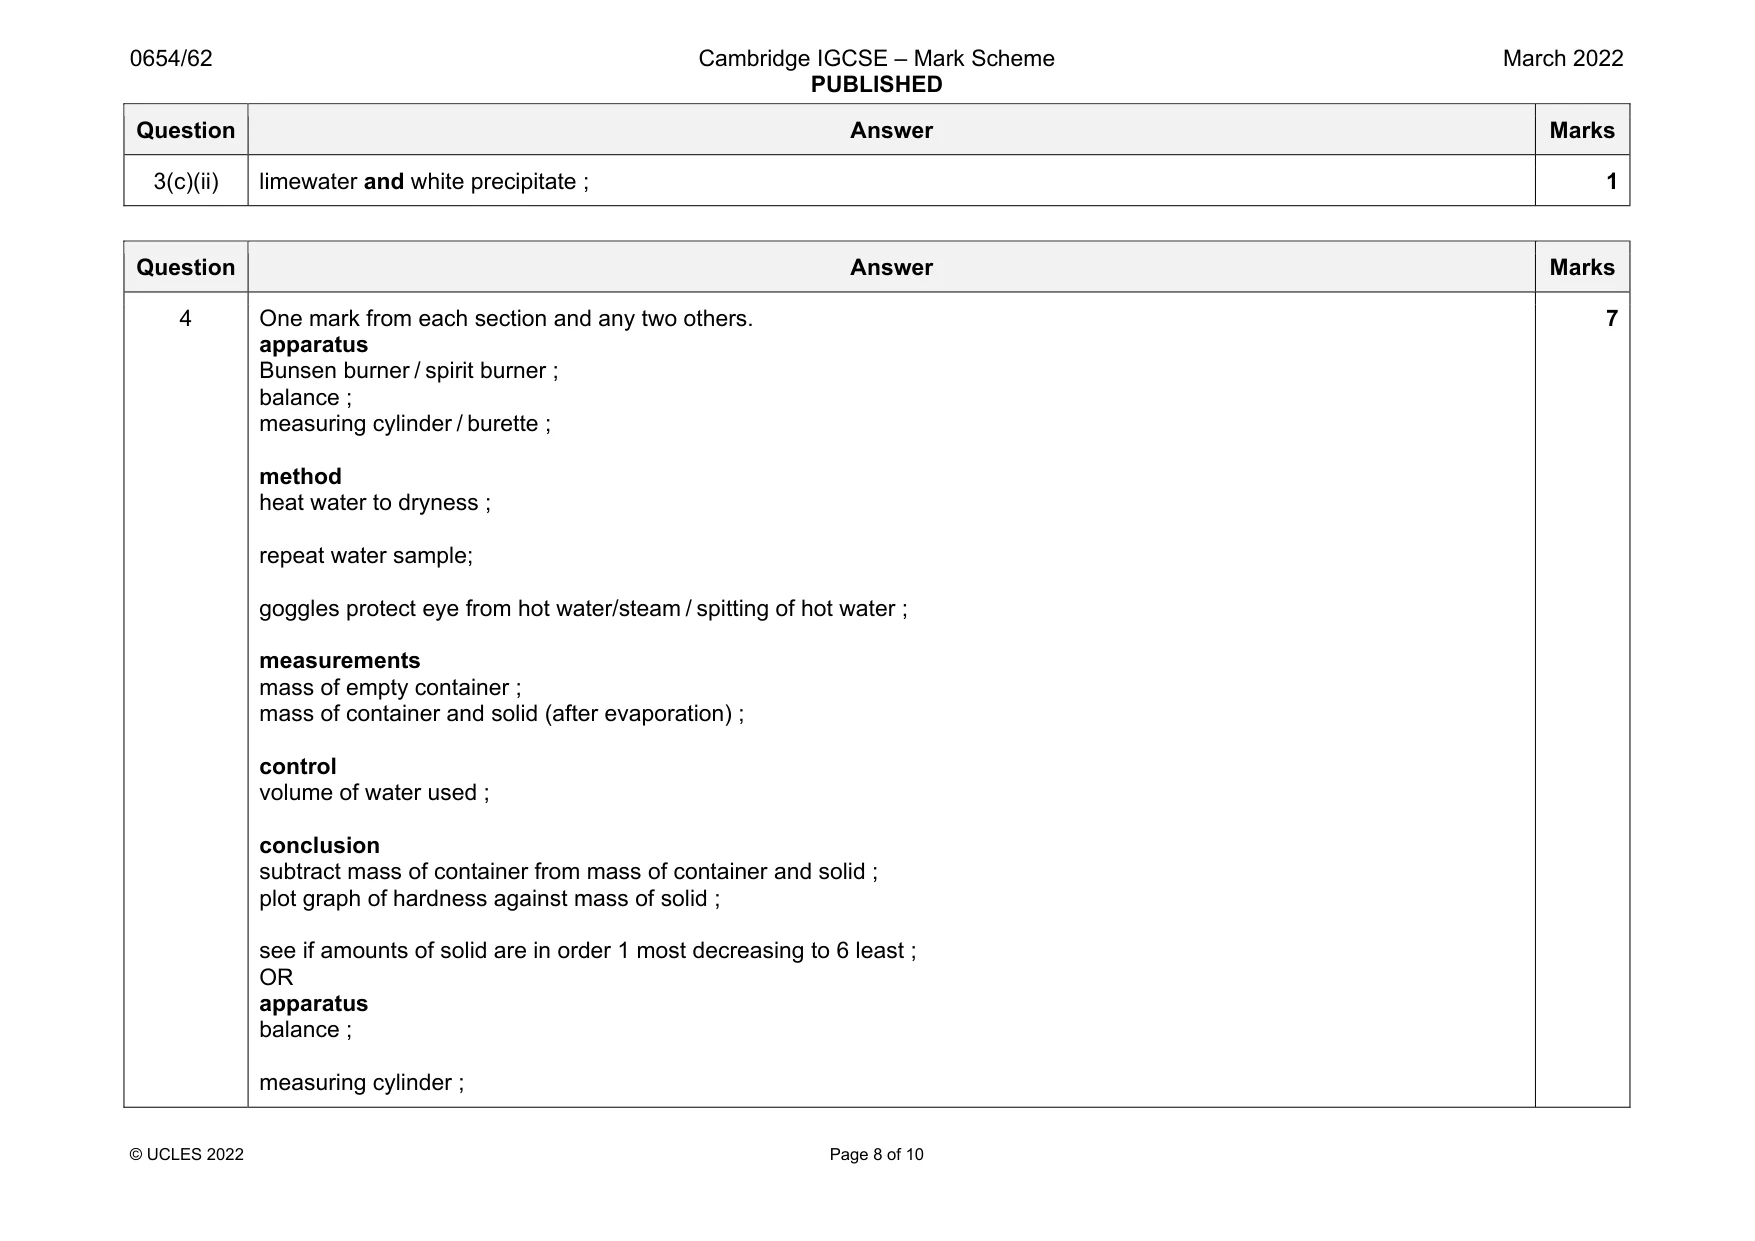
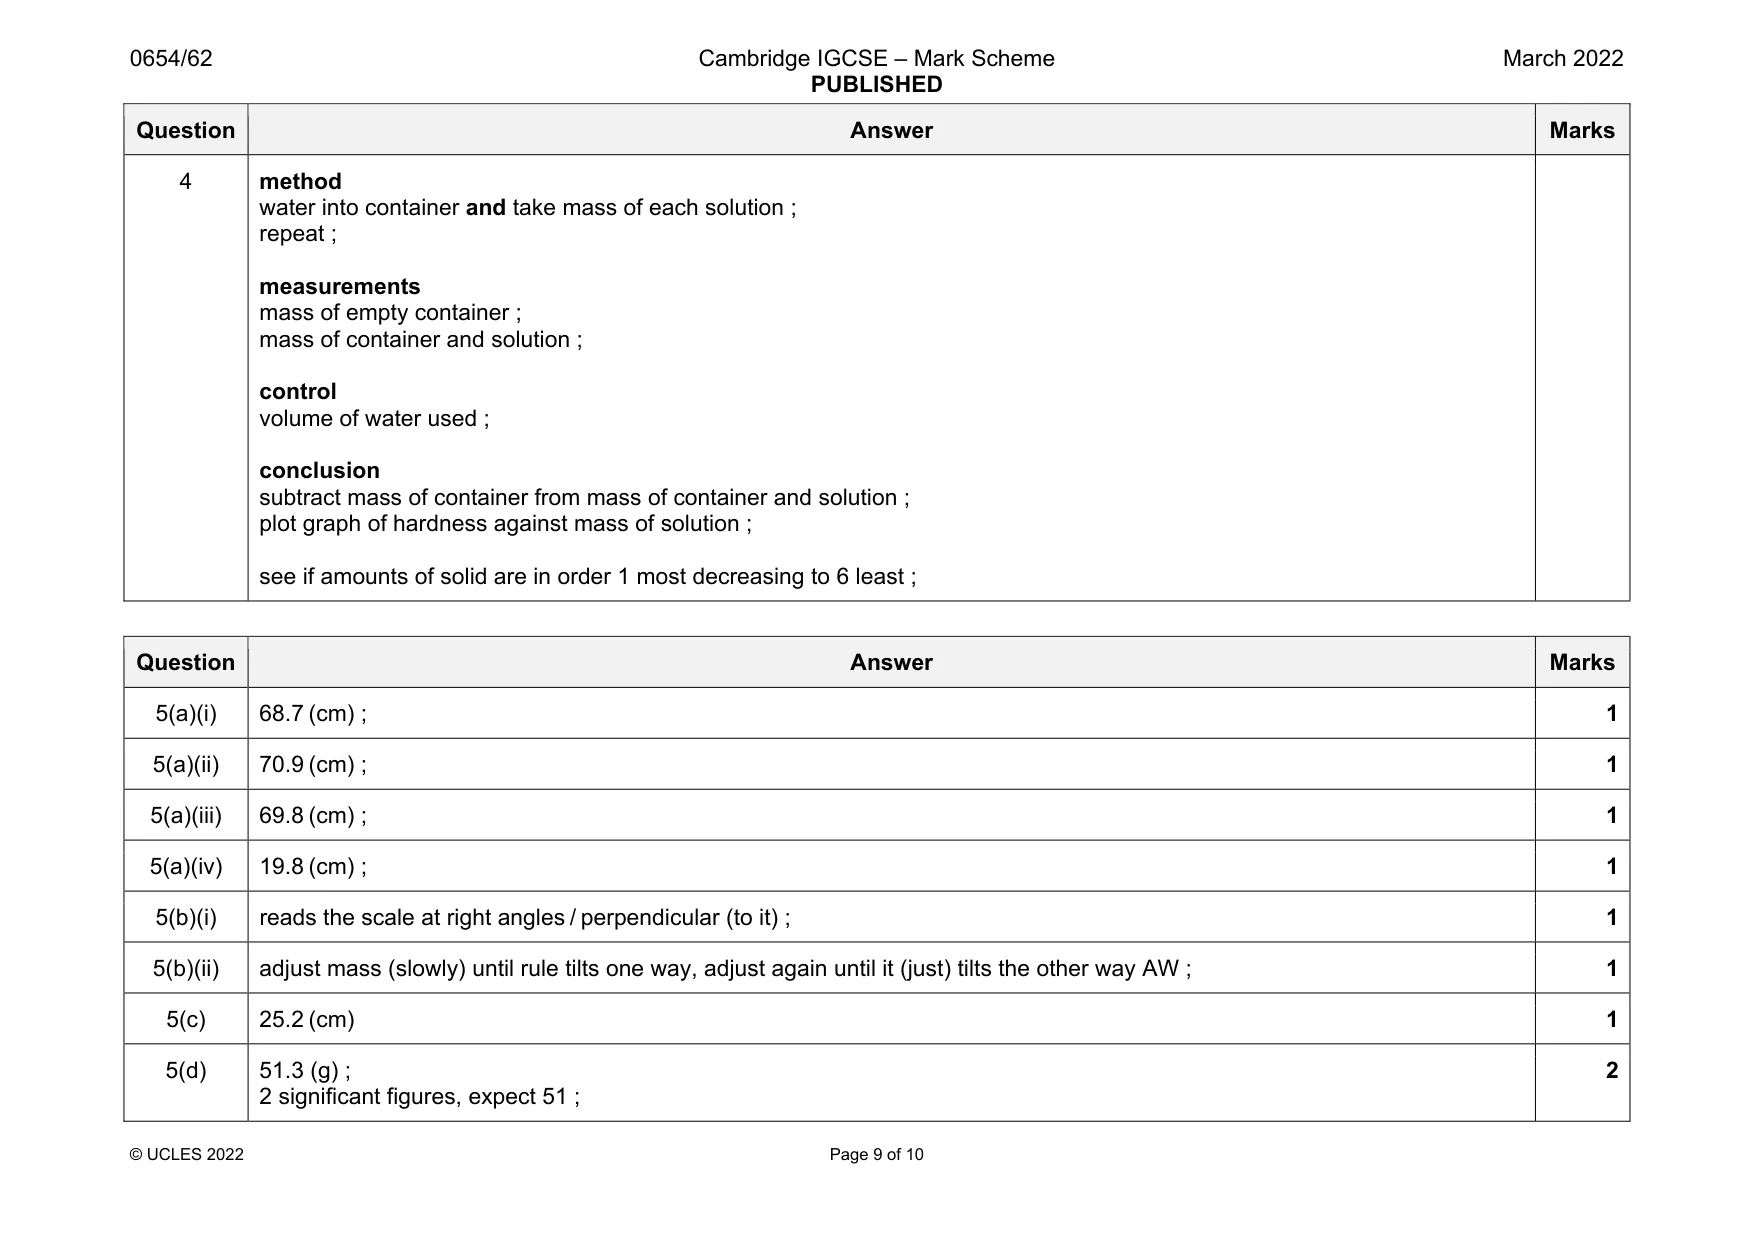
Mark scheme: 4 One mark from each section and any two others. apparatus Bunsen burner / spirit burner ; balance ; measuring cylinder / burette ; method heat water to dryness ; repeat water sample; goggles protect eye from hot water/steam / spitting of hot water ; measurements mass of empty container ; mass of container and solid (after evaporation) ; control volume of water used ; conclusion subtract mass of container from mass of container and solid ; plot graph of hardness against mass of solid ; see if amounts of solid are in order 1 most decreasing to 6 least ; OR apparatus balance ; measuring cylinder ; Question Answer Marks 4 method water into container and take mass of each solution ; repeat ; measurements mass of empty container ; mass of container and solution ; control volume of water used ; conclusion subtract mass of container from mass of container and solution ; plot graph of hardness against mass of solution ; see if amounts of solid are in order 1 most decreasing to 6 least ;
Q5 · A student determines the mass m of a load L by a balancing method
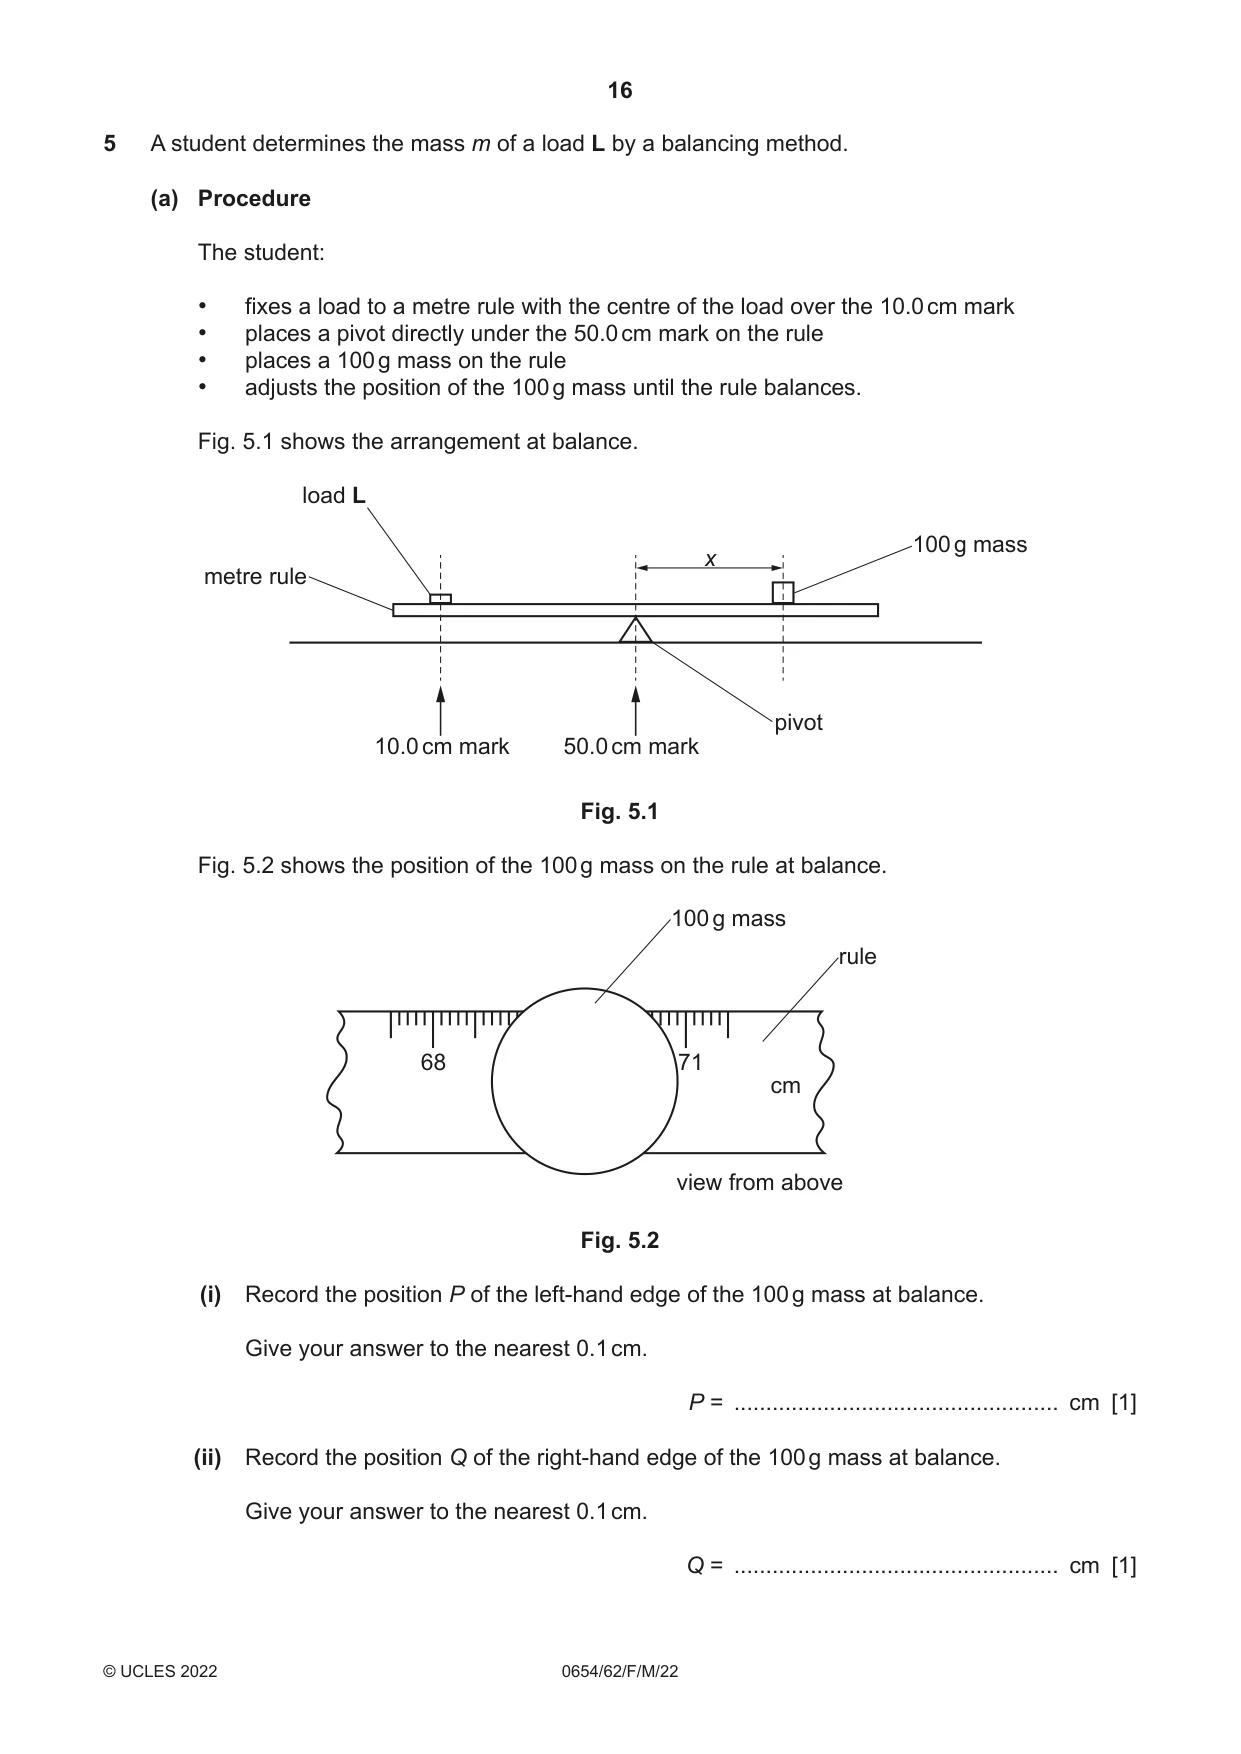
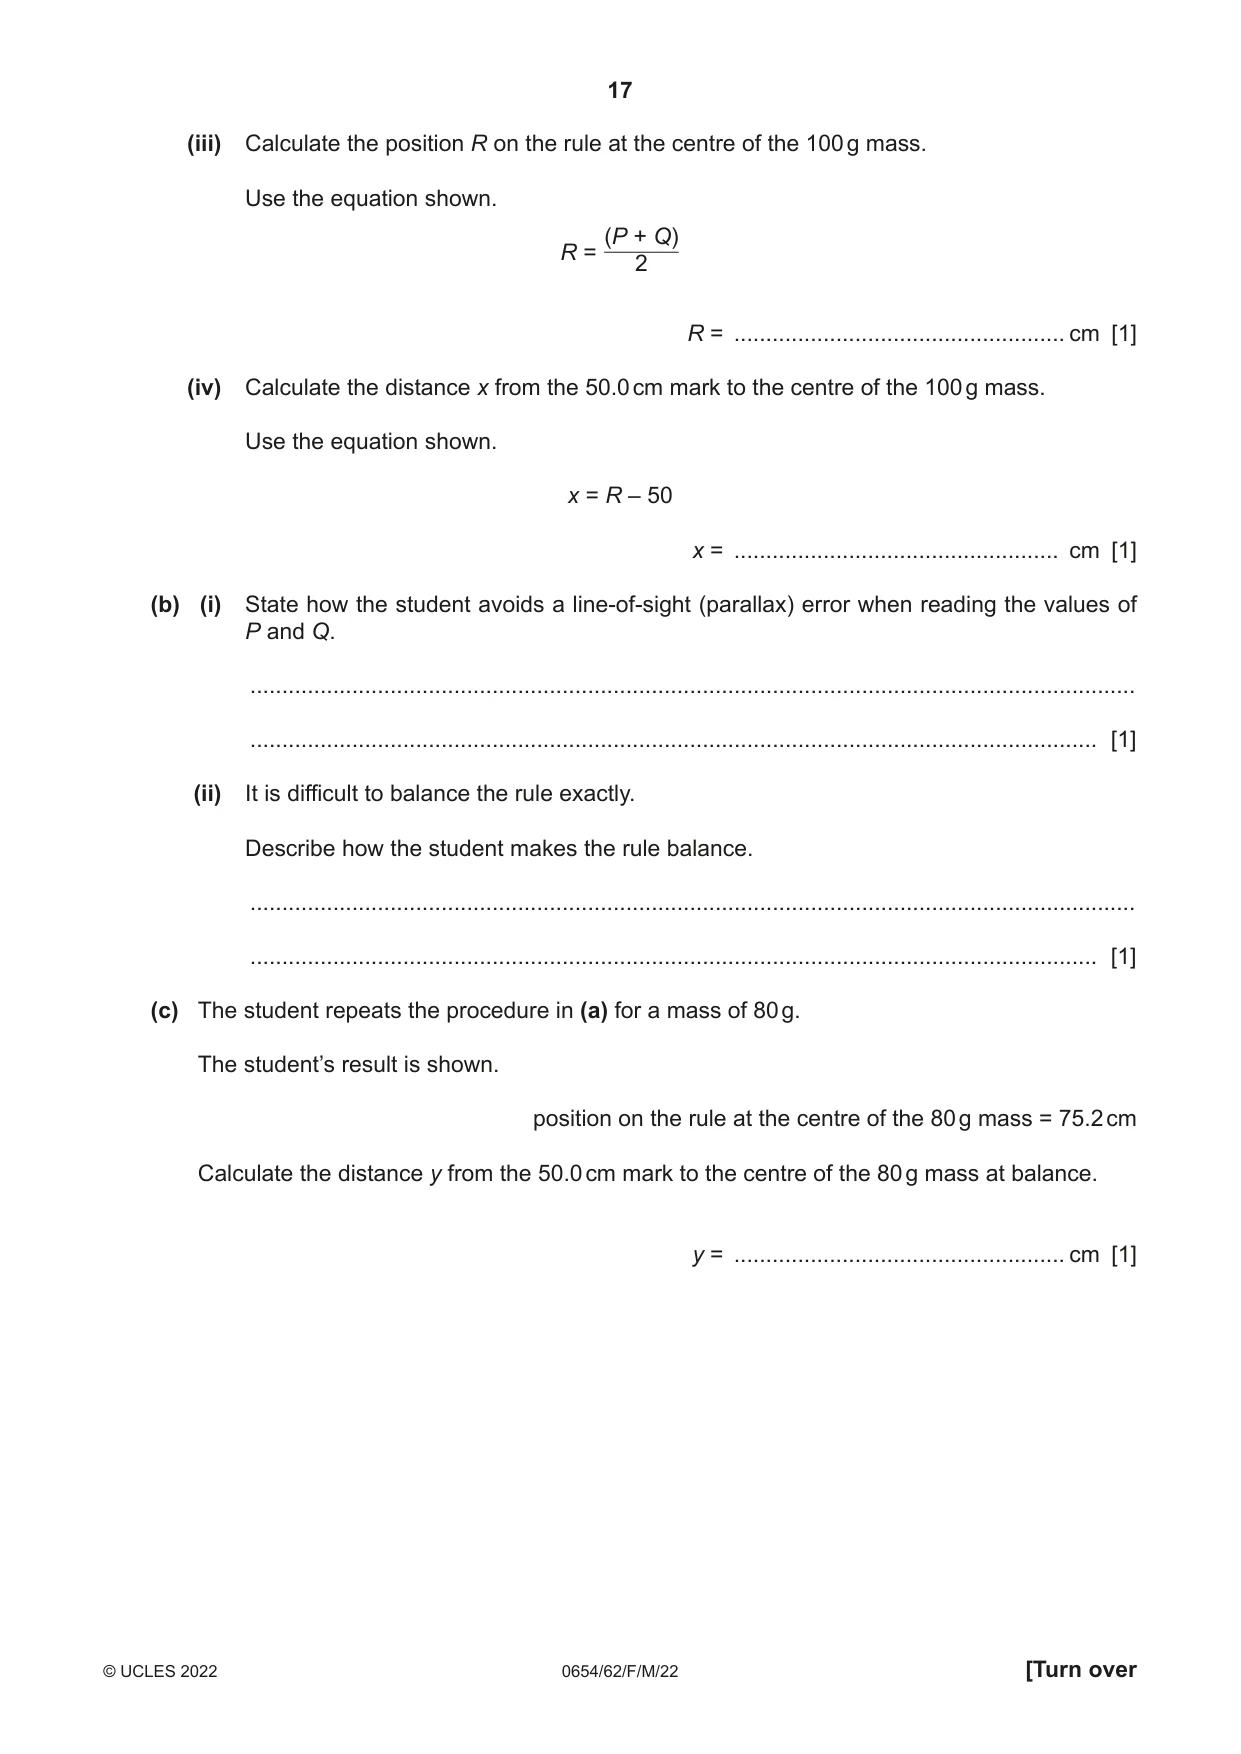
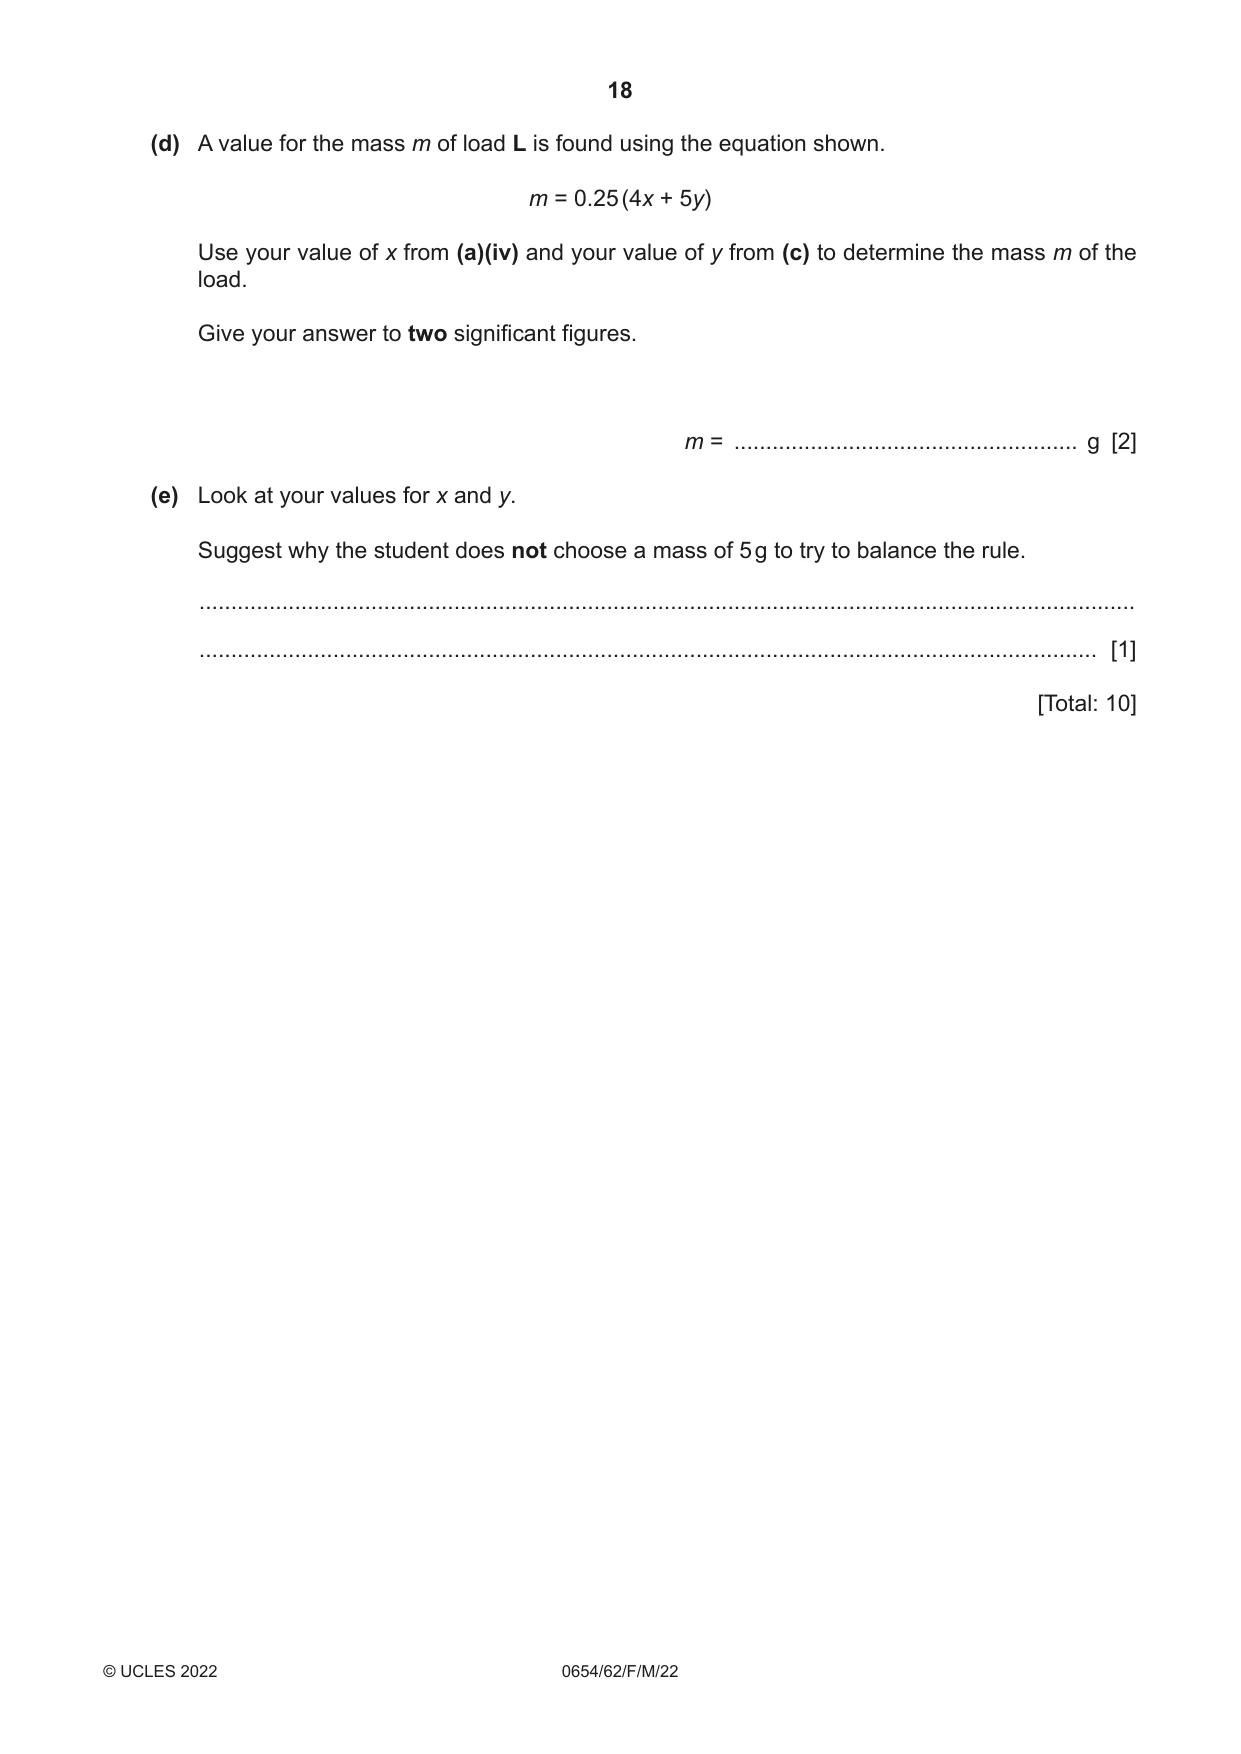
5 A student determines the mass m of a load L by a balancing method. (a) Procedure The student: • fixes a load to a metre rule with the centre of the load over the 10.0 cm mark • places a pivot directly under the 50.0 cm mark on the rule • places a 100 g mass on the rule • adjusts the position of the 100 g mass until the rule balances. Fig. 5.1 shows the arrangement at balance. load L 100 g mass x metre rule pivot 10.0 cm mark 50.0 cm mark Fig. 5.1 Fig. 5.2 shows the position of the 100 g mass on the rule at balance. 100 g mass rule 68 71 cm view from above Fig. 5.2 (i) Record the position P of the left-hand edge of the 100 g mass at balance. Give your answer to the nearest 0.1 cm. P = ................................................... cm [1] (ii) Record the position Q of the right-hand edge of the 100 g mass at balance. Give your answer to the nearest 0.1 cm. Q = ................................................... cm [1] (iii) Calculate the position R on the rule at the centre of the 100 g mass. Use the equation shown. (P + Q) R = 2 R = .................................................... cm [1] (iv) Calculate the distance x from the 50.0 cm mark to the centre of the 100 g mass. Use the equation shown. x = R – 50 x = ................................................... cm [1] (b) (i) State how the student avoids a line-of-sight (parallax) error when reading the values of P and Q. ........................................................................................................................................... ..................................................................................................................................... [1] (ii) It is difficult to balance the rule exactly. Describe how the student makes the rule balance. ........................................................................................................................................... ..................................................................................................................................... [1] (c) The student repeats the procedure in (a) for a mass of 80 g. The student’s result is shown. position on the rule at the centre of the 80 g mass = 75.2 cm Calculate the distance y from the 50.0 cm mark to the centre of the 80 g mass at balance. y = .................................................... cm [1] (d) A value for the mass m of load L is found using the equation shown. m = 0.25 (4x + 5y) Use your value of x from (a)(iv) and your value of y from (c) to determine the mass m of the load. Give your answer to two significant figures. m = ...................................................... g [2] (e) Look at your values for x and y. Suggest why the student does not choose a mass of 5 g to try to balance the rule. ................................................................................................................................................... ............................................................................................................................................. [1] [Total: 10]
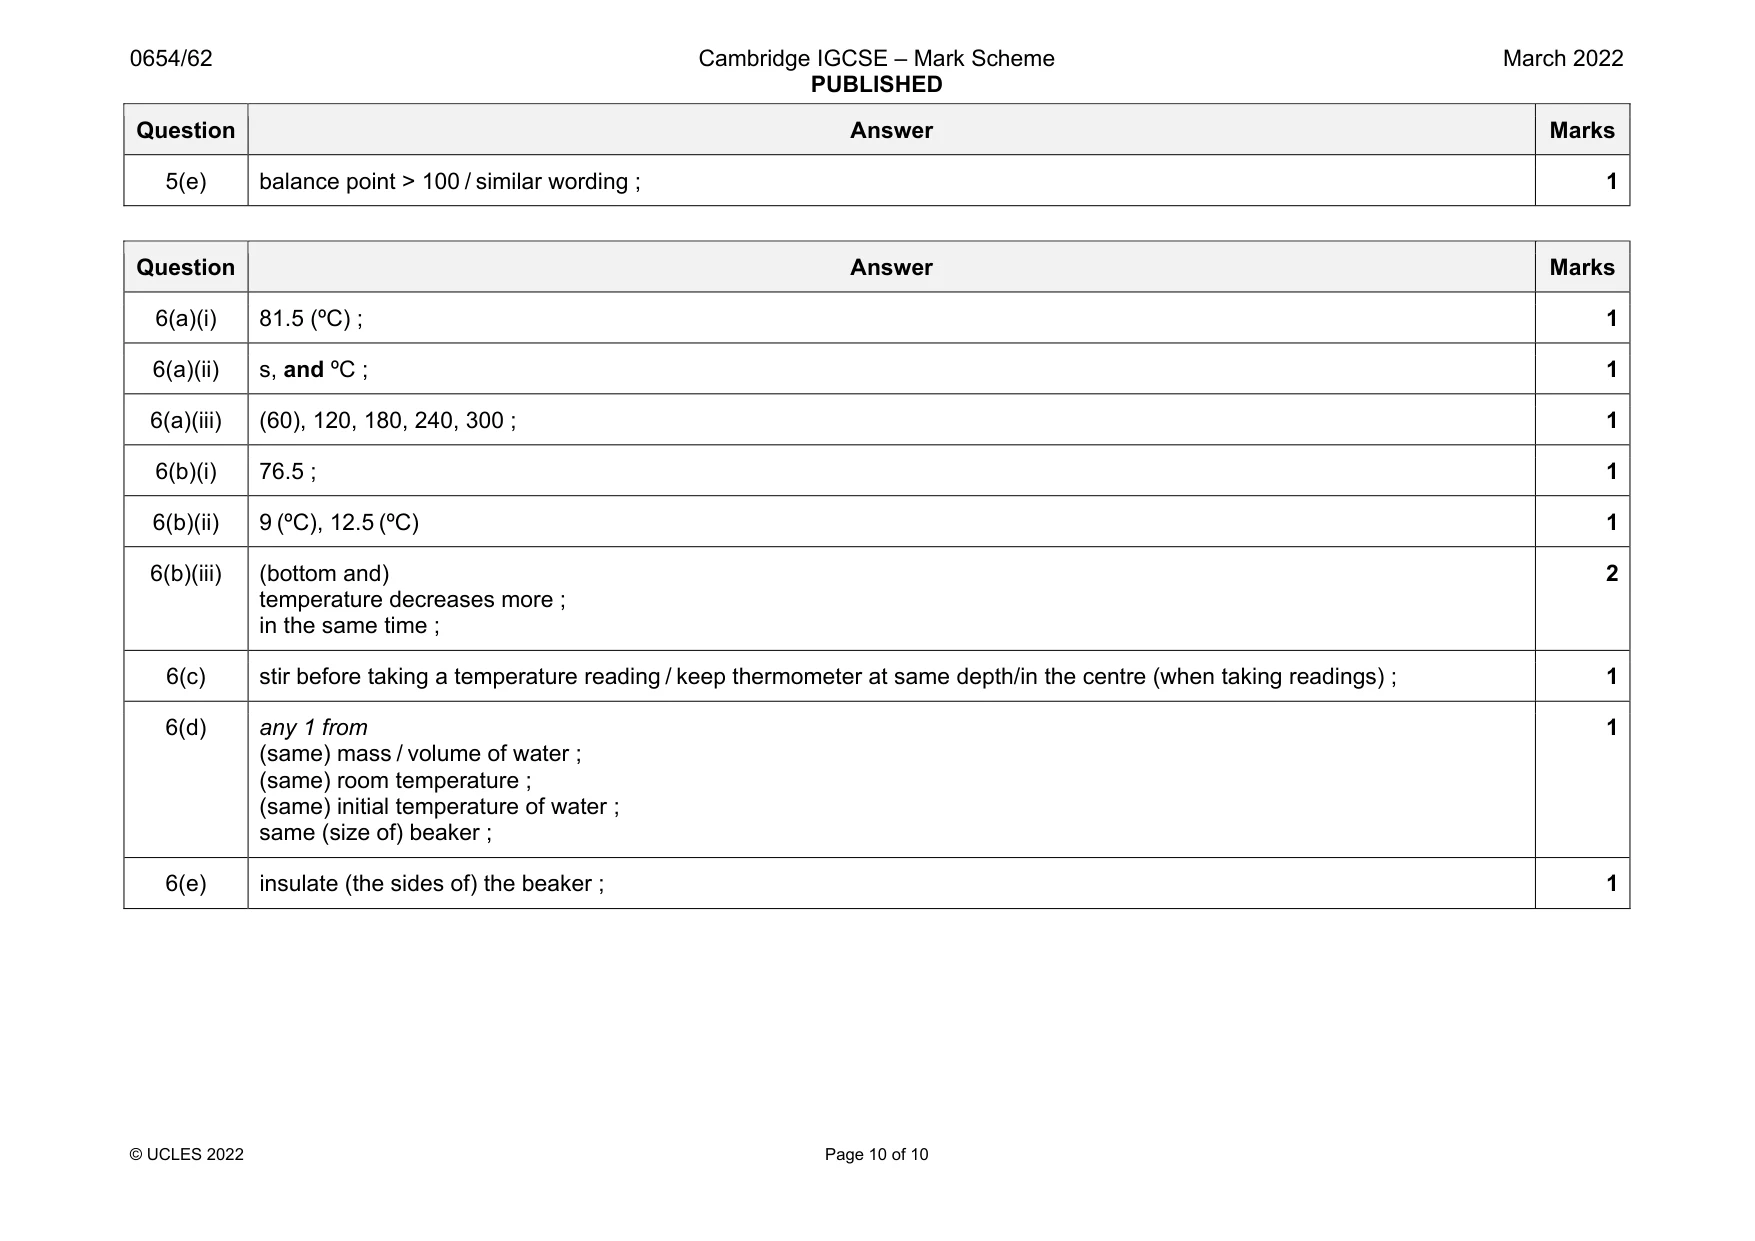
Mark scheme: 5(a)(i) 68.7 (cm) ; 1 5(a)(ii) 70.9 (cm) ; 1 5(a)(iii) 69.8 (cm) ; 1 5(a)(iv) 19.8 (cm) ; 1 5(b)(i) reads the scale at right angles / perpendicular (to it) ; 1 5(b)(ii) adjust mass (slowly) until rule tilts one way, adjust again until it (just) tilts the other way AW ; 1 5(c) 25.2 (cm) 1 5(d) 51.3 (g) ; 2 significant figures, expect 51 ; 2 Question Answer Marks 5(e) balance point > 100 / similar wording ; 1
More questions on Physical quantities and measurement techniques
Q6 · A student investigates the cooling of water in a beaker
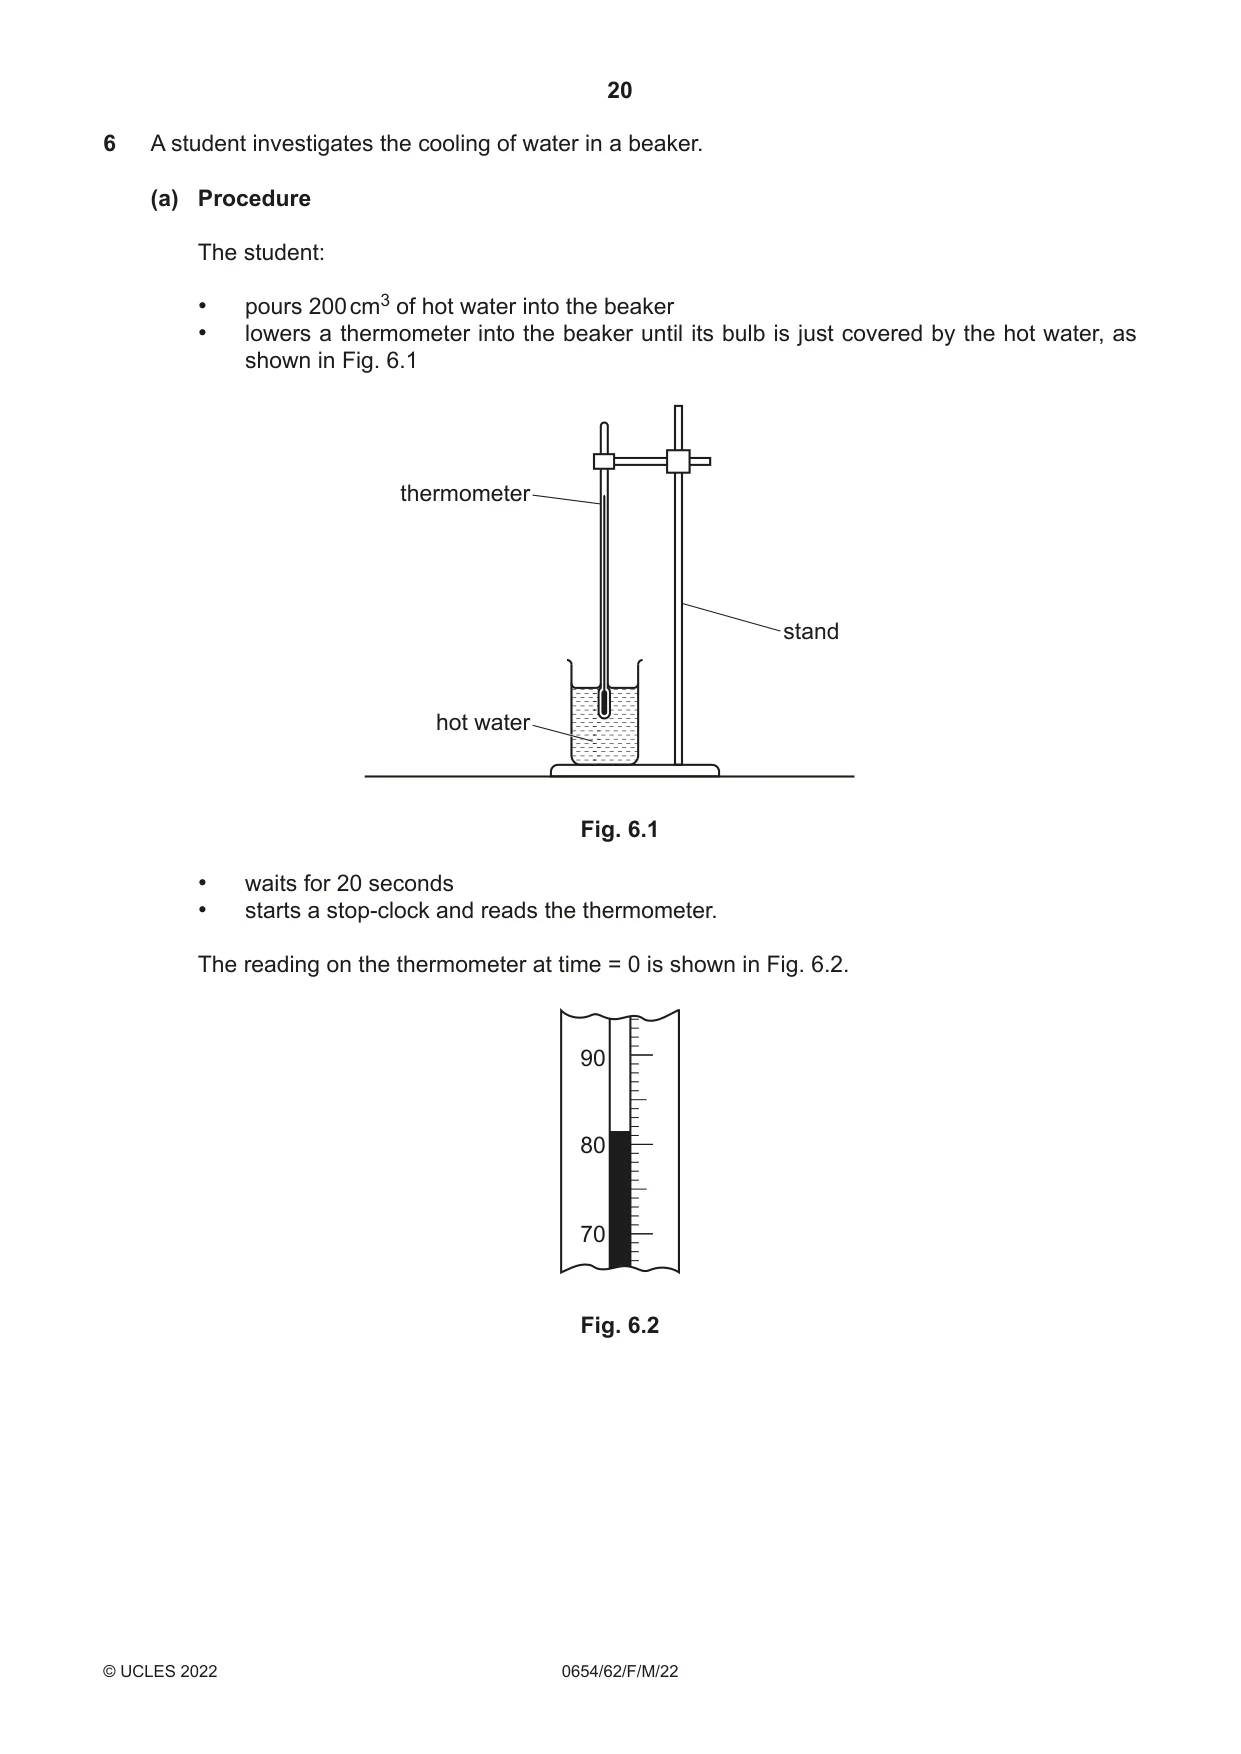
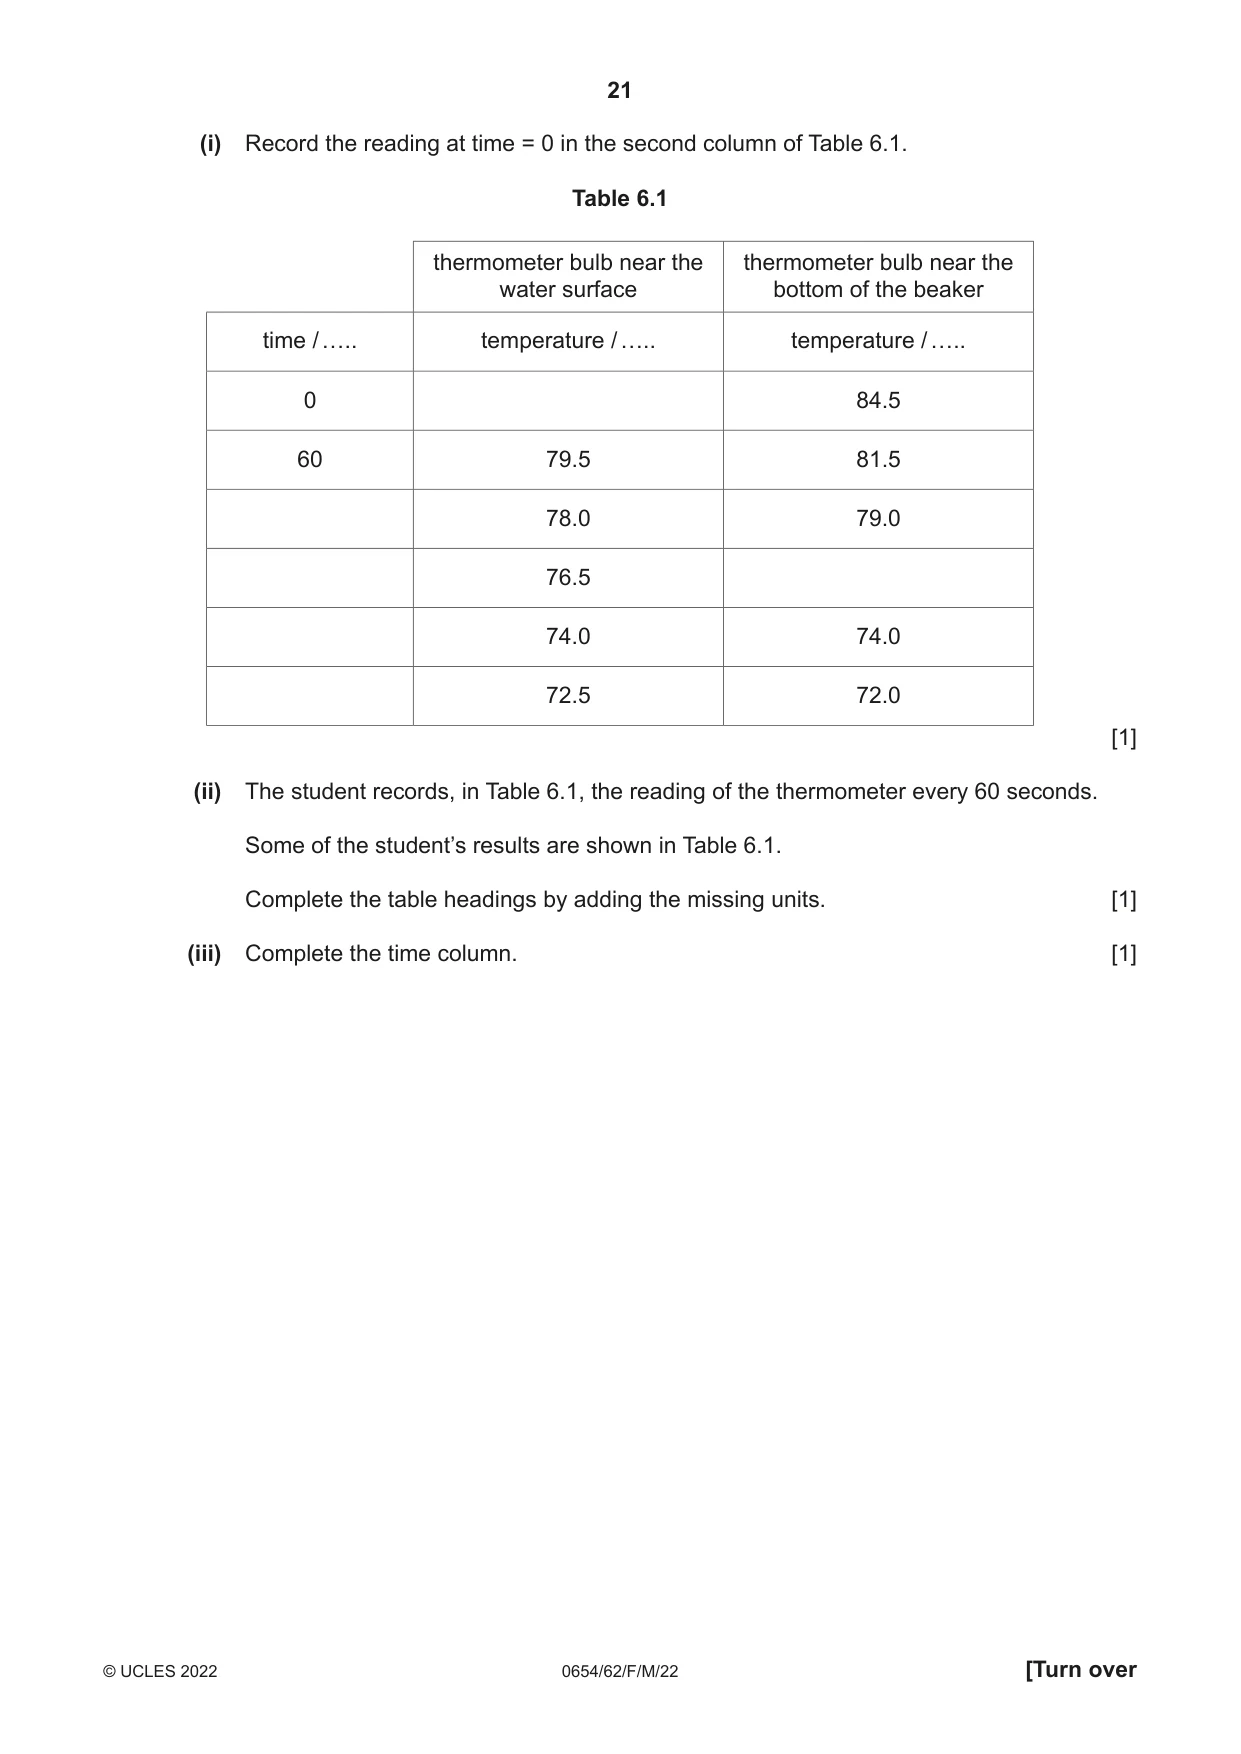
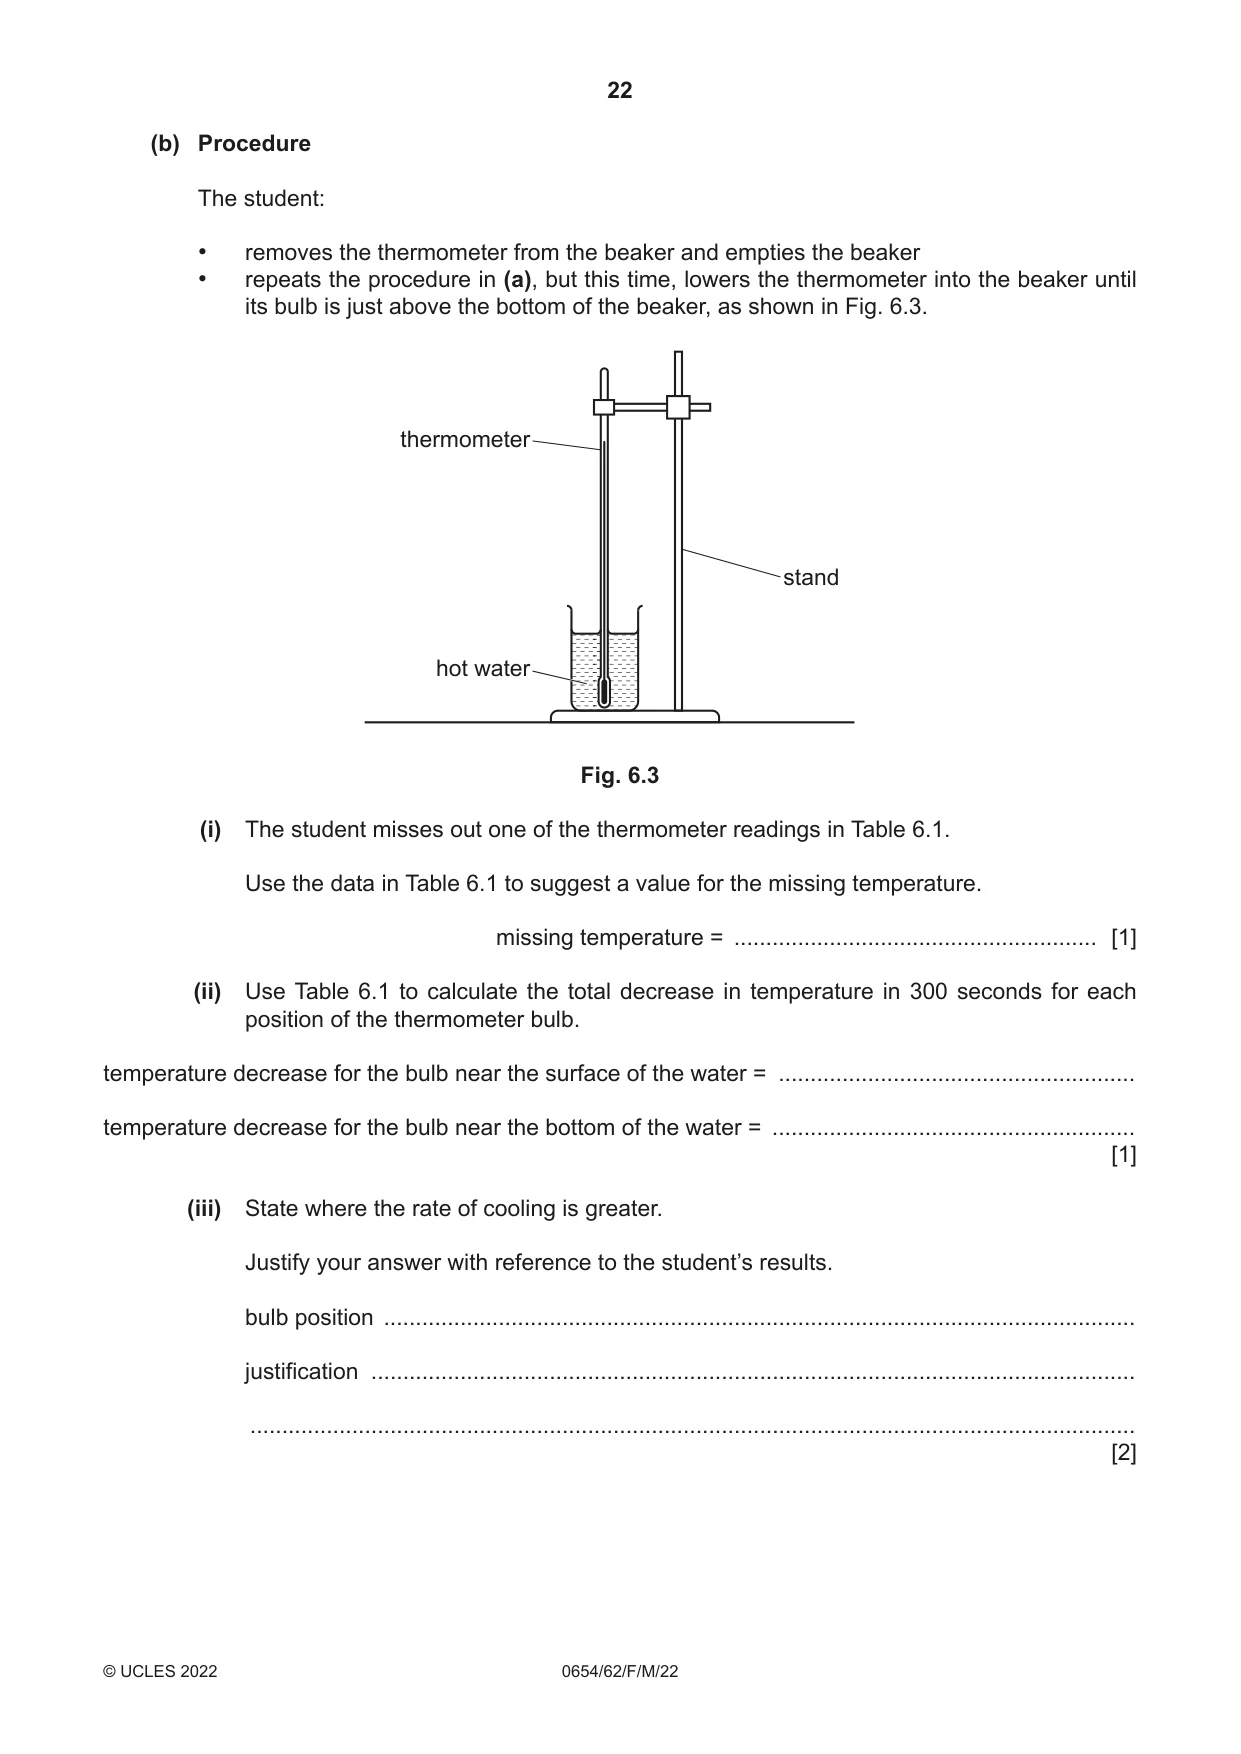
6 A student investigates the cooling of water in a beaker. (a) Procedure The student: • pours 200 cm3 of hot water into the beaker • lowers a thermometer into the beaker until its bulb is just covered by the hot water, as shown in Fig. 6.1 thermometer stand hot water Fig. 6.1 • waits for 20 seconds • starts a stop-clock and reads the thermometer. The reading on the thermometer at time = 0 is shown in Fig. 6.2. 90 80 70 Fig. 6.2 (i) Record the reading at time = 0 in the second column of Table 6.1. Table 6.1 thermometer bulb near the thermometer bulb near the water surface bottom of the beaker time / ….. temperature / ….. temperature / ….. 0 84.5 60 79.5 81.5 78.0 79.0 76.5 74.0 74.0 72.5 72.0 [1] (ii) The student records, in Table 6.1, the reading of the thermometer every 60 seconds. Some of the student’s results are shown in Table 6.1. Complete the table headings by adding the missing units. [1] (iii) Complete the time column. [1] (b) Procedure The student: • removes the thermometer from the beaker and empties the beaker • repeats the procedure in (a), but this time, lowers the thermometer into the beaker until its bulb is just above the bottom of the beaker, as shown in Fig. 6.3. thermometer stand hot water Fig. 6.3 (i) The student misses out one of the thermometer readings in Table 6.1. Use the data in Table 6.1 to suggest a value for the missing temperature. missing temperature = ......................................................... [1] (ii) Use Table 6.1 to calculate the total decrease in temperature in 300 seconds for each position of the thermometer bulb. temperature decrease for the bulb near the surface of the water = ........................................................ temperature decrease for the bulb near the bottom of the water = ......................................................... [1] (iii) State where the rate of cooling is greater. Justify your answer with reference to the student’s results. bulb position ...................................................................................................................... justification ........................................................................................................................ ........................................................................................................................................... [2]
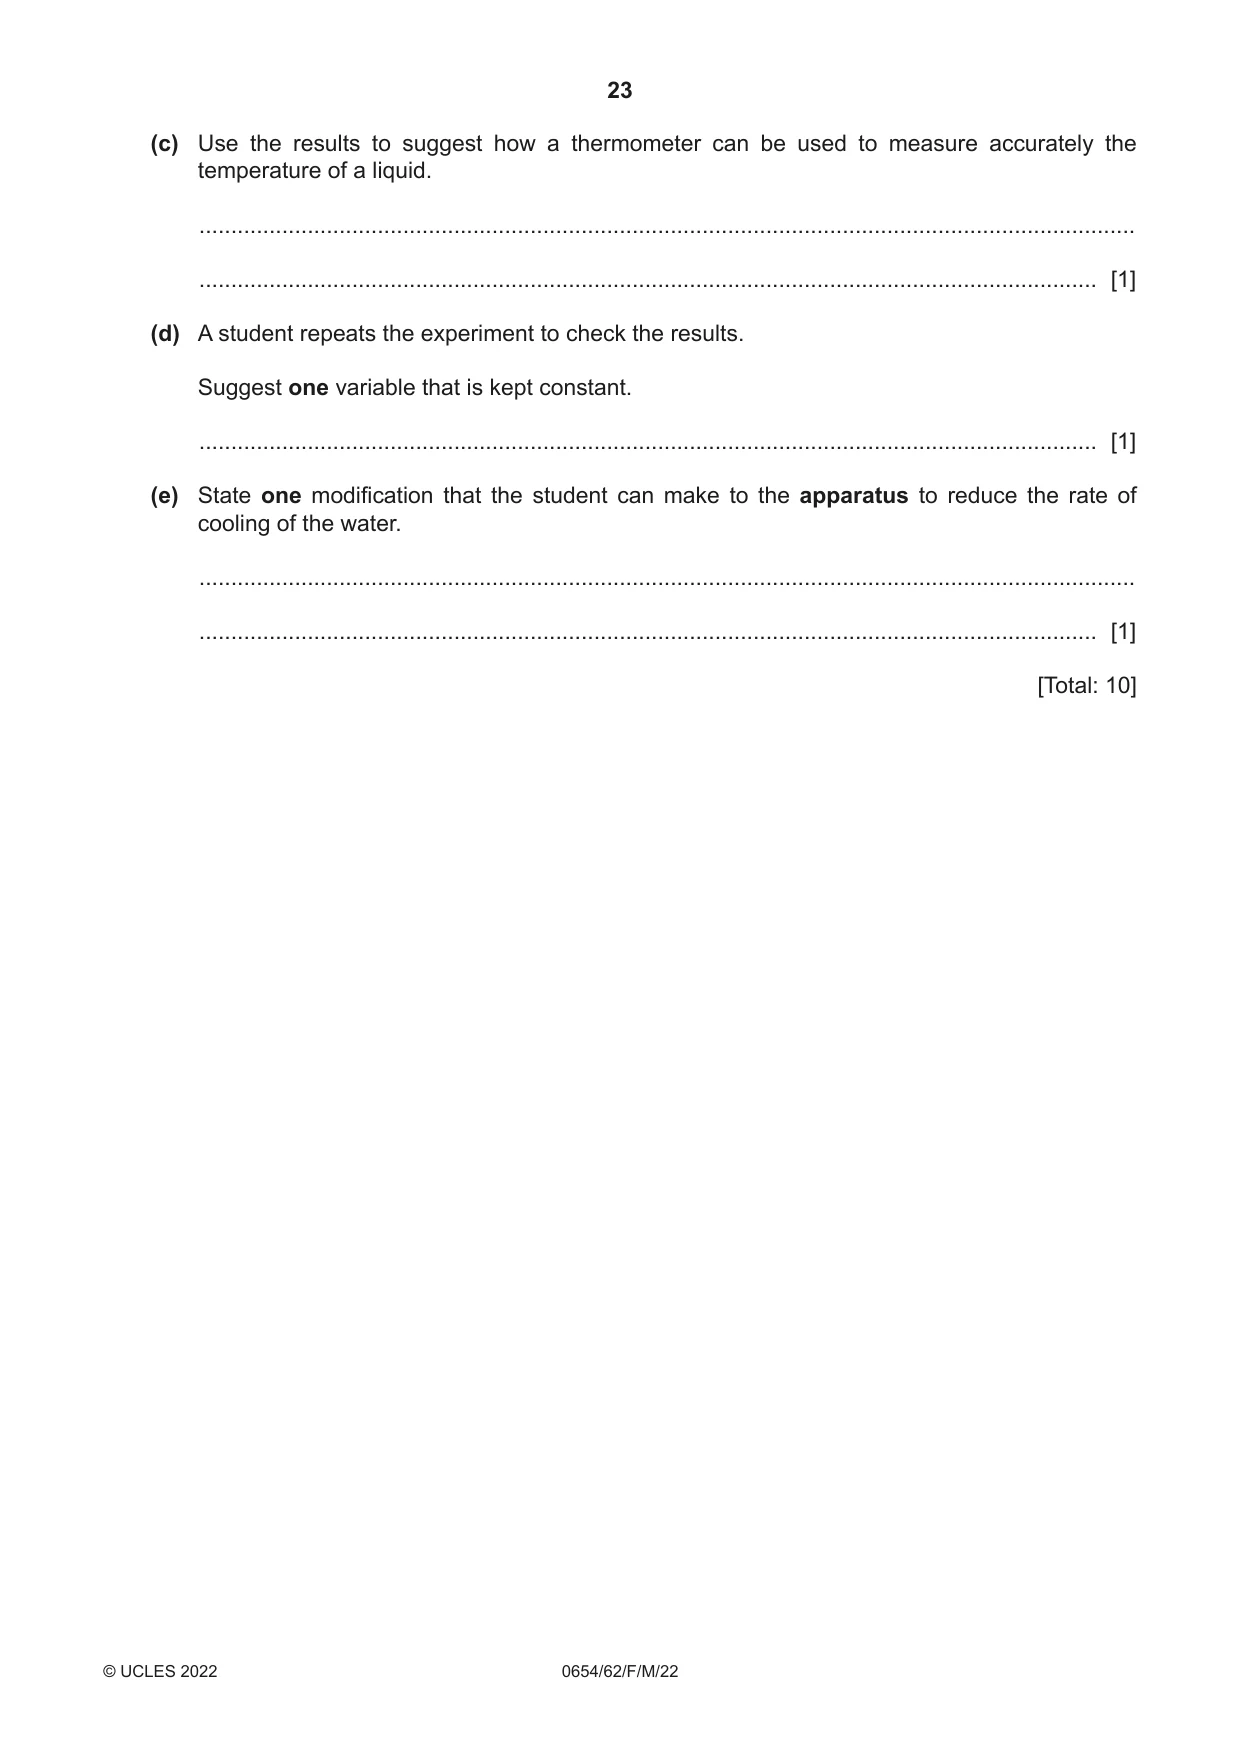
Mark scheme: 6(a)(i) 81.5 (ºC) ; 1 6(a)(ii) s, and ºC ; 1 6(a)(iii) (60), 120, 180, 240, 300 ; 1 6(b)(i) 76.5 ; 1 6(b)(ii) 9 (ºC), 12.5 (ºC) 1 6(b)(iii) (bottom and) temperature decreases more ; in the same time ; 2 6(c) stir before taking a temperature reading / keep thermometer at same depth/in the centre (when taking readings) ; 1 6(d) any 1 from (same) mass / volume of water ; (same) room temperature ; (same) initial temperature of water ; same (size of) beaker ; 1 6(e) insulate (the sides of) the beaker ; 1
What was in this paper
The subtopics covered by these 6 questions, and how many questions each got. Open one in a new tab to see every Cambridge question on it.
What you needed in this session
Cambridge’s own grade thresholds for 2022 Feb/March, Paper 6 · Variant 2. A higher threshold means an easier paper — the bar moves with how the cohort did.