Cambridge IGCSE Sciences - Co-ordinated (Double) 0654 — 2021 Feb/March Paper 6 · Variant 2
0654/62/F/M/21 · 6 questions · 60 marks · ≈68 min
The question paper and its mark scheme, free to read here and free to download. This is Cambridge’s own paper, exactly as it was sat.
Question paper20 pages



Mark scheme10 pages
Answers below. Sit the paper first if you are practising.
Questions as text
Q1 · A student investigates the action of an enzyme on milk
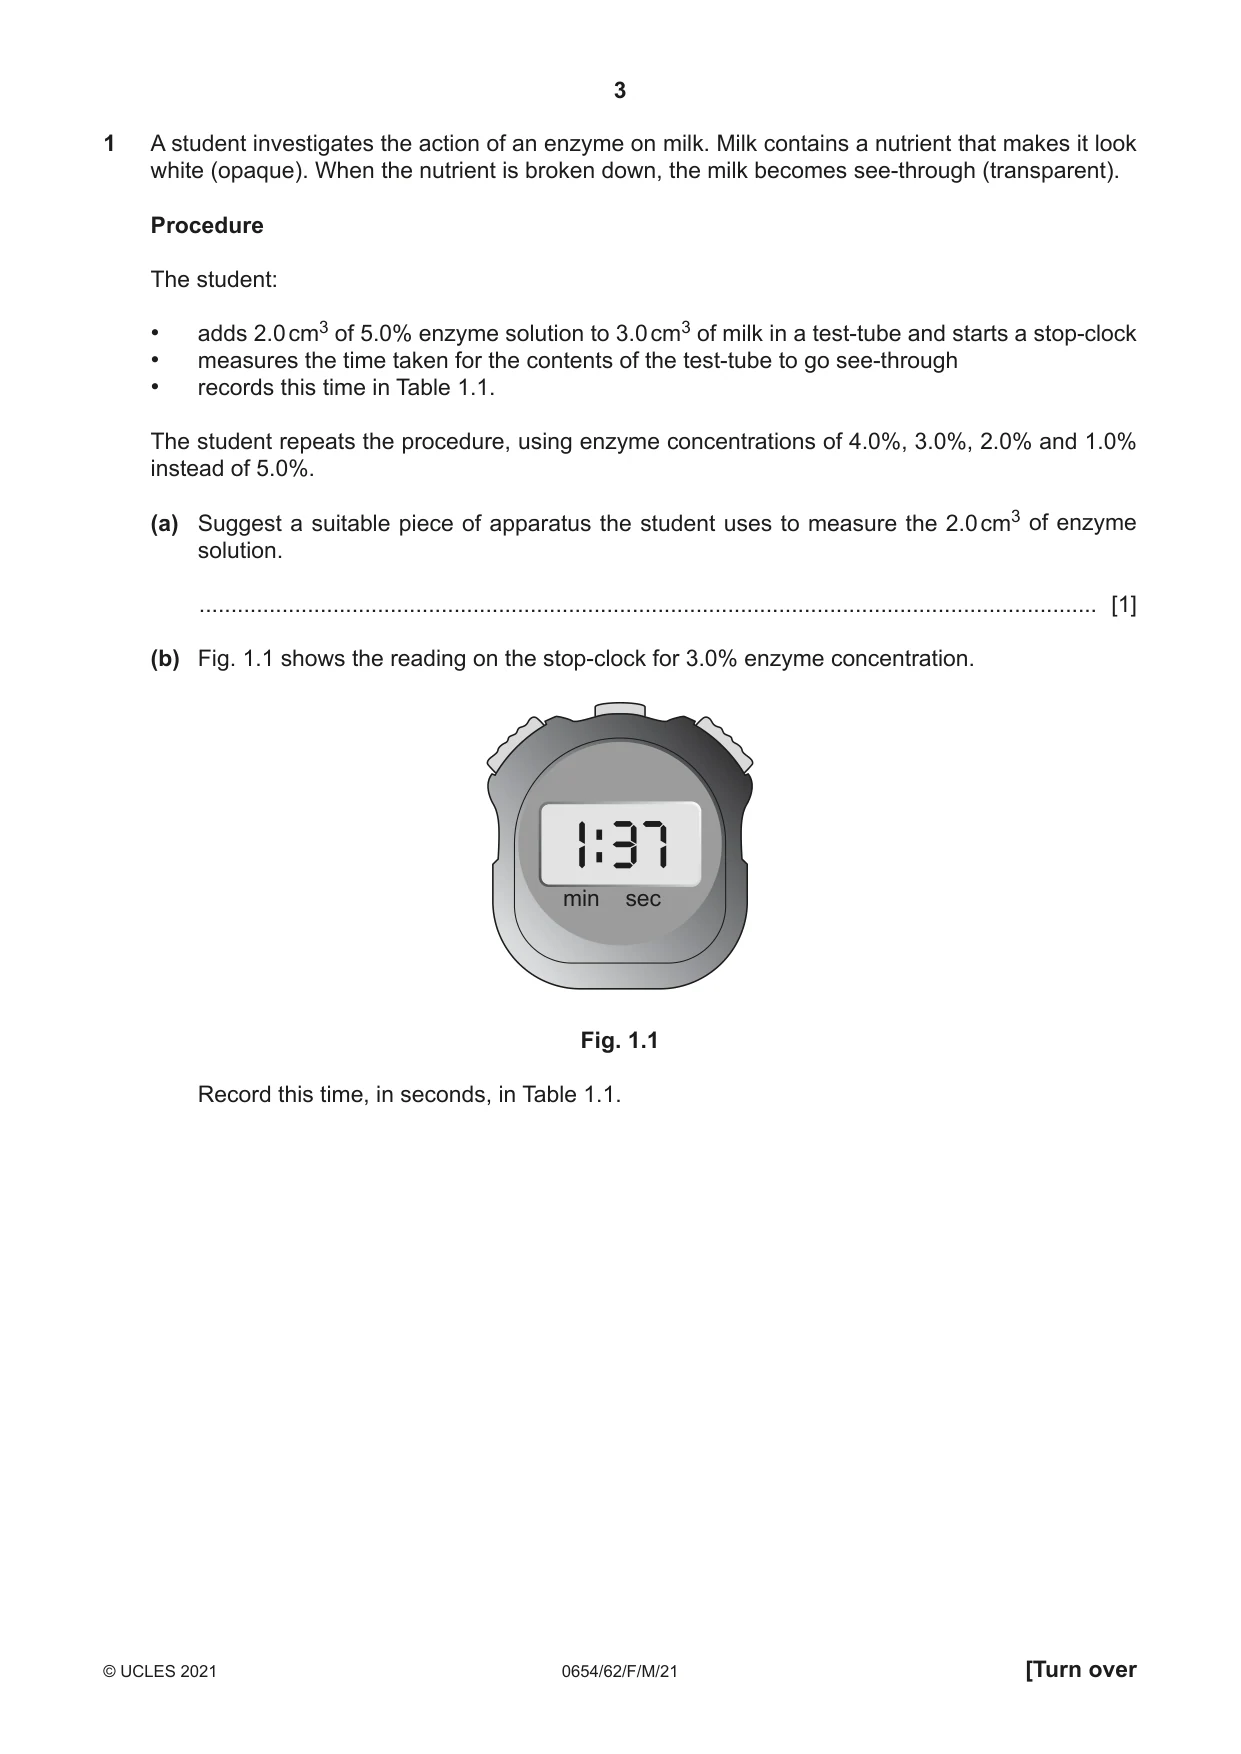
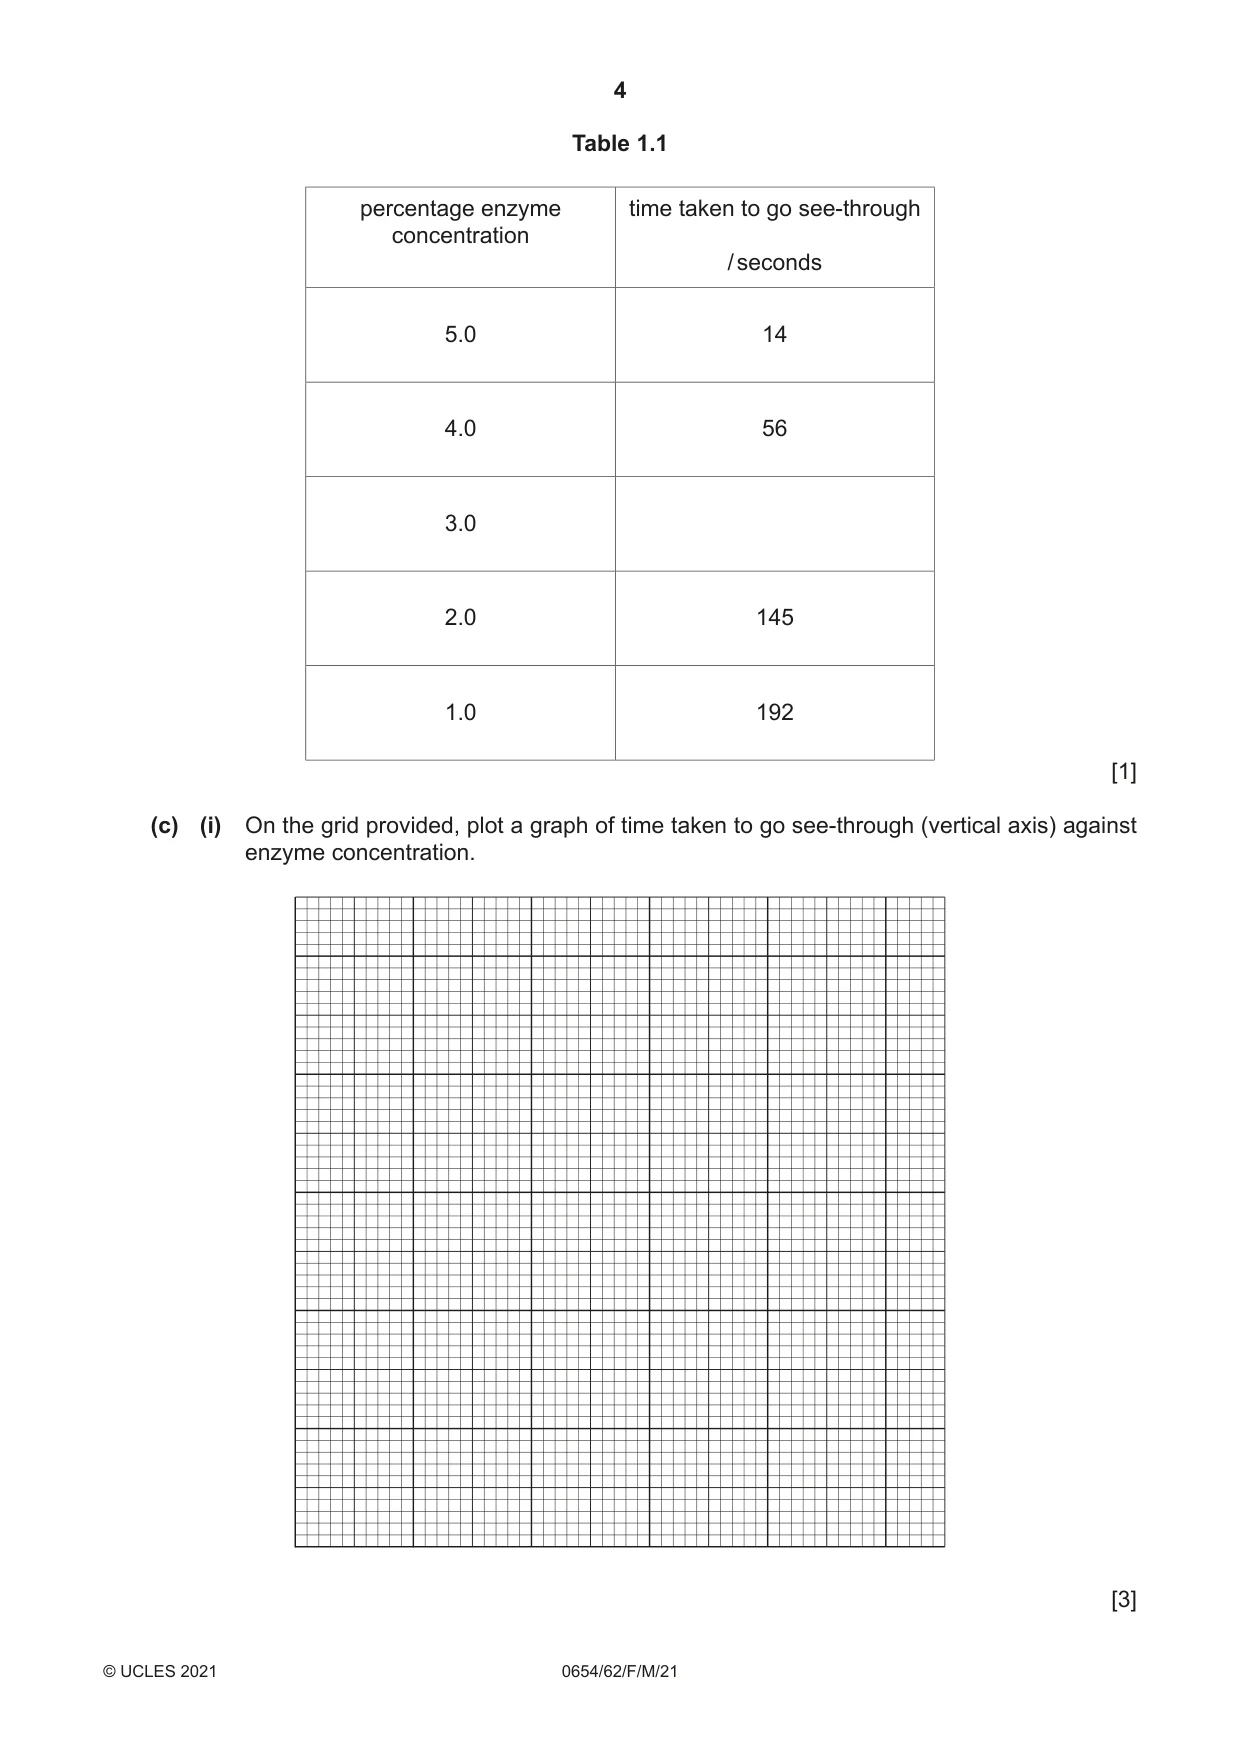
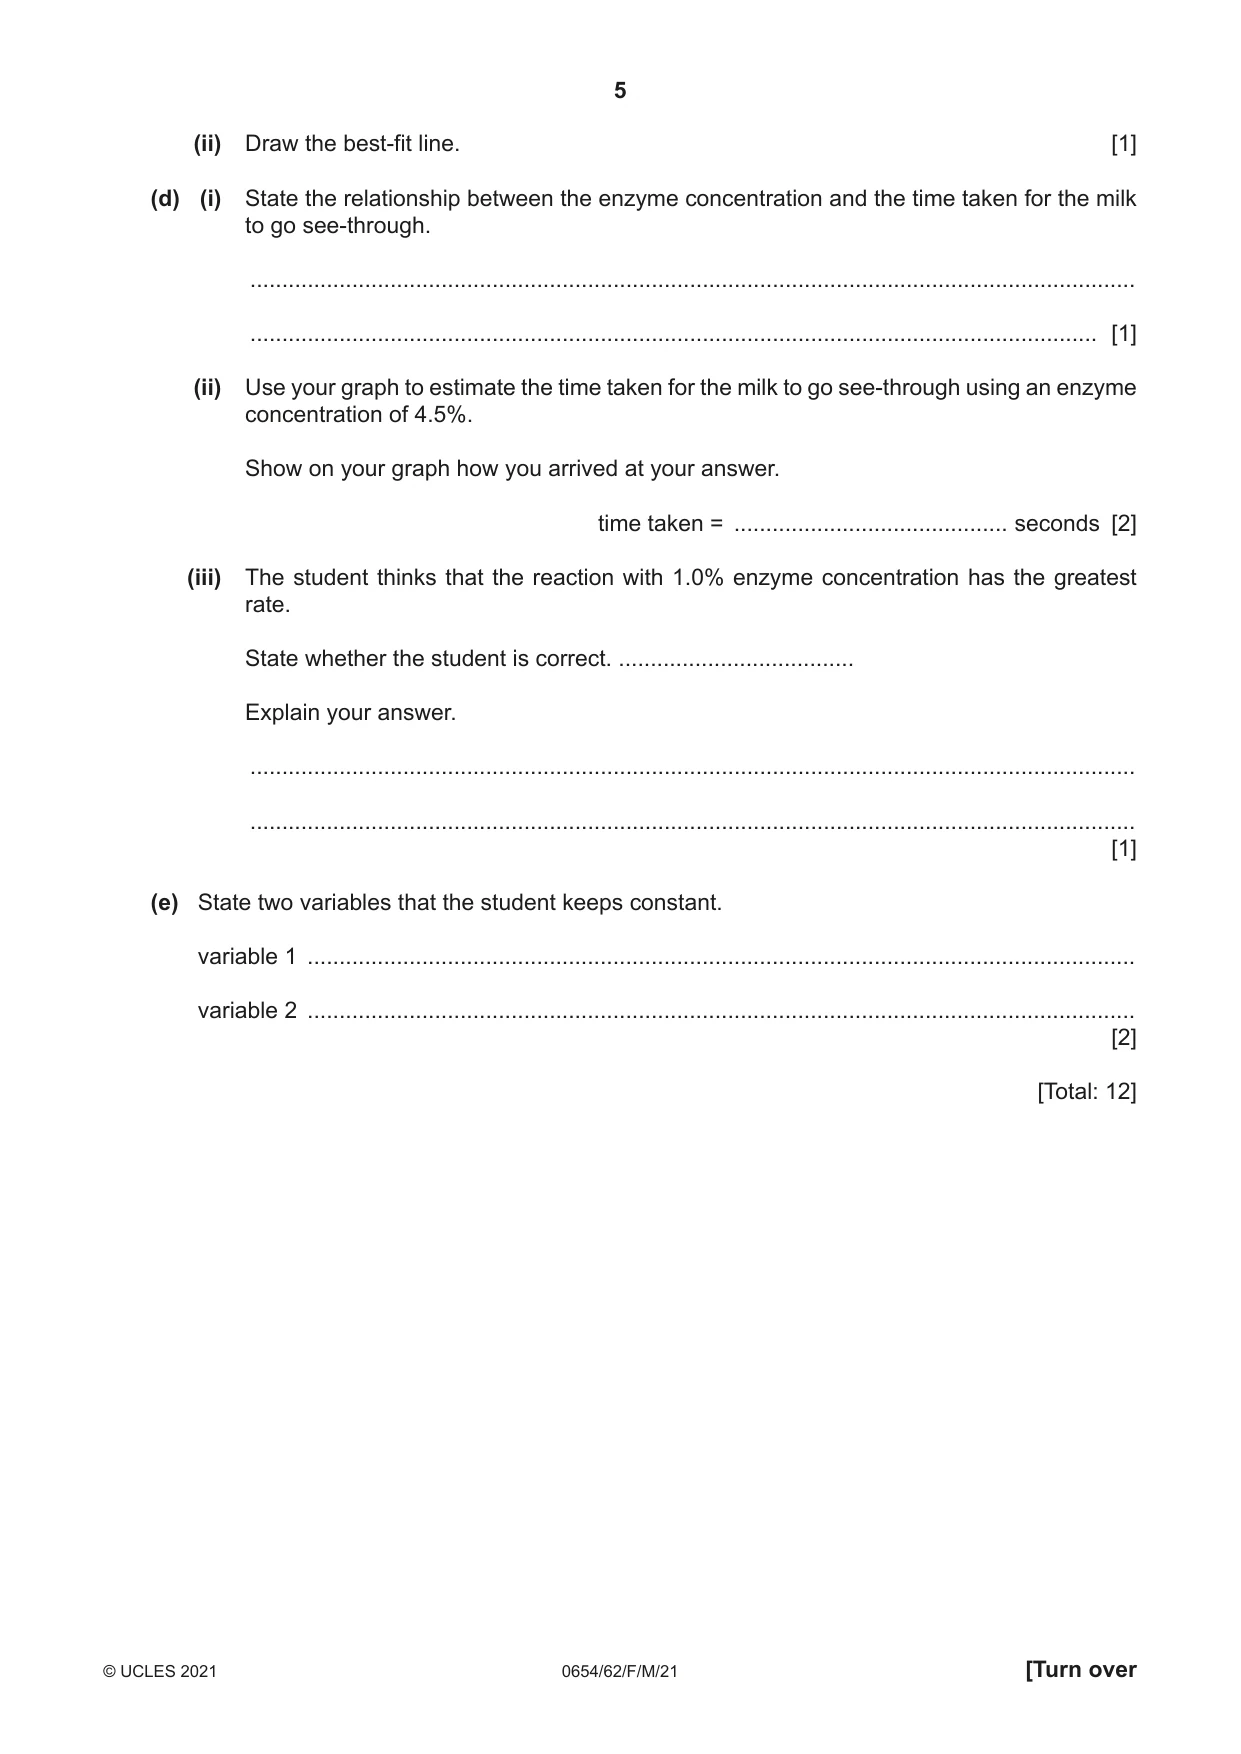
1 A student investigates the action of an enzyme on milk. Milk contains a nutrient that makes it look white (opaque). When the nutrient is broken down, the milk becomes see-through (transparent). Procedure The student: • adds 2.0 cm3 of 5.0% enzyme solution to 3.0 cm3 of milk in a test-tube and starts a stop-clock • measures the time taken for the contents of the test-tube to go see-through • records this time in Table 1.1. The student repeats the procedure, using enzyme concentrations of 4.0%, 3.0%, 2.0% and 1.0% instead of 5.0%. (a) Suggest a suitable piece of apparatus the student uses to measure the 2.0 cm3 of enzyme solution. ............................................................................................................................................. [1] (b) Fig. 1.1 shows the reading on the stop-clock for 3.0% enzyme concentration. min sec Fig. 1.1 Record this time, in seconds, in Table 1.1. Table 1.1 percentage enzyme time taken to go see-through concentration / seconds 5.0 14 4.0 56 3.0 2.0 145 1.0 192 [1] (c) (i) On the grid provided, plot a graph of time taken to go see-through (vertical axis) against enzyme concentration. [3] (ii) Draw the best-fit line. [1] (d) (i) State the relationship between the enzyme concentration and the time taken for the milk to go see-through. ........................................................................................................................................... ..................................................................................................................................... [1] (ii) Use your graph to estimate the time taken for the milk to go see-through using an enzyme concentration of 4.5%. Show on your graph how you arrived at your answer. time taken = ........................................... seconds [2] (iii) The student thinks that the reaction with 1.0% enzyme concentration has the greatest rate. State whether the student is correct. ..................................... Explain your answer. ........................................................................................................................................... ........................................................................................................................................... [1] (e) State two variables that the student keeps constant. variable 1 .................................................................................................................................. variable 2 .................................................................................................................................. [2] [Total: 12]
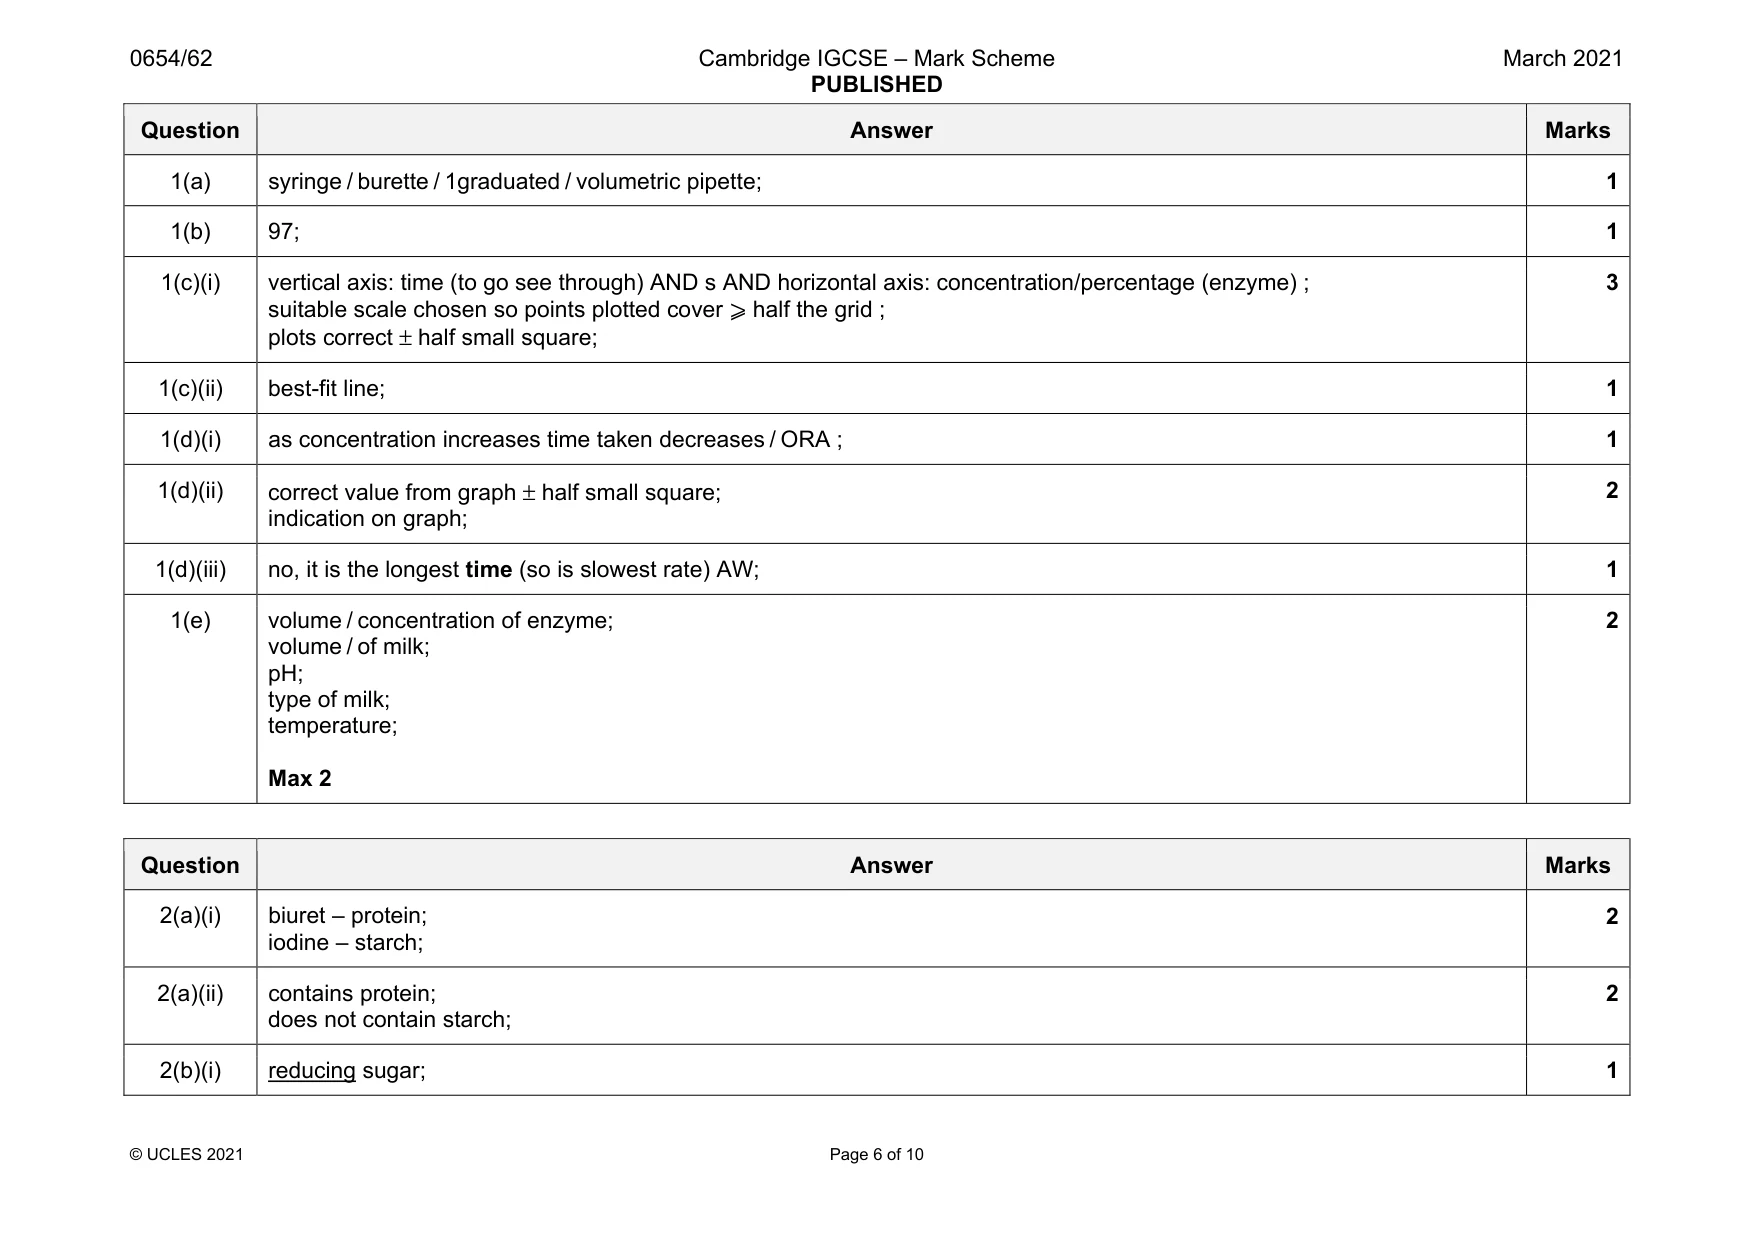
Mark scheme: 1(a) syringe / burette / 1graduated / volumetric pipette; 1 1(b) 97; 1 1(c)(i) vertical axis: time (to go see through) AND s AND horizontal axis: concentration/percentage (enzyme) ; suitable scale chosen so points plotted cover ⩾ half the grid ; plots correct ± half small square; 3 1(c)(ii) best-fit line; 1 1(d)(i) as concentration increases time taken decreases / ORA ; 1 1(d)(ii) correct value from graph ± half small square; indication on graph; 2 1(d)(iii) no, it is the longest time (so is slowest rate) AW; 1 1(e) volume / concentration of enzyme; volume / of milk; pH; type of milk; temperature; Max 2 2
Q2 · A student tests some milk for its nutrient content
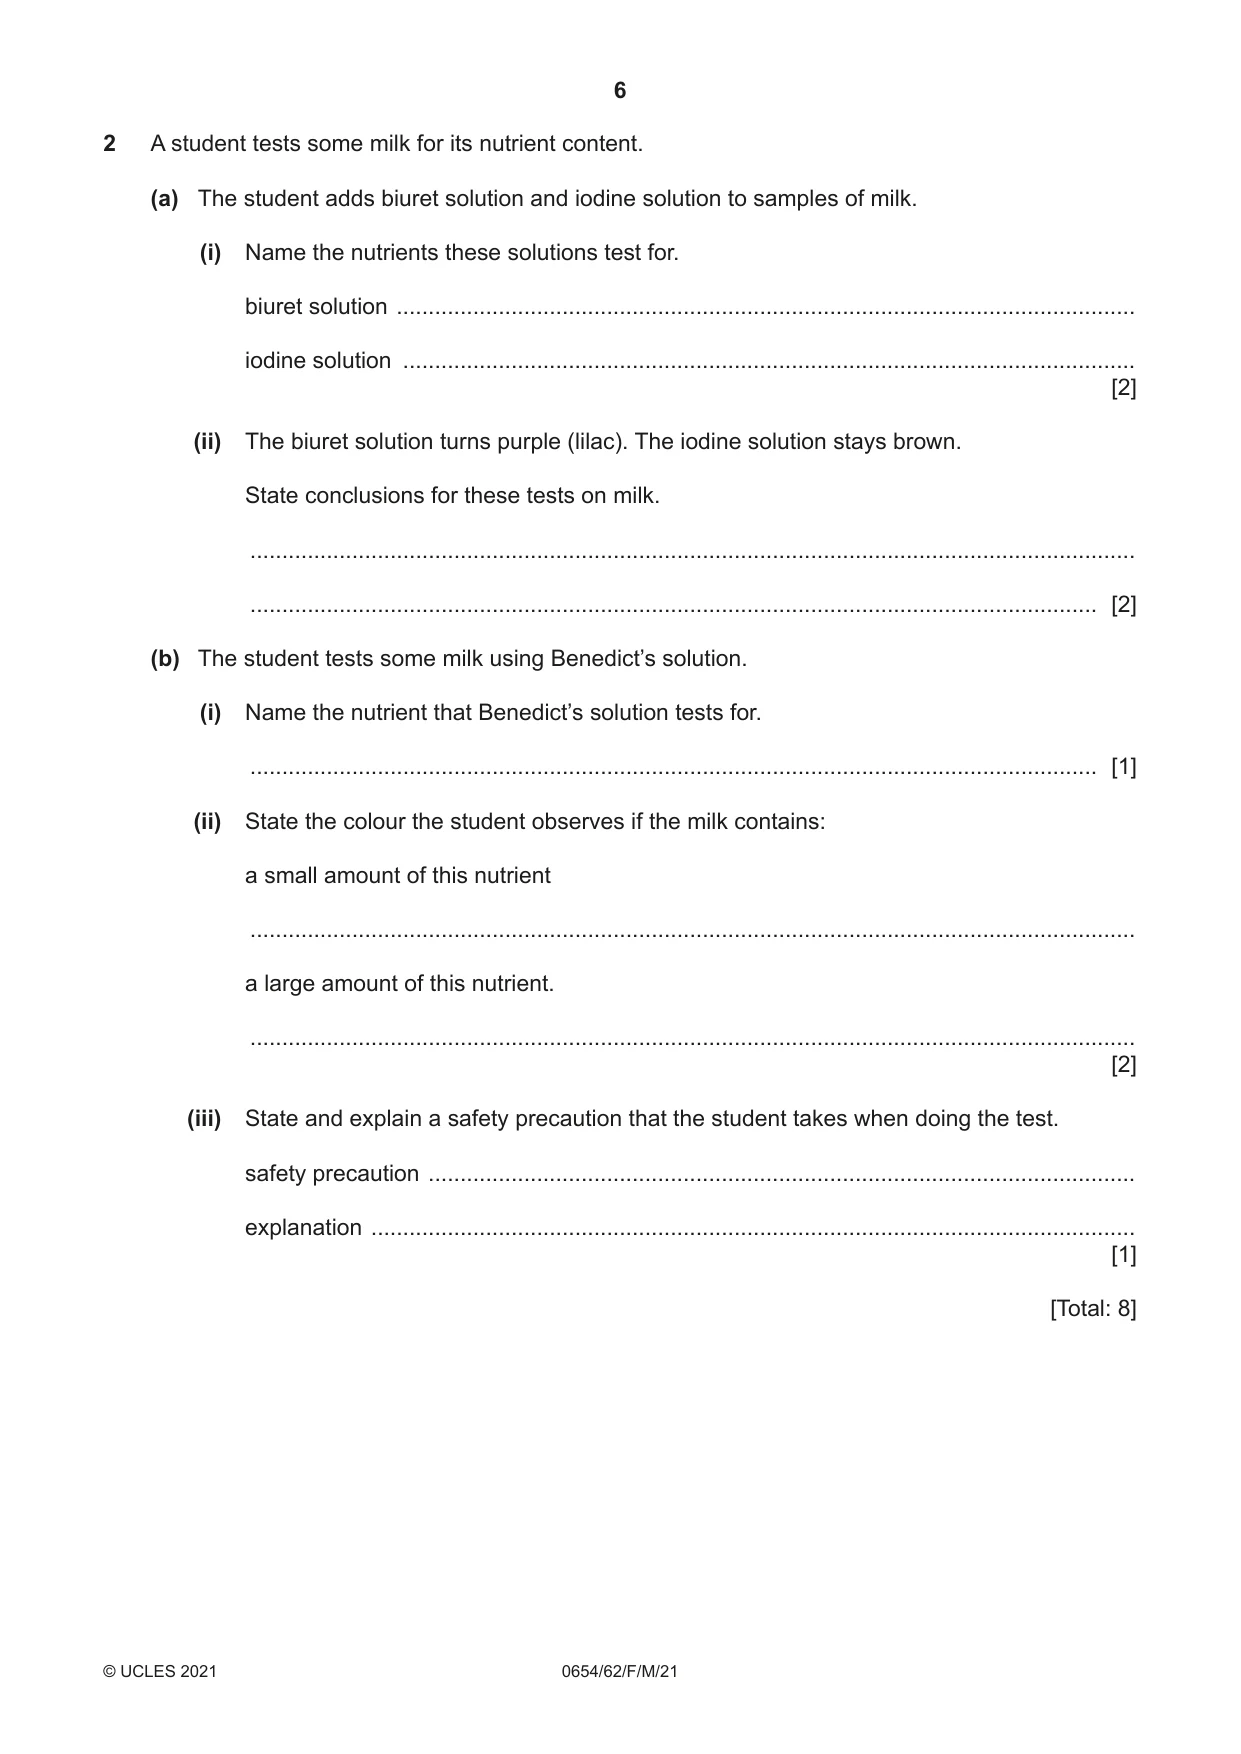
2 A student tests some milk for its nutrient content. (a) The student adds biuret solution and iodine solution to samples of milk. (i) Name the nutrients these solutions test for. biuret solution .................................................................................................................... iodine solution ................................................................................................................... [2] (ii) The biuret solution turns purple (lilac). The iodine solution stays brown. State conclusions for these tests on milk. ........................................................................................................................................... ..................................................................................................................................... [2] (b) The student tests some milk using Benedict’s solution. (i) Name the nutrient that Benedict’s solution tests for. ..................................................................................................................................... [1] (ii) State the colour the student observes if the milk contains: a small amount of this nutrient ........................................................................................................................................... a large amount of this nutrient. ........................................................................................................................................... [2] (iii) State and explain a safety precaution that the student takes when doing the test. safety precaution ............................................................................................................... explanation ........................................................................................................................ [1] [Total: 8]
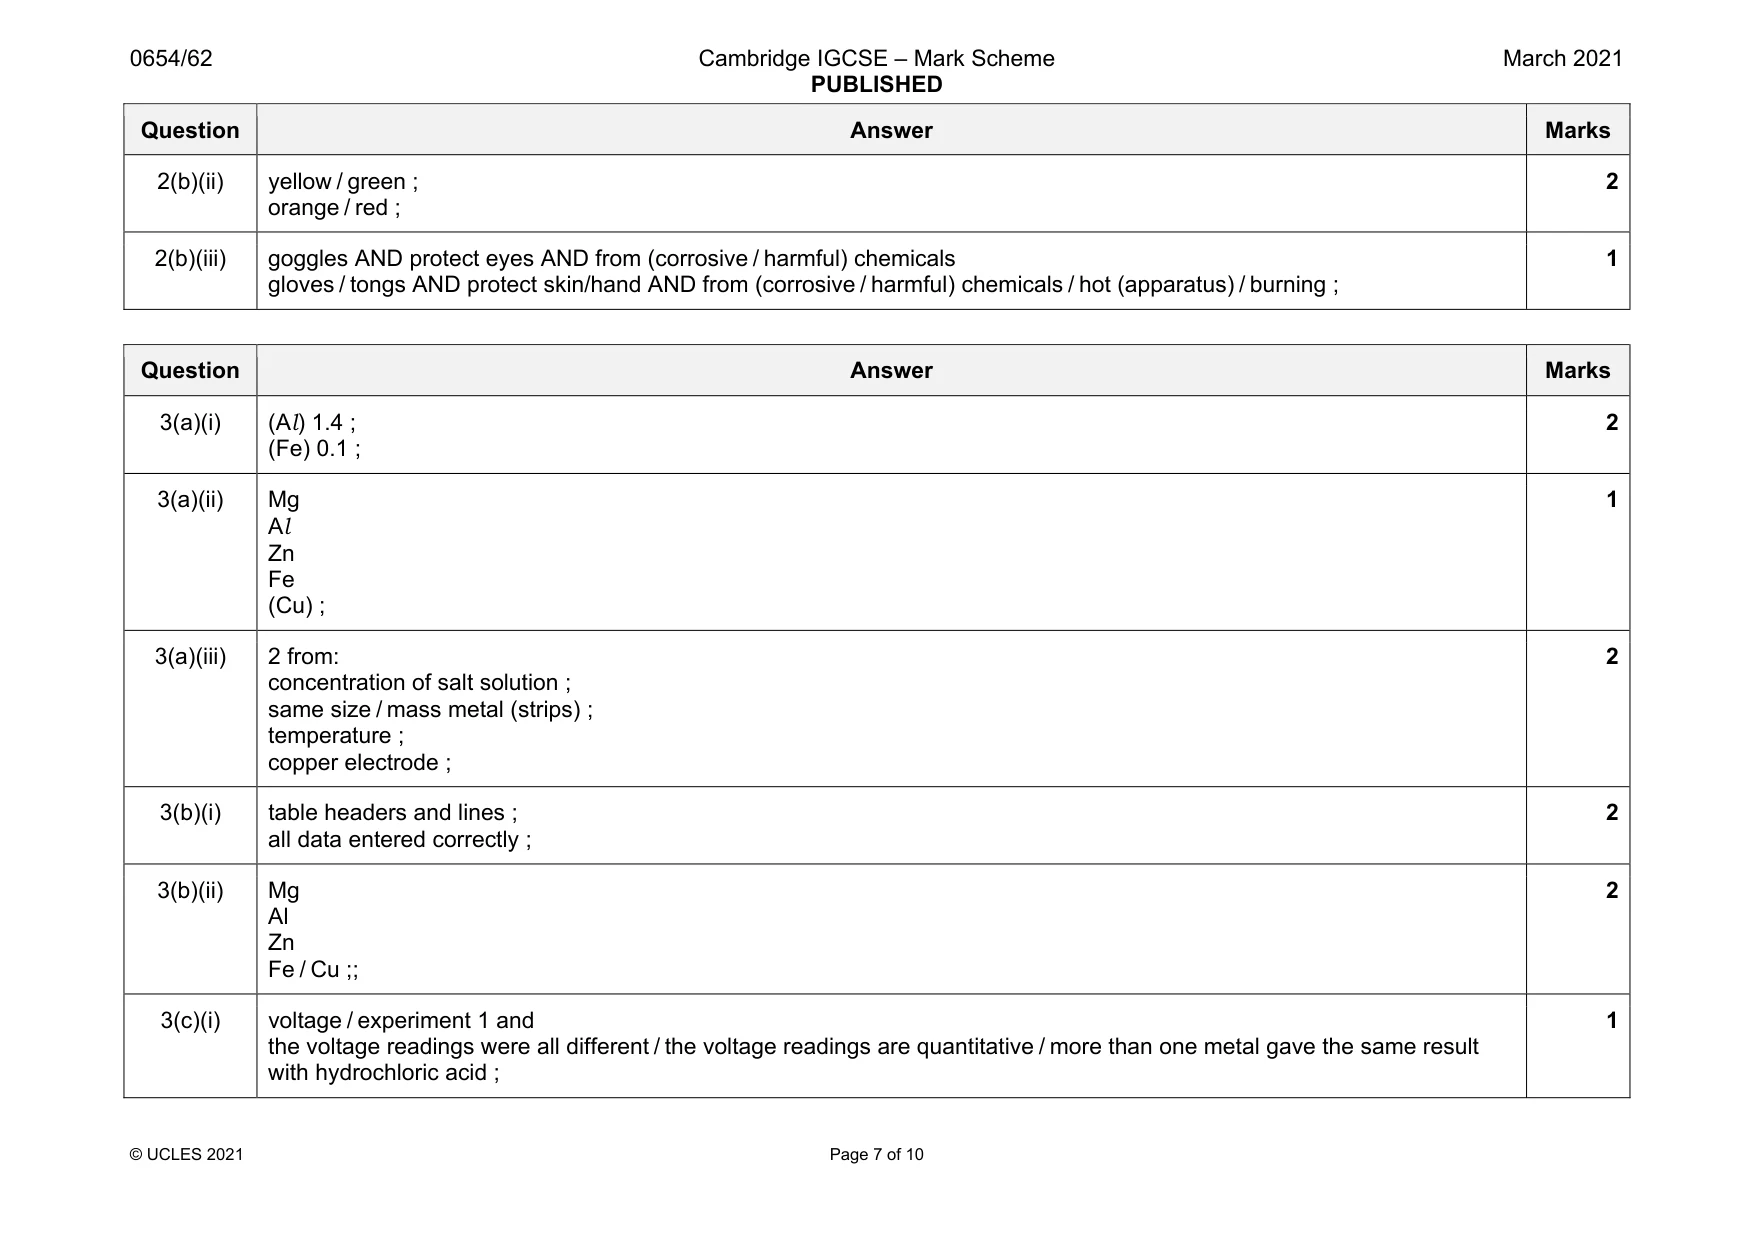
Mark scheme: 2(a)(i) biuret – protein; iodine – starch; 2 2(a)(ii) contains protein; does not contain starch; 2 2(b)(i) reducing sugar; 1 Question Answer Marks 2(b)(ii) yellow / green ; orange / red ; 2 2(b)(iii) goggles AND protect eyes AND from (corrosive / harmful) chemicals gloves / tongs AND protect skin/hand AND from (corrosive / harmful) chemicals / hot (apparatus) / burning ; 1
Q3 · A student does two different experiments to investigate the reactivity of five metals…
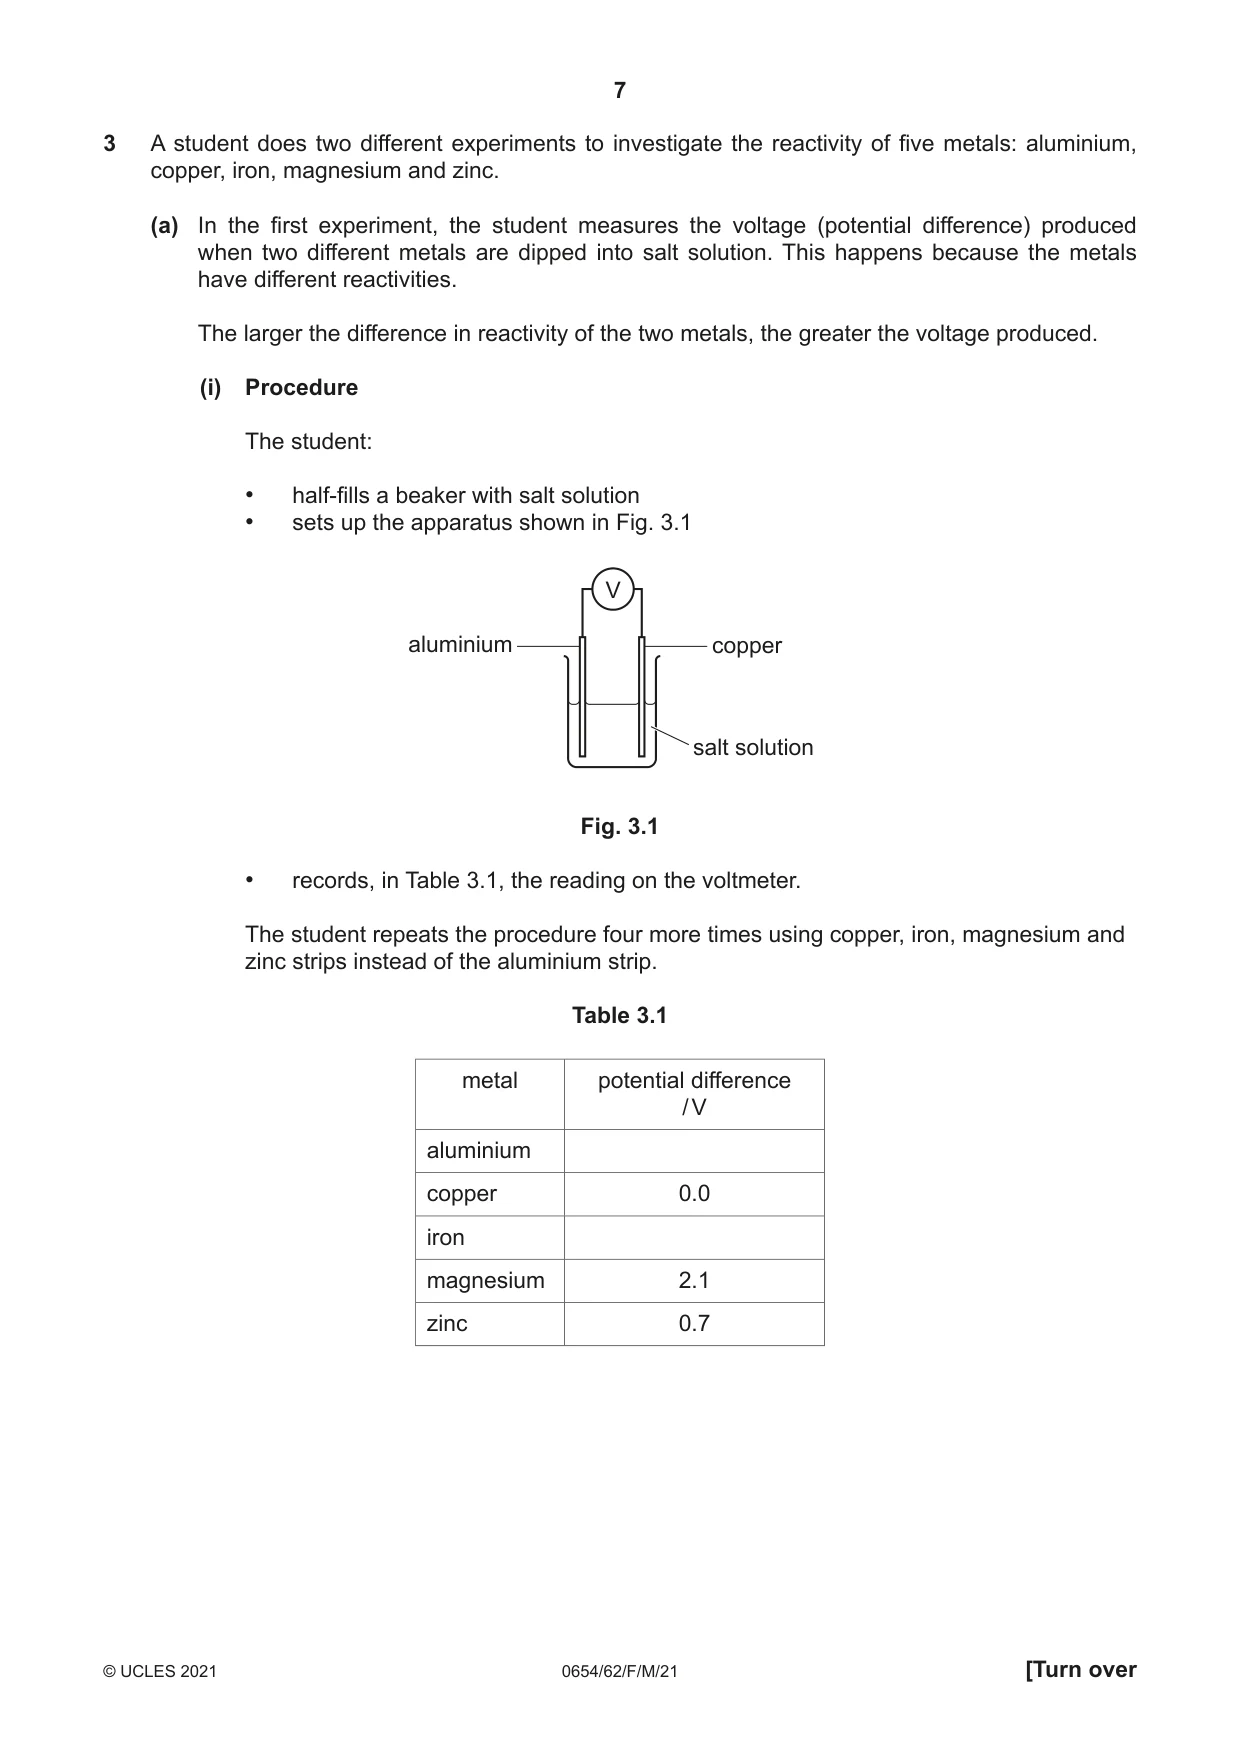
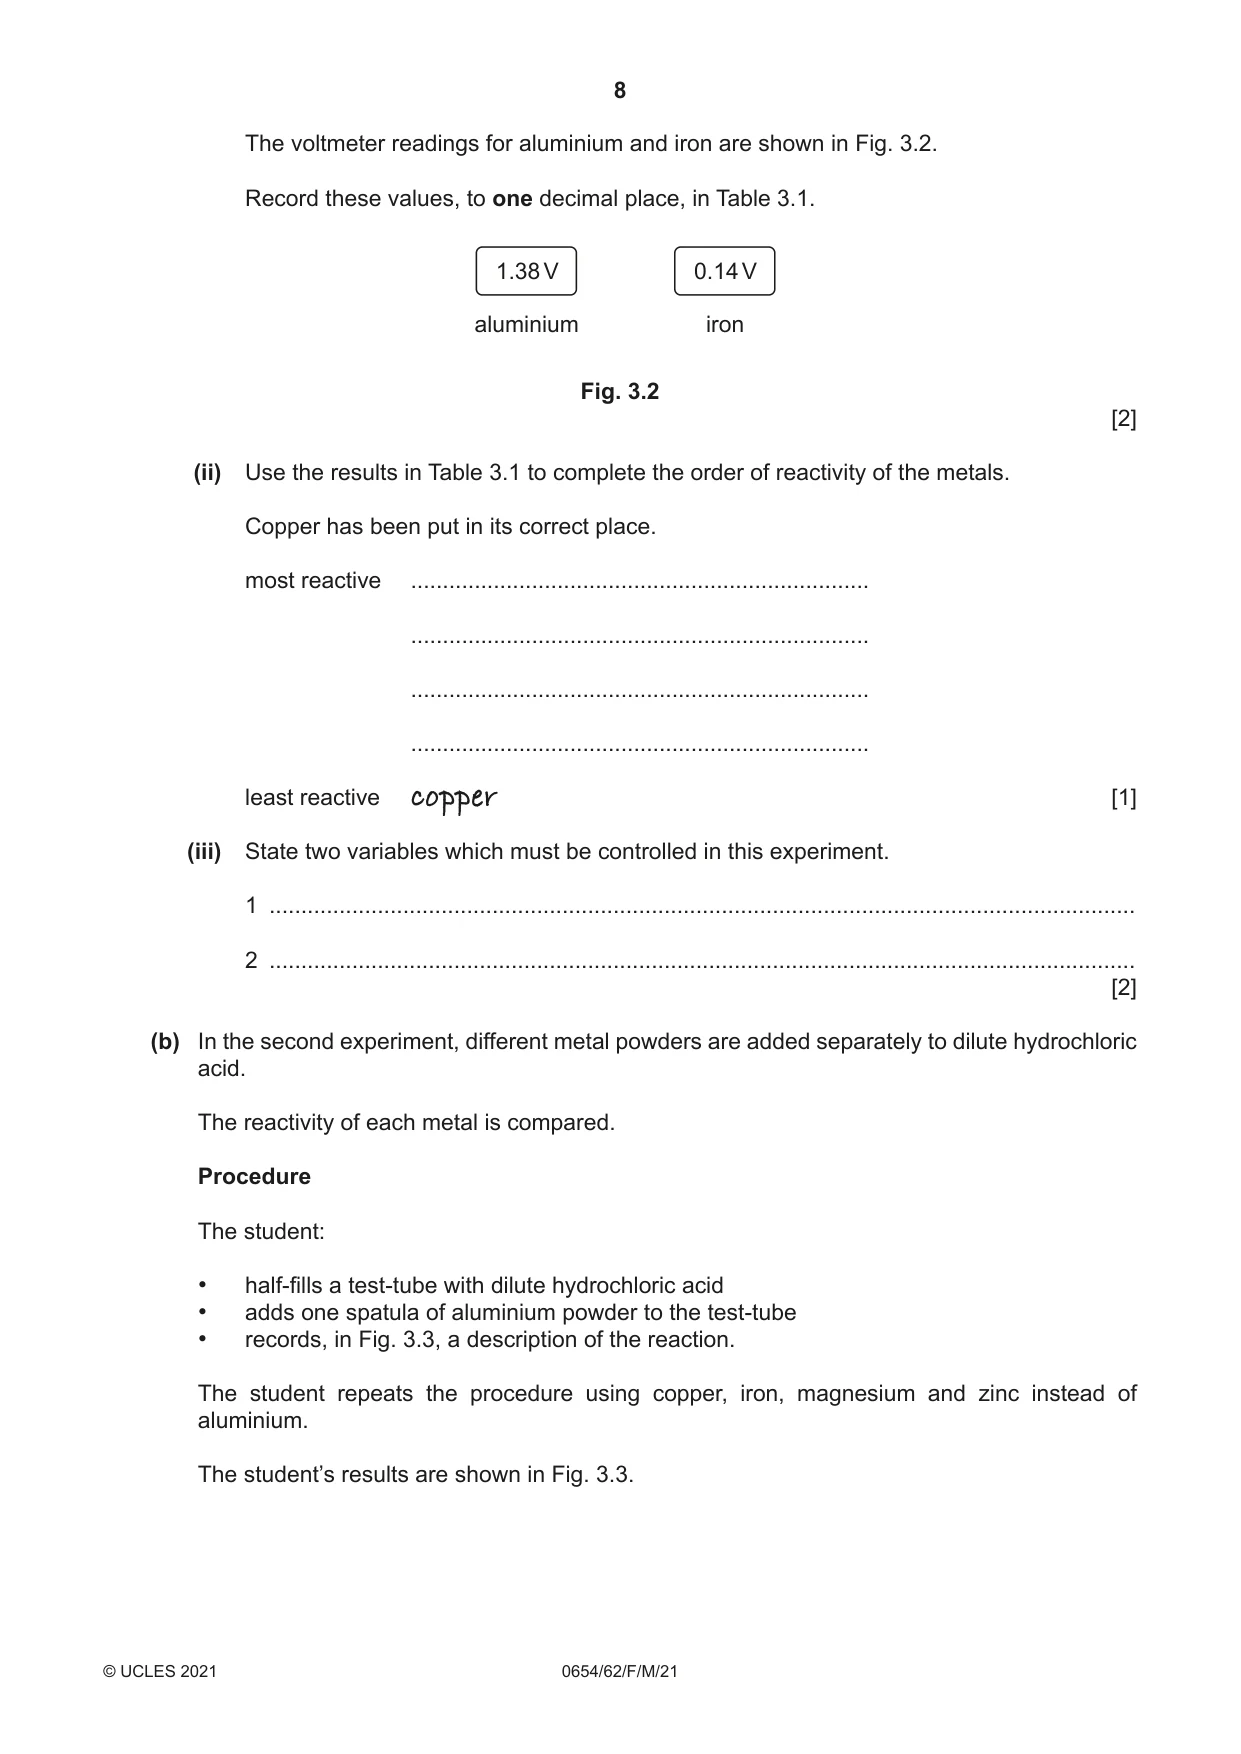
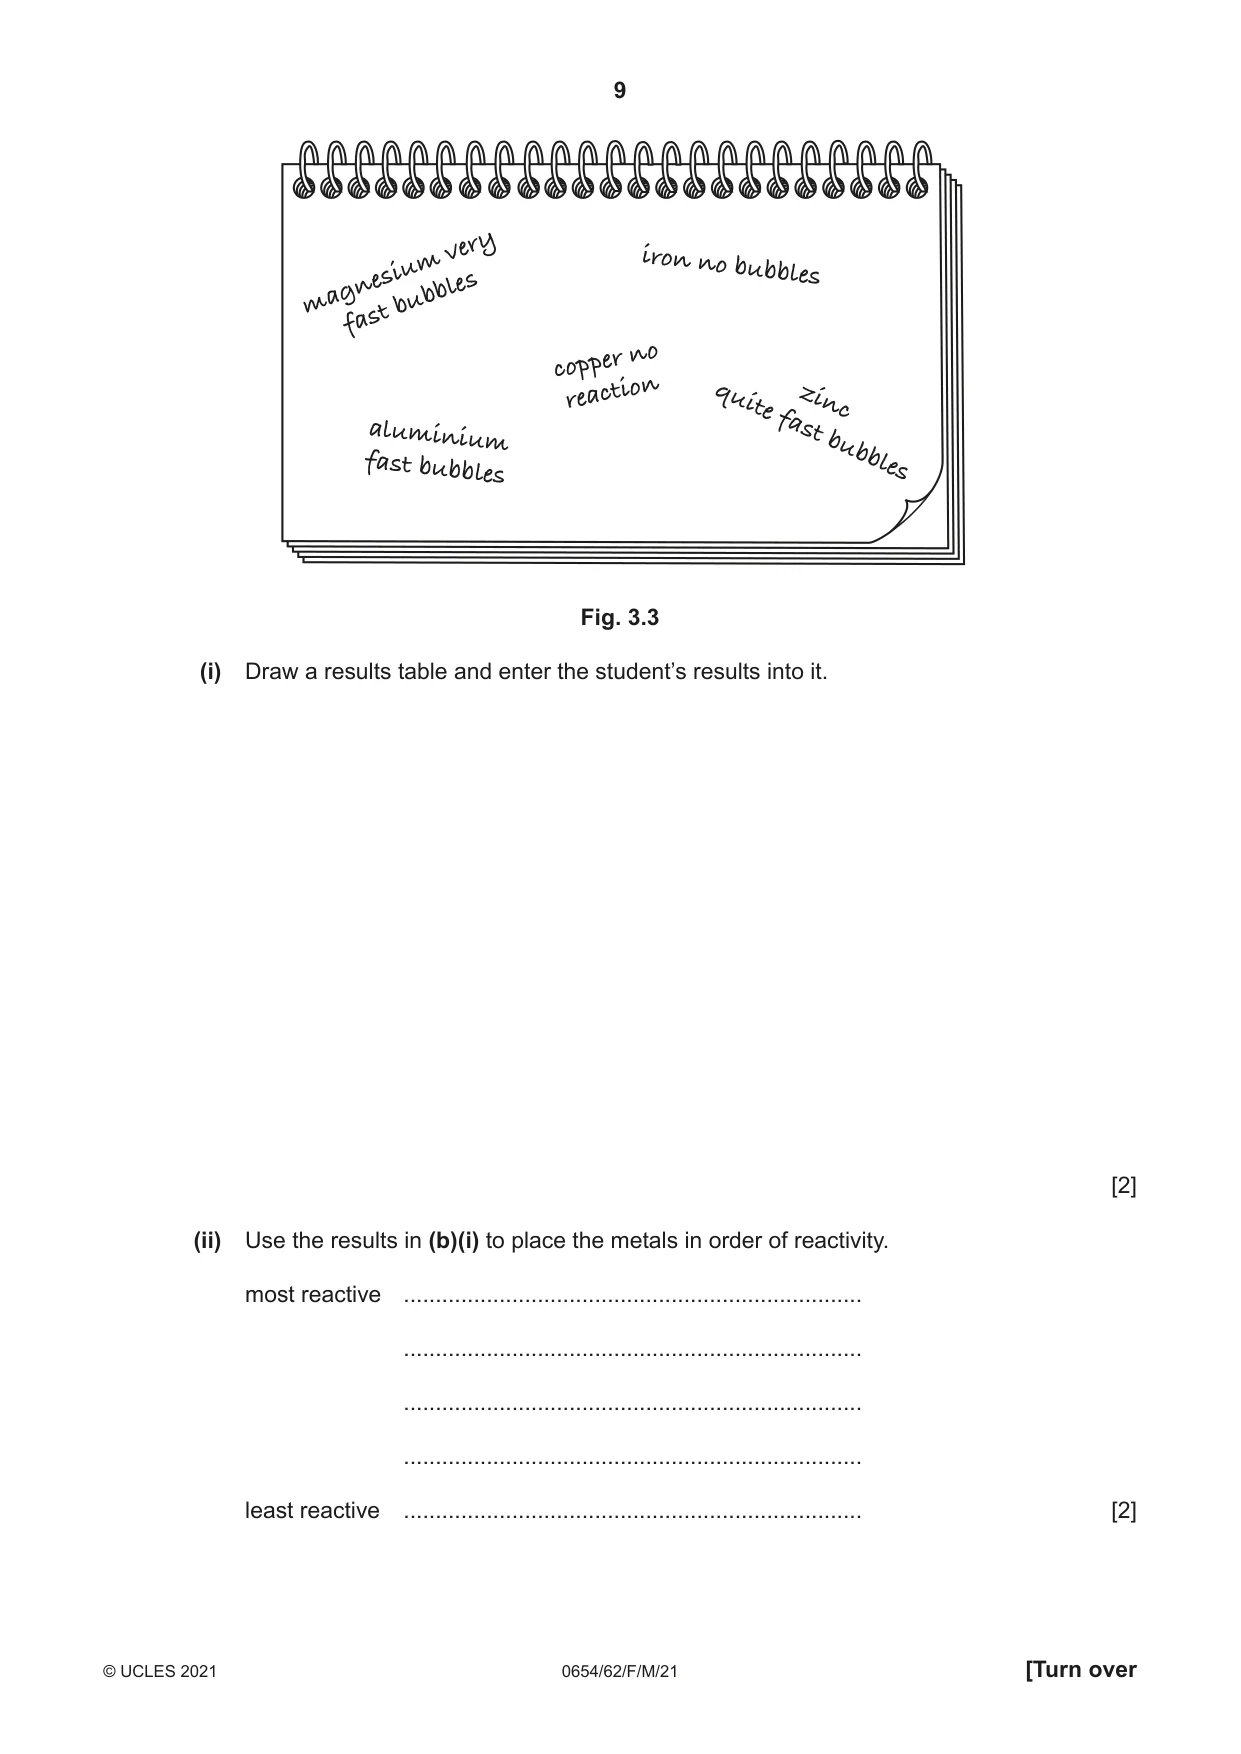
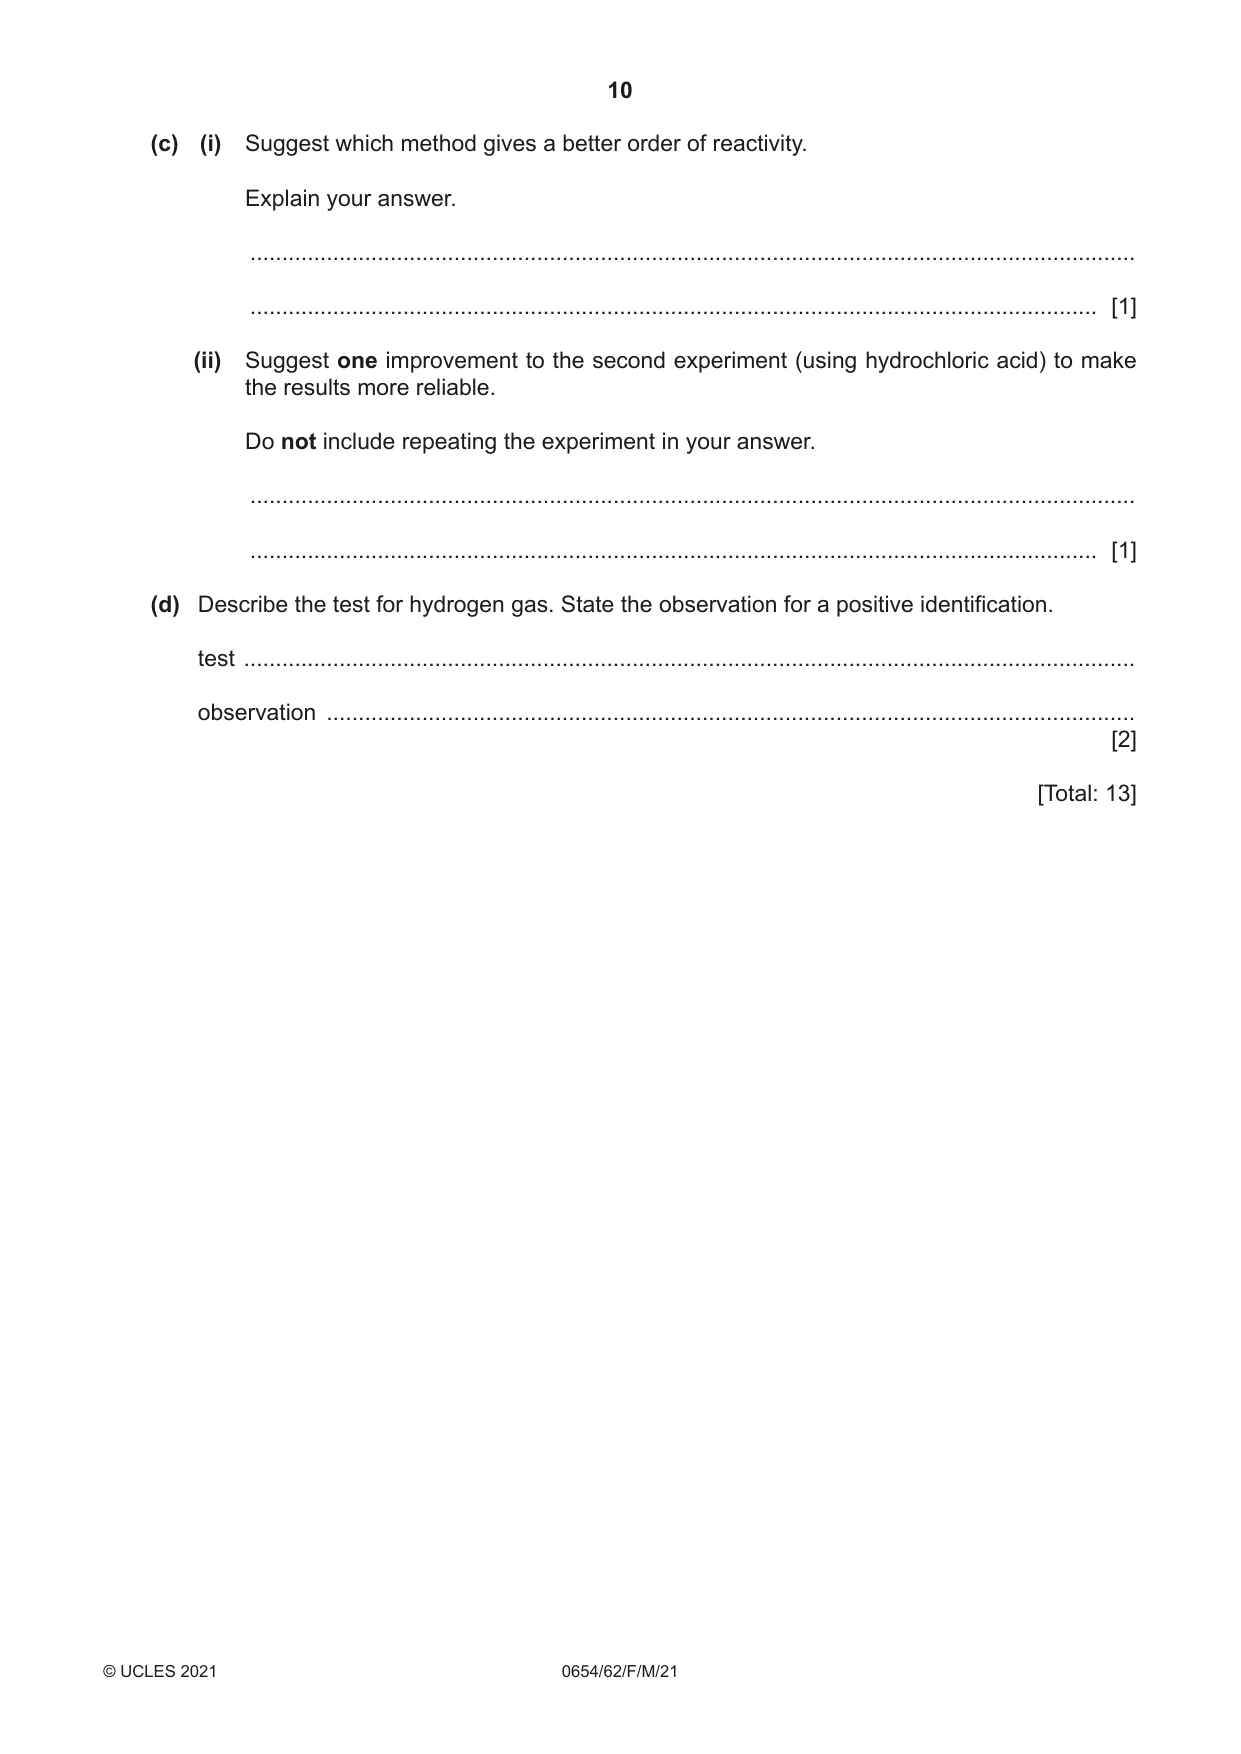
3 A student does two different experiments to investigate the reactivity of five metals: aluminium, copper, iron, magnesium and zinc. (a) In the first experiment, the student measures the voltage (potential difference) produced when two different metals are dipped into salt solution. This happens because the metals have different reactivities. The larger the difference in reactivity of the two metals, the greater the voltage produced. (i) Procedure The student: • half-fills a beaker with salt solution • sets up the apparatus shown in Fig. 3.1 V aluminium copper salt solution Fig. 3.1 • records, in Table 3.1, the reading on the voltmeter. The student repeats the procedure four more times using copper, iron, magnesium and zinc strips instead of the aluminium strip. Table 3.1 metal potential difference / V aluminium copper 0.0 iron magnesium 2.1 zinc 0.7 The voltmeter readings for aluminium and iron are shown in Fig. 3.2. Record these values, to one decimal place, in Table 3.1. 1.38 V 0.14 V aluminium iron Fig. 3.2 [2] (ii) Use the results in Table 3.1 to complete the order of reactivity of the metals. Copper has been put in its correct place. most reactive ........................................................................ ........................................................................ ........................................................................ ........................................................................ least reactive copper [1] (iii) State two variables which must be controlled in this experiment. 1 ........................................................................................................................................ 2 ........................................................................................................................................ [2] (b) In the second experiment, different metal powders are added separately to dilute hydrochloric acid. The reactivity of each metal is compared. Procedure The student: • half-fills a test-tube with dilute hydrochloric acid • adds one spatula of aluminium powder to the test-tube • records, in Fig. 3.3, a description of the reaction. The student repeats the procedure using copper, iron, magnesium and zinc instead of aluminium. The student’s results are shown in Fig. 3.3. very iron no bubbles magnesiumbubbles fast no copper reaction quite zinc fast aluminium fast bubbles bubbles Fig. 3.3 (i) Draw a results table and enter the student’s results into it. [2] (ii) Use the results in (b)(i) to place the metals in order of reactivity. most reactive ........................................................................ ........................................................................ ........................................................................ ........................................................................ least reactive ........................................................................ [2] (c) (i) Suggest which method gives a better order of reactivity. Explain your answer. ........................................................................................................................................... ..................................................................................................................................... [1] (ii) Suggest one improvement to the second experiment (using hydrochloric acid) to make the results more reliable. Do not include repeating the experiment in your answer. ........................................................................................................................................... ..................................................................................................................................... [1] (d) Describe the test for hydrogen gas. State the observation for a positive identification. test ............................................................................................................................................ observation ............................................................................................................................... [2] [Total: 13]
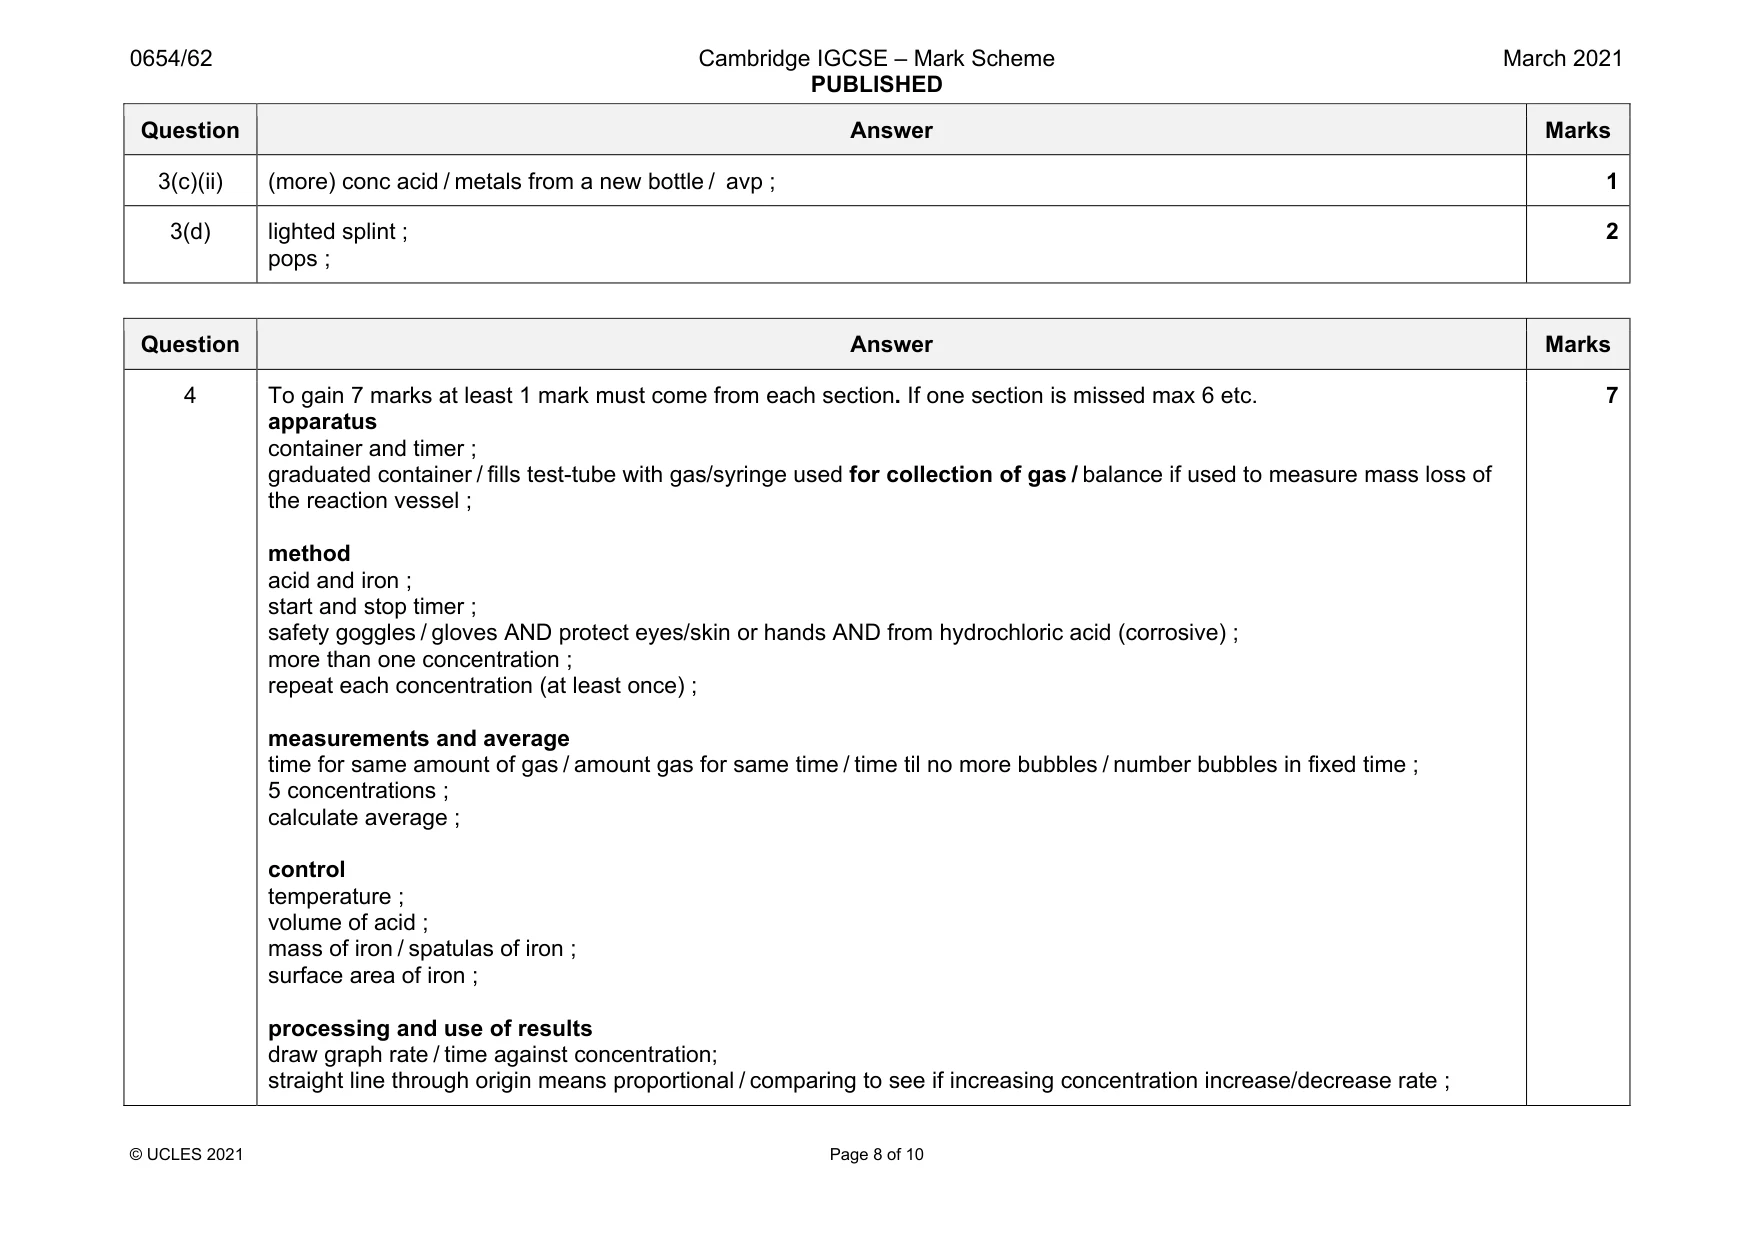
Mark scheme: 3(a)(i) (Fe) 0.1 ; 2 3(a)(ii) Mg Al Zn Fe (Cu) ; 1 3(a)(iii) 2 from: concentration of salt solution ; same size / mass metal (strips) ; temperature ; copper electrode ; 2 3(b)(i) table headers and lines ; all data entered correctly ; 2 3(b)(ii) Mg Al Zn Fe / Cu ;; 2 3(c)(i) voltage / experiment 1 and the voltage readings were all different / the voltage readings are quantitative / more than one metal gave the same result with hydrochloric acid ; 1 Question Answer Marks 3(c)(ii) (more) conc acid / metals from a new bottle / avp ; 1 3(d) lighted splint ; pops ; 2
Q4 · Iron reacts with hydrochloric acid, giving off hydrogen gas
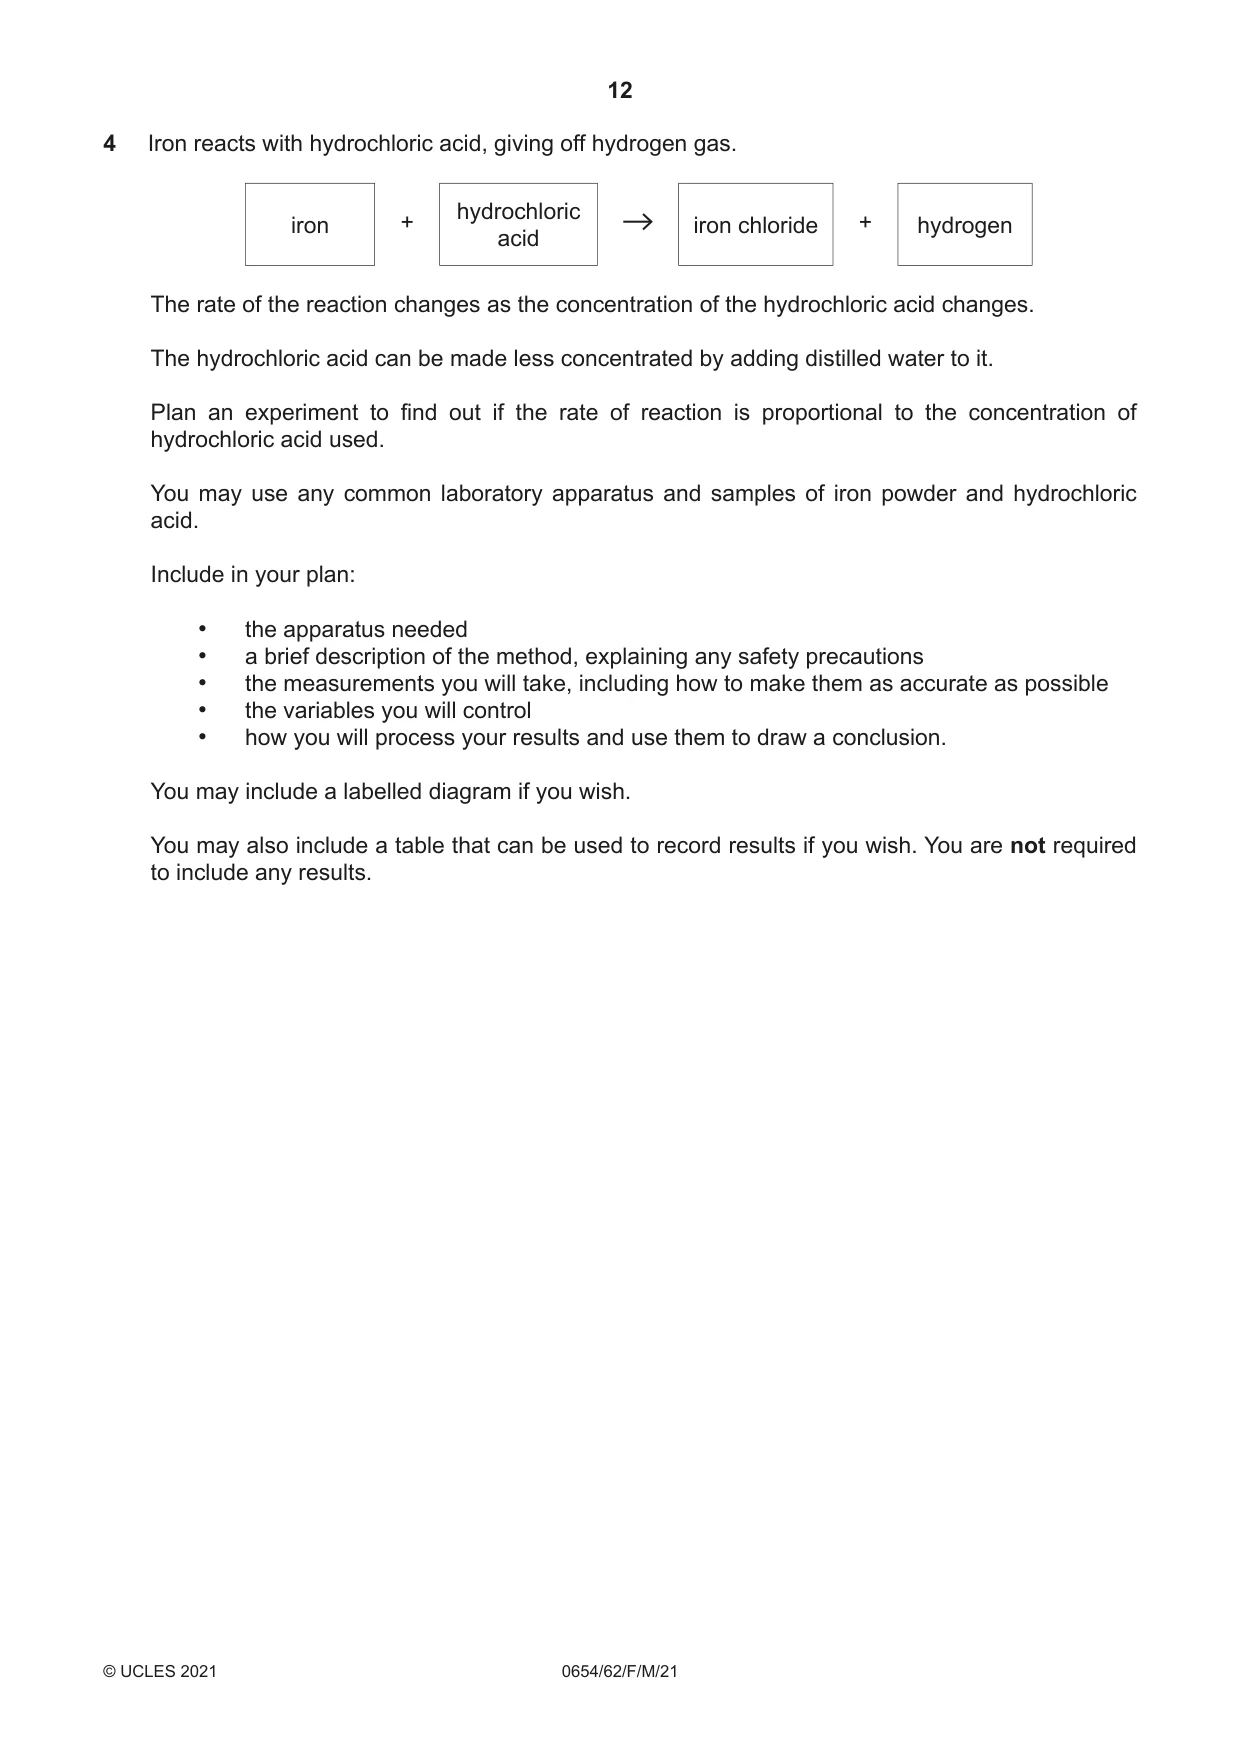
4 Iron reacts with hydrochloric acid, giving off hydrogen gas. hydrochloric iron + iron chloride + hydrogen acid The rate of the reaction changes as the concentration of the hydrochloric acid changes. The hydrochloric acid can be made less concentrated by adding distilled water to it. Plan an experiment to find out if the rate of reaction is proportional to the concentration of hydrochloric acid used. You may use any common laboratory apparatus and samples of iron powder and hydrochloric acid. Include in your plan: • the apparatus needed • a brief description of the method, explaining any safety precautions • the measurements you will take, including how to make them as accurate as possible • the variables you will control • how you will process your results and use them to draw a conclusion. You may include a labelled diagram if you wish. You may also include a table that can be used to record results if you wish. You are not required to include any results. .......................................................................................................................................................... .......................................................................................................................................................... .......................................................................................................................................................... .......................................................................................................................................................... .......................................................................................................................................................... .......................................................................................................................................................... .......................................................................................................................................................... .......................................................................................................................................................... .......................................................................................................................................................... .......................................................................................................................................................... .......................................................................................................................................................... .......................................................................................................................................................... .......................................................................................................................................................... .......................................................................................................................................................... .......................................................................................................................................................... .......................................................................................................................................................... .......................................................................................................................................................... .......................................................................................................................................................... .......................................................................................................................................................... .................................................................................................................................................... [7]
Mark scheme: 4 To gain 7 marks at least 1 mark must come from each section. If one section is missed max 6 etc. apparatus container and timer ; graduated container / fills test-tube with gas/syringe used for collection of gas / balance if used to measure mass loss of the reaction vessel ; method acid and iron ; start and stop timer ; safety goggles / gloves AND protect eyes/skin or hands AND from hydrochloric acid (corrosive) ; more than one concentration ; repeat each concentration (at least once) ; measurements and average time for same amount of gas / amount gas for same time / time til no more bubbles / number bubbles in fixed time ; 5 concentrations ; calculate average ; control temperature ; volume of acid ; mass of iron / spatulas of iron ; surface area of iron ; processing and use of results draw graph rate / time against concentration; straight line through origin means proportional / comparing to see if increasing concentration increase/decrease rate ; 7
Q5 · A student uses two different methods to determine the maximum volume of liquid that a…
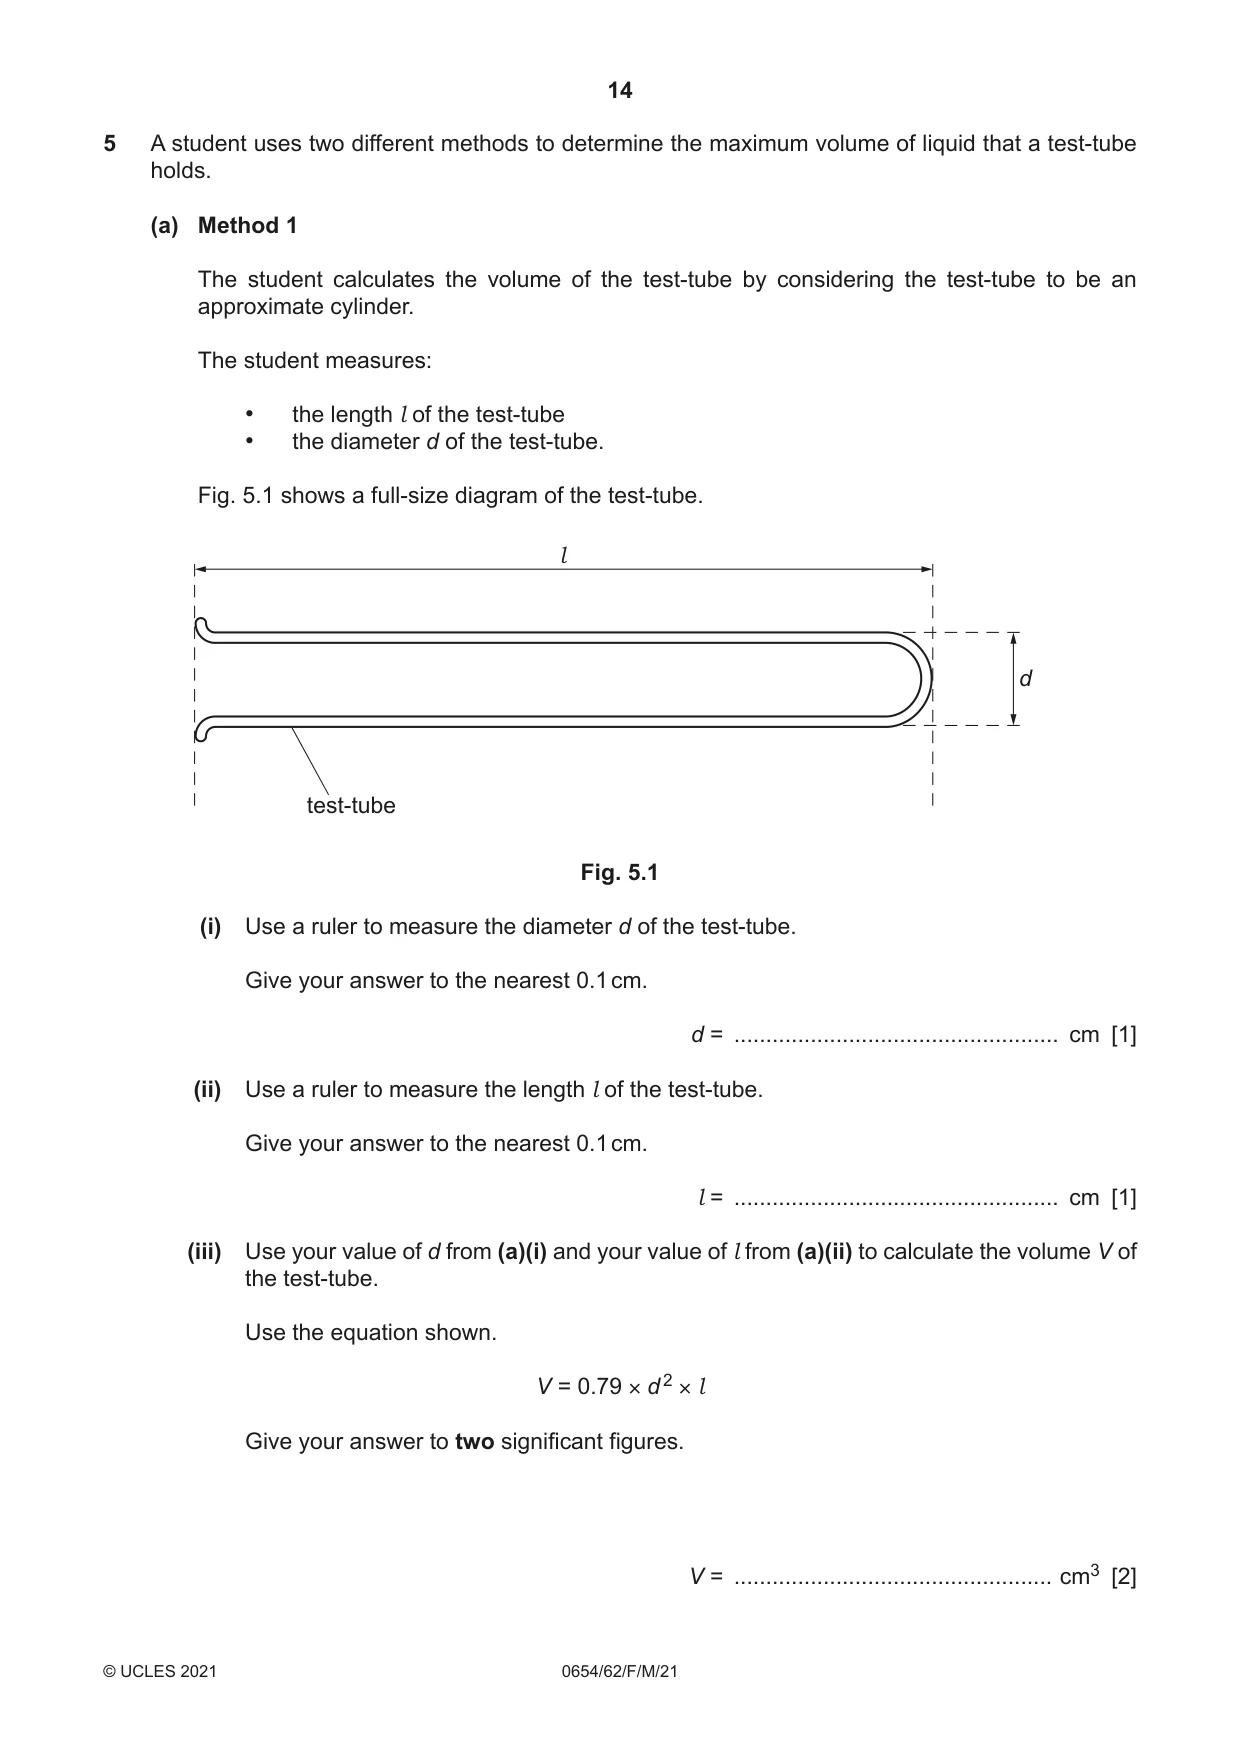
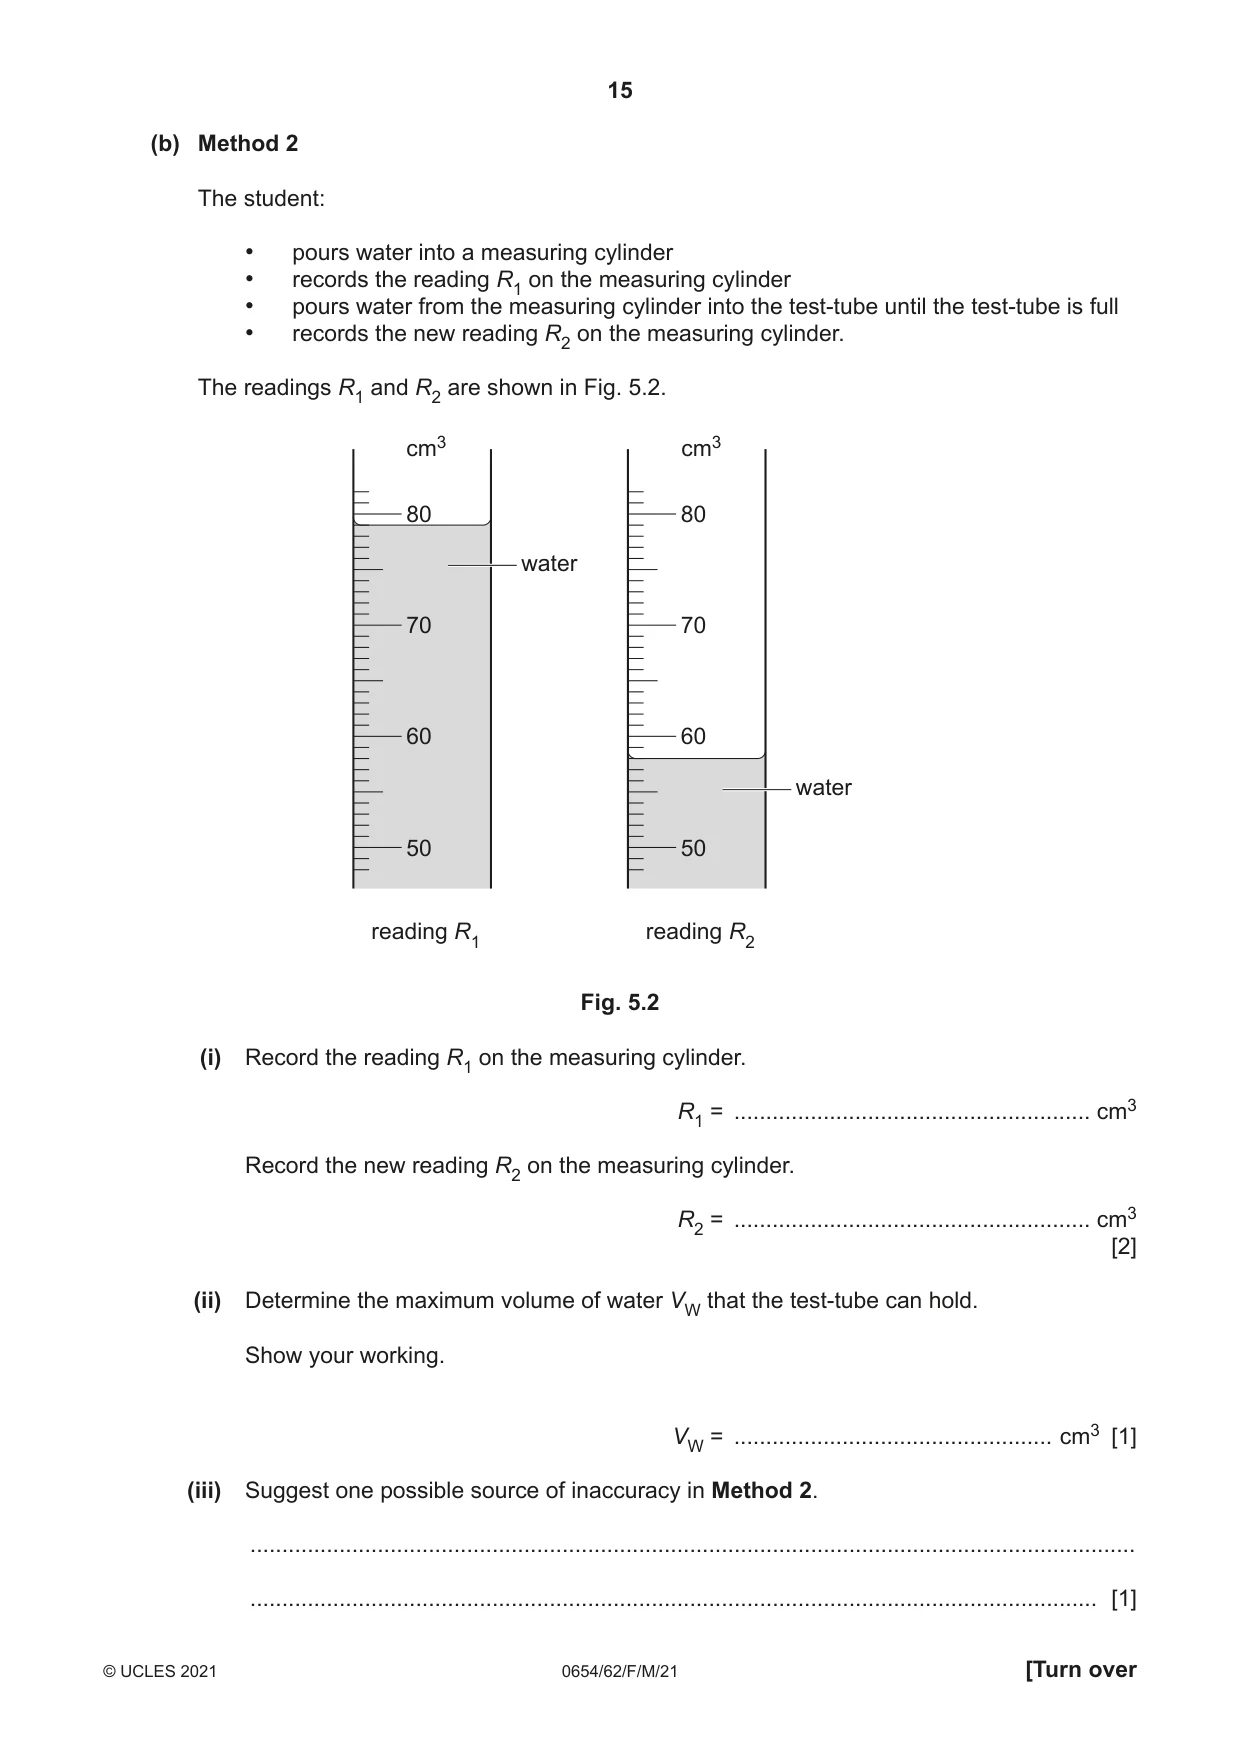
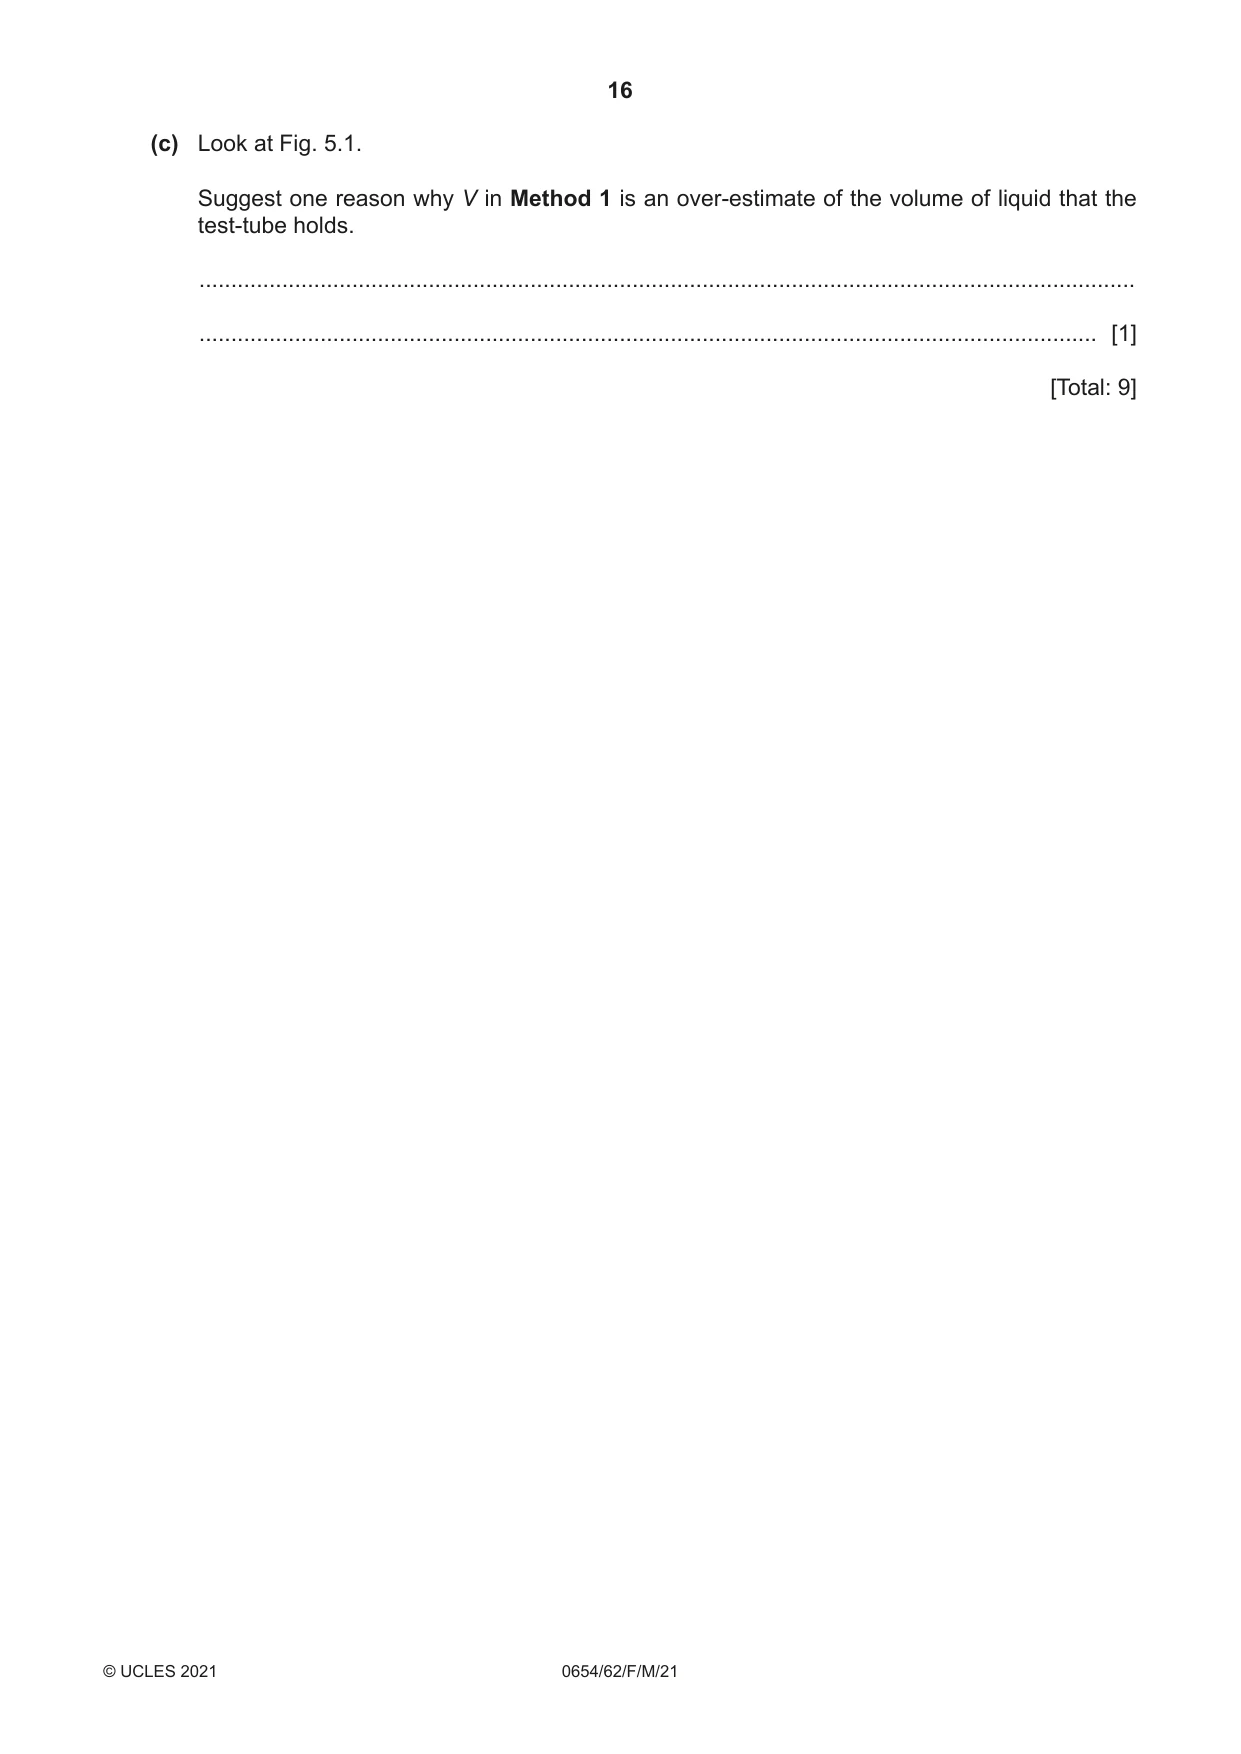
5 A student uses two different methods to determine the maximum volume of liquid that a test-tube holds. (a) Method 1 The student calculates the volume of the test-tube by considering the test-tube to be an approximate cylinder. The student measures: • the length l of the test-tube • the diameter d of the test-tube. Fig. 5.1 shows a full-size diagram of the test-tube. l d test-tube Fig. 5.1 (i) Use a ruler to measure the diameter d of the test-tube. Give your answer to the nearest 0.1 cm. d = ................................................... cm [1] (ii) Use a ruler to measure the length l of the test-tube. Give your answer to the nearest 0.1 cm. l = ................................................... cm [1] (iii) Use your value of d from (a)(i) and your value of l from (a)(ii) to calculate the volume V of the test-tube. Use the equation shown. V = 0.79 × d 2 × l Give your answer to two significant figures. V = .................................................. cm3 [2] (b) Method 2 The student: • pours water into a measuring cylinder • records the reading R1 on the measuring cylinder • pours water from the measuring cylinder into the test-tube until the test-tube is full • records the new reading R2 on the measuring cylinder. The readings R1 and R2 are shown in Fig. 5.2. cm3 cm3 80 80 water 70 70 60 60 water 50 50 reading R1 reading R2 Fig. 5.2 (i) Record the reading R1 on the measuring cylinder. R1 = ........................................................ cm3 Record the new reading R2 on the measuring cylinder. R2 = ........................................................ cm3 [2] (ii) Determine the maximum volume of water VW that the test-tube can hold. Show your working. VW = .................................................. cm3 [1] (iii) Suggest one possible source of inaccuracy in Method 2. ........................................................................................................................................... ..................................................................................................................................... [1] (c) Look at Fig. 5.1. Suggest one reason why V in Method 1 is an over-estimate of the volume of liquid that the test-tube holds. ................................................................................................................................................... ............................................................................................................................................. [1] [Total: 9]
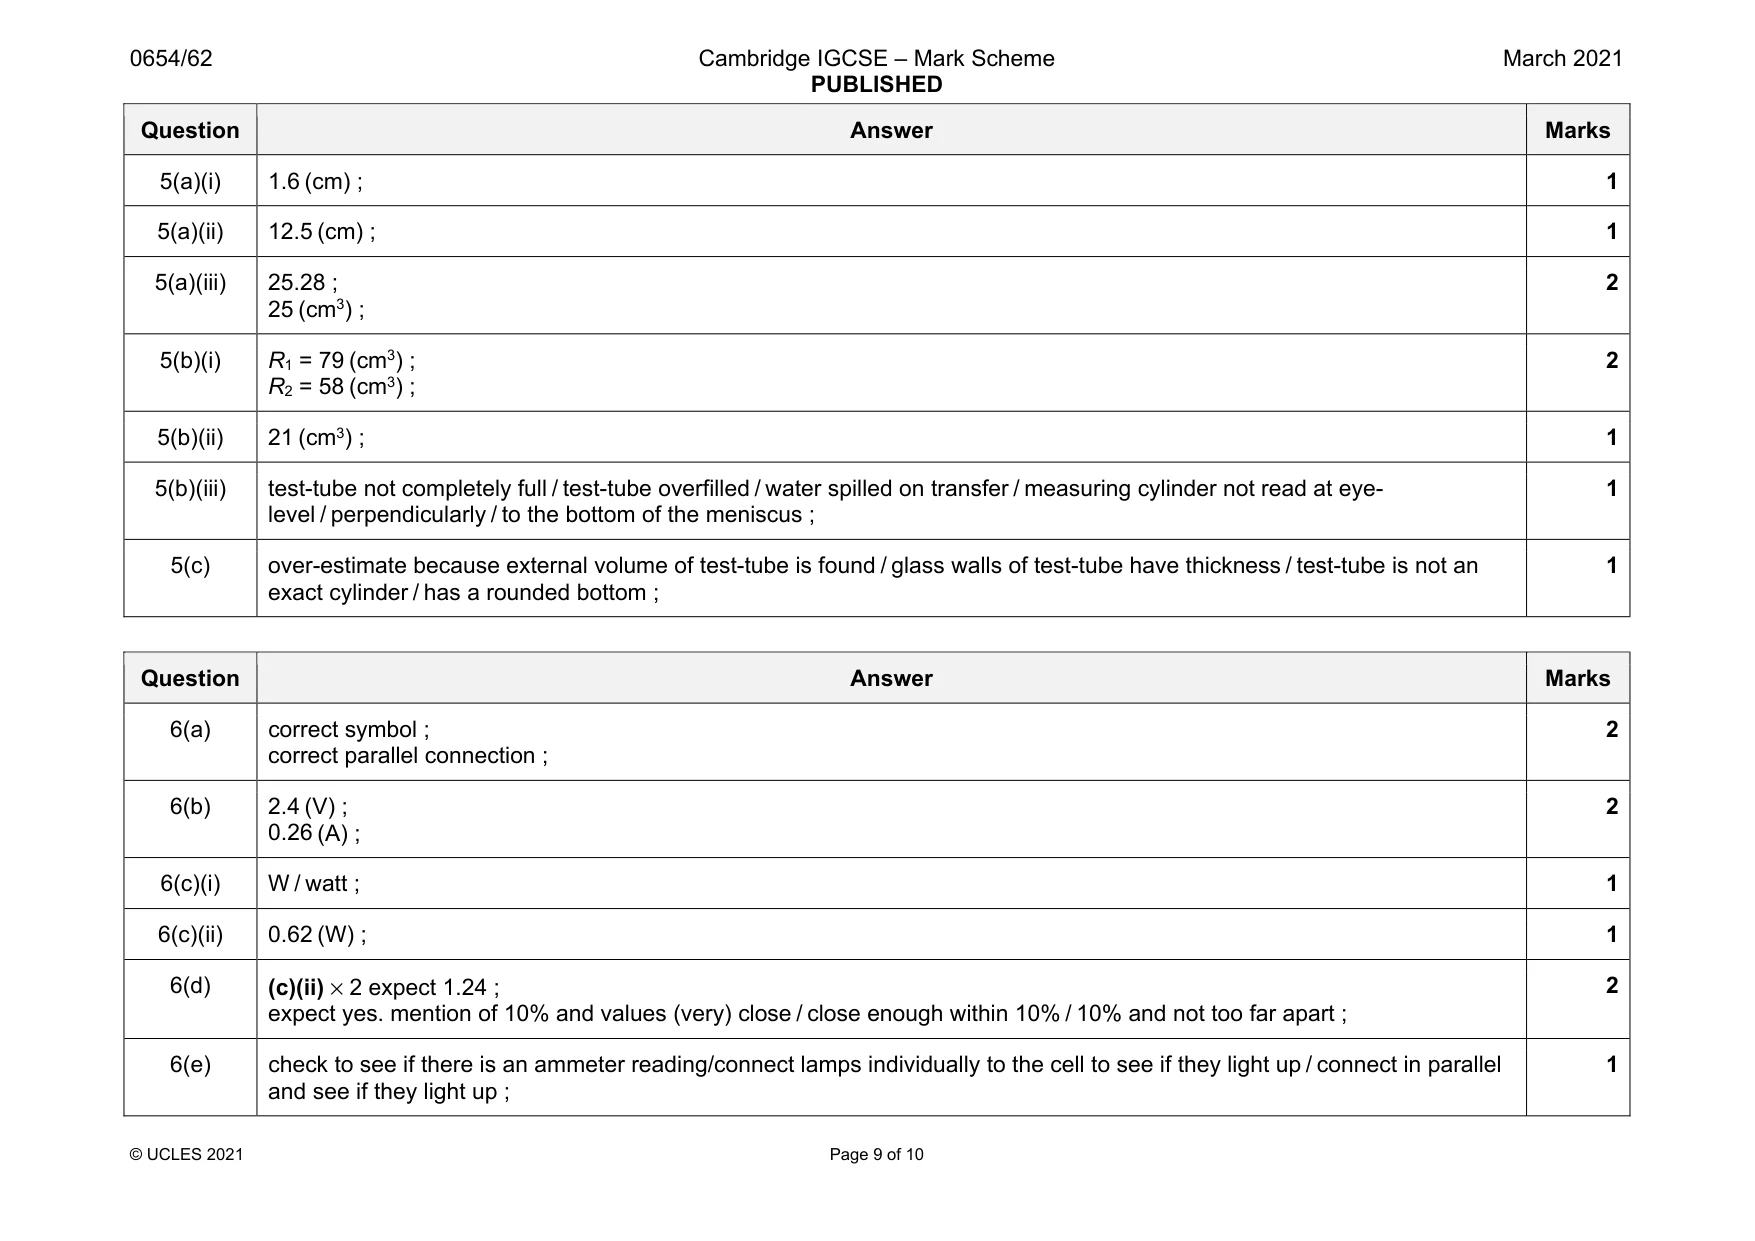
Mark scheme: 5(a)(i) 1.6 (cm) ; 1 5(a)(ii) 12.5 (cm) ; 1 5(a)(iii) 25.28 ; 25 (cm3) ; 2 5(b)(i) R1 = 79 (cm3) ; R2 = 58 (cm3) ; 2 5(b)(ii) 21 (cm3) ; 1 5(b)(iii) test-tube not completely full / test-tube overfilled / water spilled on transfer / measuring cylinder not read at eye- level / perpendicularly / to the bottom of the meniscus ; 1 5(c) over-estimate because external volume of test-tube is found / glass walls of test-tube have thickness / test-tube is not an exact cylinder / has a rounded bottom ; 1
More questions on Physical quantities and measurement techniques
Q6 · A student investigates the power output P of two different combinations of lamps
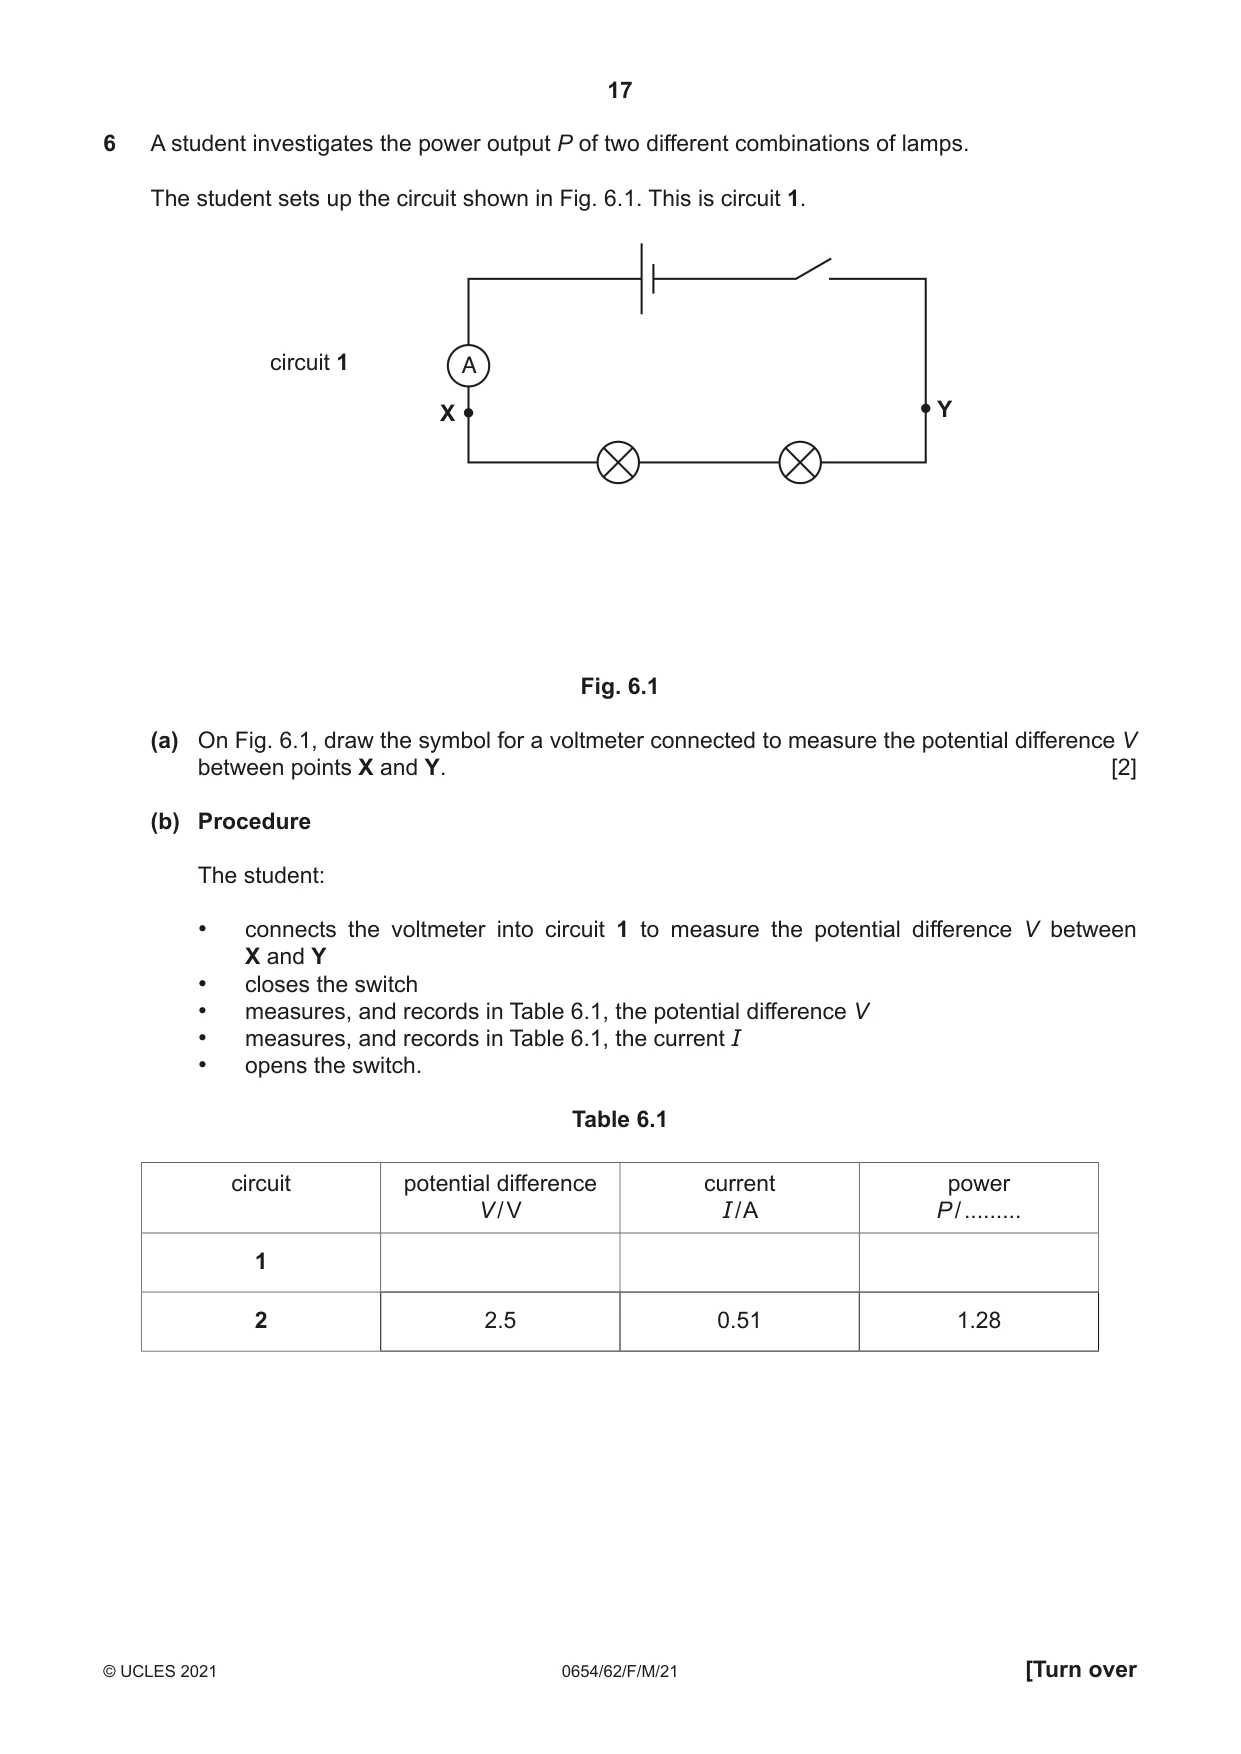
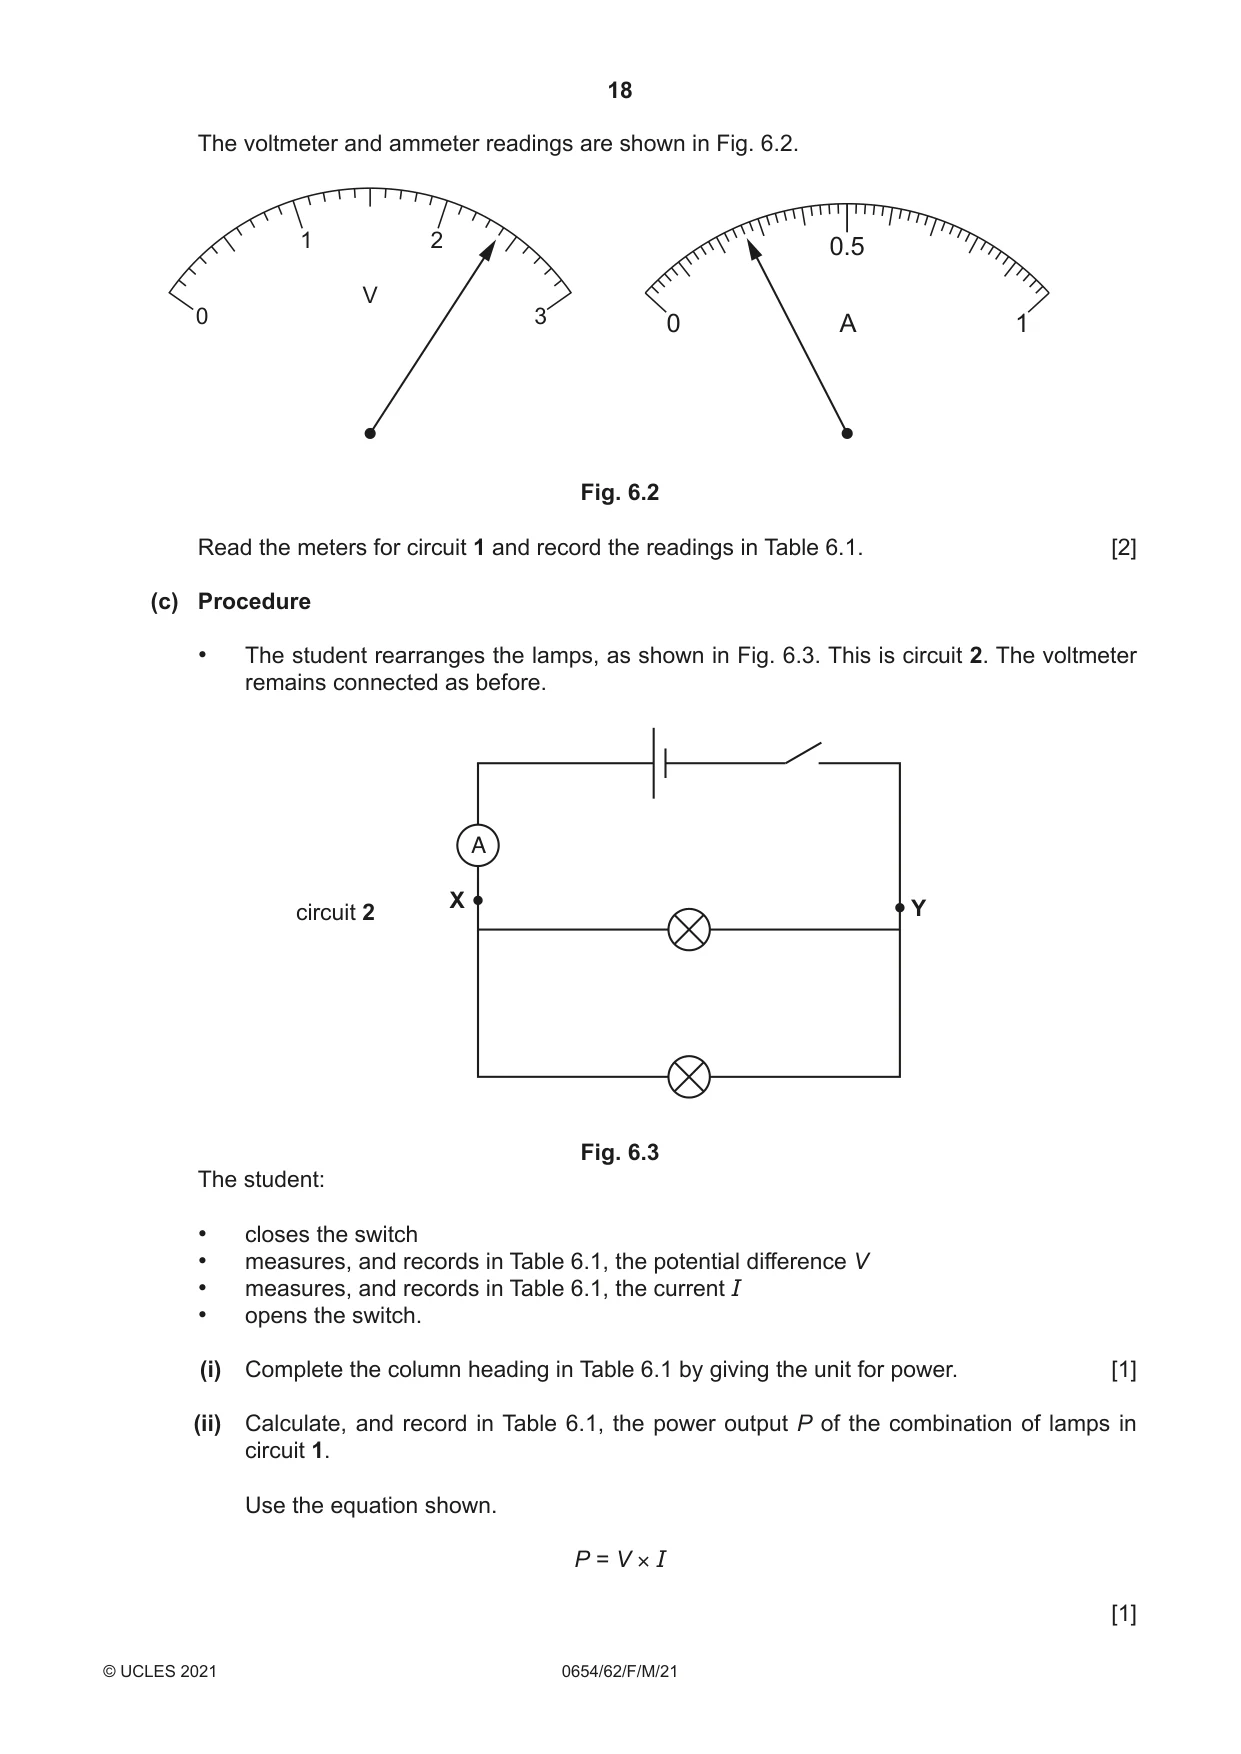
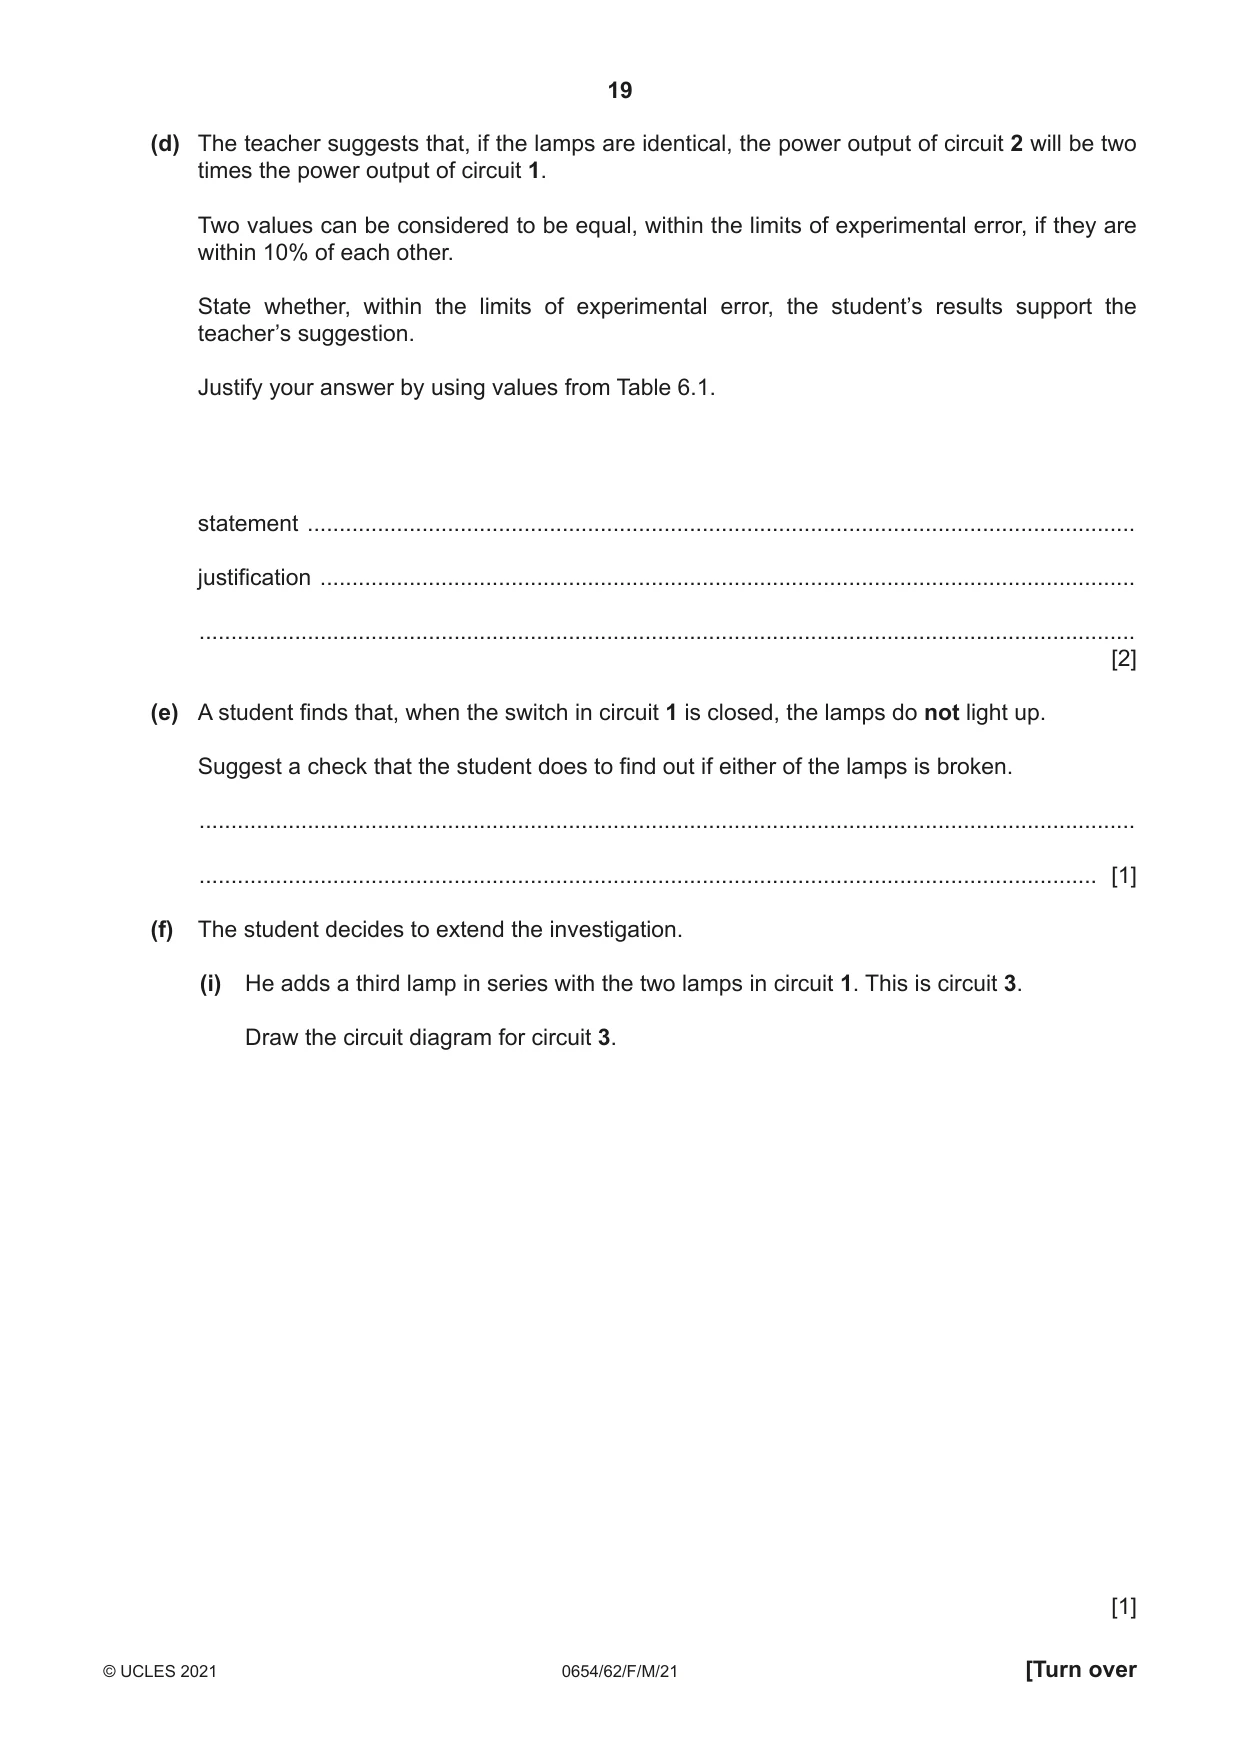
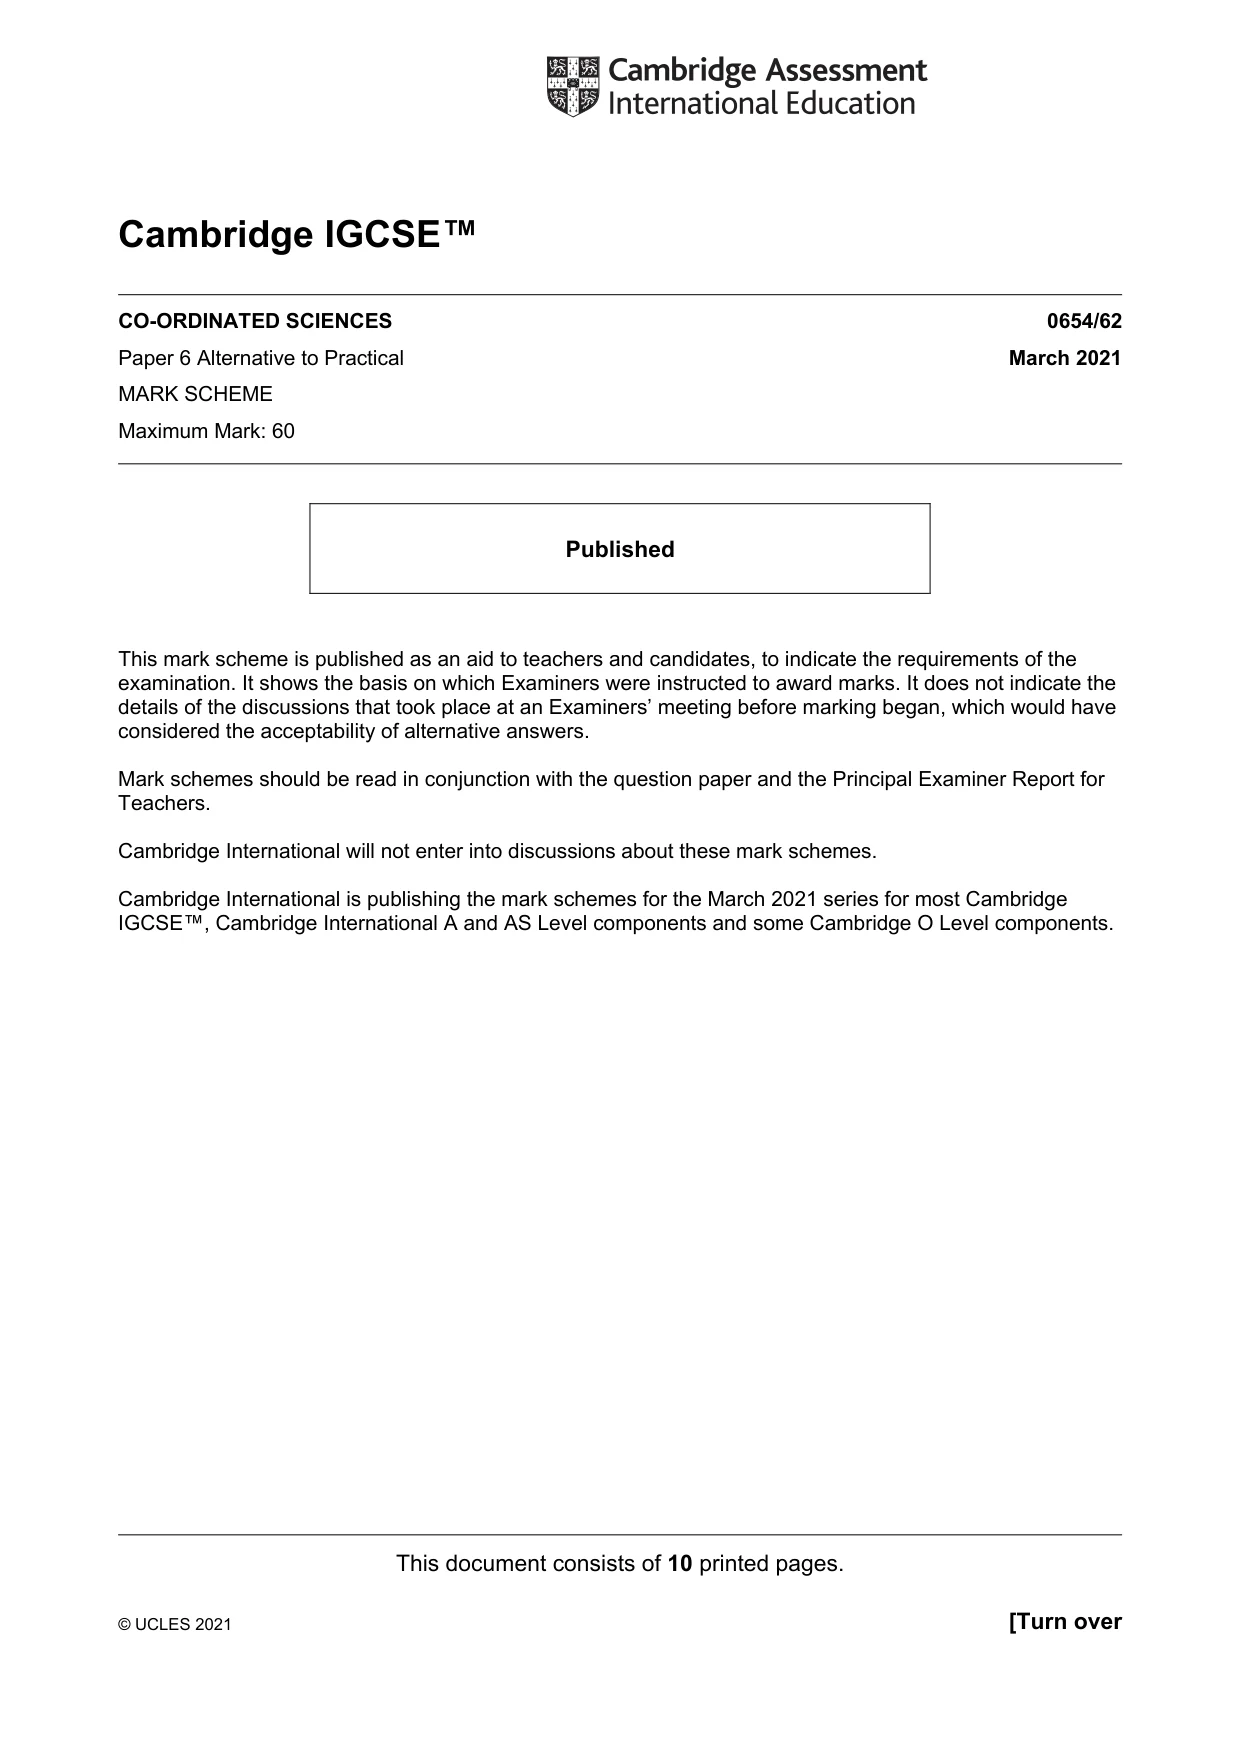
6 A student investigates the power output P of two different combinations of lamps. The student sets up the circuit shown in Fig. 6.1. This is circuit 1. circuit 1 A X Y Fig. 6.1 (a) On Fig. 6.1, draw the symbol for a voltmeter connected to measure the potential difference V between points X and Y. [2] (b) Procedure The student: • connects the voltmeter into circuit 1 to measure the potential difference V between X and Y • closes the switch • measures, and records in Table 6.1, the potential difference V • measures, and records in Table 6.1, the current I • opens the switch. Table 6.1 circuit potential difference current power V / V I / A P / ......... 1 2 2.5 0.51 1.28 The voltmeter and ammeter readings are shown in Fig. 6.2. 1 2 0.5 V 0 3 0 A 1 Fig. 6.2 Read the meters for circuit 1 and record the readings in Table 6.1. [2] (c) Procedure • The student rearranges the lamps, as shown in Fig. 6.3. This is circuit 2. The voltmeter remains connected as before. A X circuit 2 Y Fig. 6.3 The student: • closes the switch • measures, and records in Table 6.1, the potential difference V • measures, and records in Table 6.1, the current I • opens the switch. (i) Complete the column heading in Table 6.1 by giving the unit for power. [1] (ii) Calculate, and record in Table 6.1, the power output P of the combination of lamps in circuit 1. Use the equation shown. P = V × I [1] (d) The teacher suggests that, if the lamps are identical, the power output of circuit 2 will be two times the power output of circuit 1. Two values can be considered to be equal, within the limits of experimental error, if they are within 10% of each other. State whether, within the limits of experimental error, the student’s results support the teacher’s suggestion. Justify your answer by using values from Table 6.1. statement .................................................................................................................................. justification ................................................................................................................................ ................................................................................................................................................... [2] (e) A student finds that, when the switch in circuit 1 is closed, the lamps do not light up. Suggest a check that the student does to find out if either of the lamps is broken. ................................................................................................................................................... ............................................................................................................................................. [1] (f) The student decides to extend the investigation. (i) He adds a third lamp in series with the two lamps in circuit 1. This is circuit 3. Draw the circuit diagram for circuit 3. [1]
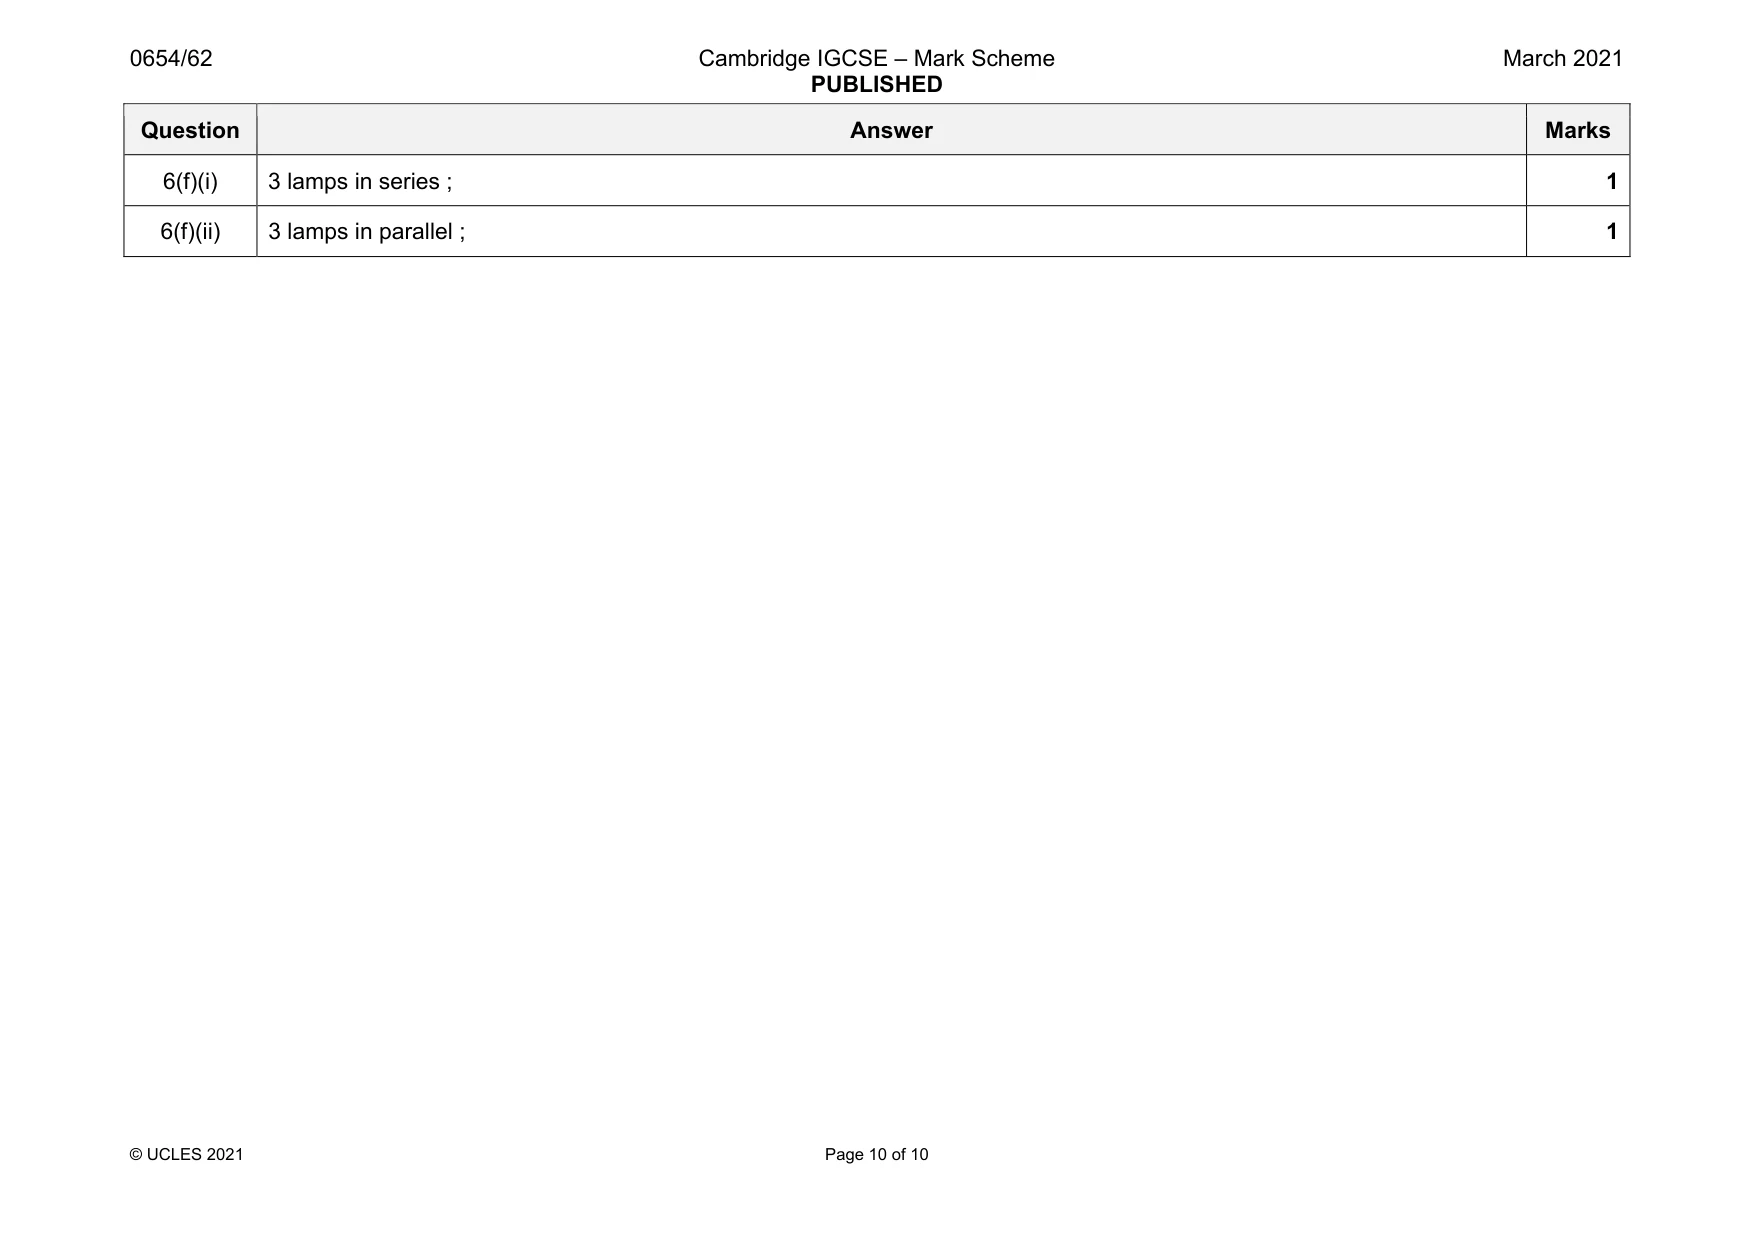
Mark scheme: 6(a) correct symbol ; correct parallel connection ; 2 6(b) 2.4 (V) ; 0.26 (A) ; 2 6(c)(i) W / watt ; 1 6(c)(ii) 0.62 (W) ; 1 6(d) (c)(ii) × 2 expect 1.24 ; expect yes. mention of 10% and values (very) close / close enough within 10% / 10% and not too far apart ; 2 6(e) check to see if there is an ammeter reading/connect lamps individually to the cell to see if they light up / connect in parallel and see if they light up ; 1 Question Answer Marks 6(f)(i) 3 lamps in series ; 1 6(f)(ii) 3 lamps in parallel ; 1
What was in this paper
The subtopics covered by these 6 questions, and how many questions each got. Open one in a new tab to see every Cambridge question on it.
What you needed in this session
Cambridge’s own grade thresholds for 2021 Feb/March, Paper 6 · Variant 2. A higher threshold means an easier paper — the bar moves with how the cohort did.