Cambridge IGCSE Sciences - Co-ordinated (Double) 0654 — 2019 May/June Paper 6 · Variant 3
0654/63/M/J/19 · 6 questions · 60 marks · ≈68 min
The question paper and its mark scheme, free to read here and free to download. This is Cambridge’s own paper, exactly as it was sat.
Question paper20 pages




Mark scheme8 pages
Answers below. Sit the paper first if you are practising.
Questions as text
Q1 · A student investigates the movement of molecules
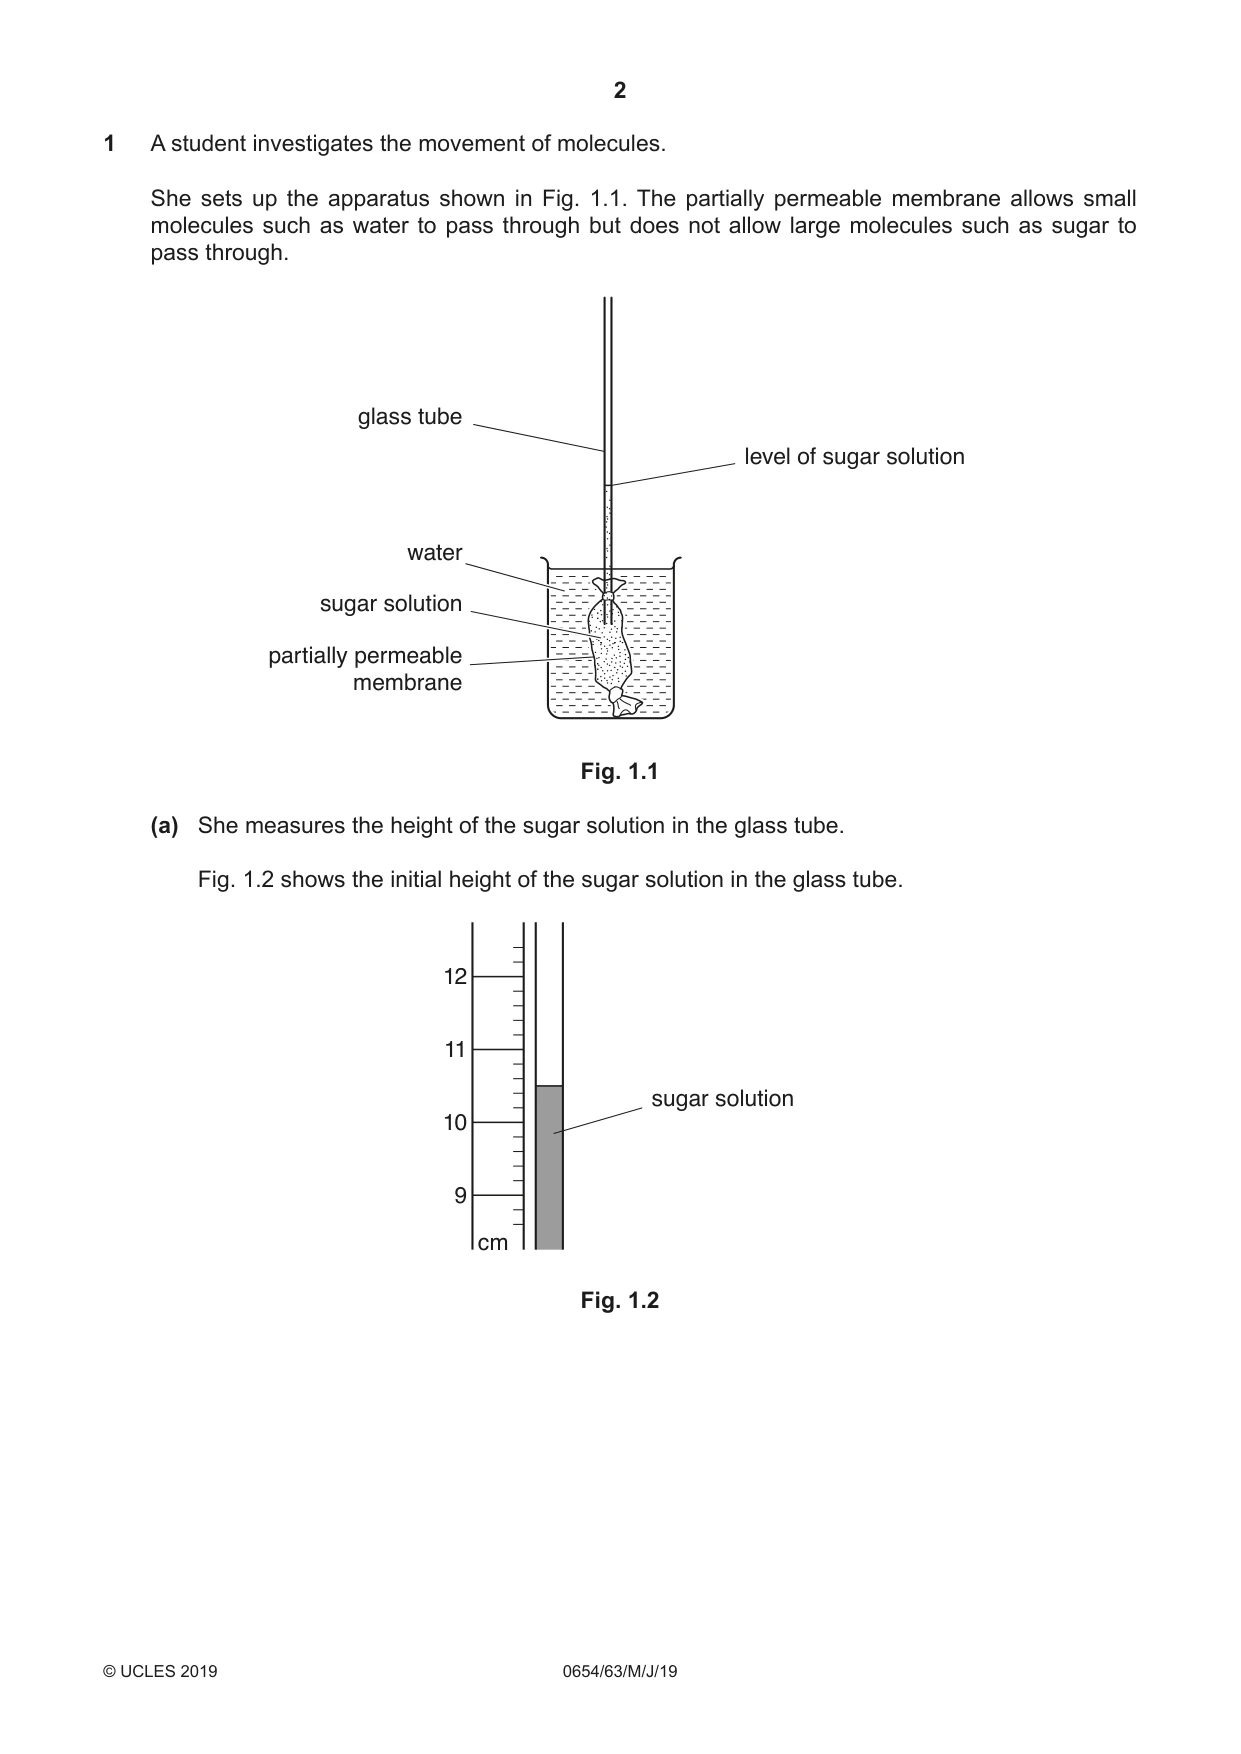
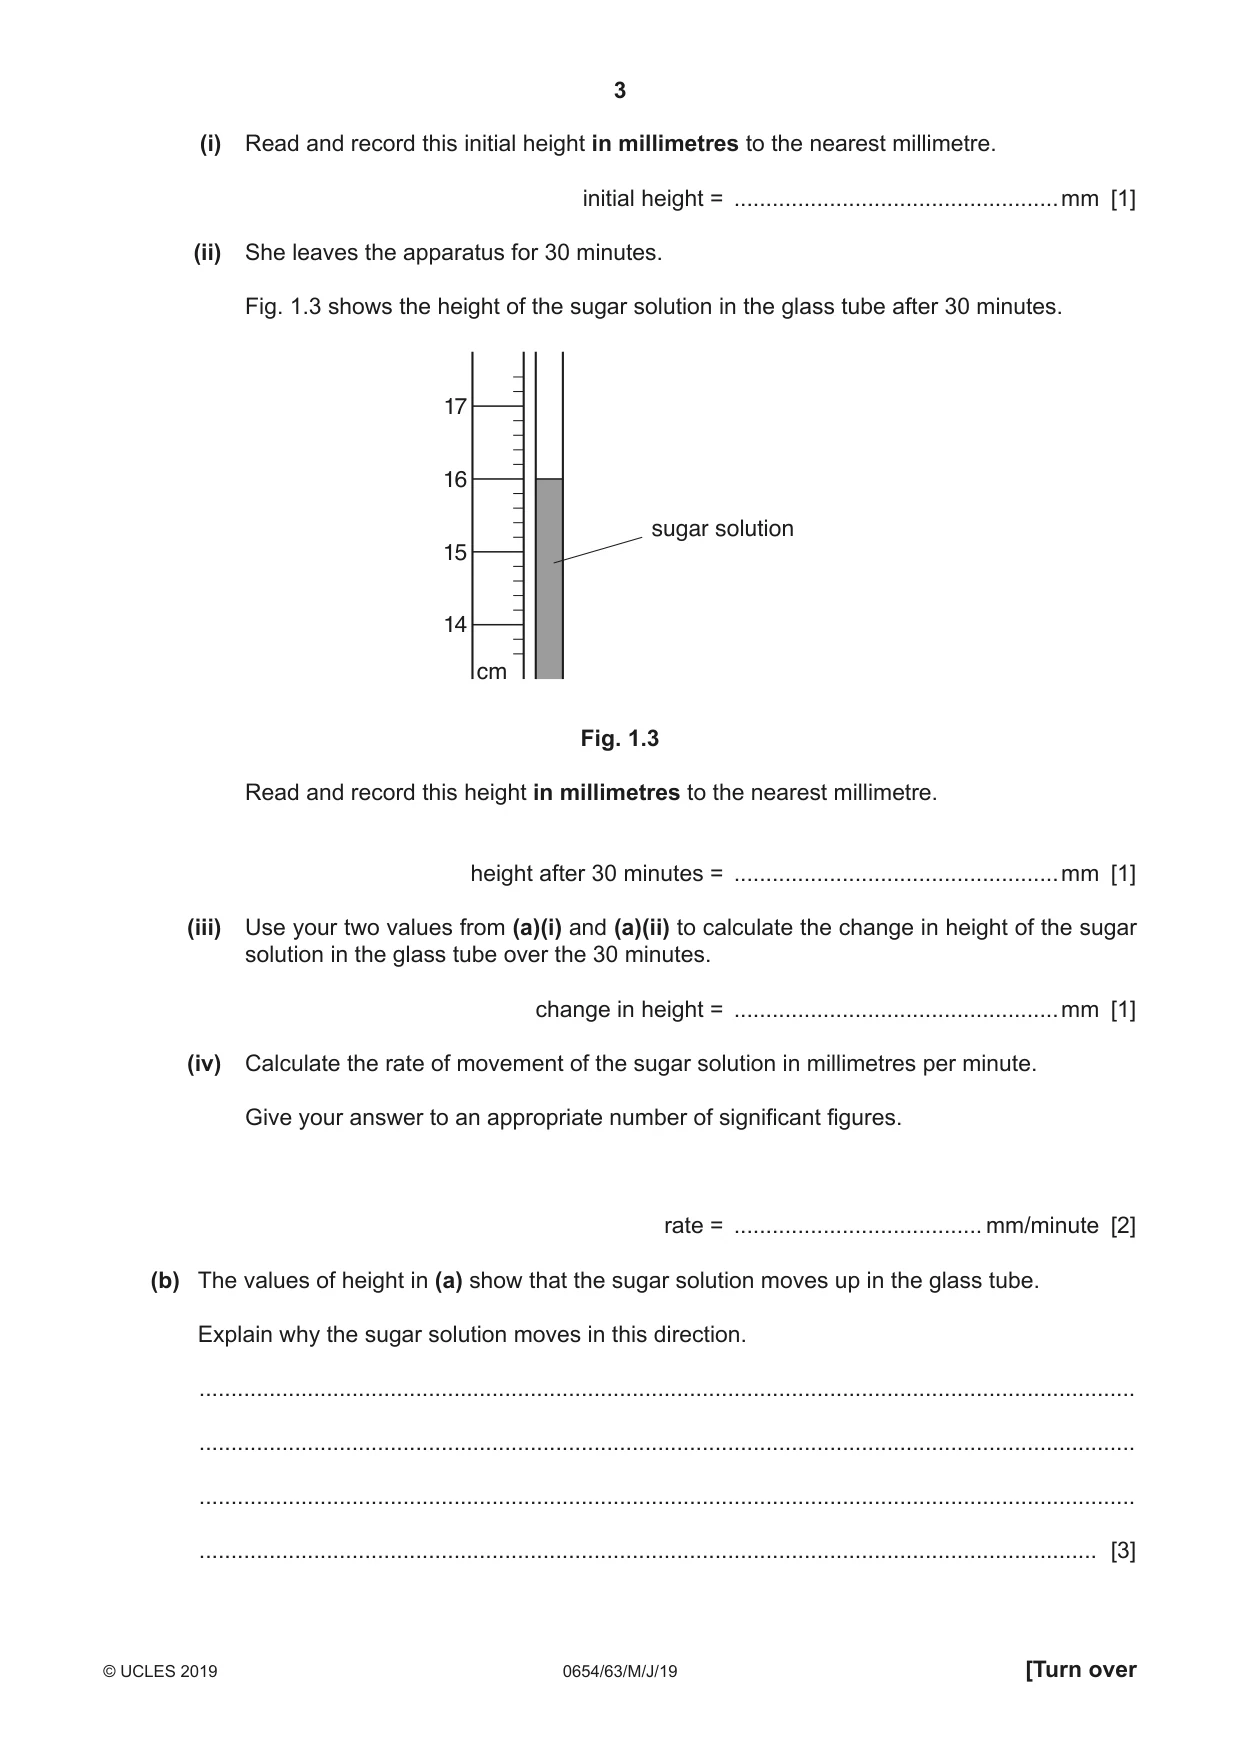
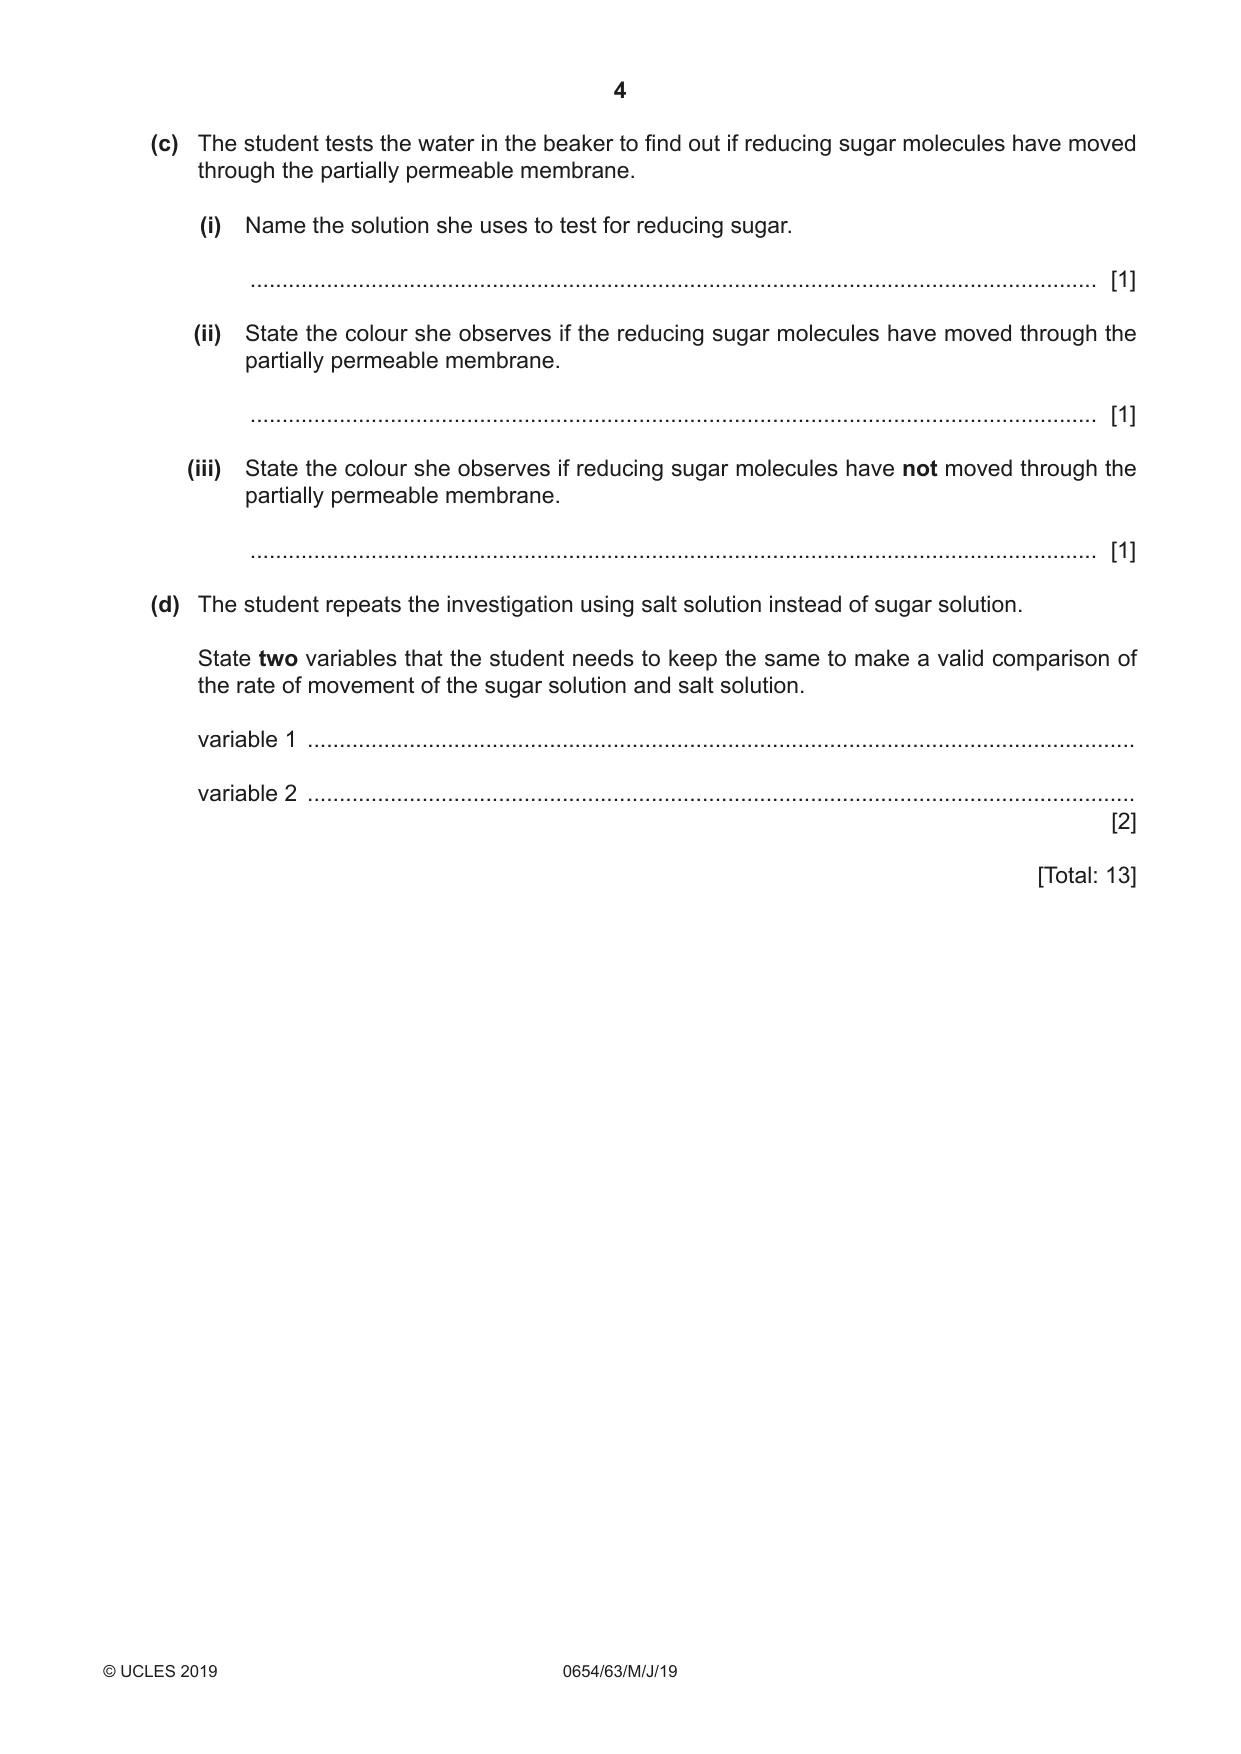
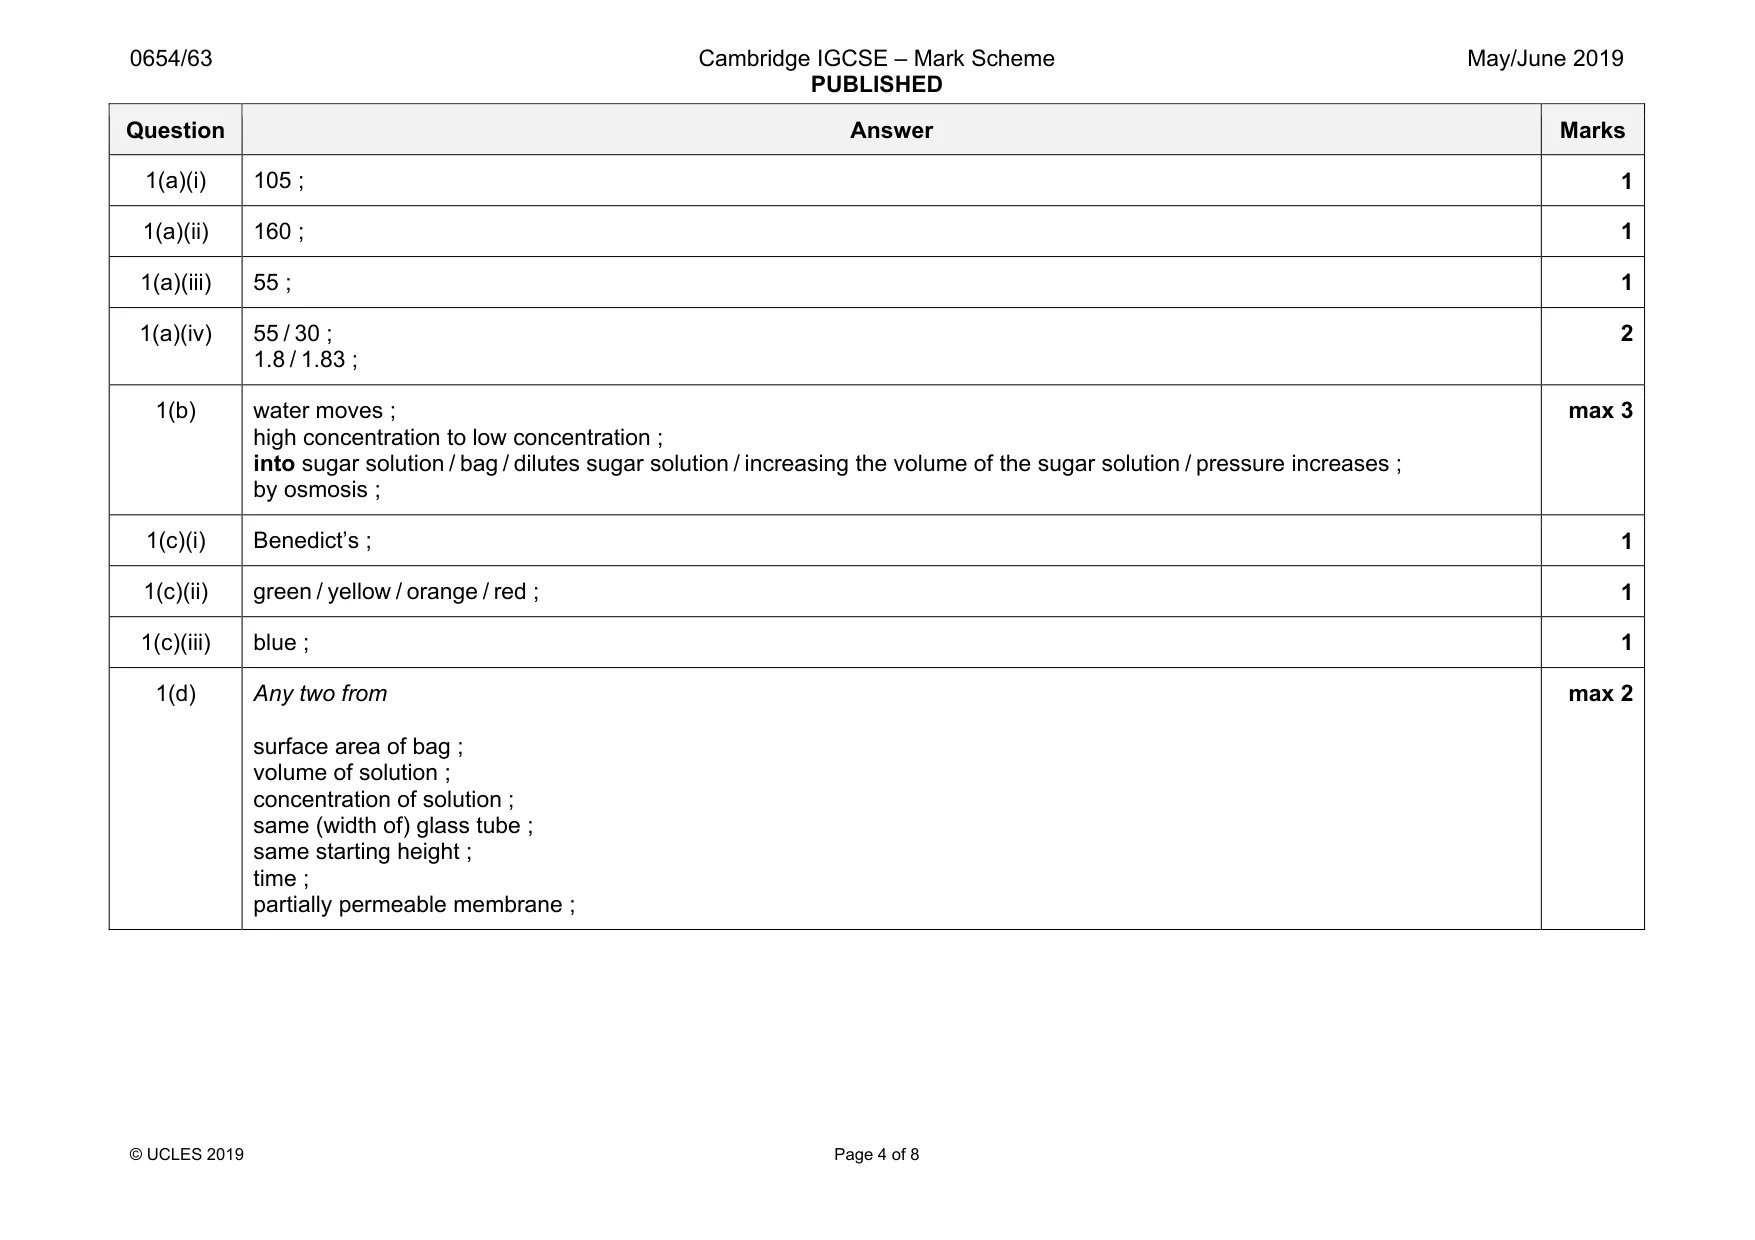
1 A student investigates the movement of molecules. She sets up the apparatus shown in Fig. 1.1. The partially permeable membrane allows small molecules such as water to pass through but does not allow large molecules such as sugar to pass through. glass tube level of sugar solution water sugar solution partially permeable membrane Fig. 1.1 (a) She measures the height of the sugar solution in the glass tube. Fig. 1.2 shows the initial height of the sugar solution in the glass tube. 12 11 sugar solution 10 9 cm Fig. 1.2 (i) Read and record this initial height in millimetres to the nearest millimetre. initial height = ...................................................mm [1] (ii) She leaves the apparatus for 30 minutes. Fig. 1.3 shows the height of the sugar solution in the glass tube after 30 minutes. 17 16 sugar solution 15 14 cm Fig. 1.3 Read and record this height in millimetres to the nearest millimetre. height after 30 minutes = ...................................................mm [1] (iii) Use your two values from (a)(i) and (a)(ii) to calculate the change in height of the sugar solution in the glass tube over the 30 minutes. change in height = ...................................................mm [1] (iv) Calculate the rate of movement of the sugar solution in millimetres per minute. Give your answer to an appropriate number of significant figures. rate = ....................................... mm/minute [2] (b) The values of height in (a) show that the sugar solution moves up in the glass tube. Explain why the sugar solution moves in this direction. ................................................................................................................................................... ................................................................................................................................................... ................................................................................................................................................... ............................................................................................................................................. [3] (c) The student tests the water in the beaker to find out if reducing sugar molecules have moved through the partially permeable membrane. (i) Name the solution she uses to test for reducing sugar. ..................................................................................................................................... [1] (ii) State the colour she observes if the reducing sugar molecules have moved through the partially permeable membrane. ..................................................................................................................................... [1] (iii) State the colour she observes if reducing sugar molecules have not moved through the partially permeable membrane. ..................................................................................................................................... [1] (d) The student repeats the investigation using salt solution instead of sugar solution. State two variables that the student needs to keep the same to make a valid comparison of the rate of movement of the sugar solution and salt solution. variable 1 .................................................................................................................................. variable 2 .................................................................................................................................. [2] [Total: 13]
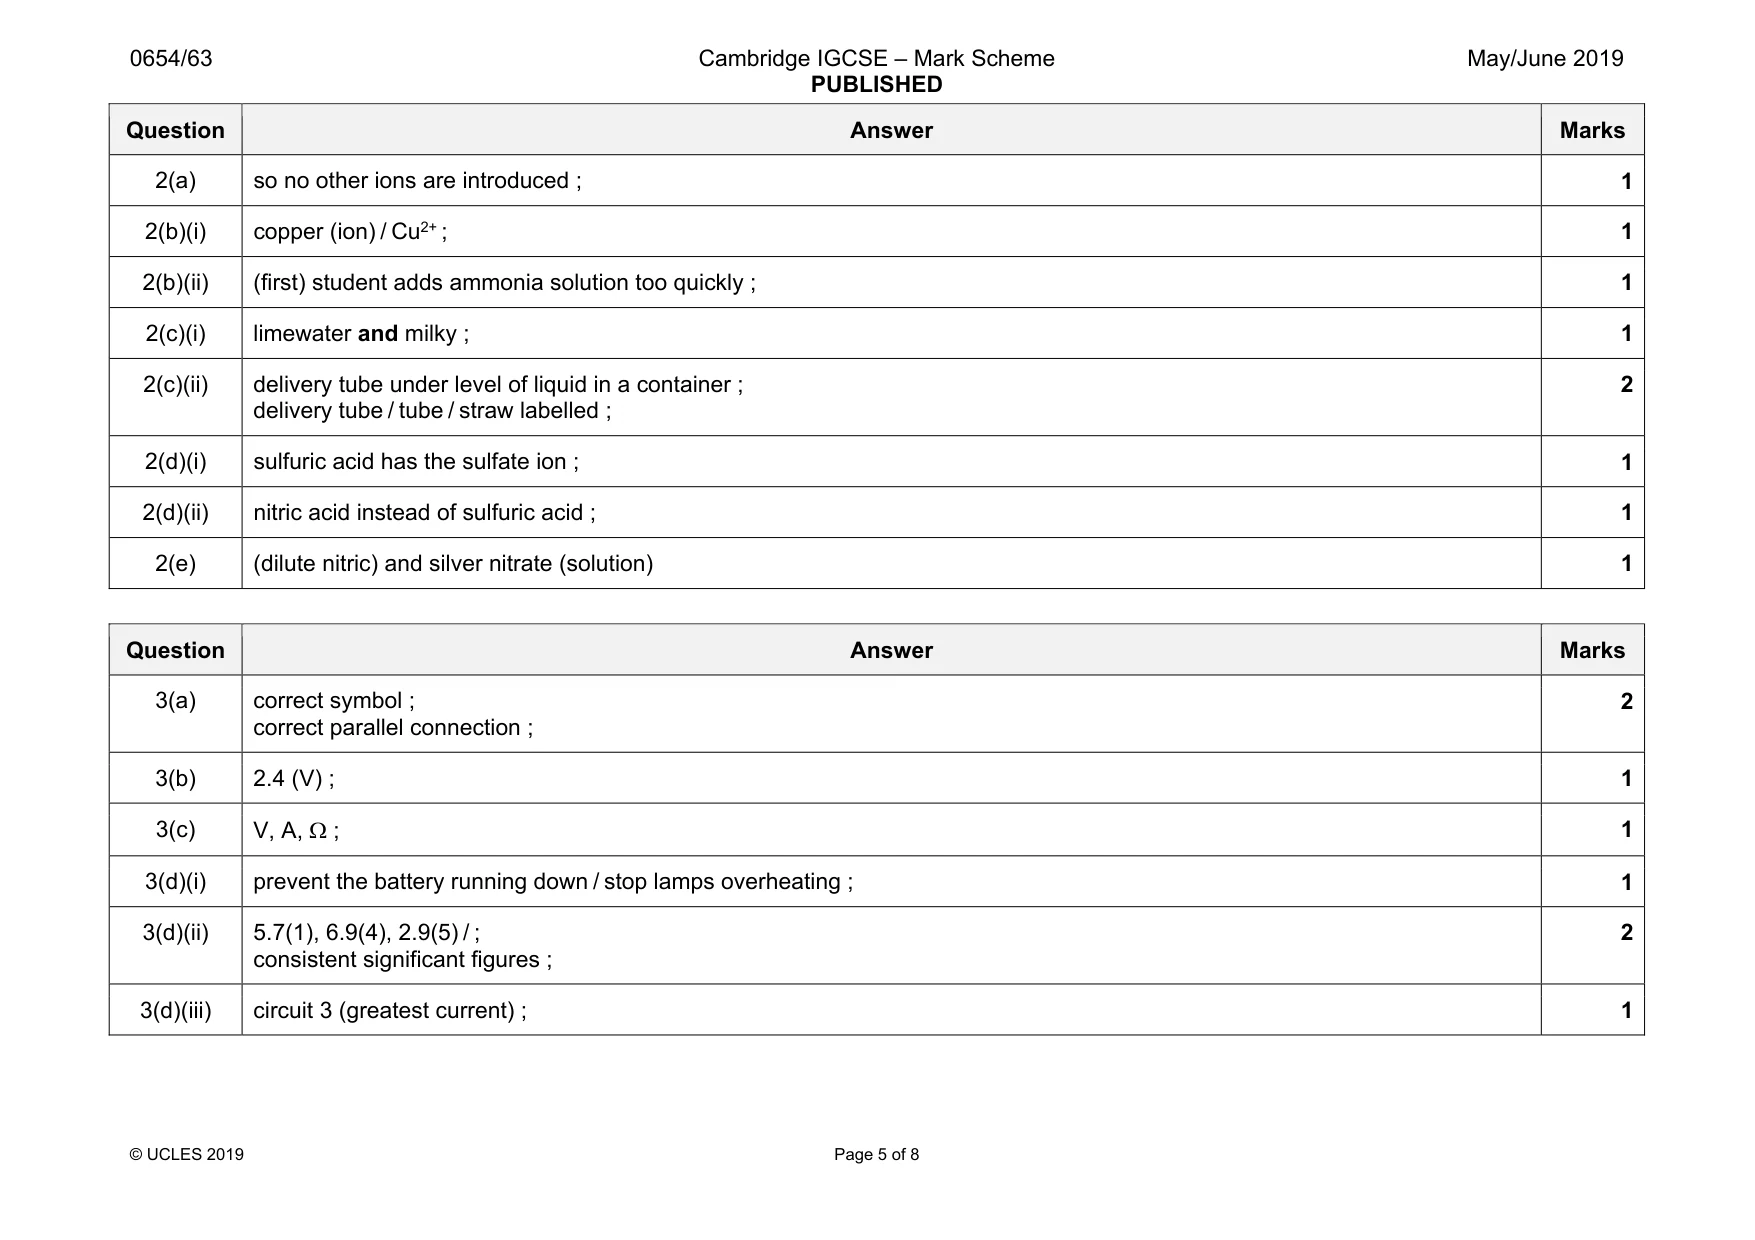
Mark scheme: 1(a)(i) 105 ; 1 1(a)(ii) 160 ; 1 1(a)(iii) 55 ; 1 1(a)(iv) 55 / 30 ; 1.8 / 1.83 ; 2 1(b) water moves ; high concentration to low concentration ; into sugar solution / bag / dilutes sugar solution / increasing the volume of the sugar solution / pressure increases ; by osmosis ; max 3 1(c)(i) Benedict’s ; 1 1(c)(ii) green / yellow / orange / red ; 1 1(c)(iii) blue ; 1 1(d) Any two from surface area of bag ; volume of solution ; concentration of solution ; same (width of) glass tube ; same starting height ; time ; partially permeable membrane ; max 2
Q2 · Solid L is a mixture of two compounds
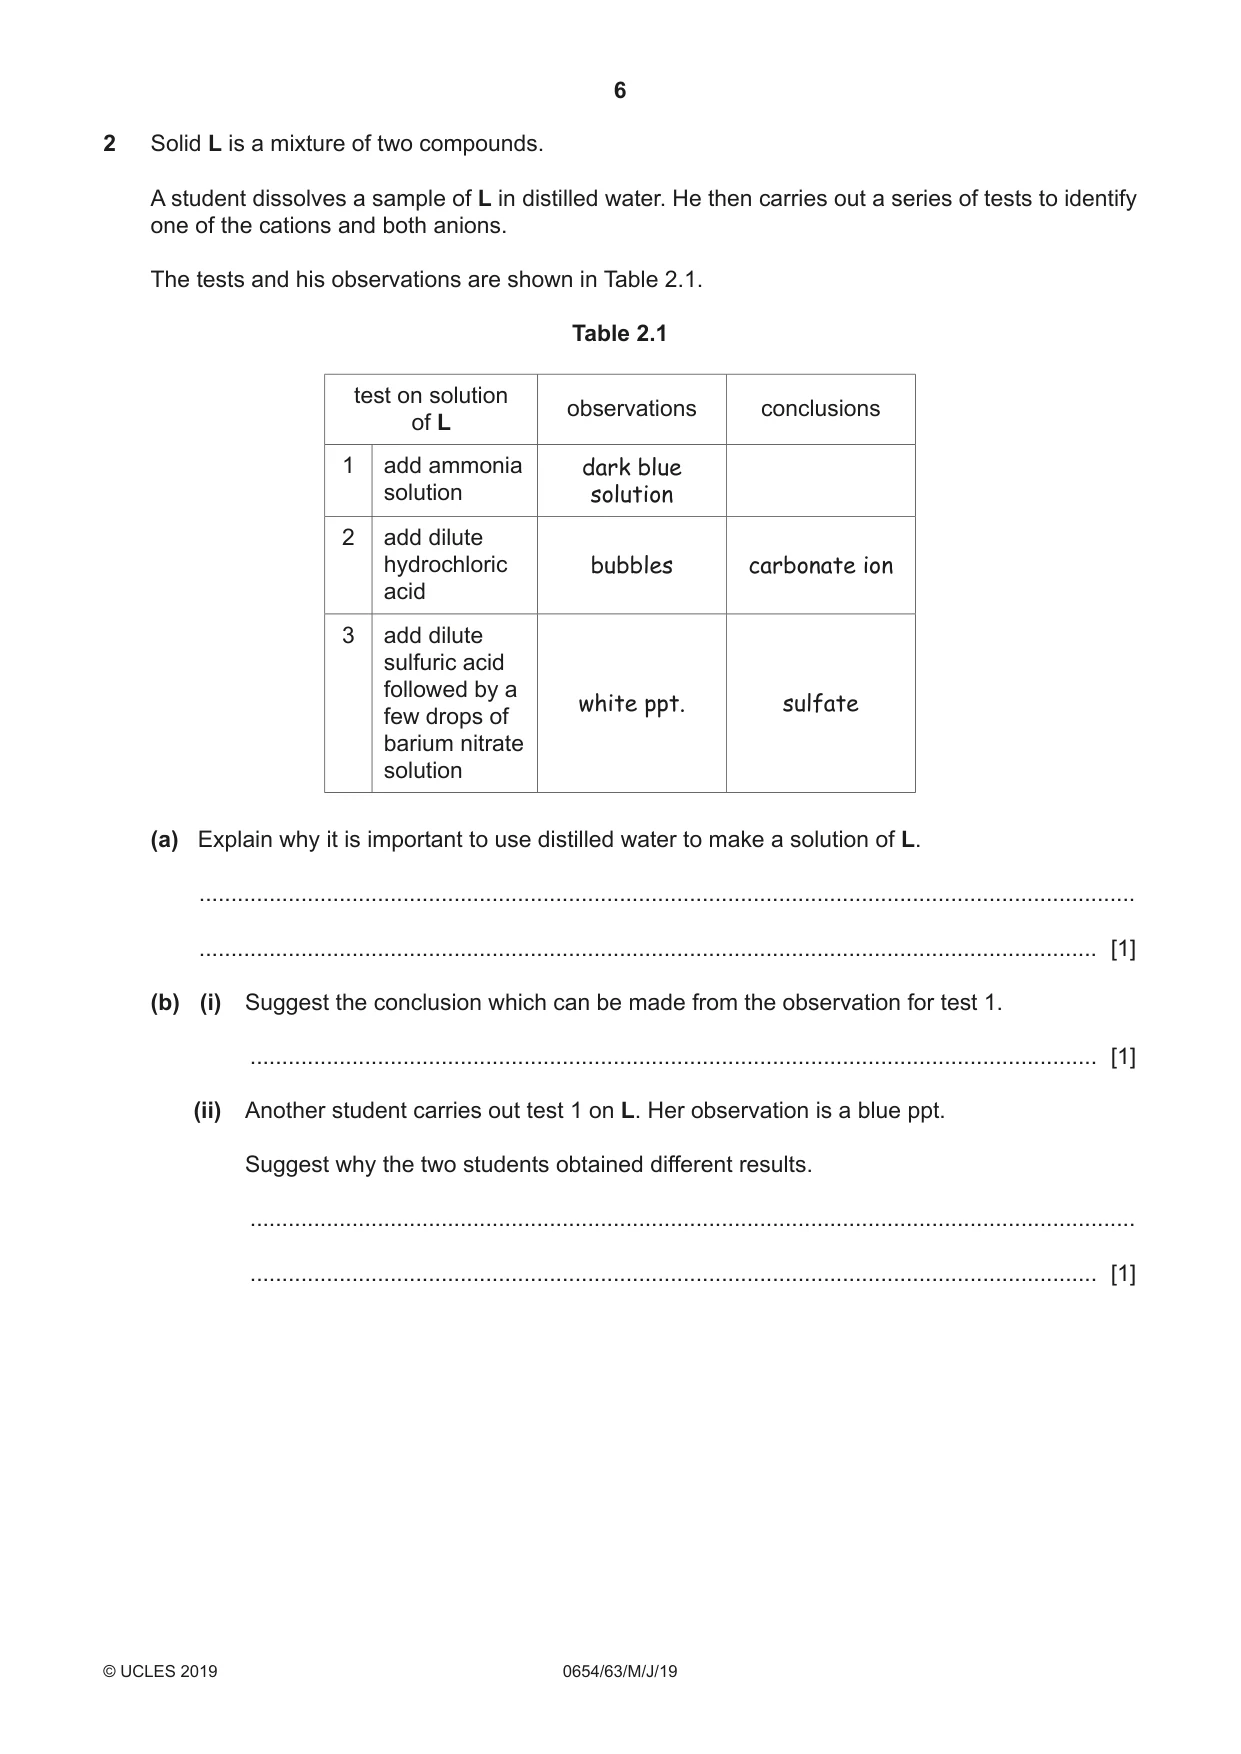
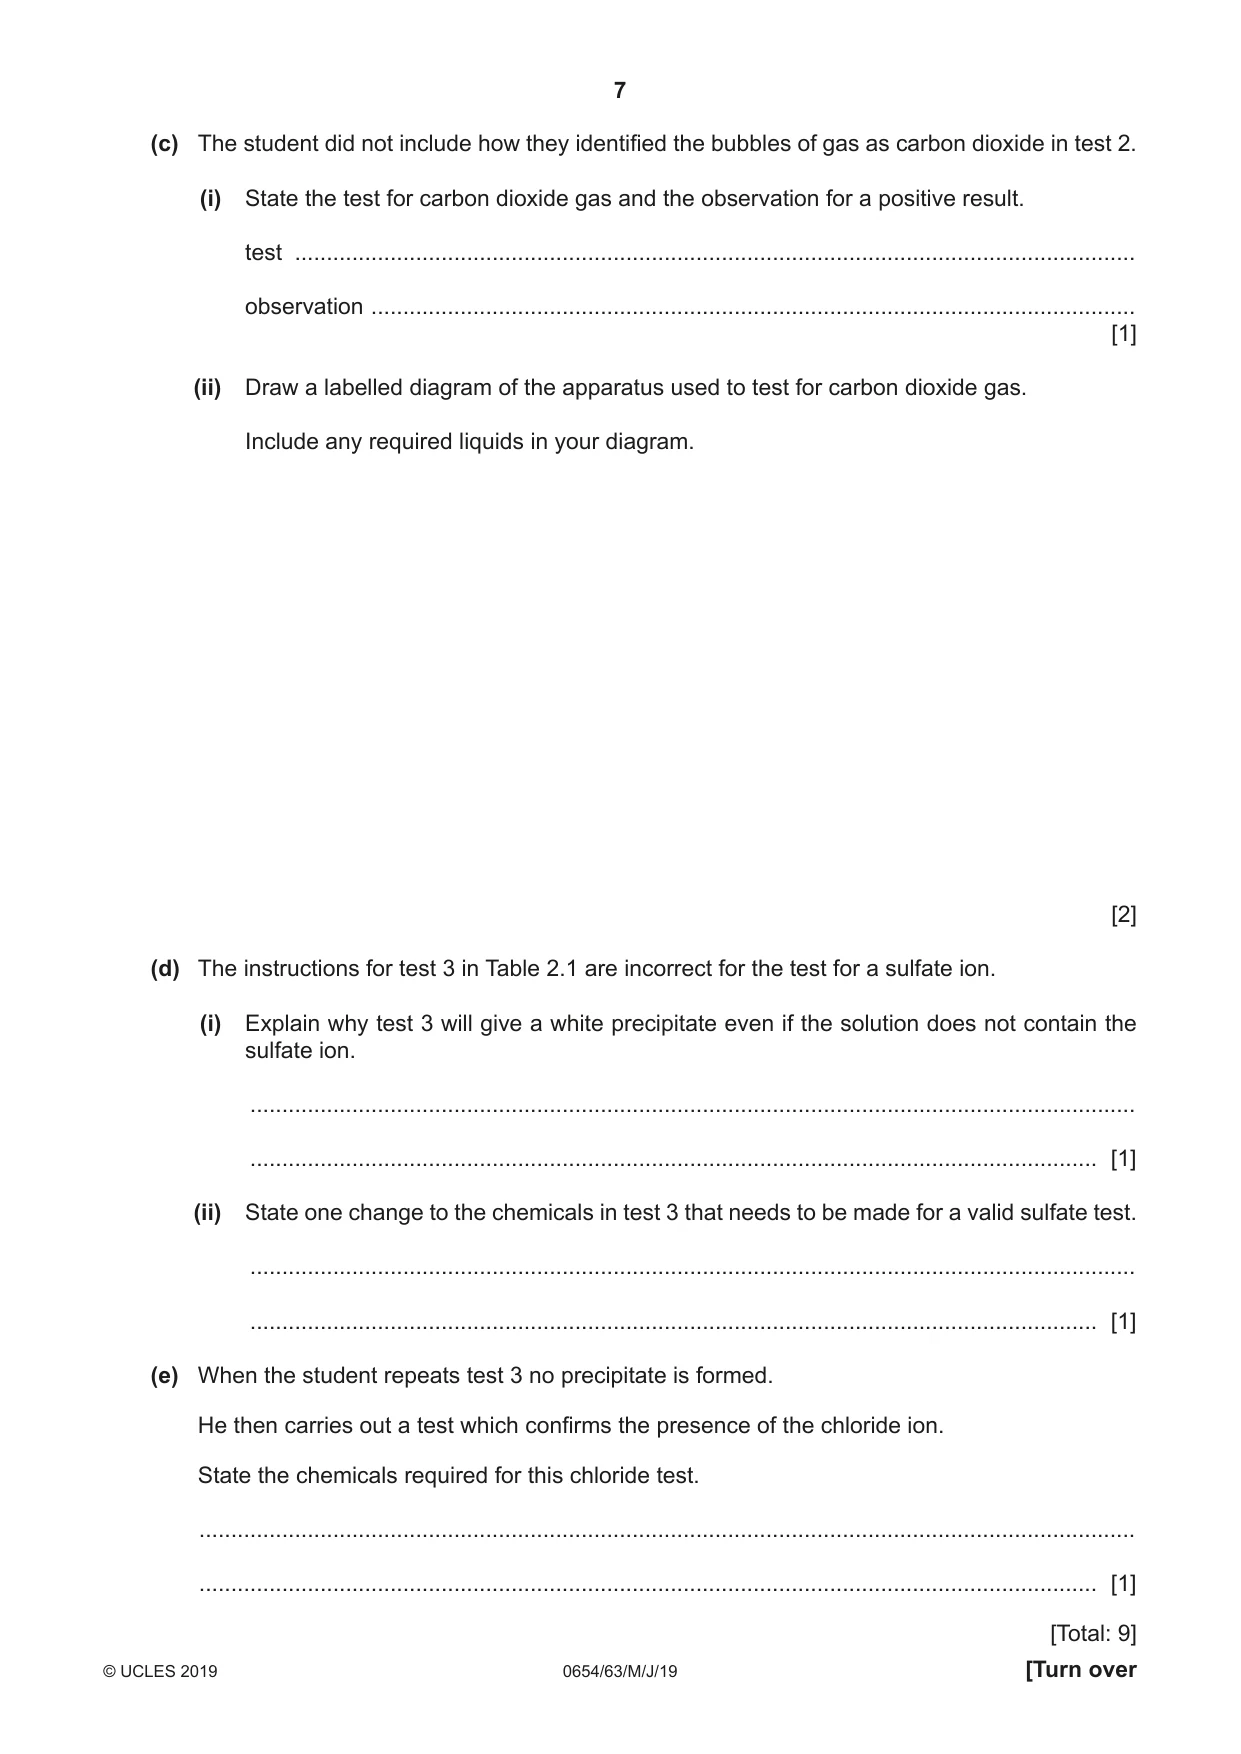
2 Solid L is a mixture of two compounds. A student dissolves a sample of L in distilled water. He then carries out a series of tests to identify one of the cations and both anions. The tests and his observations are shown in Table 2.1. Table 2.1 test on solution observations conclusions of L 1 add ammonia dark blue solution solution 2 add dilute hydrochloric bubbles carbonate ion acid 3 add dilute sulfuric acid followed by a white ppt. sulfate few drops of barium nitrate solution (a) Explain why it is important to use distilled water to make a solution of L. ................................................................................................................................................... ............................................................................................................................................. [1] (b) (i) Suggest the conclusion which can be made from the observation for test 1. ..................................................................................................................................... [1] (ii) Another student carries out test 1 on L. Her observation is a blue ppt. Suggest why the two students obtained different results. ........................................................................................................................................... ..................................................................................................................................... [1] (c) The student did not include how they identified the bubbles of gas as carbon dioxide in test 2. (i) State the test for carbon dioxide gas and the observation for a positive result. test .................................................................................................................................... observation ........................................................................................................................ [1] (ii) Draw a labelled diagram of the apparatus used to test for carbon dioxide gas. Include any required liquids in your diagram. [2] (d) The instructions for test 3 in Table 2.1 are incorrect for the test for a sulfate ion. (i) Explain why test 3 will give a white precipitate even if the solution does not contain the sulfate ion. ........................................................................................................................................... ..................................................................................................................................... [1] (ii) State one change to the chemicals in test 3 that needs to be made for a valid sulfate test. ........................................................................................................................................... ..................................................................................................................................... [1] (e) When the student repeats test 3 no precipitate is formed. He then carries out a test which confirms the presence of the chloride ion. State the chemicals required for this chloride test. ................................................................................................................................................... ............................................................................................................................................. [1] [Total: 9]
Mark scheme: 2(a) so no other ions are introduced ; 1 2(b)(i) copper (ion) / Cu2+ ; 1 2(b)(ii) (first) student adds ammonia solution too quickly ; 1 2(c)(i) limewater and milky ; 1 2(c)(ii) delivery tube under level of liquid in a container ; delivery tube / tube / straw labelled ; 2 2(d)(i) sulfuric acid has the sulfate ion ; 1 2(d)(ii) nitric acid instead of sulfuric acid ; 1 2(e) (dilute nitric) and silver nitrate (solution) 1
Q3 · A student investigates the electrical resistance of different combinations of identical…
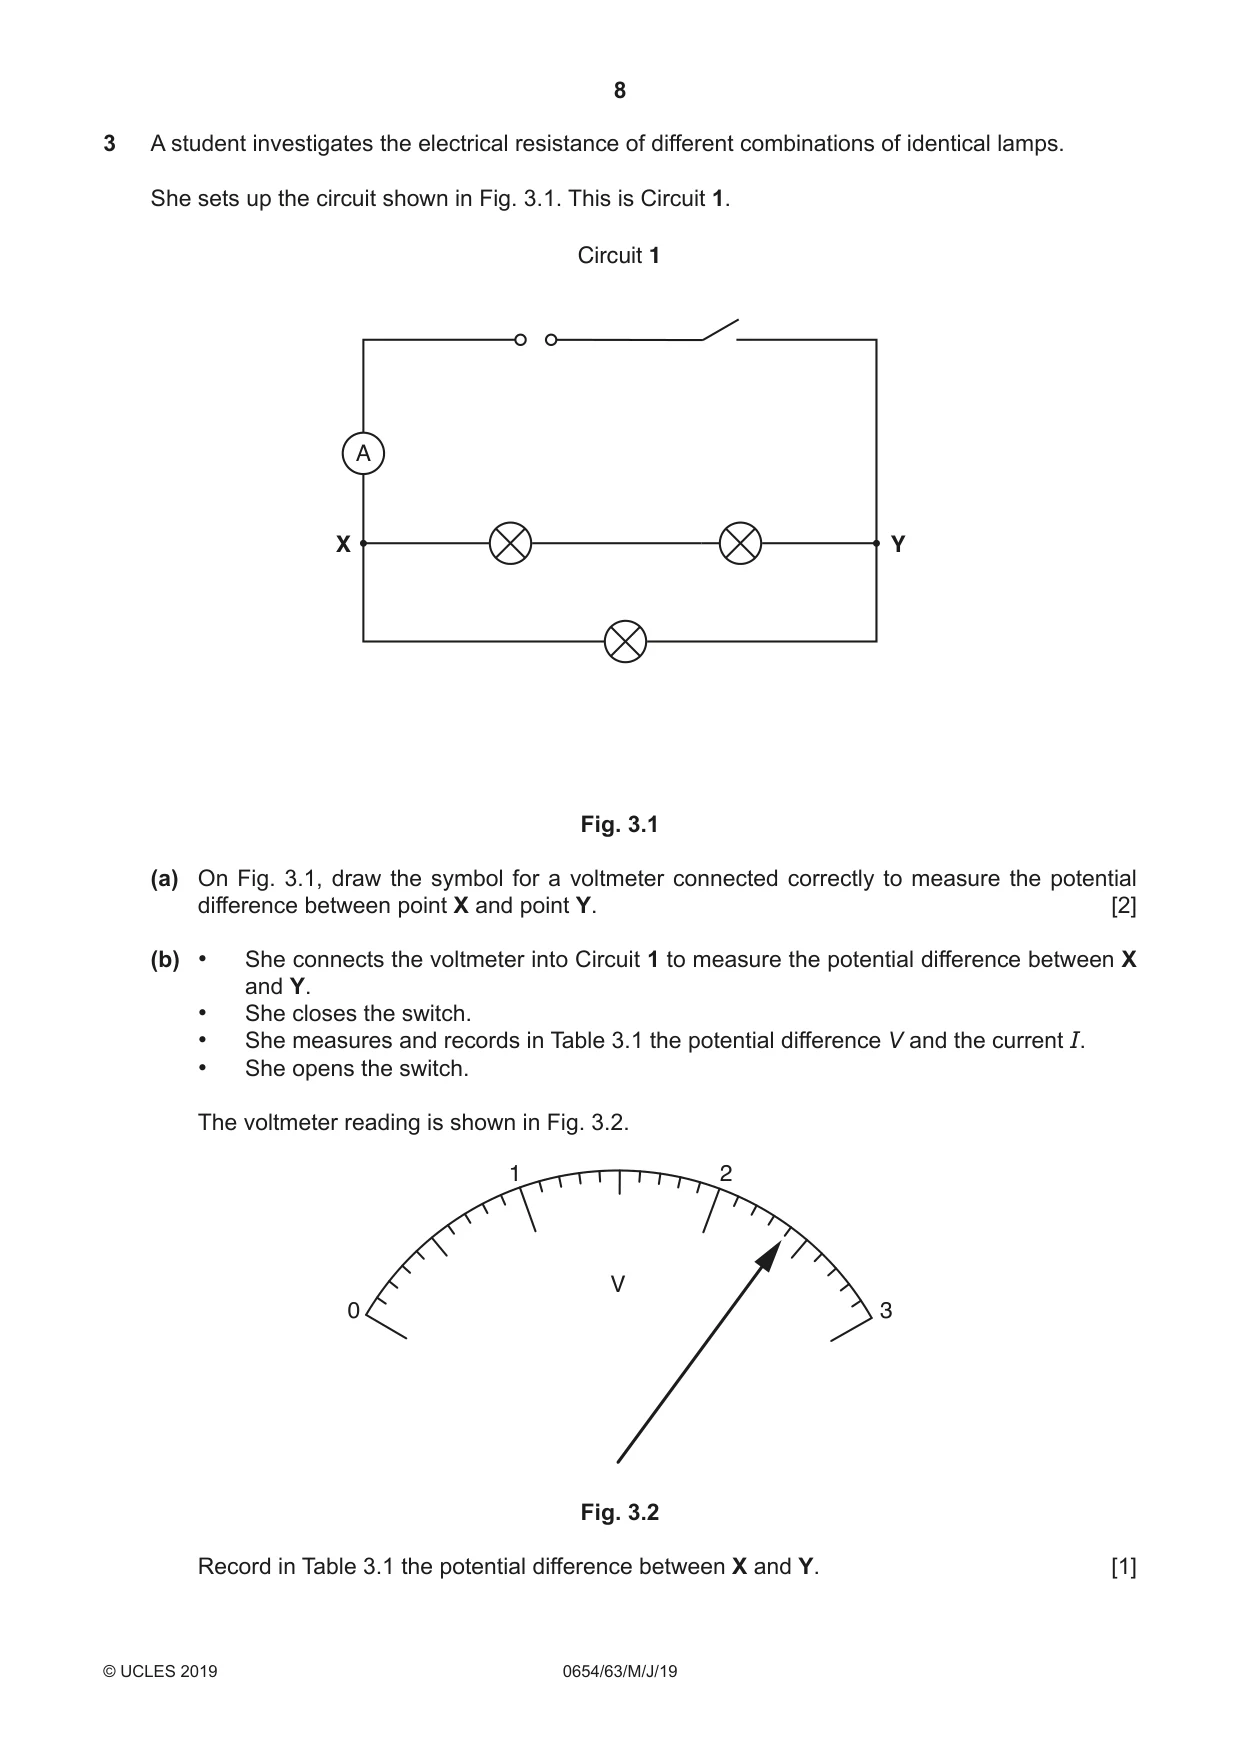
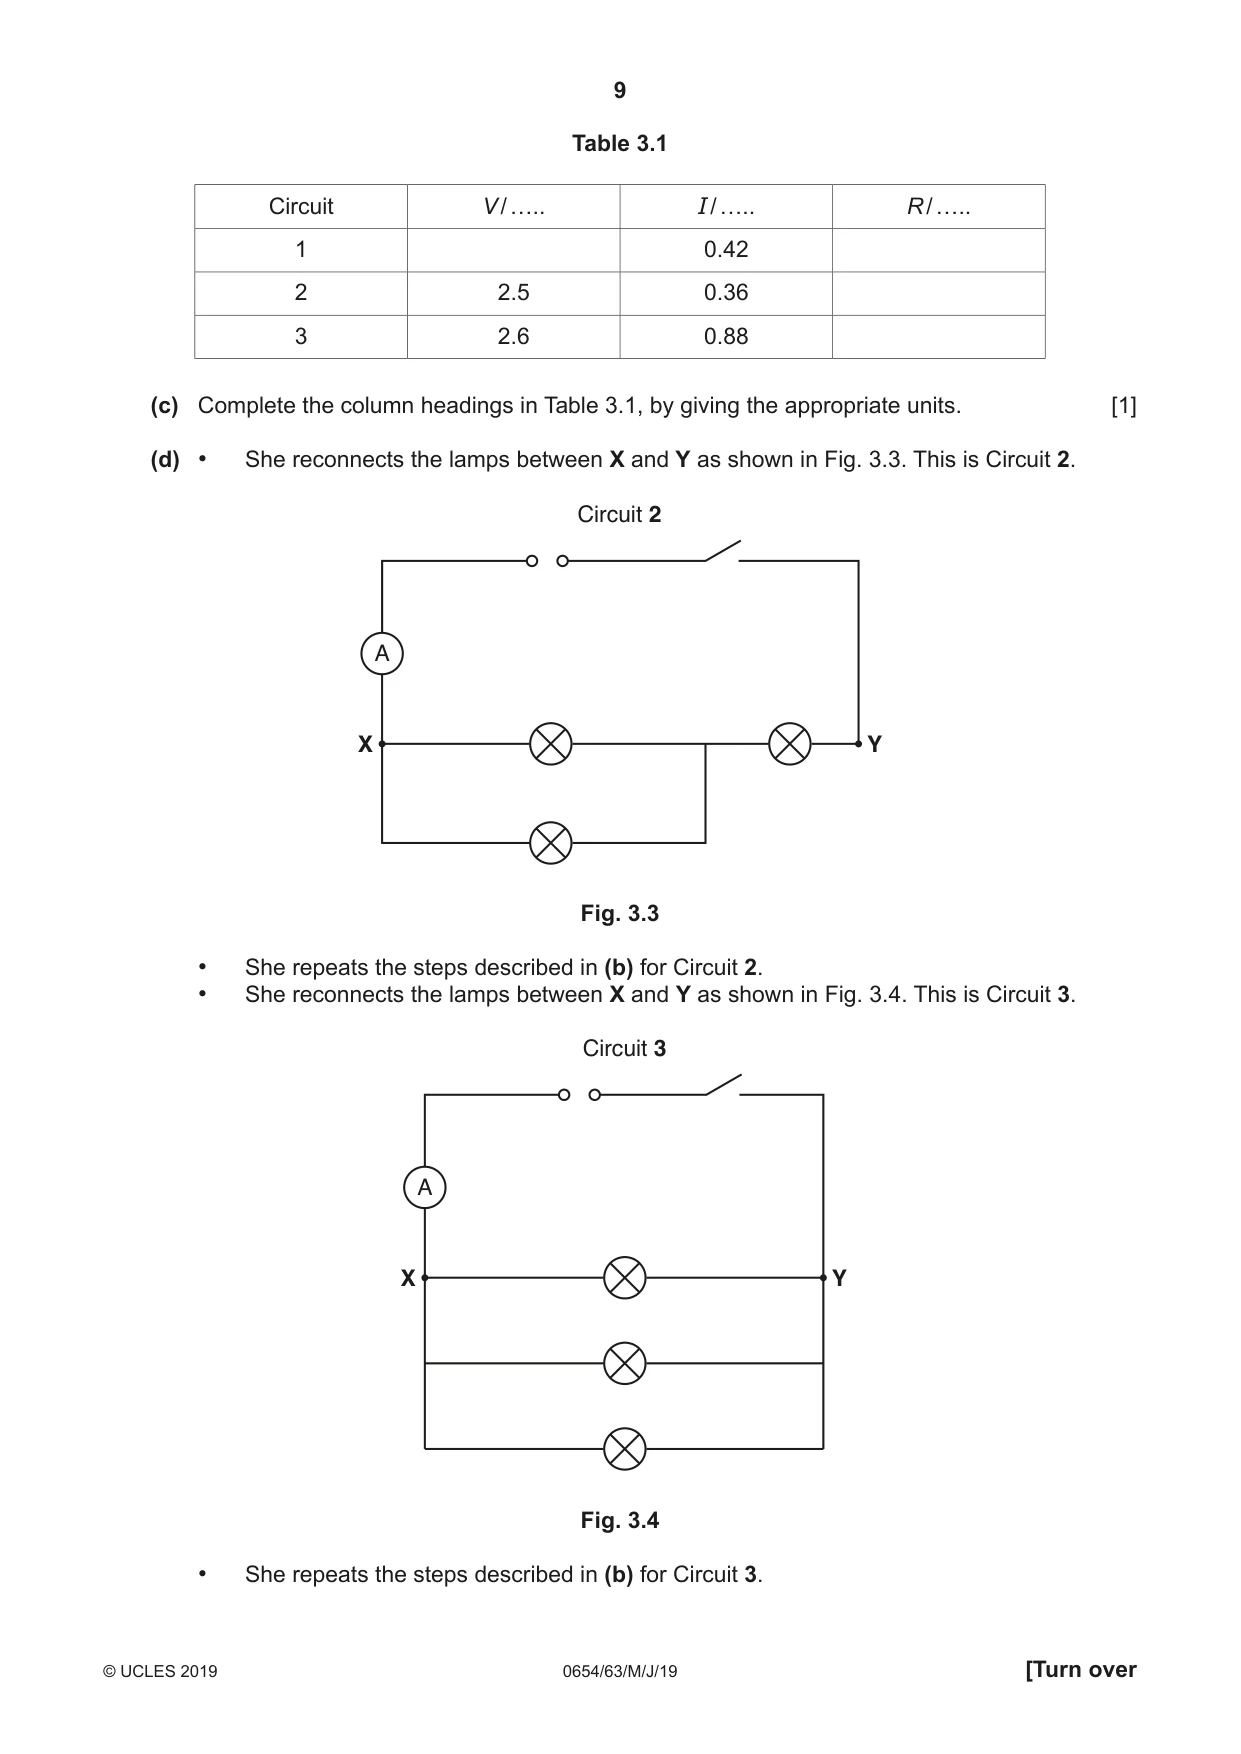
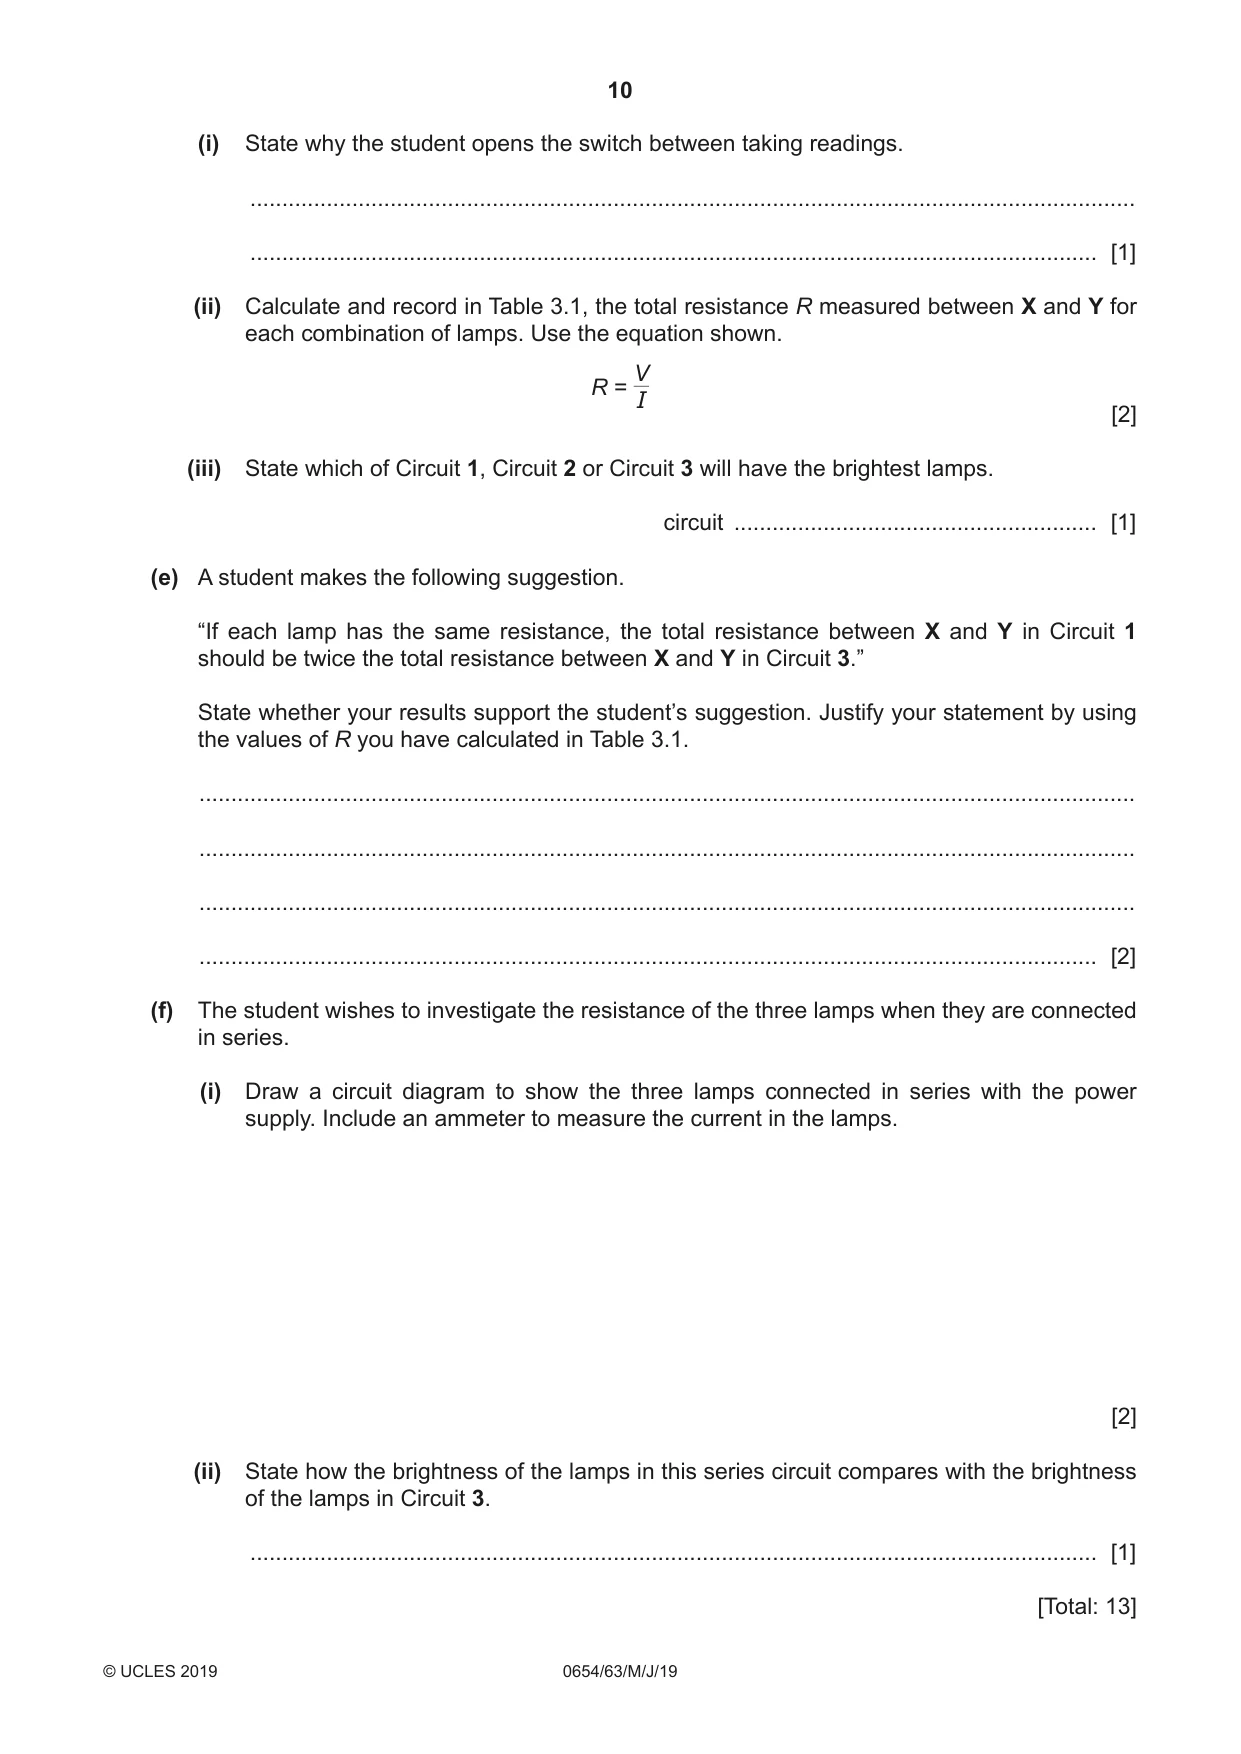
3 A student investigates the electrical resistance of different combinations of identical lamps. She sets up the circuit shown in Fig. 3.1. This is Circuit 1. Circuit 1 A X Y Fig. 3.1 (a) On Fig. 3.1, draw the symbol for a voltmeter connected correctly to measure the potential difference between point X and point Y. [2] (b) • She connects the voltmeter into Circuit 1 to measure the potential difference between X and Y. • She closes the switch. • She measures and records in Table 3.1 the potential difference V and the current I. • She opens the switch. The voltmeter reading is shown in Fig. 3.2. 1 2 V 0 3 Fig. 3.2 Record in Table 3.1 the potential difference between X and Y. [1] Table 3.1 Circuit V / ….. I / ….. R / ….. 1 0.42 2 2.5 0.36 3 2.6 0.88 (c) Complete the column headings in Table 3.1, by giving the appropriate units. [1] (d) • She reconnects the lamps between X and Y as shown in Fig. 3.3. This is Circuit 2. Circuit 2 A X Y Fig. 3.3 • She repeats the steps described in (b) for Circuit 2. • She reconnects the lamps between X and Y as shown in Fig. 3.4. This is Circuit 3. Circuit 3 A X Y Fig. 3.4 • She repeats the steps described in (b) for Circuit 3. (i) State why the student opens the switch between taking readings. ........................................................................................................................................... ..................................................................................................................................... [1] (ii) Calculate and record in Table 3.1, the total resistance R measured between X and Y for each combination of lamps. Use the equation shown. V R = I [2] (iii) State which of Circuit 1, Circuit 2 or Circuit 3 will have the brightest lamps. circuit ......................................................... [1] (e) A student makes the following suggestion. “If each lamp has the same resistance, the total resistance between X and Y in Circuit 1 should be twice the total resistance between X and Y in Circuit 3.” State whether your results support the student’s suggestion. Justify your statement by using the values of R you have calculated in Table 3.1. ................................................................................................................................................... ................................................................................................................................................... ................................................................................................................................................... ............................................................................................................................................. [2] (f) The student wishes to investigate the resistance of the three lamps when they are connected in series. (i) Draw a circuit diagram to show the three lamps connected in series with the power supply. Include an ammeter to measure the current in the lamps. [2] (ii) State how the brightness of the lamps in this series circuit compares with the brightness of the lamps in Circuit 3. ..................................................................................................................................... [1] [Total: 13]
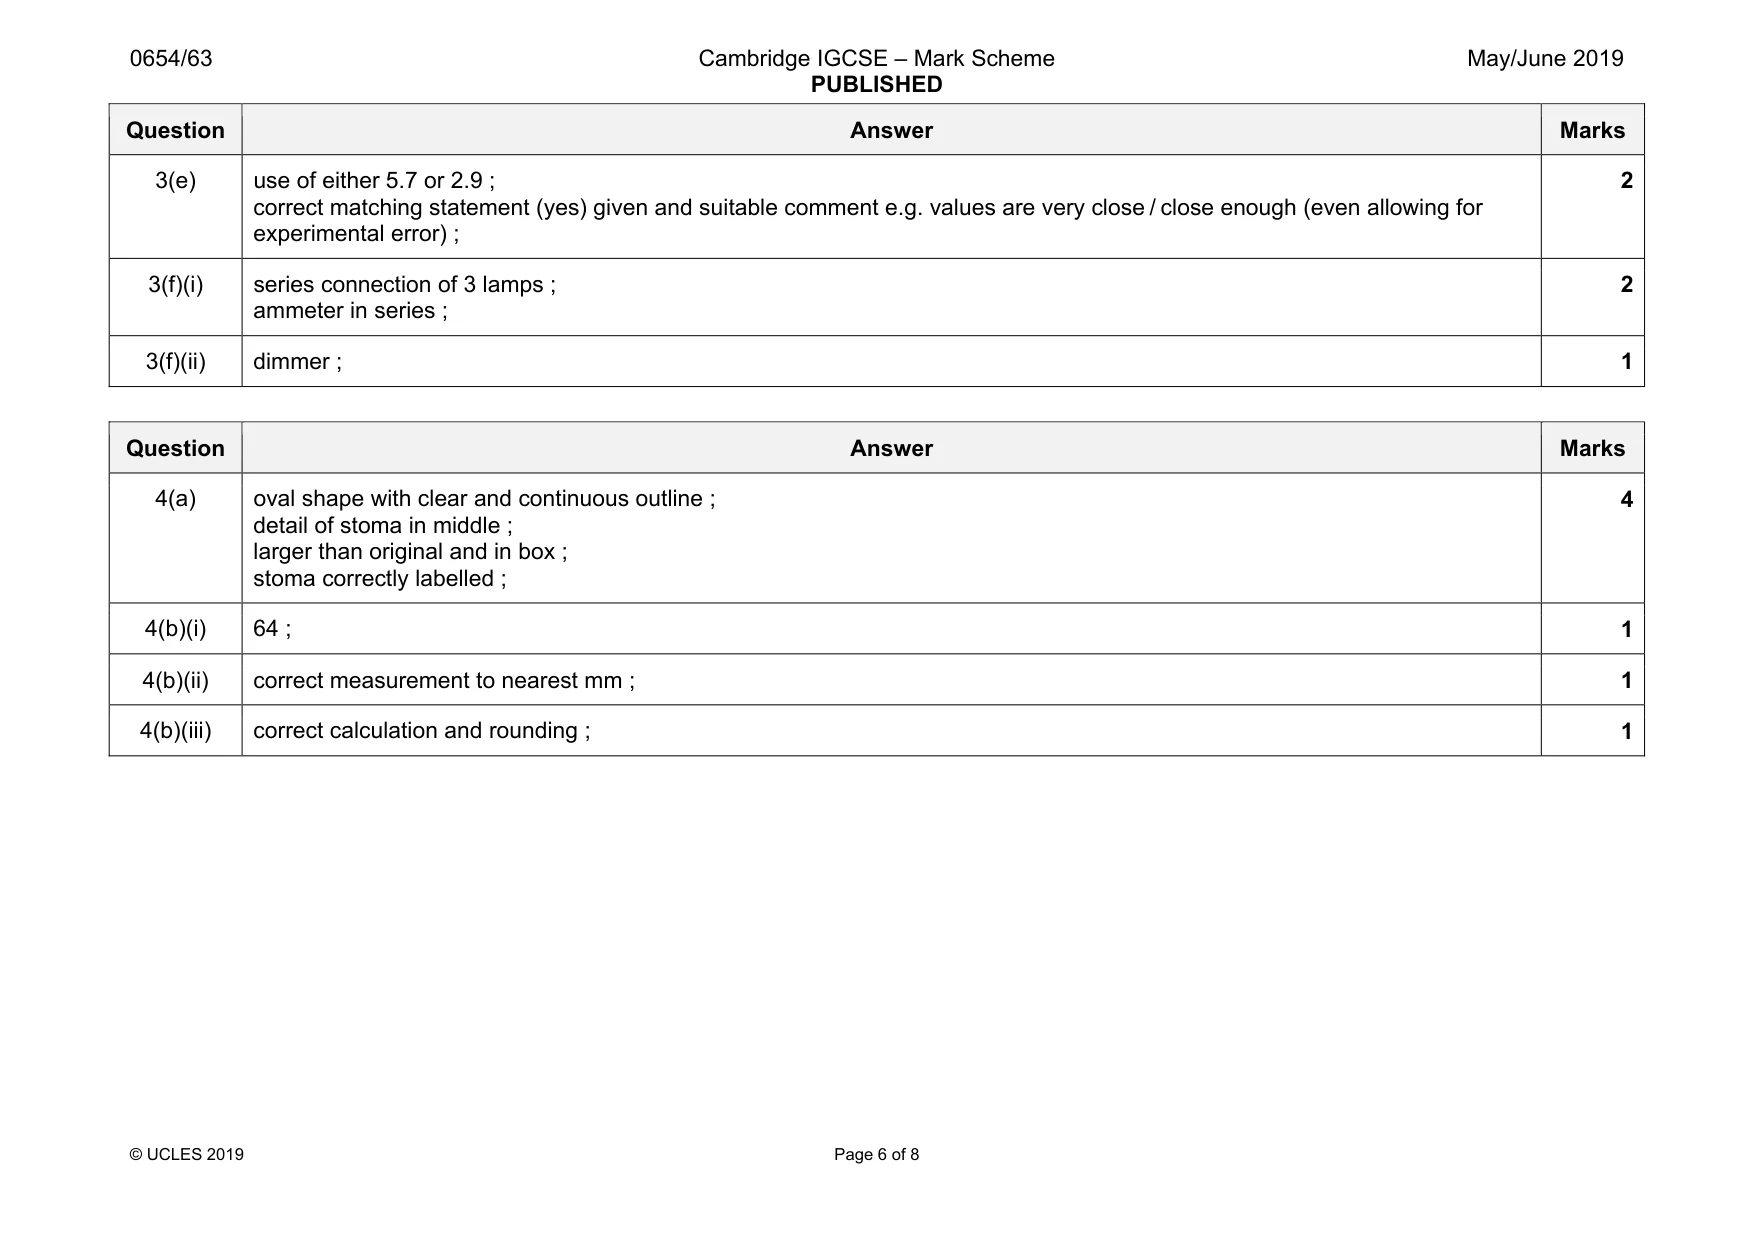
Mark scheme: 3(a) correct symbol ; correct parallel connection ; 2 3(b) 2.4 (V) ; 1 3(c) V, A, Ω ; 1 3(d)(i) prevent the battery running down / stop lamps overheating ; 1 3(d)(ii) 5.7(1), 6.9(4), 2.9(5) / ; consistent significant figures ; 2 3(d)(iii) circuit 3 (greatest current) ; 1 Question Answer Marks 3(e) use of either 5.7 or 2.9 ; correct matching statement (yes) given and suitable comment e.g. values are very close / close enough (even allowing for experimental error) ; 2 3(f)(i) series connection of 3 lamps ; ammeter in series ; 2 3(f)(ii) dimmer ; 1
Q4 · Two guard cells and the stoma formed by them
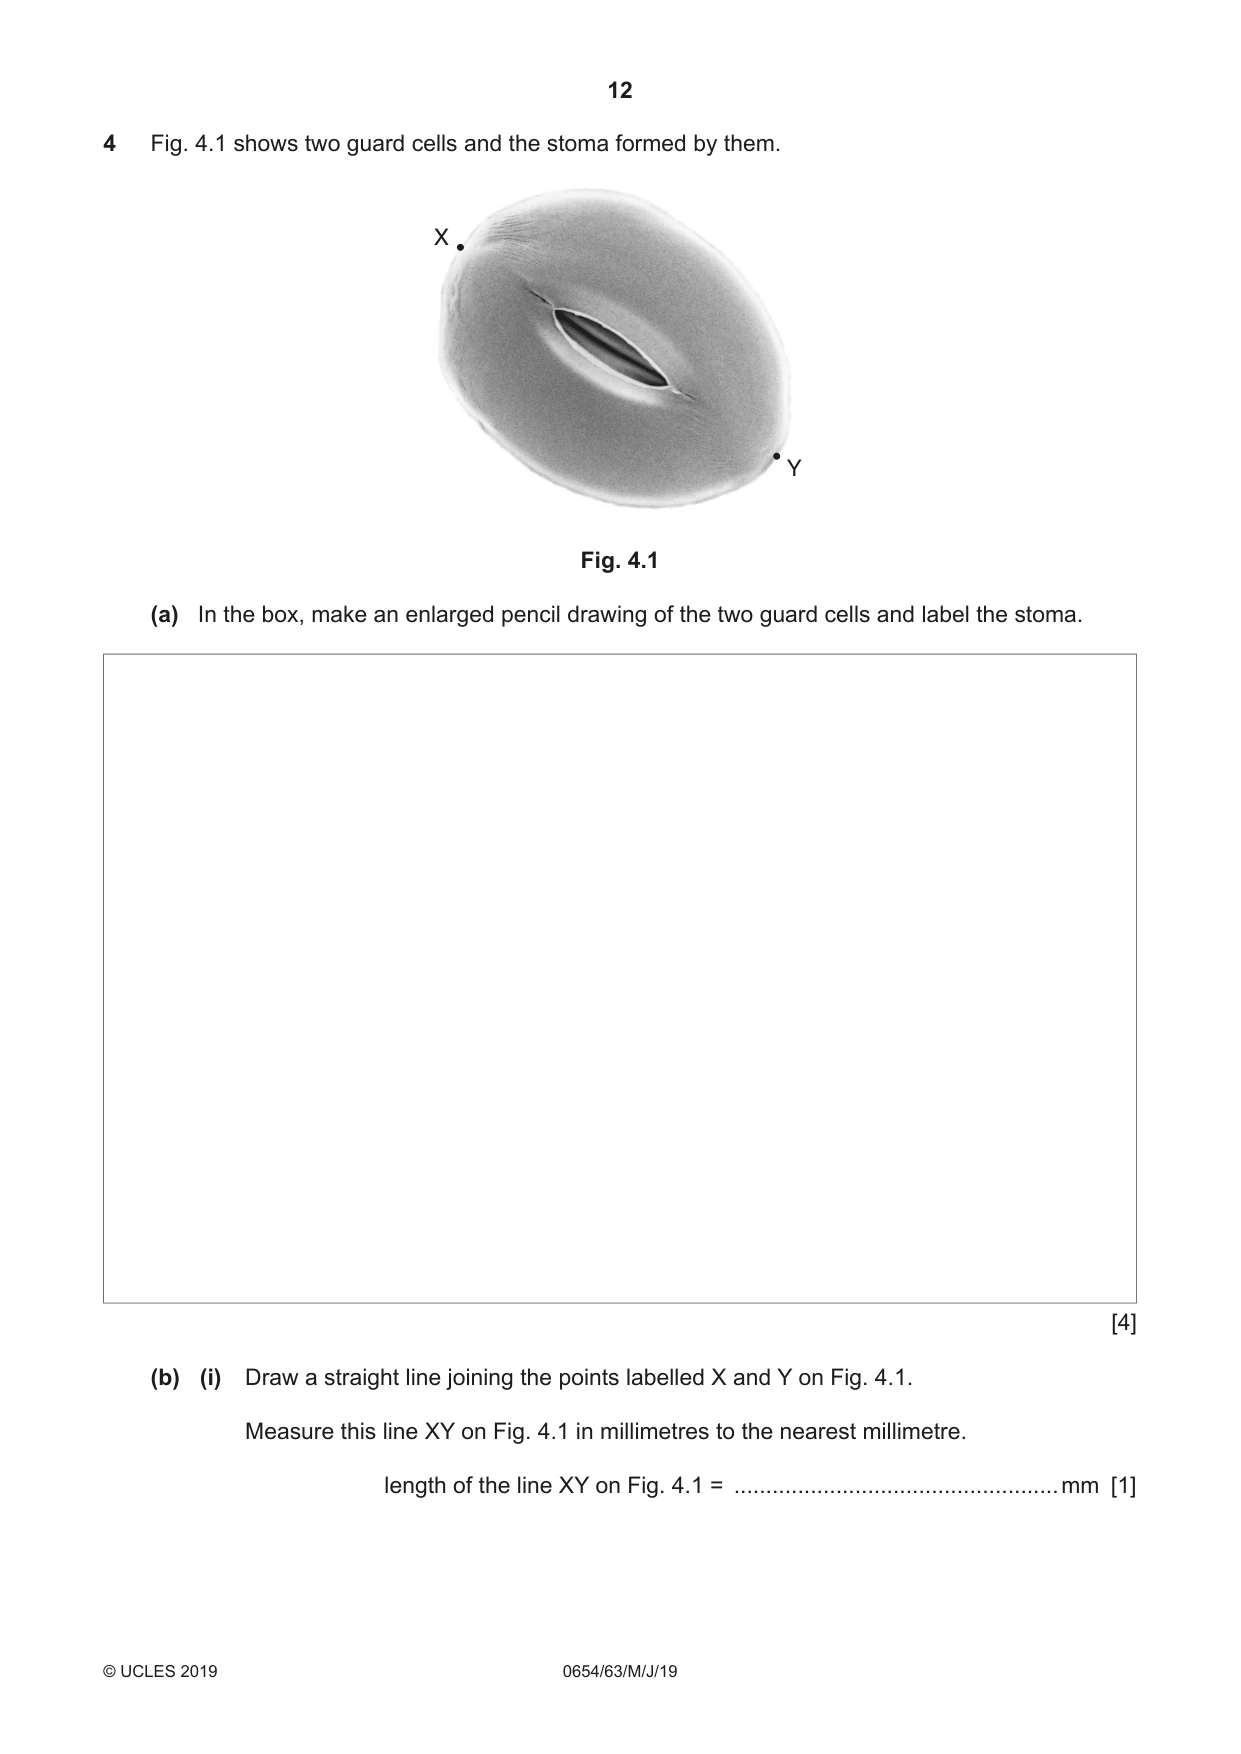
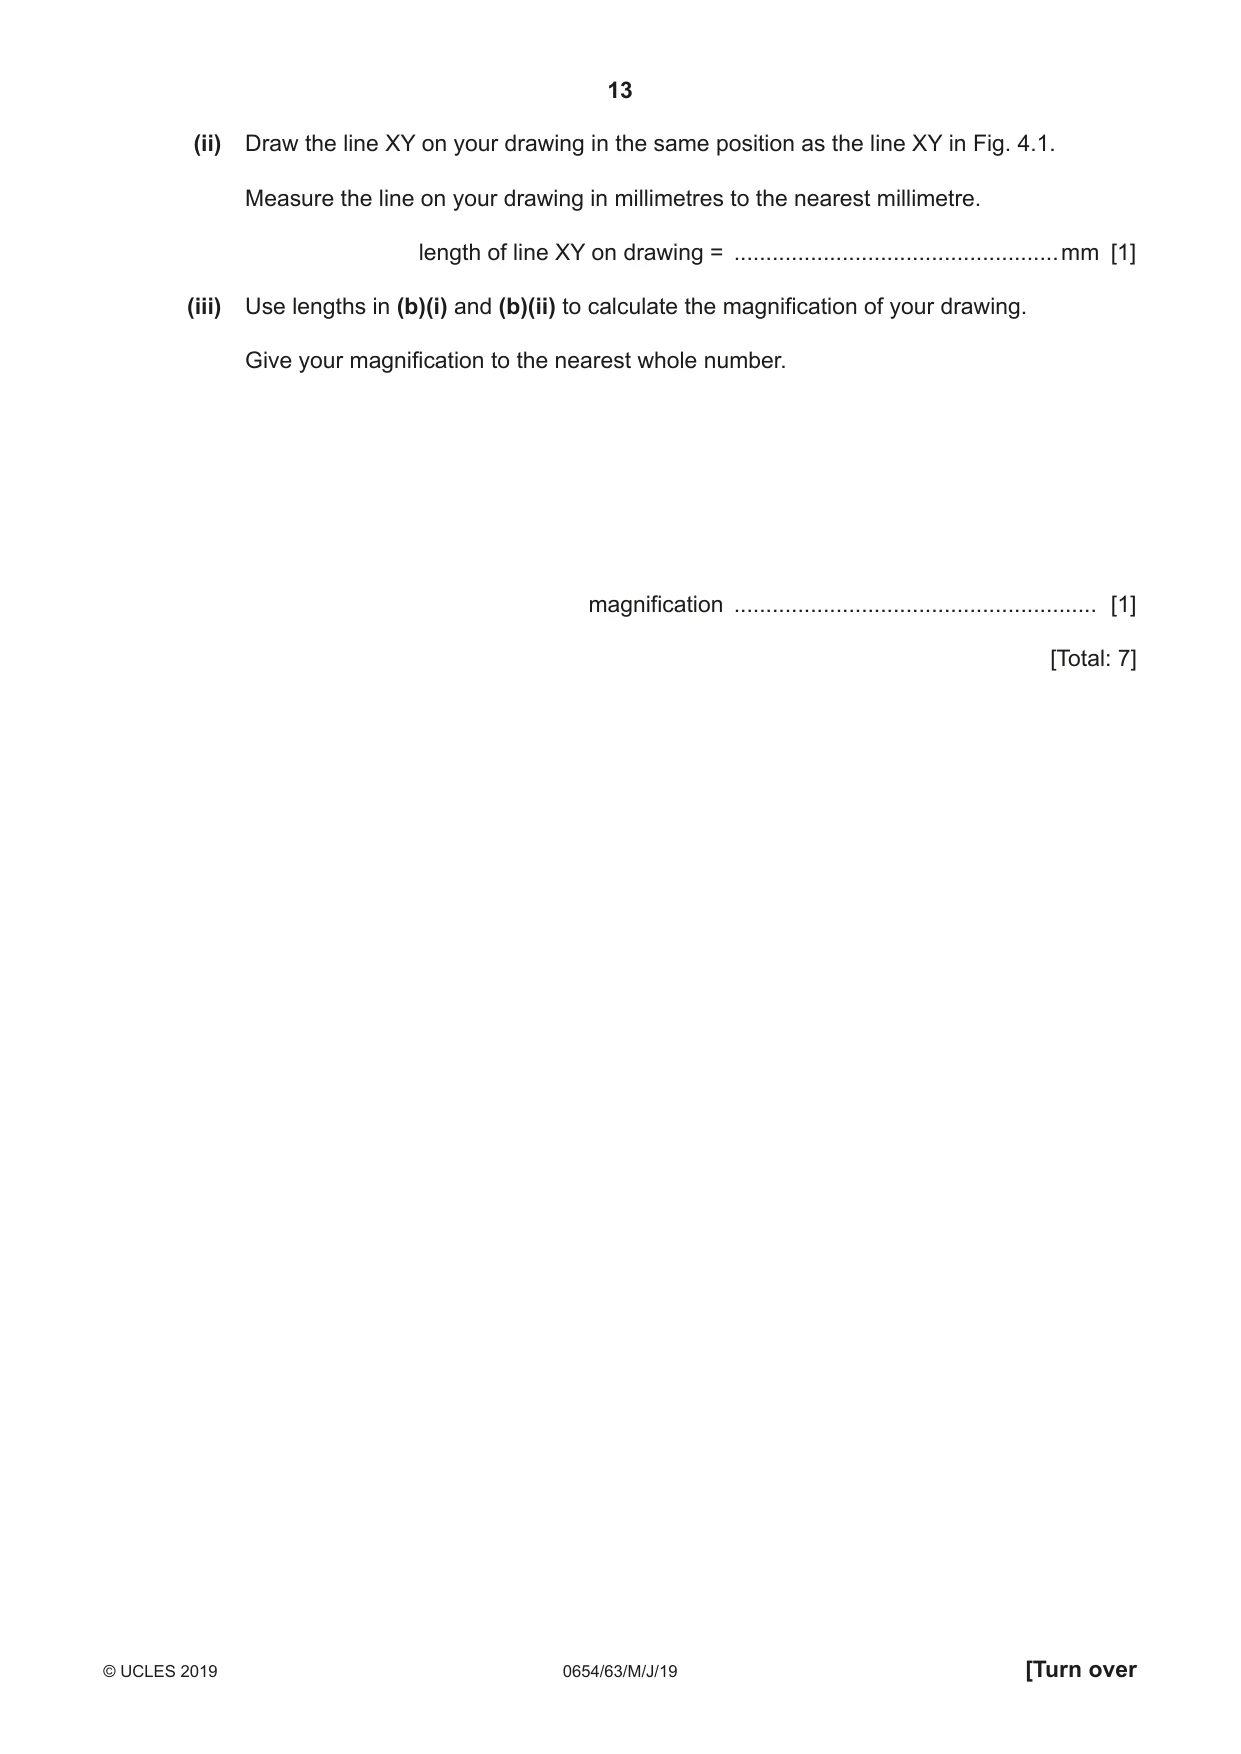
4 Fig. 4.1 shows two guard cells and the stoma formed by them. X Y Fig. 4.1 (a) In the box, make an enlarged pencil drawing of the two guard cells and label the stoma. [4] (b) (i) Draw a straight line joining the points labelled X and Y on Fig. 4.1. Measure this line XY on Fig. 4.1 in millimetres to the nearest millimetre. length of the line XY on Fig. 4.1 = ...................................................mm [1] (ii) Draw the line XY on your drawing in the same position as the line XY in Fig. 4.1. Measure the line on your drawing in millimetres to the nearest millimetre. length of line XY on drawing = ...................................................mm [1] (iii) Use lengths in (b)(i) and (b)(ii) to calculate the magnification of your drawing. Give your magnification to the nearest whole number. magnification ......................................................... [1] [Total: 7]
Mark scheme: 4(a) oval shape with clear and continuous outline ; detail of stoma in middle ; larger than original and in box ; stoma correctly labelled ; 4 4(b)(i) 64 ; 1 4(b)(ii) correct measurement to nearest mm ; 1 4(b)(iii) correct calculation and rounding ; 1
Q5 · A student carries out an experiment to find the maximum amount of thermal energy produced…
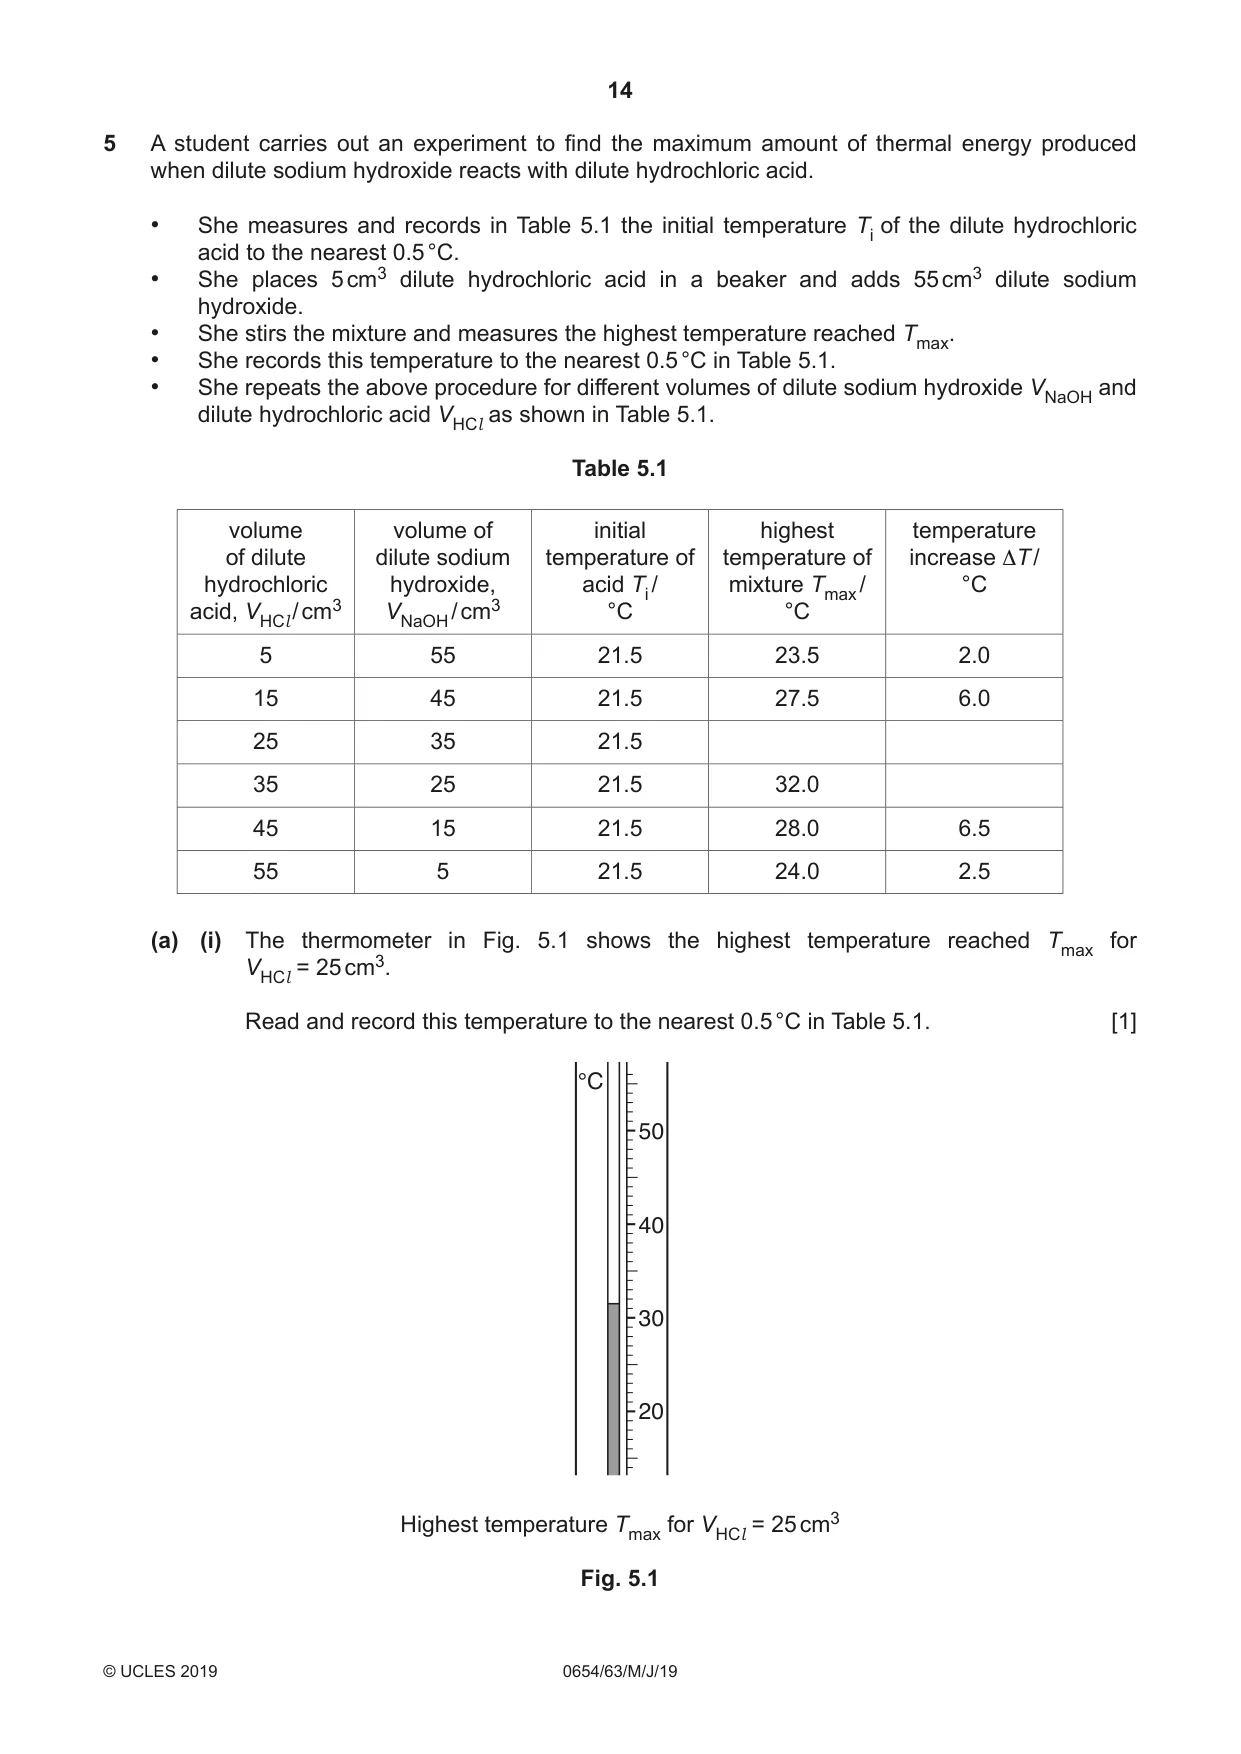
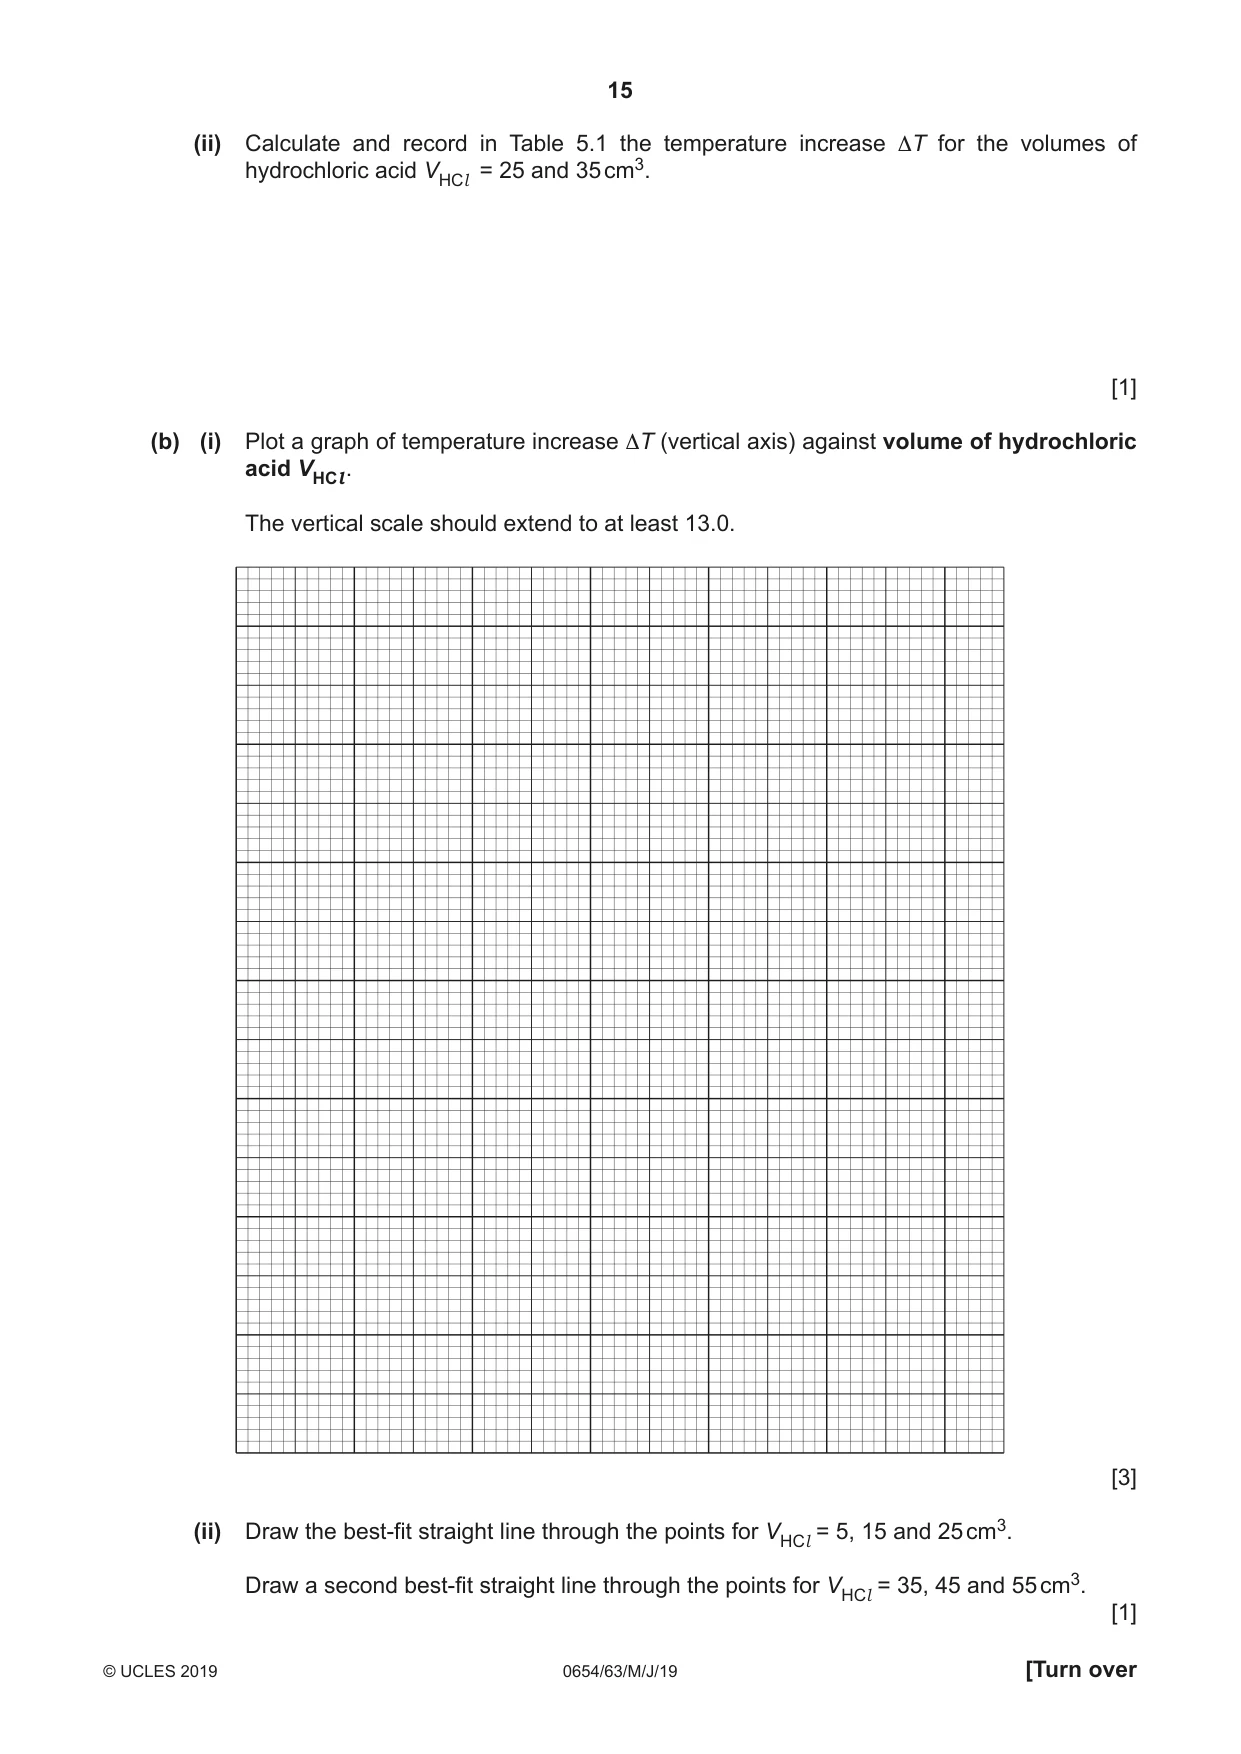
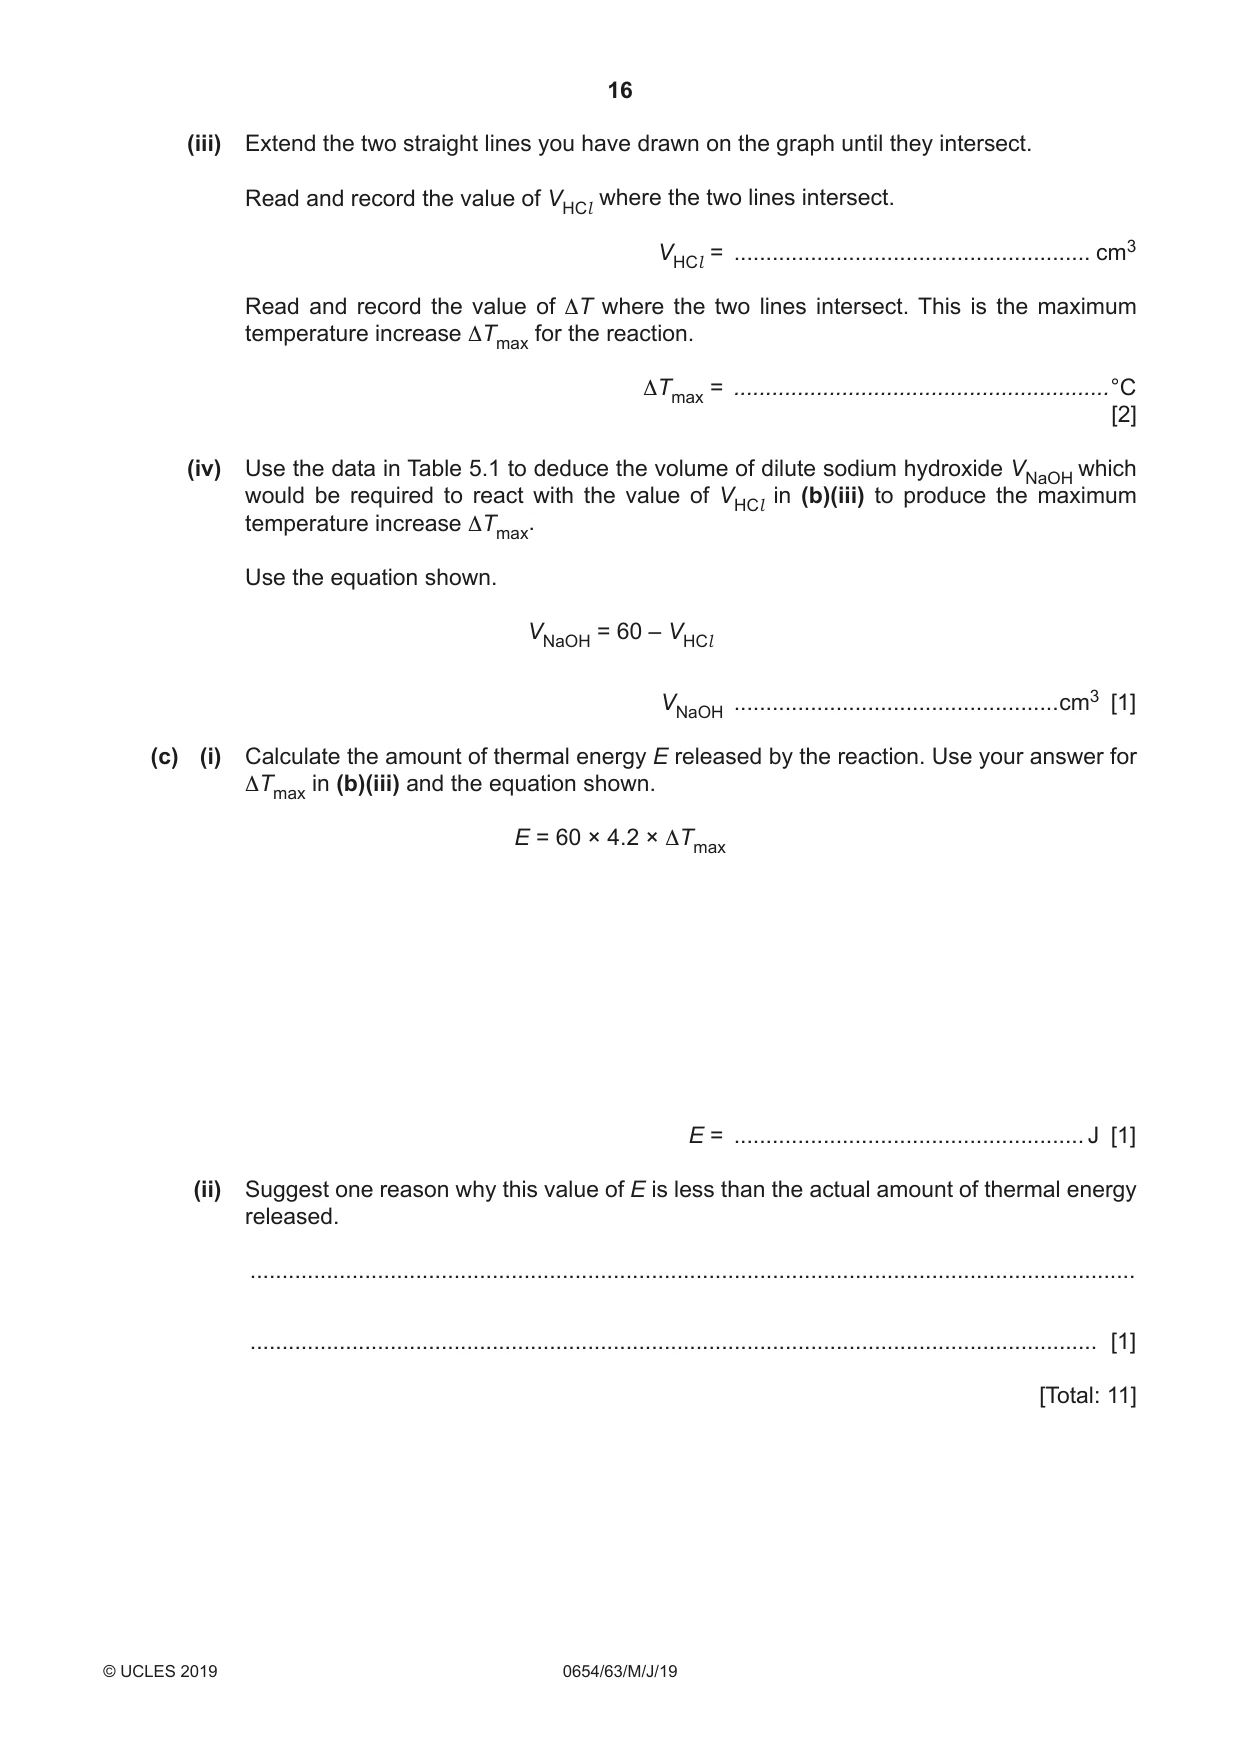
5 A student carries out an experiment to find the maximum amount of thermal energy produced when dilute sodium hydroxide reacts with dilute hydrochloric acid. • She measures and records in Table 5.1 the initial temperature Ti of the dilute hydrochloric acid to the nearest 0.5 °C. • She places 5 cm3 dilute hydrochloric acid in a beaker and adds 55 cm3 dilute sodium hydroxide. • She stirs the mixture and measures the highest temperature reached Tmax. • She records this temperature to the nearest 0.5 °C in Table 5.1. • She repeats the above procedure for different volumes of dilute sodium hydroxide VNaOH and dilute hydrochloric acid VHCl as shown in Table 5.1. Table 5.1 volume volume of initial highest temperature of dilute dilute sodium temperature of temperature of increase ΔT / hydrochloric hydroxide, acid Ti / mixture Tmax / °C acid, VHCl / cm3 VNaOH / cm3 °C °C 5 55 21.5 23.5 2.0 15 45 21.5 27.5 6.0 25 35 21.5 35 25 21.5 32.0 45 15 21.5 28.0 6.5 55 5 21.5 24.0 2.5 (a) (i) The thermometer in Fig. 5.1 shows the highest temperature reached Tmax for VHCl = 25 cm3. Read and record this temperature to the nearest 0.5 °C in Table 5.1. [1] °C 50 40 30 20 Highest temperature Tmax for VHCl = 25 cm3 Fig. 5.1 (ii) Calculate and record in Table 5.1 the temperature increase ΔT for the volumes of hydrochloric acid VHCl = 25 and 35 cm3. [1] (b) (i) Plot a graph of temperature increase ΔT (vertical axis) against volume of hydrochloric acid VHCl. The vertical scale should extend to at least 13.0. [3] (ii) Draw the best-fit straight line through the points for VHCl = 5, 15 and 25 cm3. Draw a second best-fit straight line through the points for VHCl = 35, 45 and 55 cm3. [1] (iii) Extend the two straight lines you have drawn on the graph until they intersect. Read and record the value of VHCl where the two lines intersect. VHCl = ........................................................ cm3 Read and record the value of ΔT where the two lines intersect. This is the maximum temperature increase ΔTmax for the reaction. ΔTmax = ...........................................................°C [2] (iv) Use the data in Table 5.1 to deduce the volume of dilute sodium hydroxide VNaOH which would be required to react with the value of VHCl in (b)(iii) to produce the maximum temperature increase ΔTmax. Use the equation shown. VNaOH = 60 – VHCl VNaOH ...................................................cm3 [1] (c) (i) Calculate the amount of thermal energy E released by the reaction. Use your answer for ΔTmax in (b)(iii) and the equation shown. E = 60 × 4.2 × ΔTmax E = ....................................................... J [1] (ii) Suggest one reason why this value of E is less than the actual amount of thermal energy released. ........................................................................................................................................... ..................................................................................................................................... [1] [Total: 11]
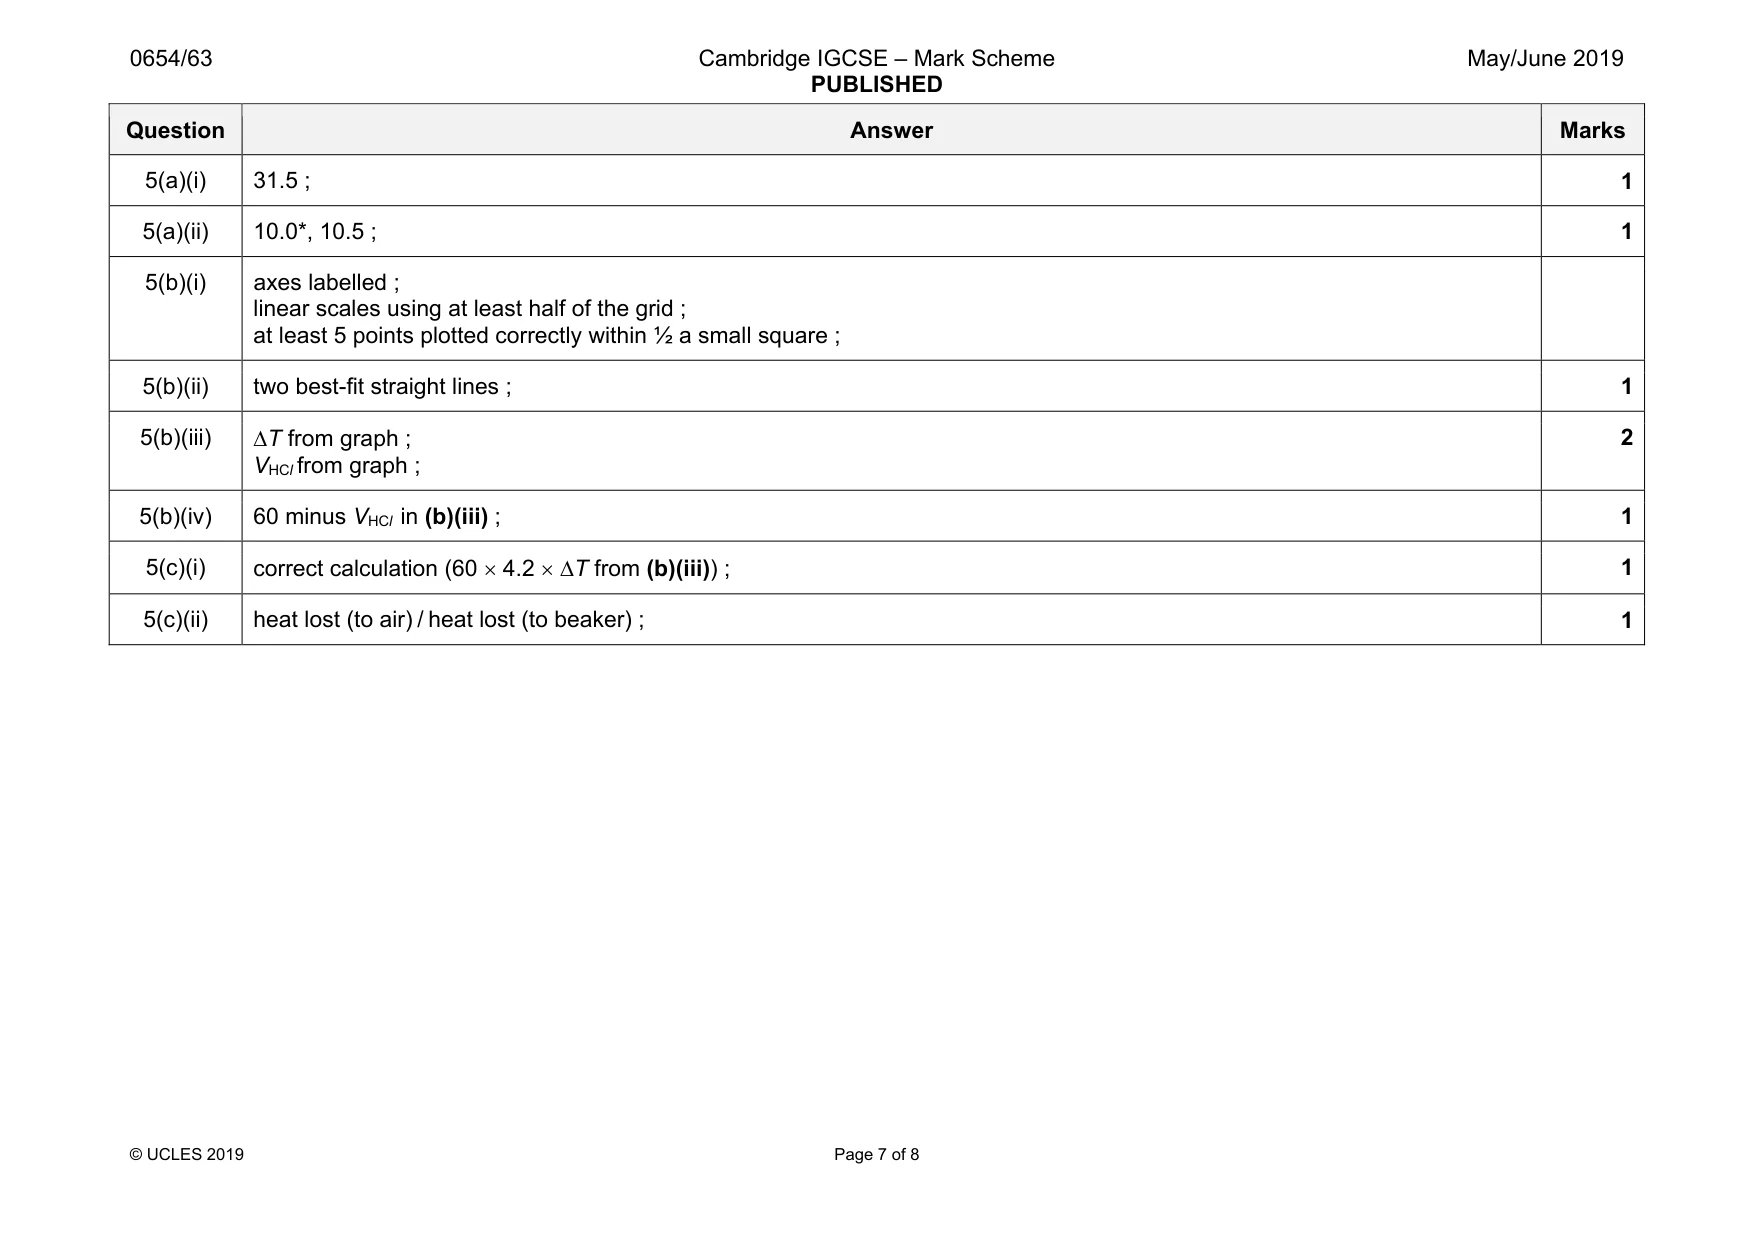
Mark scheme: 5(a)(i) 31.5 ; 1 5(a)(ii) 10.0*, 10.5 ; 1 5(b)(i) axes labelled ; linear scales using at least half of the grid ; at least 5 points plotted correctly within ½ a small square ; 5(b)(ii) two best-fit straight lines ; 1 5(b)(iii) ∆T from graph ; VHCl from graph ; 2 5(b)(iv) 60 minus VHCl in (b)(iii) ; 1 5(c)(i) correct calculation (60 × 4.2 × ∆T from (b)(iii)) ; 1 5(c)(ii) heat lost (to air) / heat lost (to beaker) ; 1
Q6 · A student investigates the thermal insulating properties of three different materials…
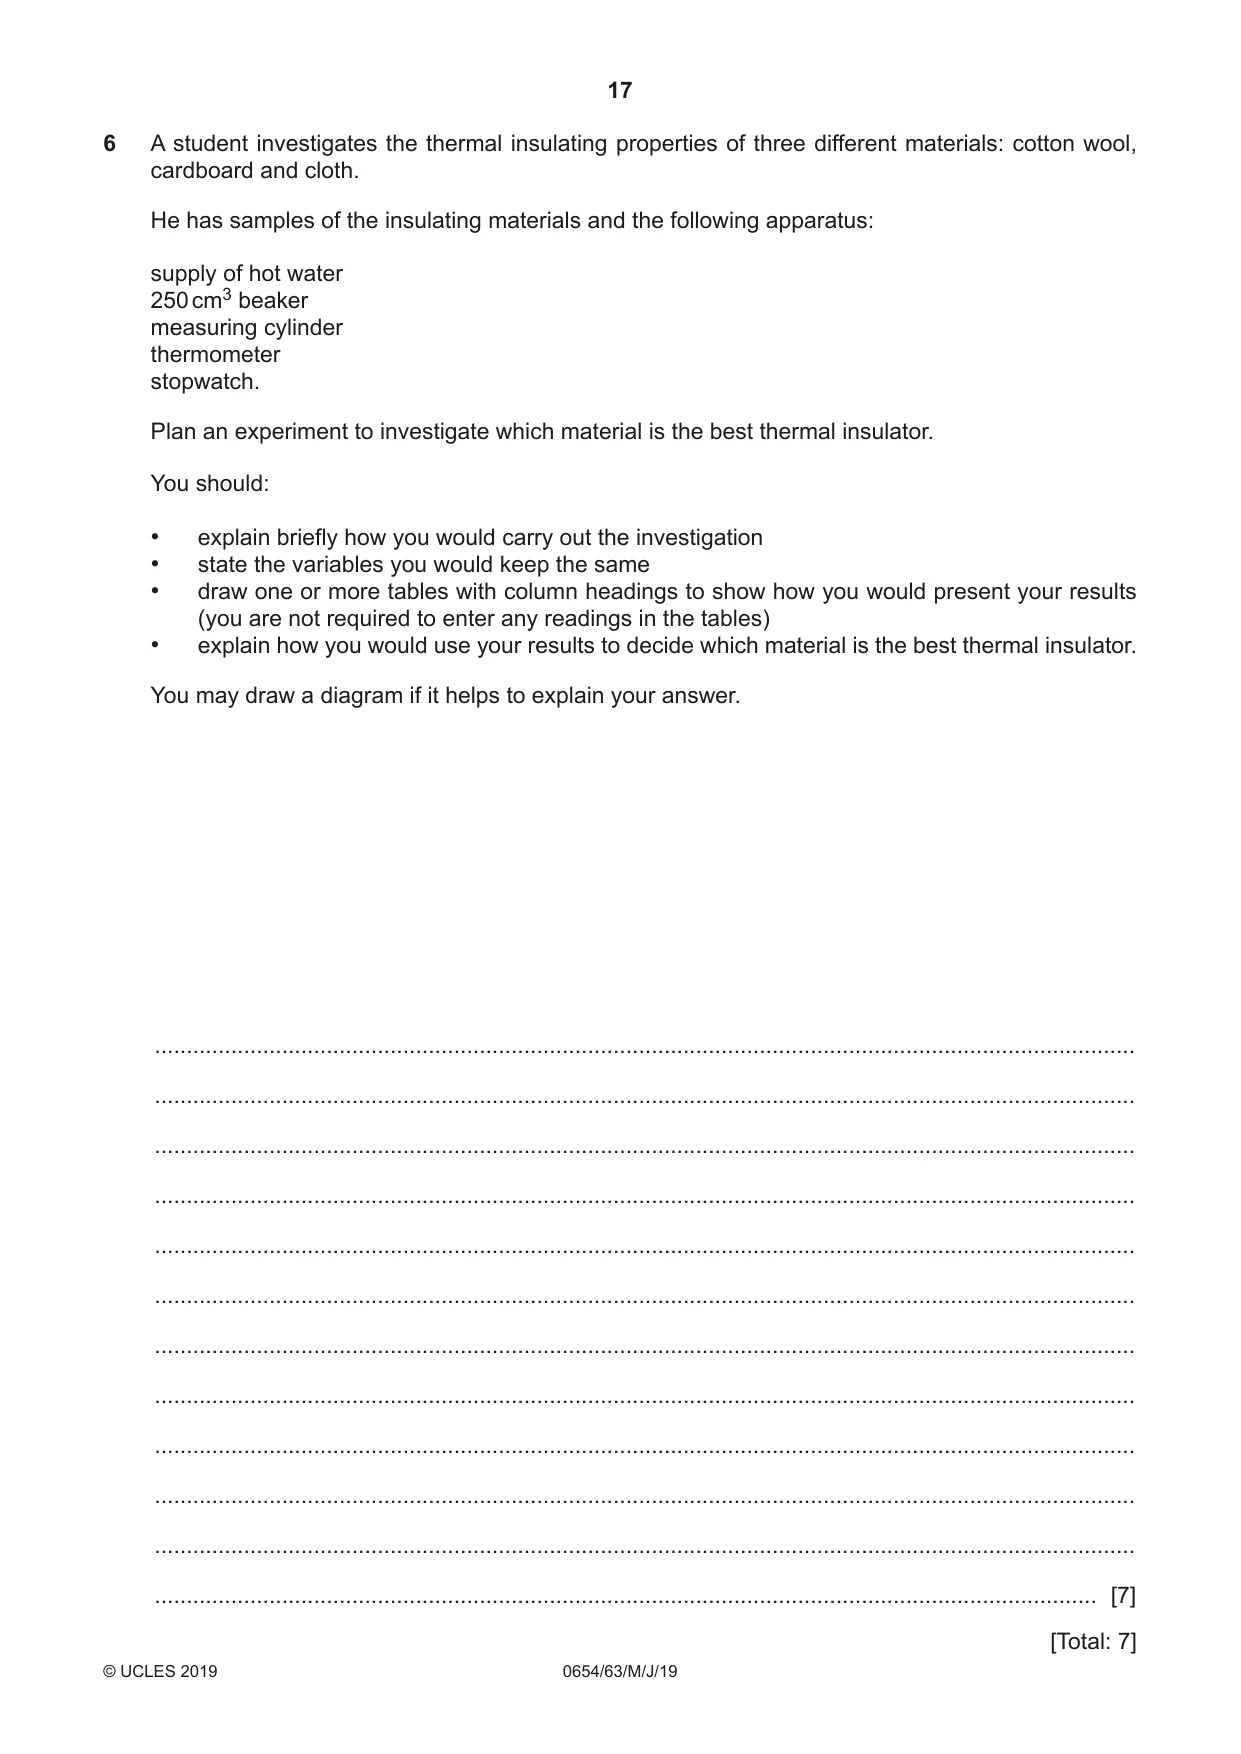
6 A student investigates the thermal insulating properties of three different materials: cotton wool, cardboard and cloth. He has samples of the insulating materials and the following apparatus: supply of hot water 250 cm3 beaker measuring cylinder thermometer stopwatch. Plan an experiment to investigate which material is the best thermal insulator. You should: • explain briefly how you would carry out the investigation • state the variables you would keep the same • draw one or more tables with column headings to show how you would present your results (you are not required to enter any readings in the tables) • explain how you would use your results to decide which material is the best thermal insulator. You may draw a diagram if it helps to explain your answer. .......................................................................................................................................................... .......................................................................................................................................................... .......................................................................................................................................................... .......................................................................................................................................................... .......................................................................................................................................................... .......................................................................................................................................................... .......................................................................................................................................................... .......................................................................................................................................................... .......................................................................................................................................................... .......................................................................................................................................................... .......................................................................................................................................................... .................................................................................................................................................... [7]
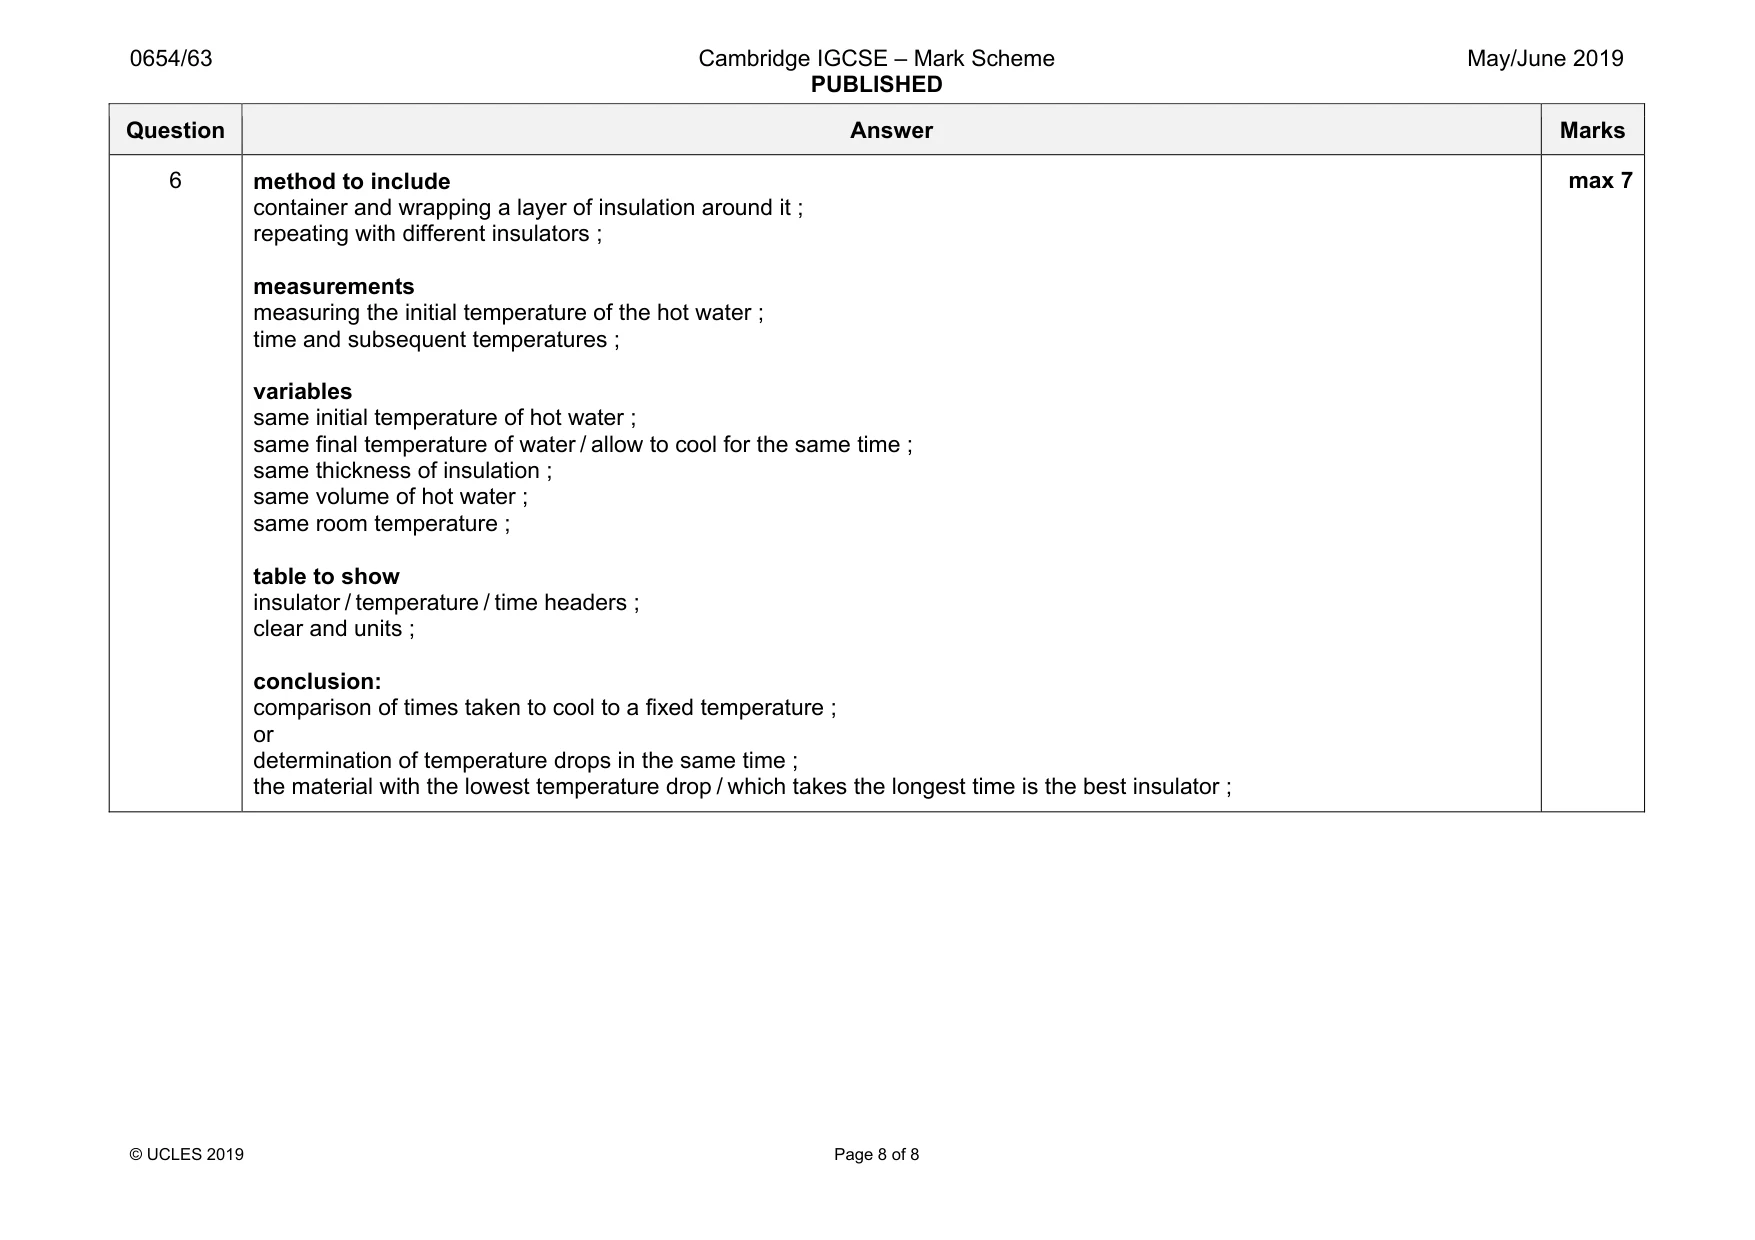
Mark scheme: 6 method to include container and wrapping a layer of insulation around it ; repeating with different insulators ; measurements measuring the initial temperature of the hot water ; time and subsequent temperatures ; variables same initial temperature of hot water ; same final temperature of water / allow to cool for the same time ; same thickness of insulation ; same volume of hot water ; same room temperature ; table to show insulator / temperature / time headers ; clear and units ; conclusion: comparison of times taken to cool to a fixed temperature ; or determination of temperature drops in the same time ; the material with the lowest temperature drop / which takes the longest time is the best insulator ; max 7
What was in this paper
The subtopics covered by these 6 questions, and how many questions each got. Open one in a new tab to see every Cambridge question on it.
What you needed in this session
Cambridge’s own grade thresholds for 2019 May/June, Paper 6 · Variant 3. A higher threshold means an easier paper — the bar moves with how the cohort did.