Cambridge IGCSE Sciences - Co-ordinated (Double) 0654 — 2019 May/June Paper 6 · Variant 1
0654/61/M/J/19 · 6 questions · 60 marks · ≈68 min
The question paper and its mark scheme, free to read here and free to download. This is Cambridge’s own paper, exactly as it was sat.
Question paper20 pages




Mark scheme9 pages
Answers below. Sit the paper first if you are practising.
Questions as text
Q1 · A student investigates the loss of body heat from an adult animal and from a baby animal…
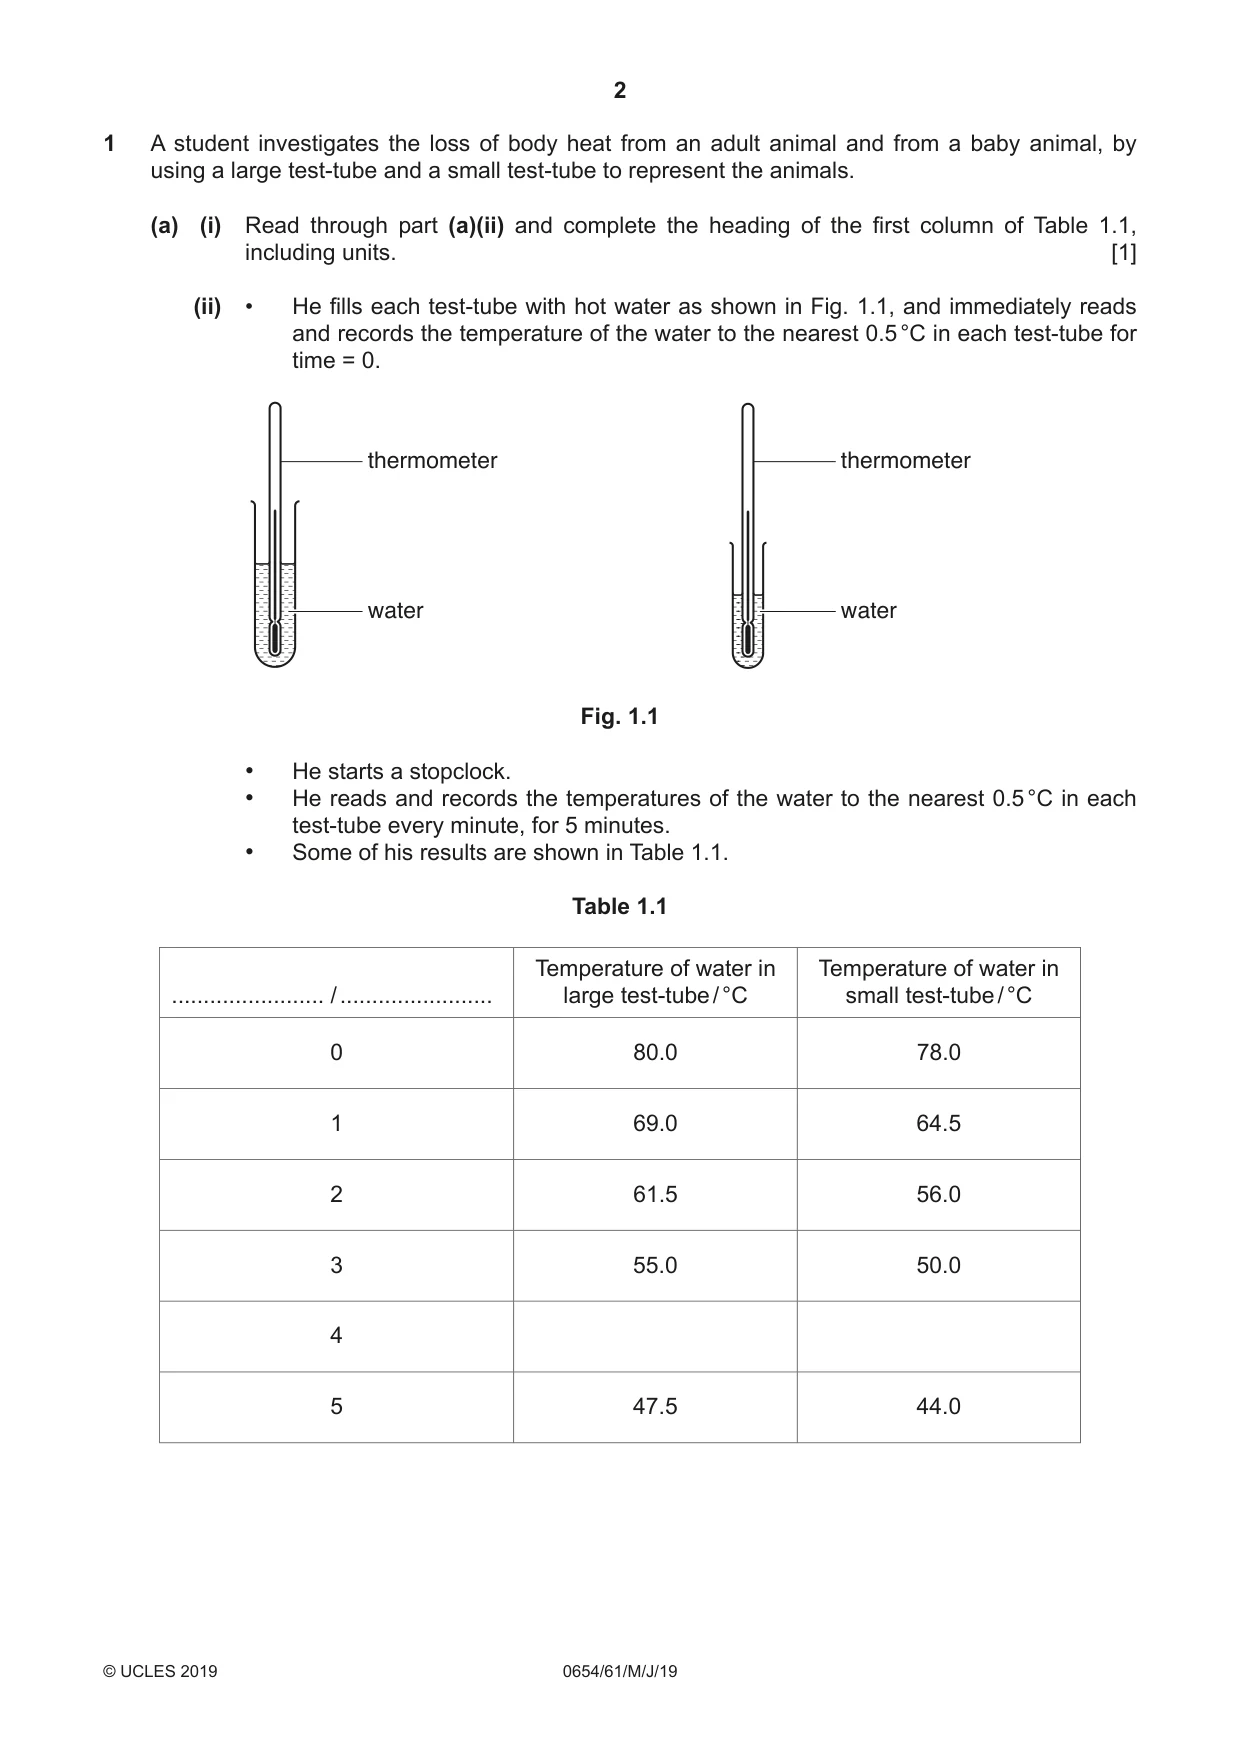
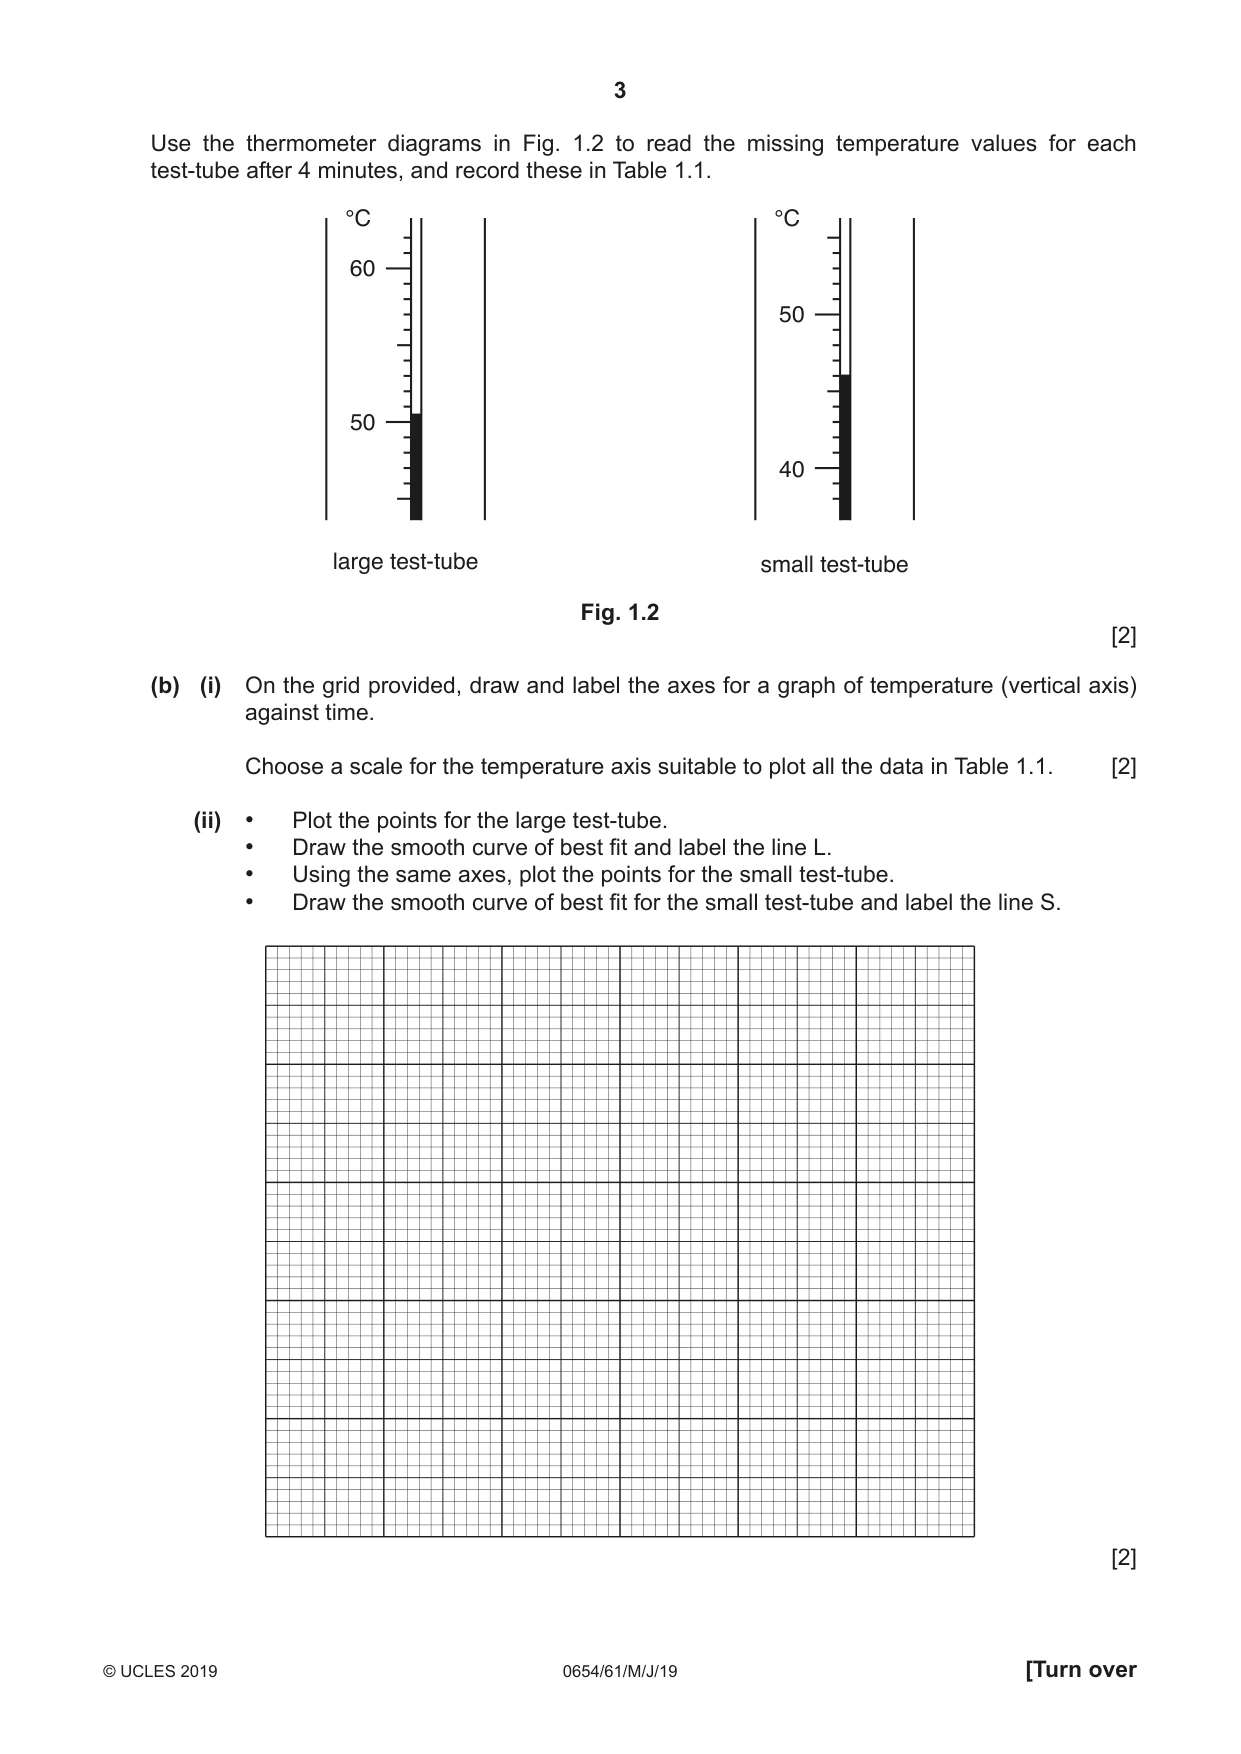
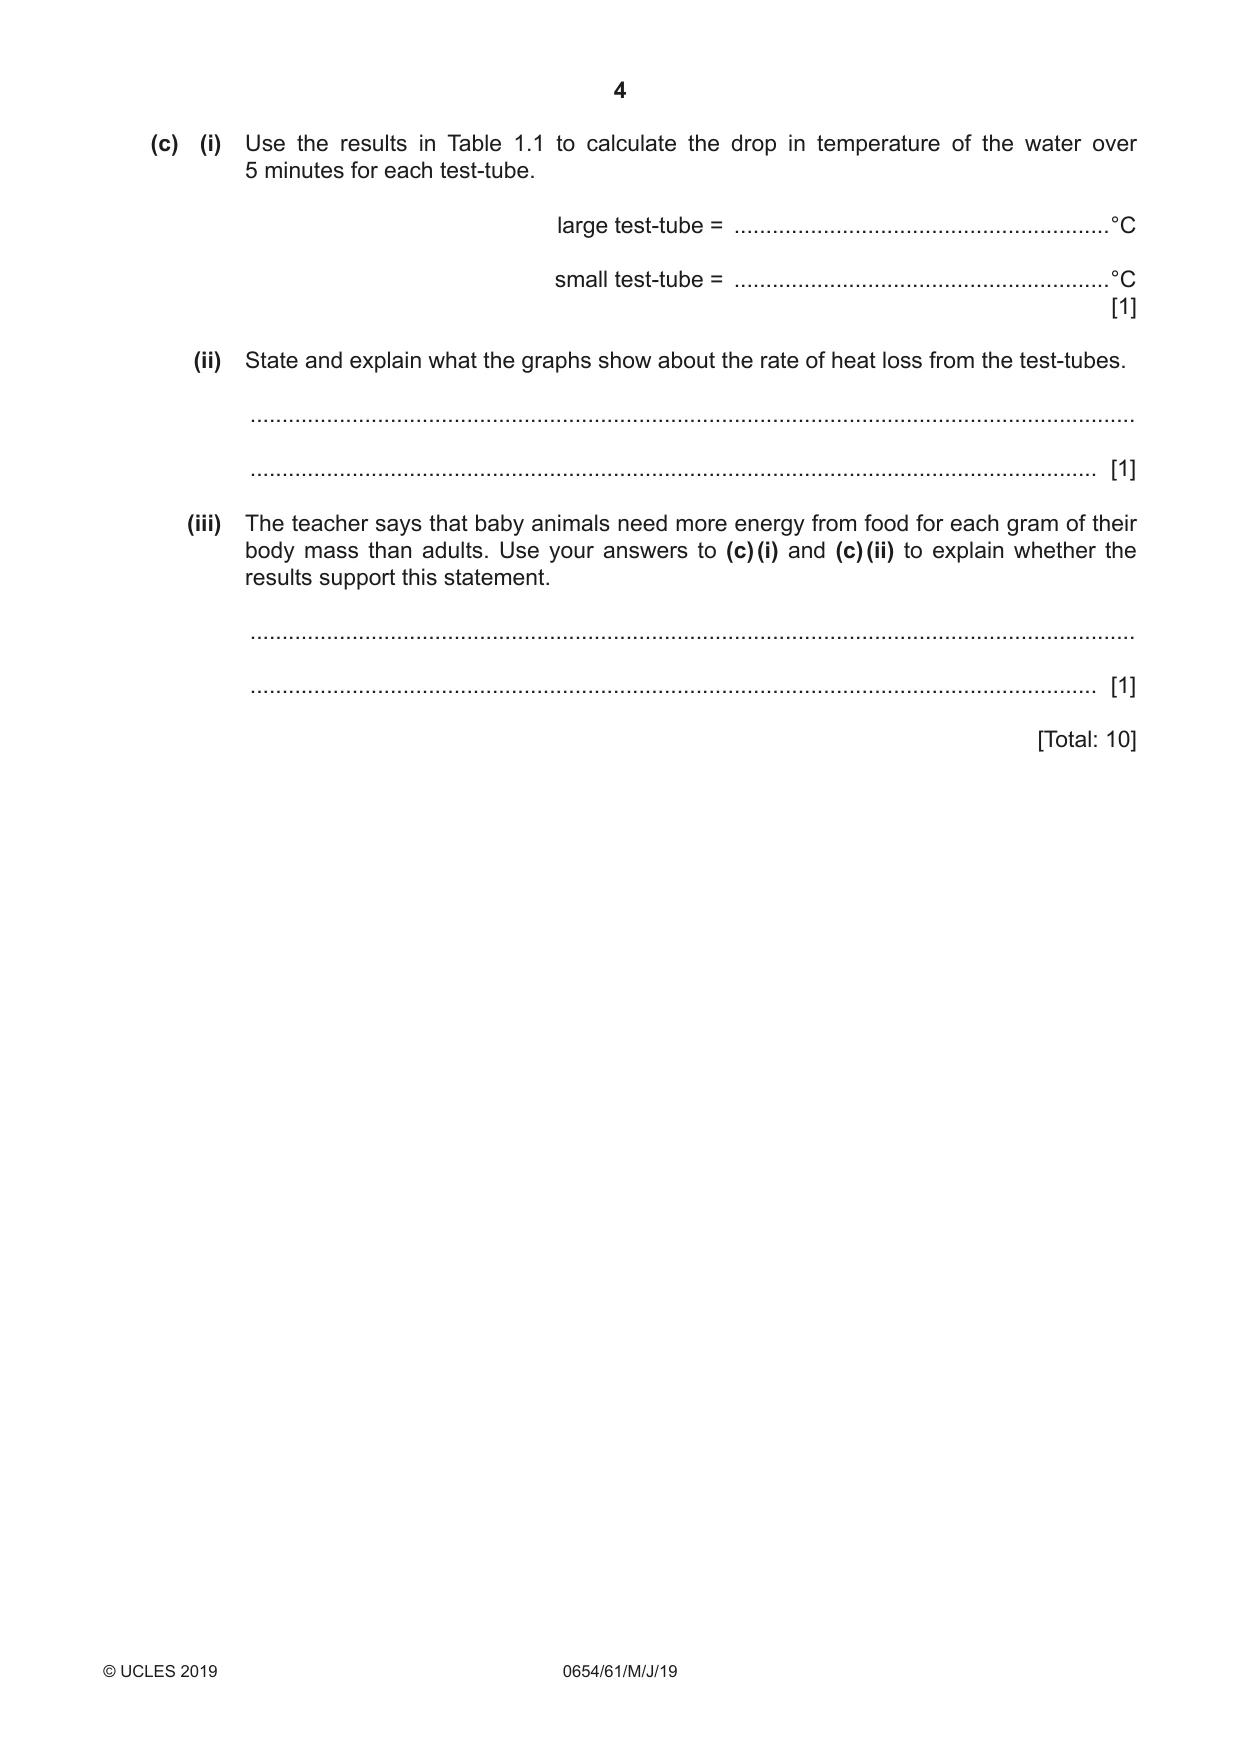
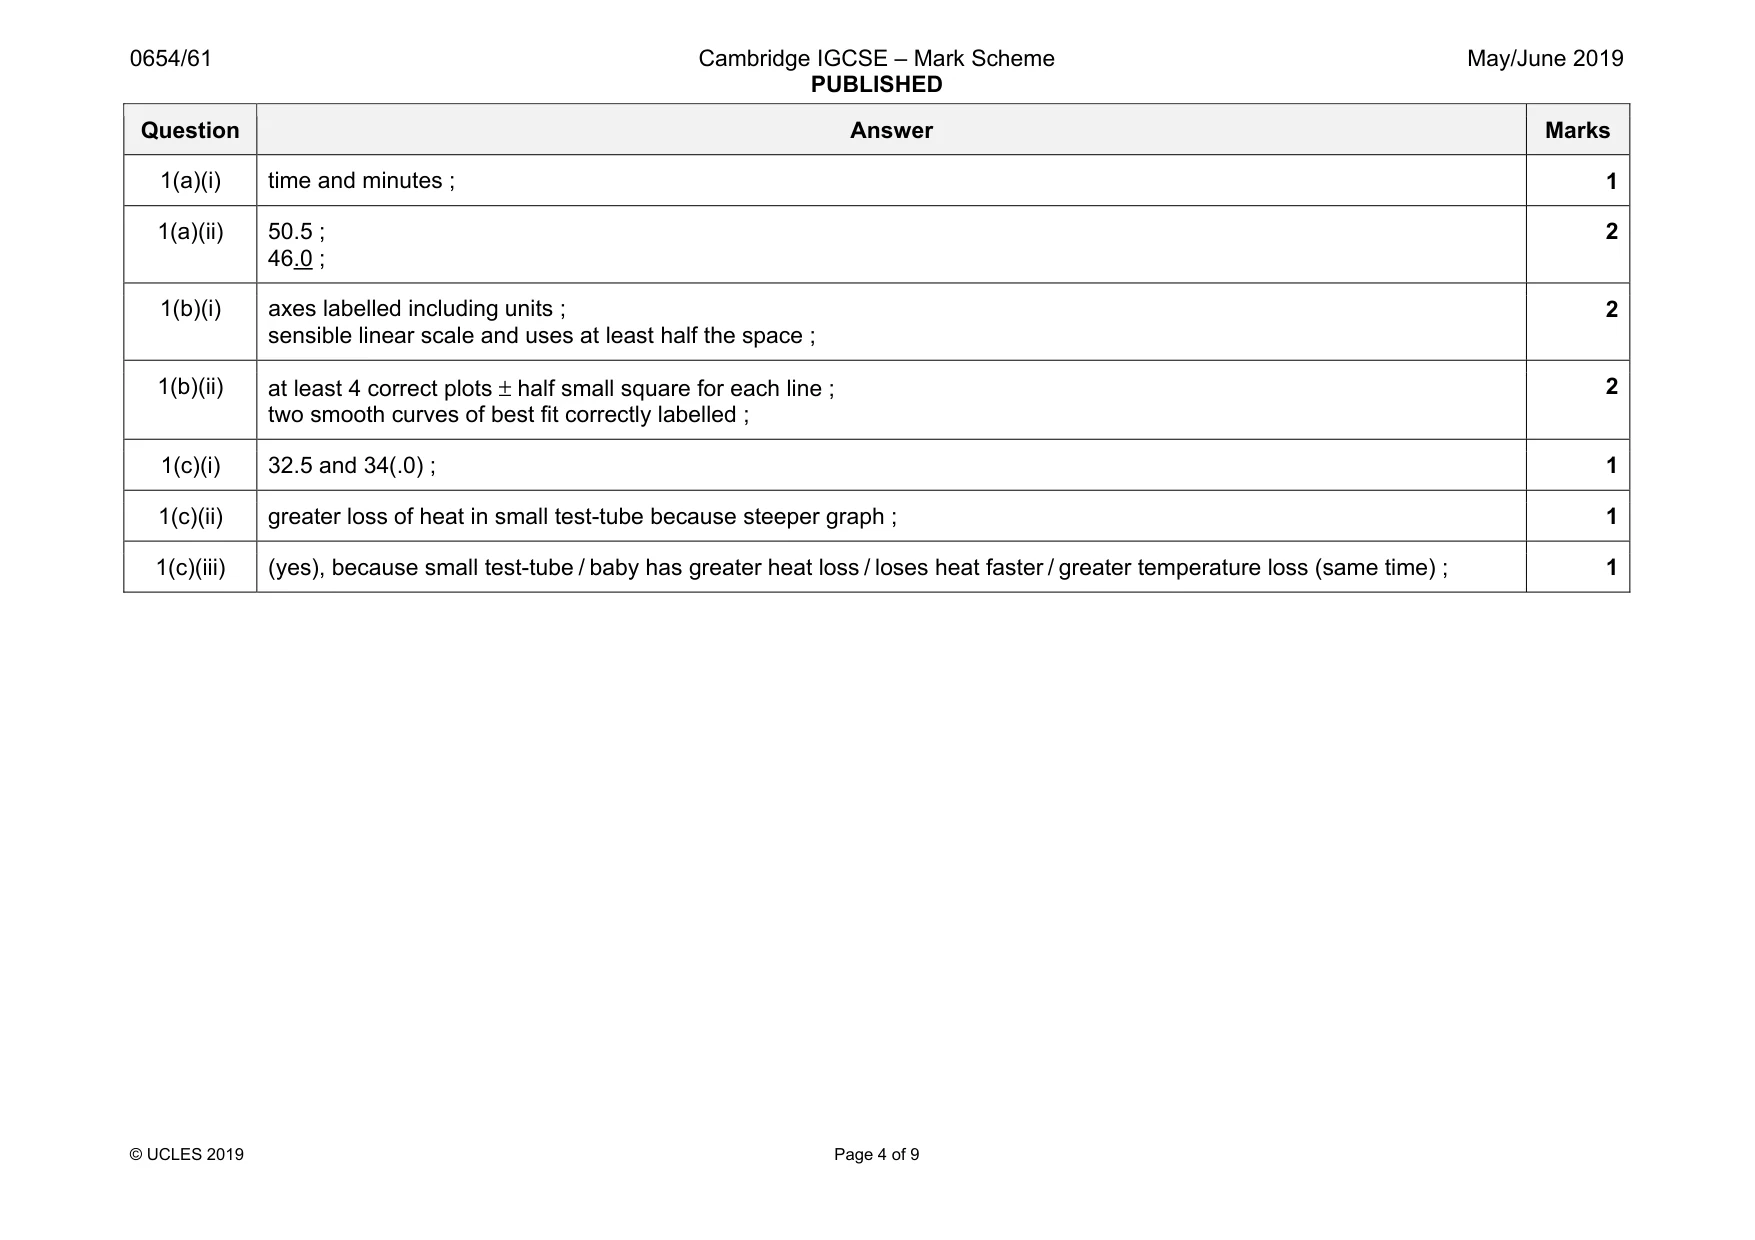
1 A student investigates the loss of body heat from an adult animal and from a baby animal, by using a large test-tube and a small test-tube to represent the animals. (a) (i) Read through part (a)(ii) and complete the heading of the first column of Table 1.1, including units. [1] (ii) • He fills each test-tube with hot water as shown in Fig. 1.1, and immediately reads and records the temperature of the water to the nearest 0.5 °C in each test-tube for time = 0. thermometer thermometer water water Fig. 1.1 • He starts a stopclock. • He reads and records the temperatures of the water to the nearest 0.5 °C in each test-tube every minute, for 5 minutes. • Some of his results are shown in Table 1.1. Table 1.1 Temperature of water in Temperature of water in ........................ / ........................ large test-tube / °C small test-tube / °C 0 80.0 78.0 1 69.0 64.5 2 61.5 56.0 3 55.0 50.0 4 5 47.5 44.0 Use the thermometer diagrams in Fig. 1.2 to read the missing temperature values for each test-tube after 4 minutes, and record these in Table 1.1. °C °C 60 50 50 40 large test-tube small test-tube Fig. 1.2 [2] (b) (i) On the grid provided, draw and label the axes for a graph of temperature (vertical axis) against time. Choose a scale for the temperature axis suitable to plot all the data in Table 1.1. [2] (ii) • Plot the points for the large test-tube. • Draw the smooth curve of best fit and label the line L. • Using the same axes, plot the points for the small test-tube. • Draw the smooth curve of best fit for the small test-tube and label the line S. [2] (c) (i) Use the results in Table 1.1 to calculate the drop in temperature of the water over 5 minutes for each test-tube. large test-tube = ...........................................................°C small test-tube = ...........................................................°C [1] (ii) State and explain what the graphs show about the rate of heat loss from the test-tubes. ........................................................................................................................................... ..................................................................................................................................... [1] (iii) The teacher says that baby animals need more energy from food for each gram of their body mass than adults. Use your answers to (c) (i) and (c) (ii) to explain whether the results support this statement. ........................................................................................................................................... ..................................................................................................................................... [1] [Total: 10]
Mark scheme: 1(a)(i) time and minutes ; 1 1(a)(ii) 50.5 ; 46.0 ; 2 1(b)(i) axes labelled including units ; sensible linear scale and uses at least half the space ; 2 1(b)(ii) at least 4 correct plots ± half small square for each line ; two smooth curves of best fit correctly labelled ; 2 1(c)(i) 32.5 and 34(.0) ; 1 1(c)(ii) greater loss of heat in small test-tube because steeper graph ; 1 1(c)(iii) (yes), because small test-tube / baby has greater heat loss / loses heat faster / greater temperature loss (same time) ; 1
More questions on Physical quantities and measurement techniques
Q2 · When acids react with alkalis, heat is given out
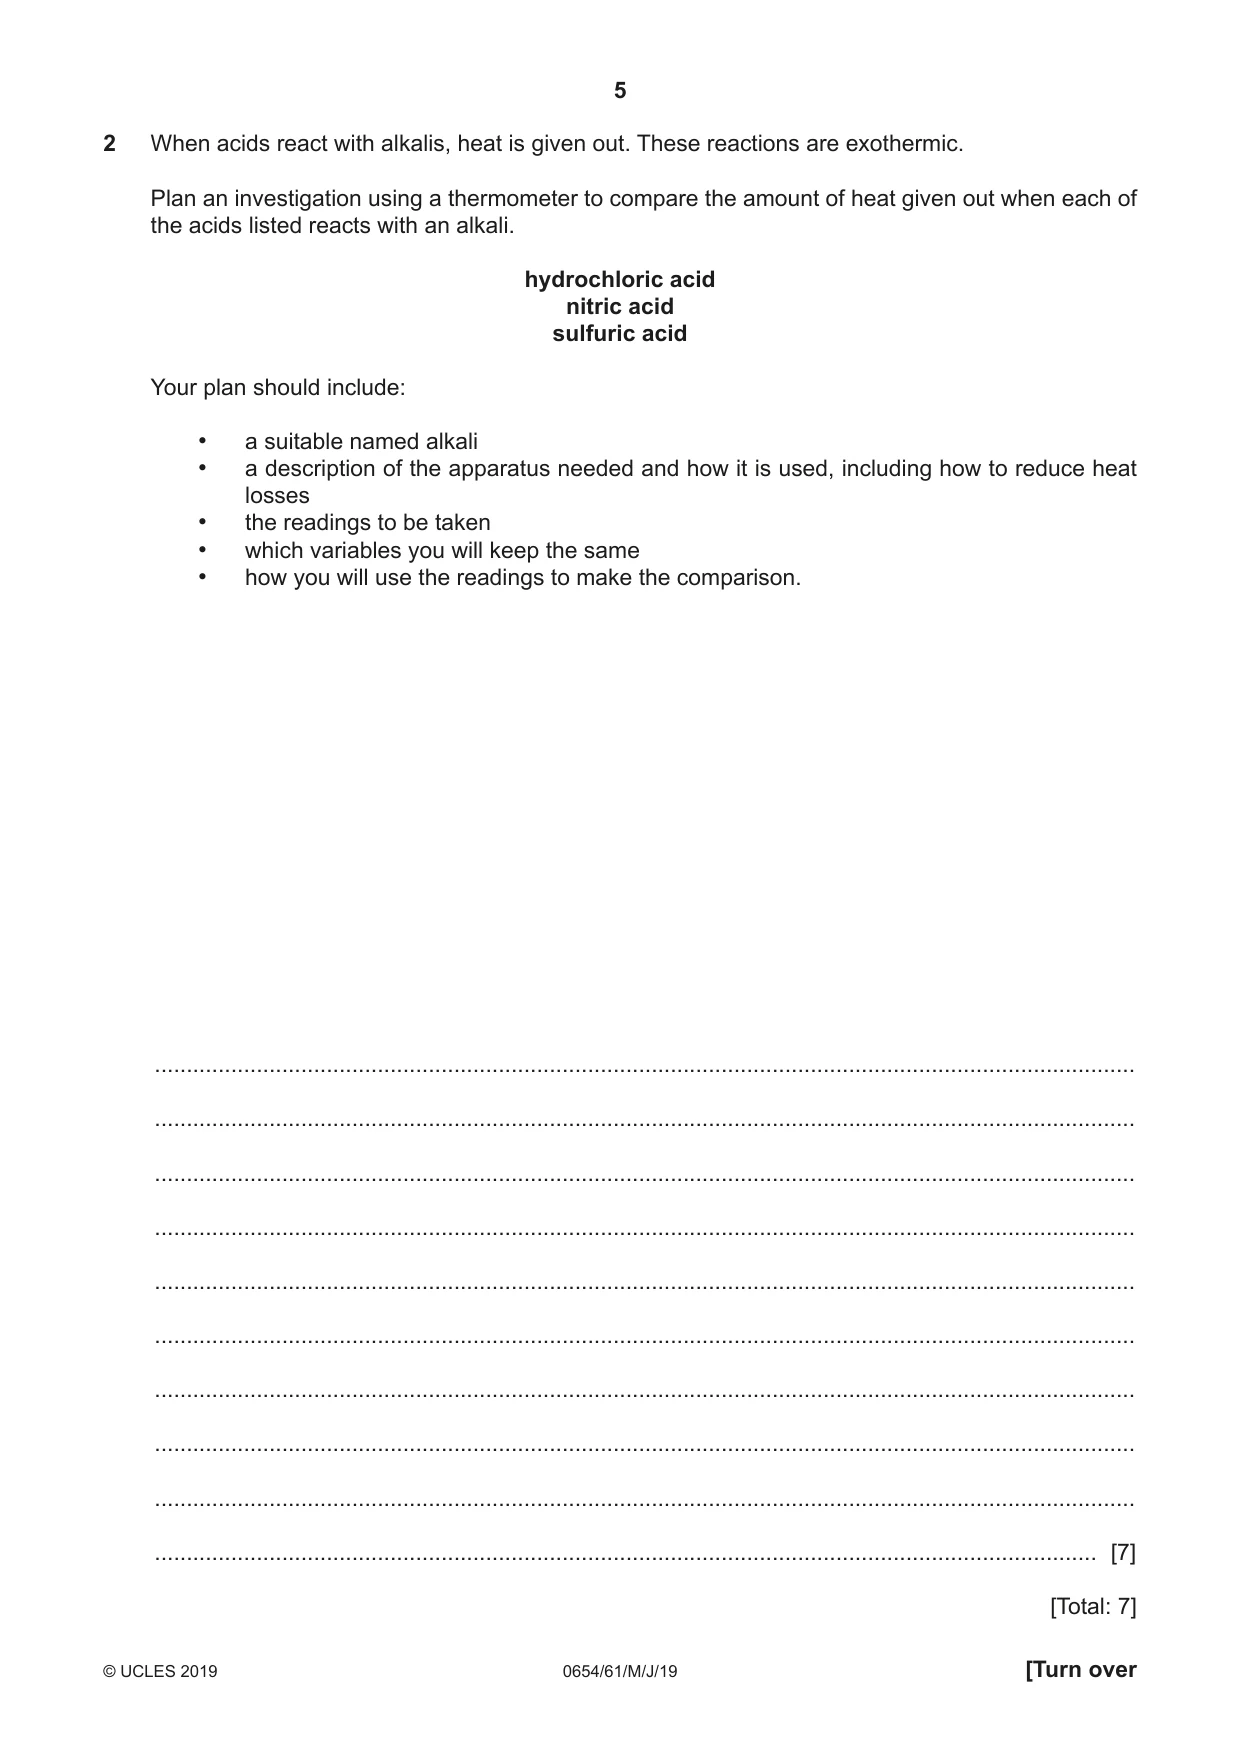
2 When acids react with alkalis, heat is given out. These reactions are exothermic. Plan an investigation using a thermometer to compare the amount of heat given out when each of the acids listed reacts with an alkali. hydrochloric acid nitric acid sulfuric acid Your plan should include: • a suitable named alkali • a description of the apparatus needed and how it is used, including how to reduce heat losses • the readings to be taken • which variables you will keep the same • how you will use the readings to make the comparison. .......................................................................................................................................................... .......................................................................................................................................................... .......................................................................................................................................................... .......................................................................................................................................................... .......................................................................................................................................................... .......................................................................................................................................................... .......................................................................................................................................................... .......................................................................................................................................................... .......................................................................................................................................................... .................................................................................................................................................... [7] [Total: 7]
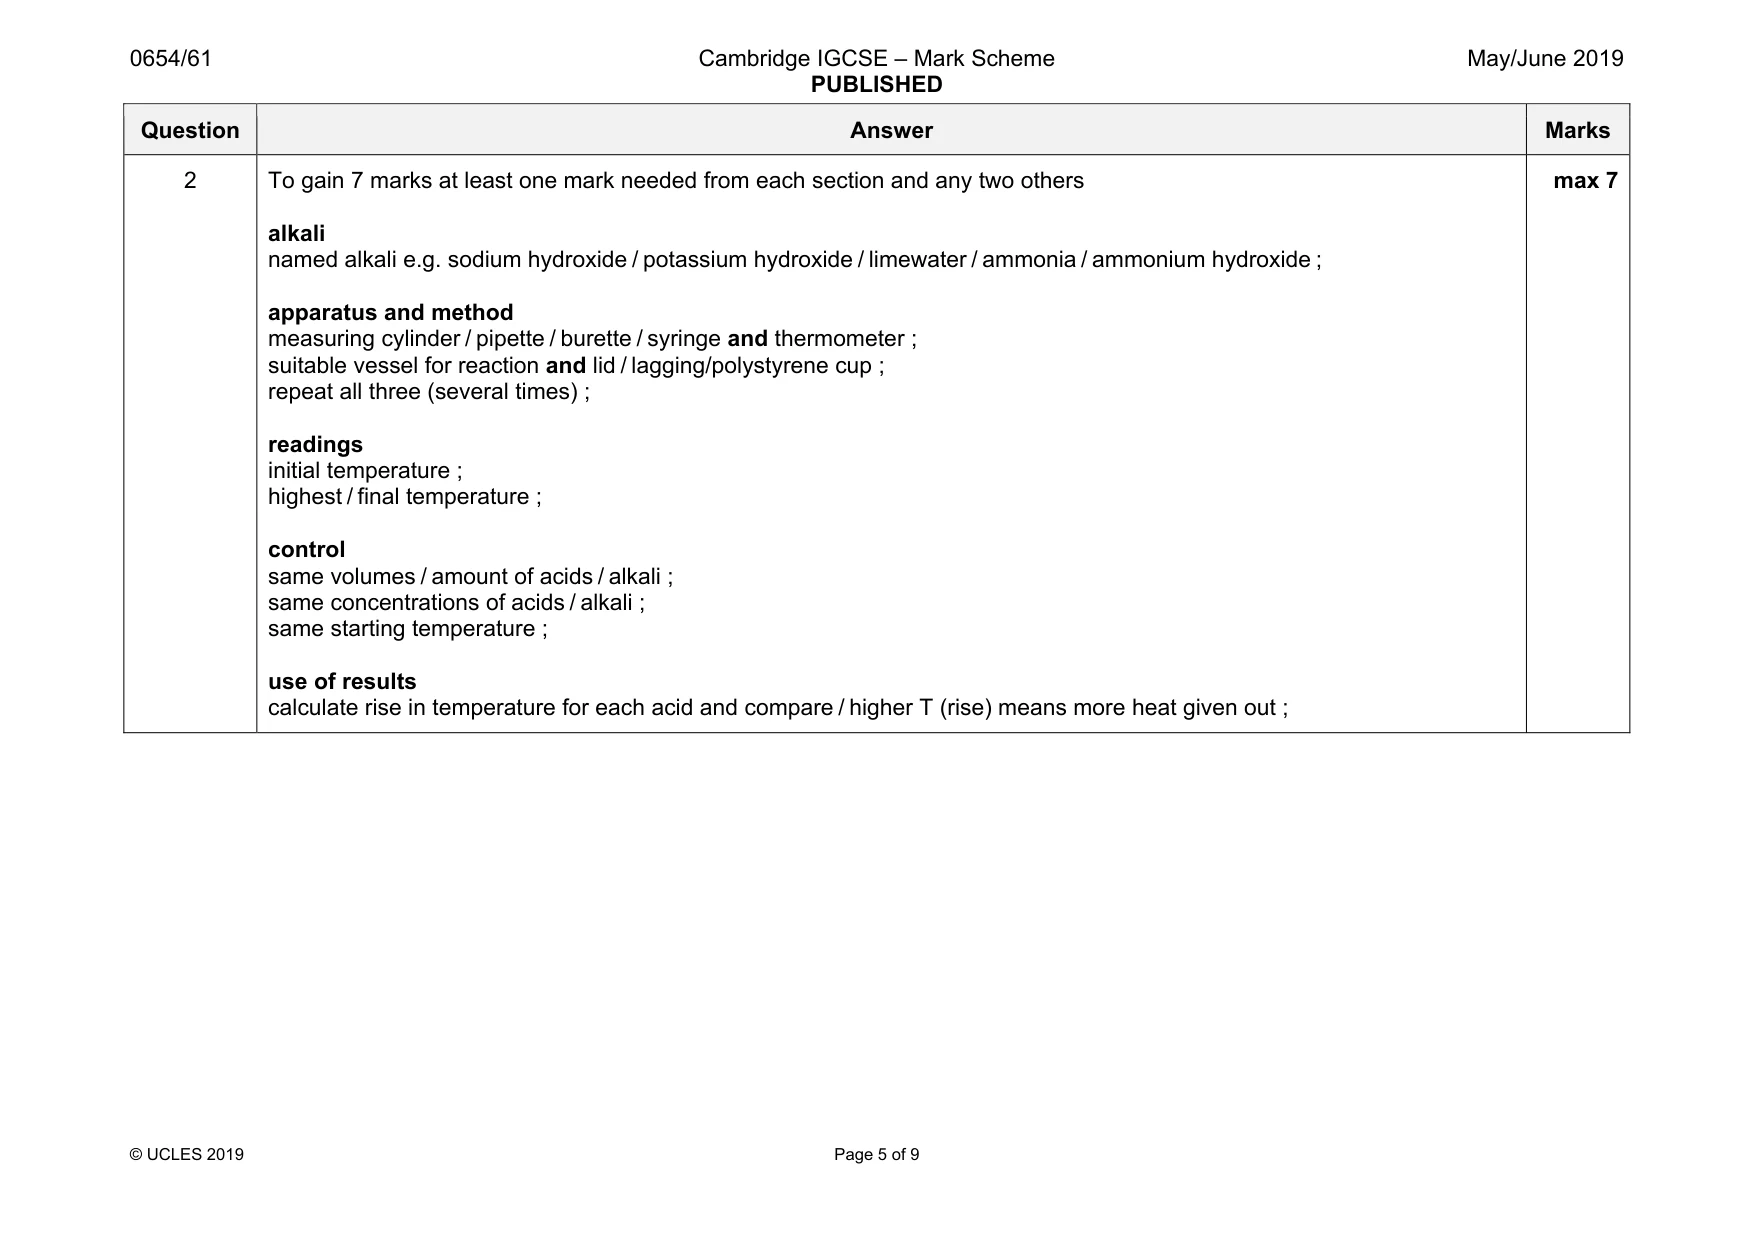
Mark scheme: 2 To gain 7 marks at least one mark needed from each section and any two others alkali named alkali e.g. sodium hydroxide / potassium hydroxide / limewater / ammonia / ammonium hydroxide ; apparatus and method measuring cylinder / pipette / burette / syringe and thermometer ; suitable vessel for reaction and lid / lagging/polystyrene cup ; repeat all three (several times) ; readings initial temperature ; highest / final temperature ; control same volumes / amount of acids / alkali ; same concentrations of acids / alkali ; same starting temperature ; use of results calculate rise in temperature for each acid and compare / higher T (rise) means more heat given out ; max 7
Q3 · A student uses a pendulum to measure the acceleration of free fall g
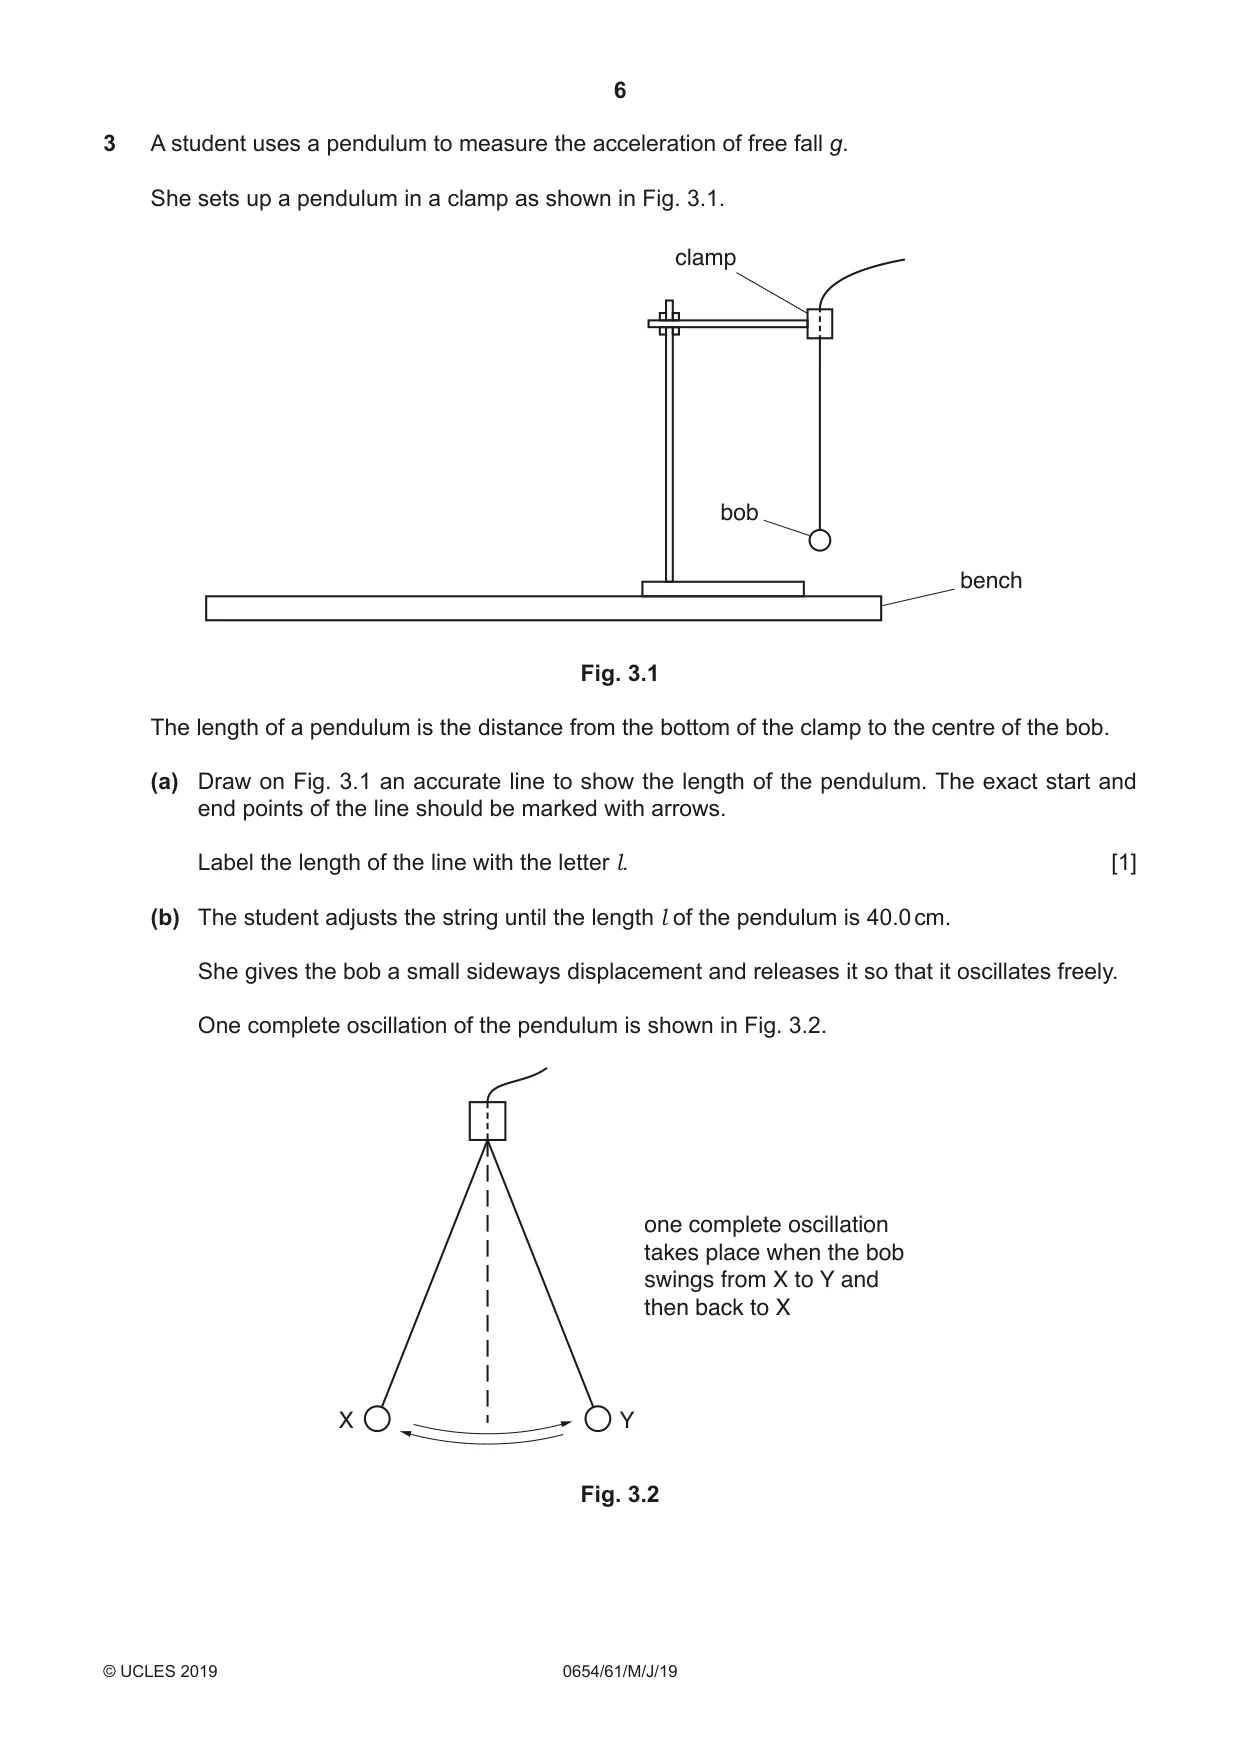
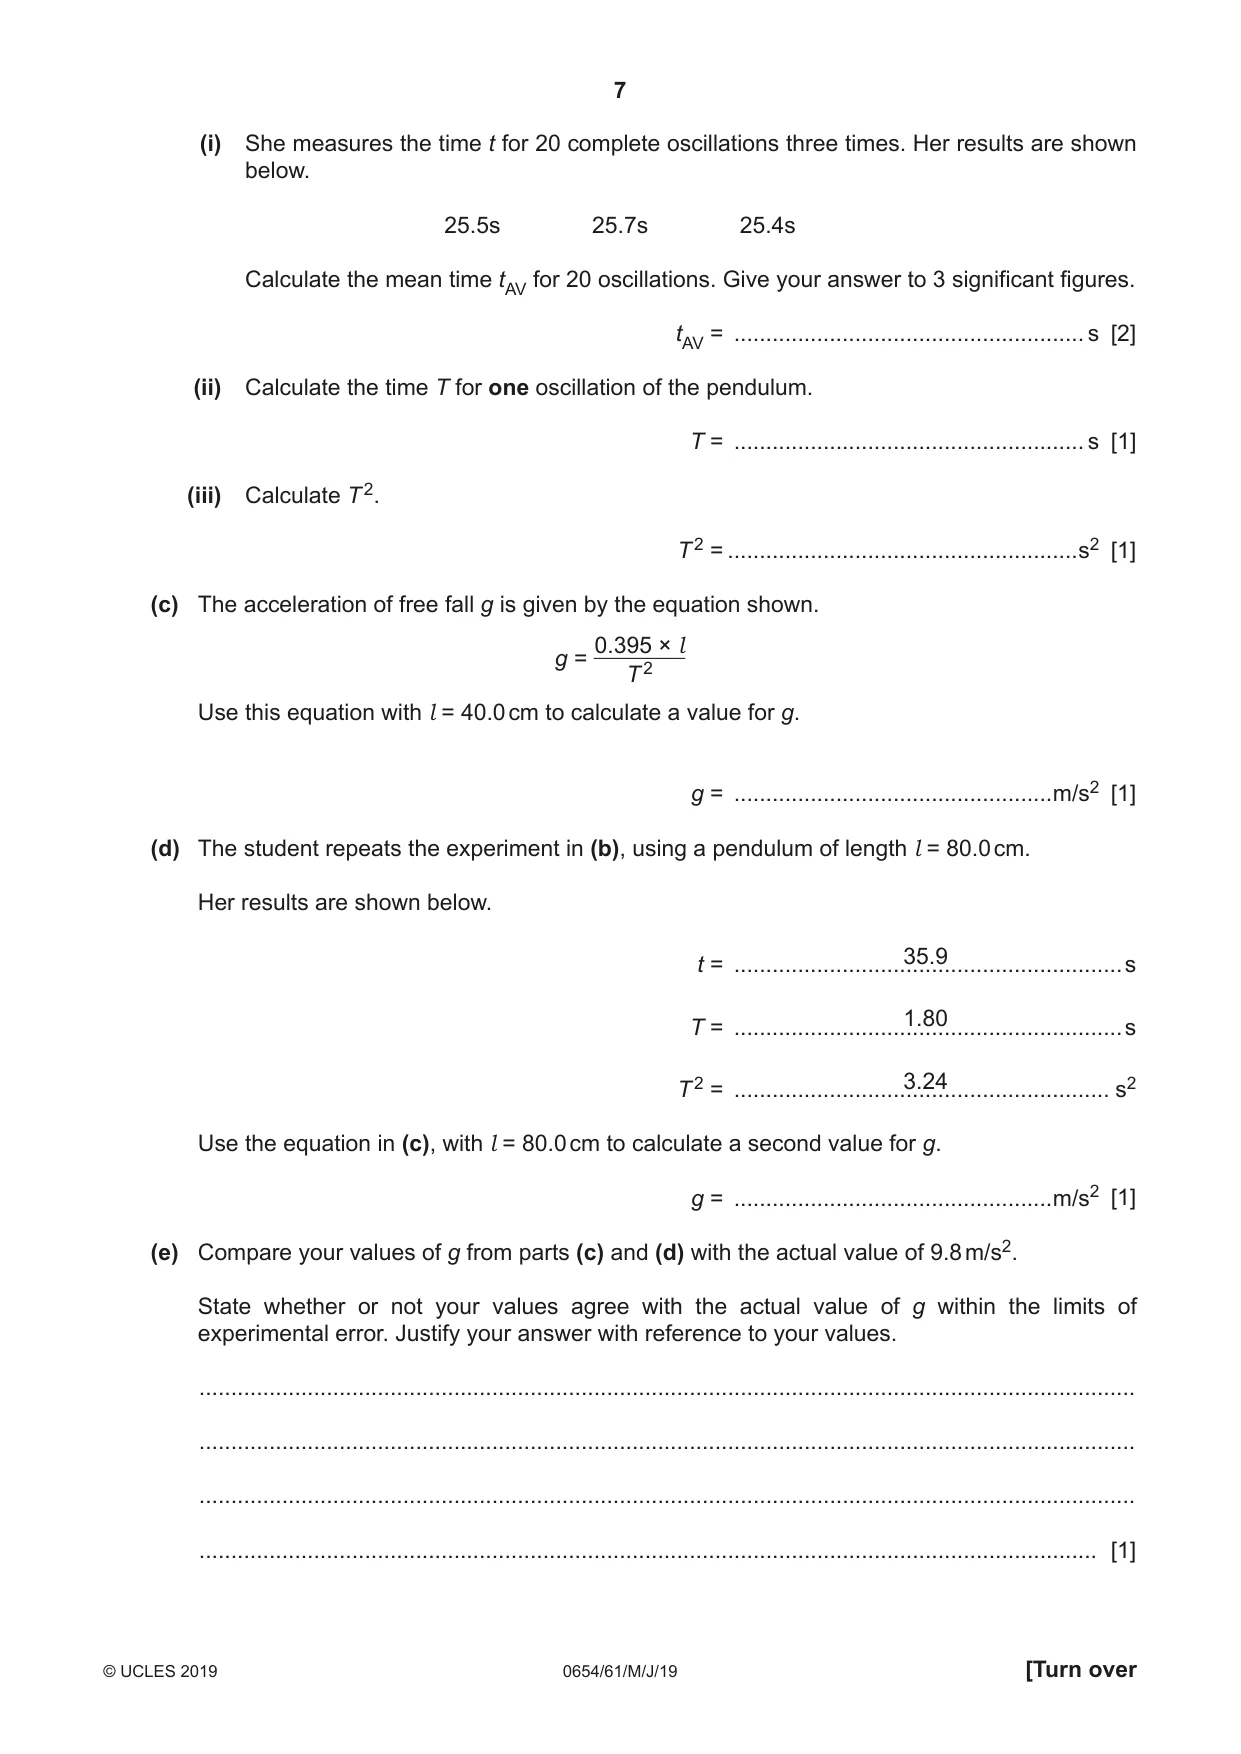
3 A student uses a pendulum to measure the acceleration of free fall g. She sets up a pendulum in a clamp as shown in Fig. 3.1. clamp bob bench Fig. 3.1 The length of a pendulum is the distance from the bottom of the clamp to the centre of the bob. (a) Draw on Fig. 3.1 an accurate line to show the length of the pendulum. The exact start and end points of the line should be marked with arrows. Label the length of the line with the letter l. [1] (b) The student adjusts the string until the length l of the pendulum is 40.0 cm. She gives the bob a small sideways displacement and releases it so that it oscillates freely. One complete oscillation of the pendulum is shown in Fig. 3.2. one complete oscillation takes place when the bob swings from X to Y and then back to X X Y Fig. 3.2 (i) She measures the time t for 20 complete oscillations three times. Her results are shown below. 25.5s 25.7s 25.4s Calculate the mean time tAV for 20 oscillations. Give your answer to 3 significant figures. tAV = ....................................................... s [2] (ii) Calculate the time T for one oscillation of the pendulum. T = ....................................................... s [1] (iii) Calculate T 2. T 2 = .......................................................s2 [1] (c) The acceleration of free fall g is given by the equation shown. 0.395 × l g = 2 T Use this equation with l = 40.0 cm to calculate a value for g. g = ..................................................m/s2 [1] (d) The student repeats the experiment in (b), using a pendulum of length l = 80.0 cm. Her results are shown below. 35.9 t = .............................................................s 1.80 T = .............................................................s 2 3.24 T = ........................................................... s2 Use the equation in (c), with l = 80.0 cm to calculate a second value for g. g = ..................................................m/s2 [1] (e) Compare your values of g from parts (c) and (d) with the actual value of 9.8 m/s2. State whether or not your values agree with the actual value of g within the limits of experimental error. Justify your answer with reference to your values. ................................................................................................................................................... ................................................................................................................................................... ................................................................................................................................................... ............................................................................................................................................. [1] (f) Suggest why it is better experimental practice to use longer lengths of pendulum when performing this experiment. ................................................................................................................................................... ............................................................................................................................................. [1] [Total: 9]
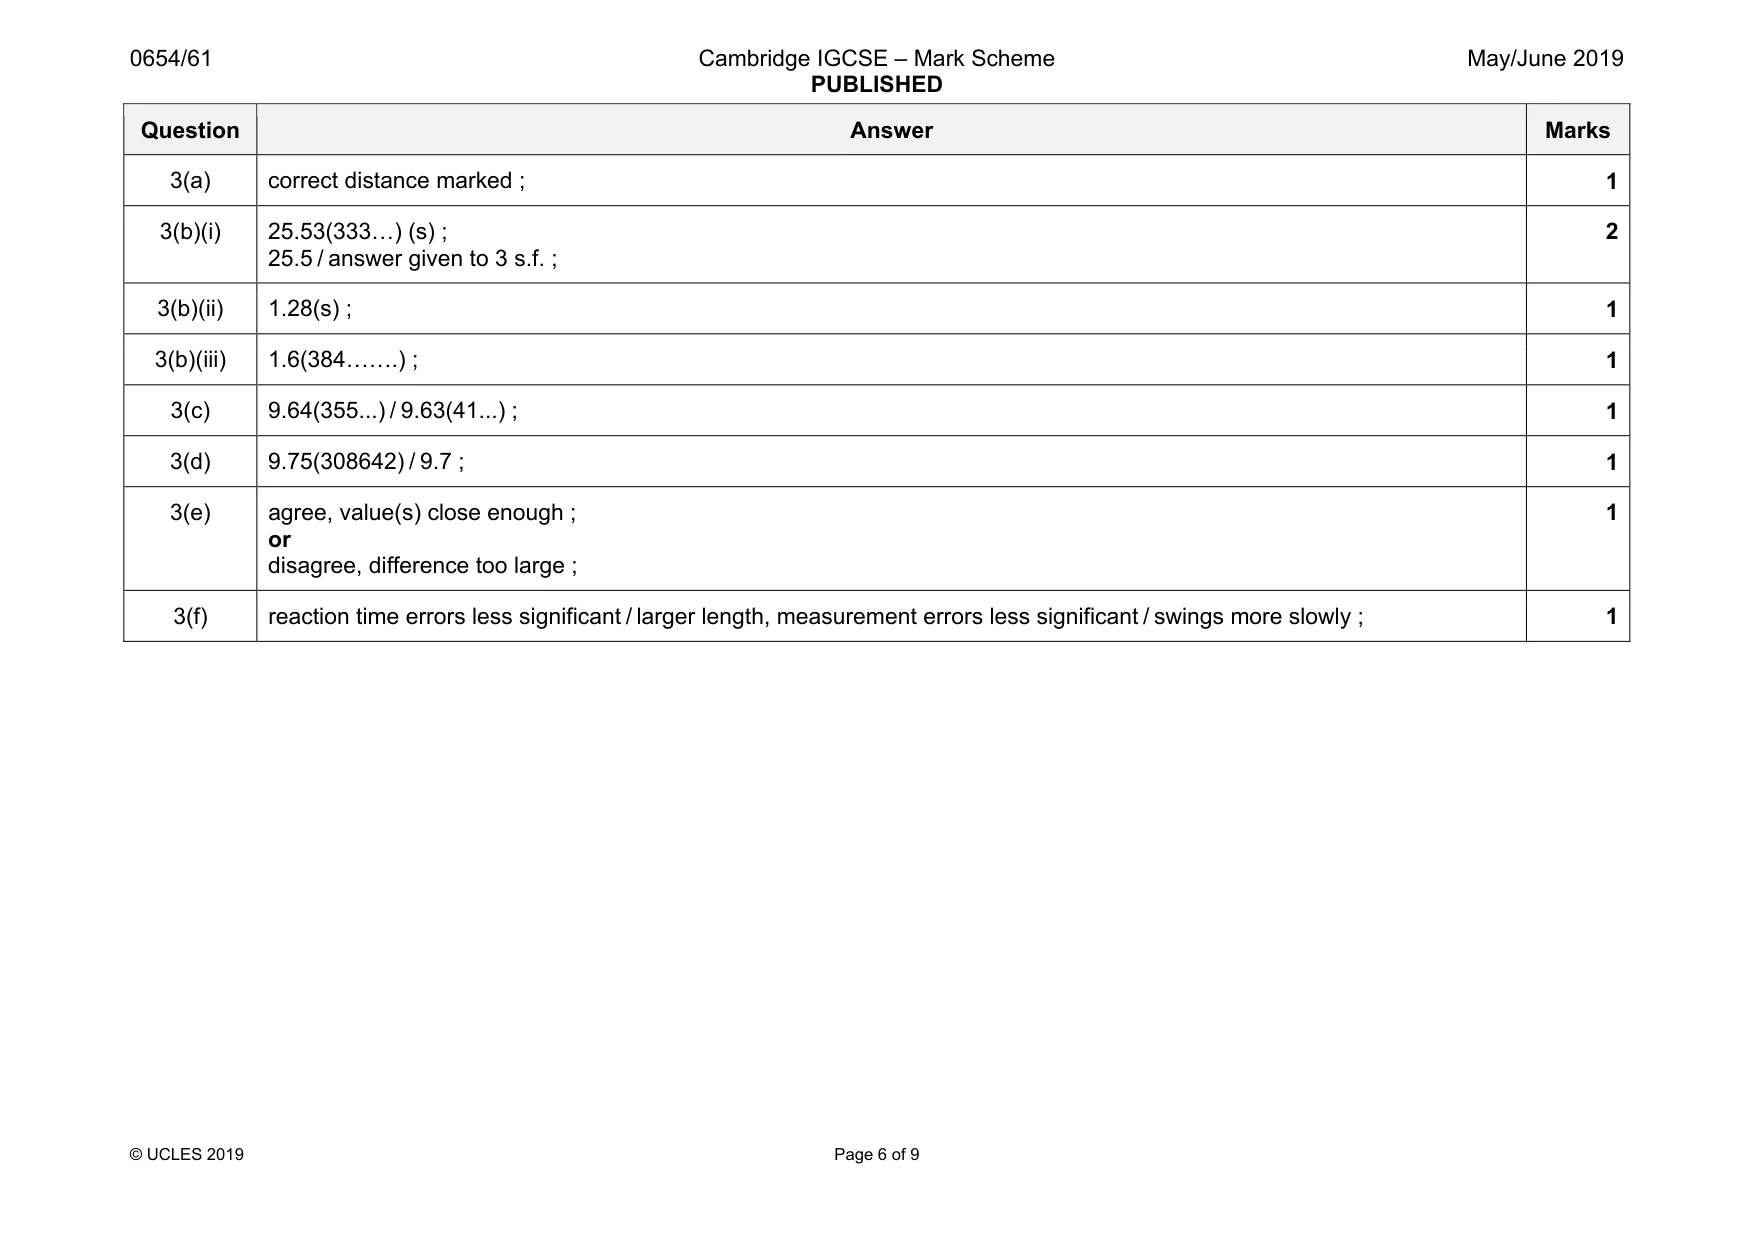
Mark scheme: 3(a) correct distance marked ; 1 3(b)(i) 25.53(333«) (s) ; 25.5 / answer given to 3 s.f. ; 2 3(b)(ii) 1.28(s) ; 1 3(b)(iii) 1.6(384««.) ; 1 3(c) 9.64(355...) / 9.63(41...) ; 1 3(d) 9.75(308642) / 9.7 ; 1 3(e) agree, value(s) close enough ; or disagree, difference too large ; 1 3(f) reaction time errors less significant / larger length, measurement errors less significant / swings more slowly ; 1
More questions on Physical quantities and measurement techniques
Q4 · An apricot fruit that has been cut in half and the stone removed
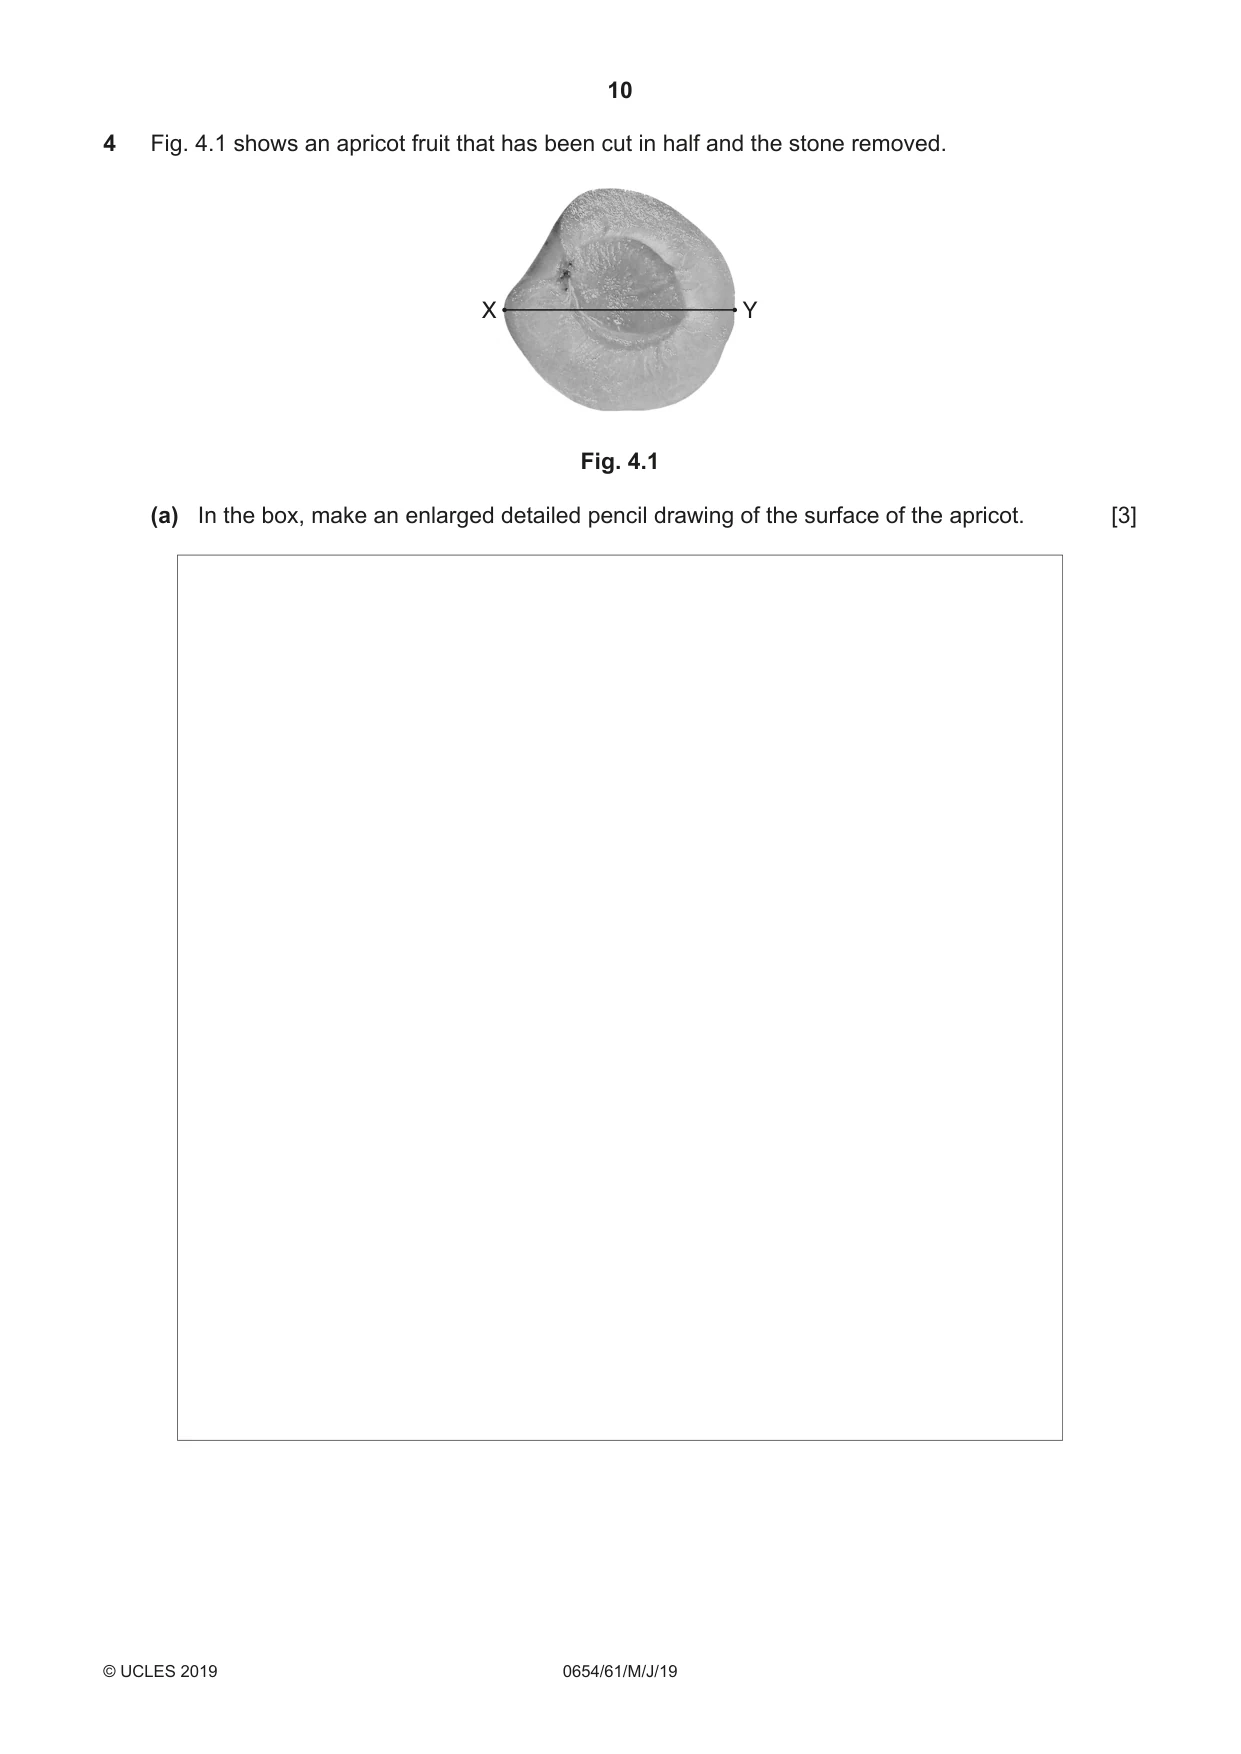
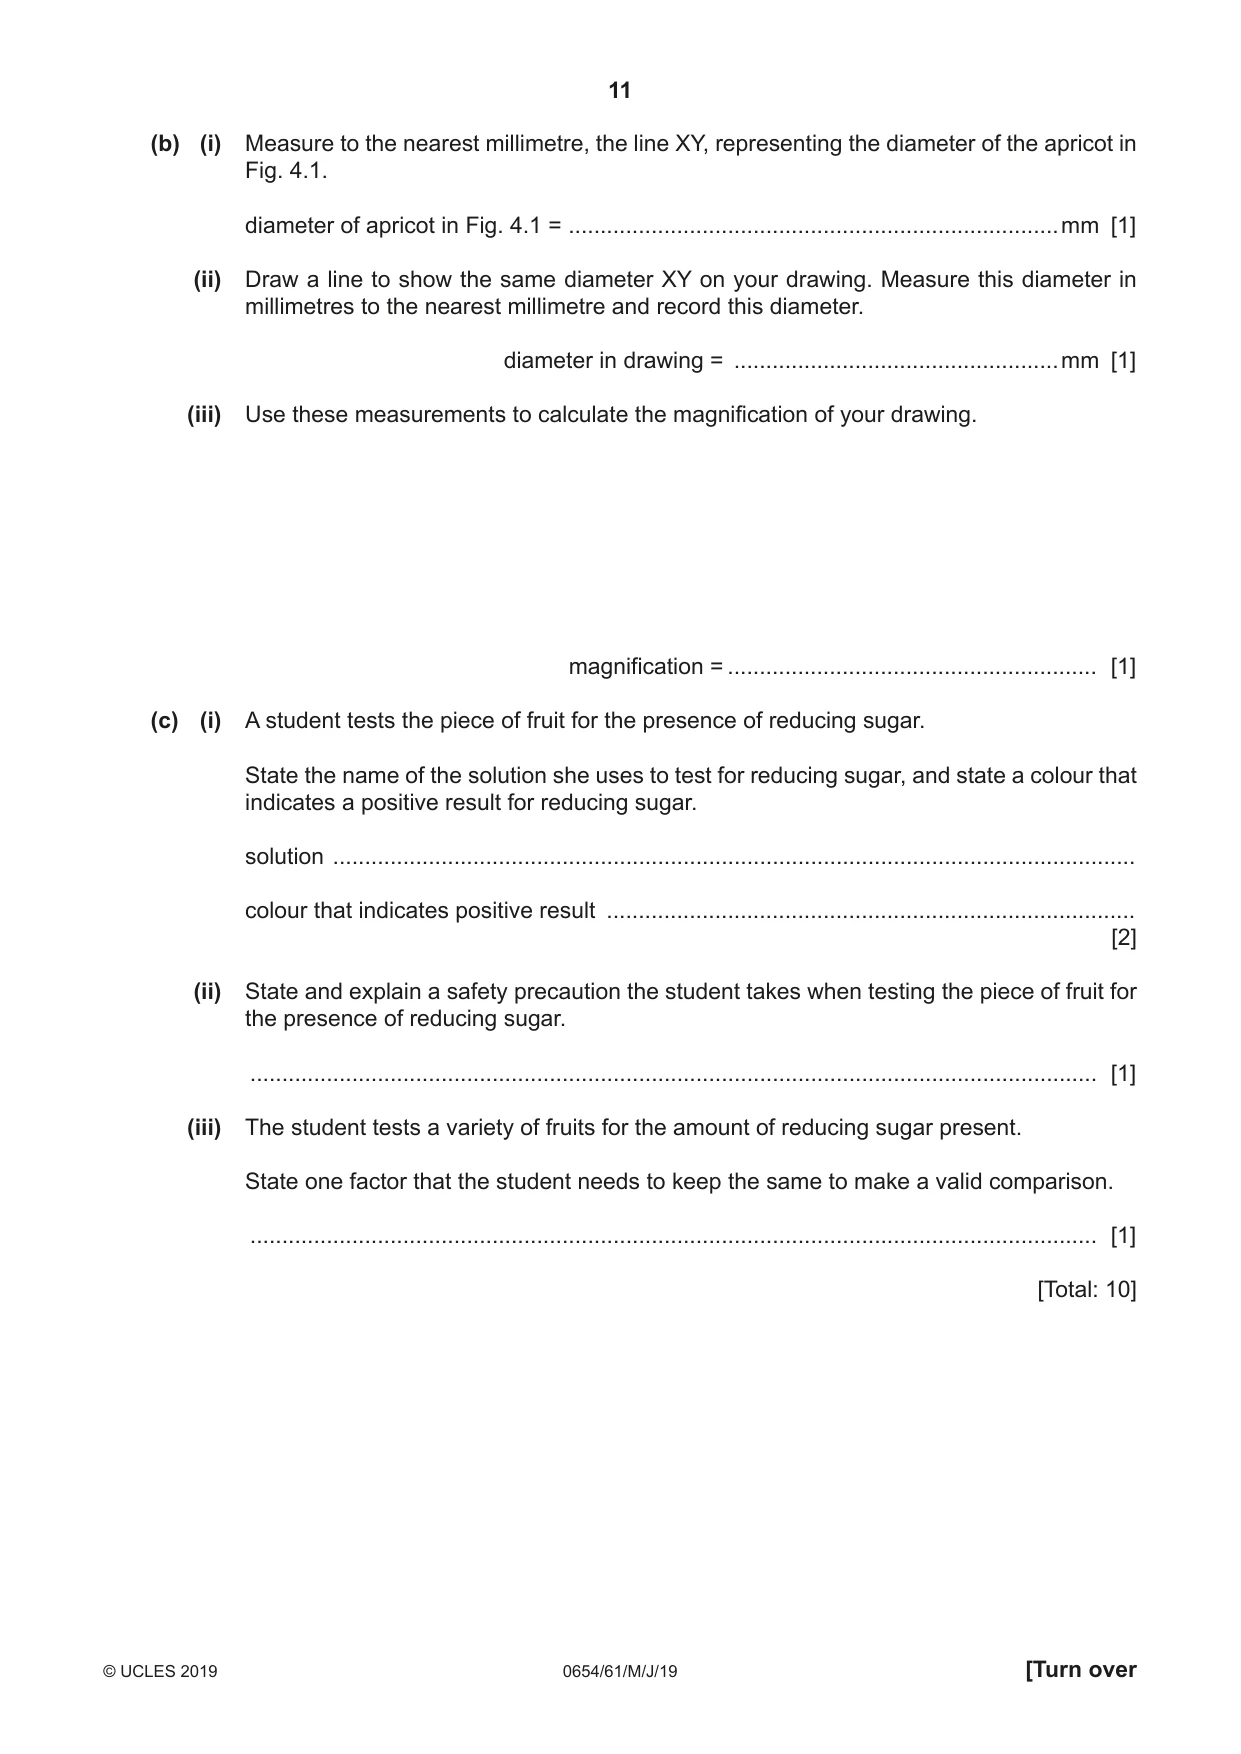
4 Fig. 4.1 shows an apricot fruit that has been cut in half and the stone removed. X Y Fig. 4.1 (a) In the box, make an enlarged detailed pencil drawing of the surface of the apricot. [3] (b) (i) Measure to the nearest millimetre, the line XY, representing the diameter of the apricot in Fig. 4.1. diameter of apricot in Fig. 4.1 = .............................................................................mm [1] (ii) Draw a line to show the same diameter XY on your drawing. Measure this diameter in millimetres to the nearest millimetre and record this diameter. diameter in drawing = ...................................................mm [1] (iii) Use these measurements to calculate the magnification of your drawing. magnification = .......................................................... [1] (c) (i) A student tests the piece of fruit for the presence of reducing sugar. State the name of the solution she uses to test for reducing sugar, and state a colour that indicates a positive result for reducing sugar. solution .............................................................................................................................. colour that indicates positive result ................................................................................... [2] (ii) State and explain a safety precaution the student takes when testing the piece of fruit for the presence of reducing sugar. ..................................................................................................................................... [1] (iii) The student tests a variety of fruits for the amount of reducing sugar present. State one factor that the student needs to keep the same to make a valid comparison. ..................................................................................................................................... [1] [Total: 10]
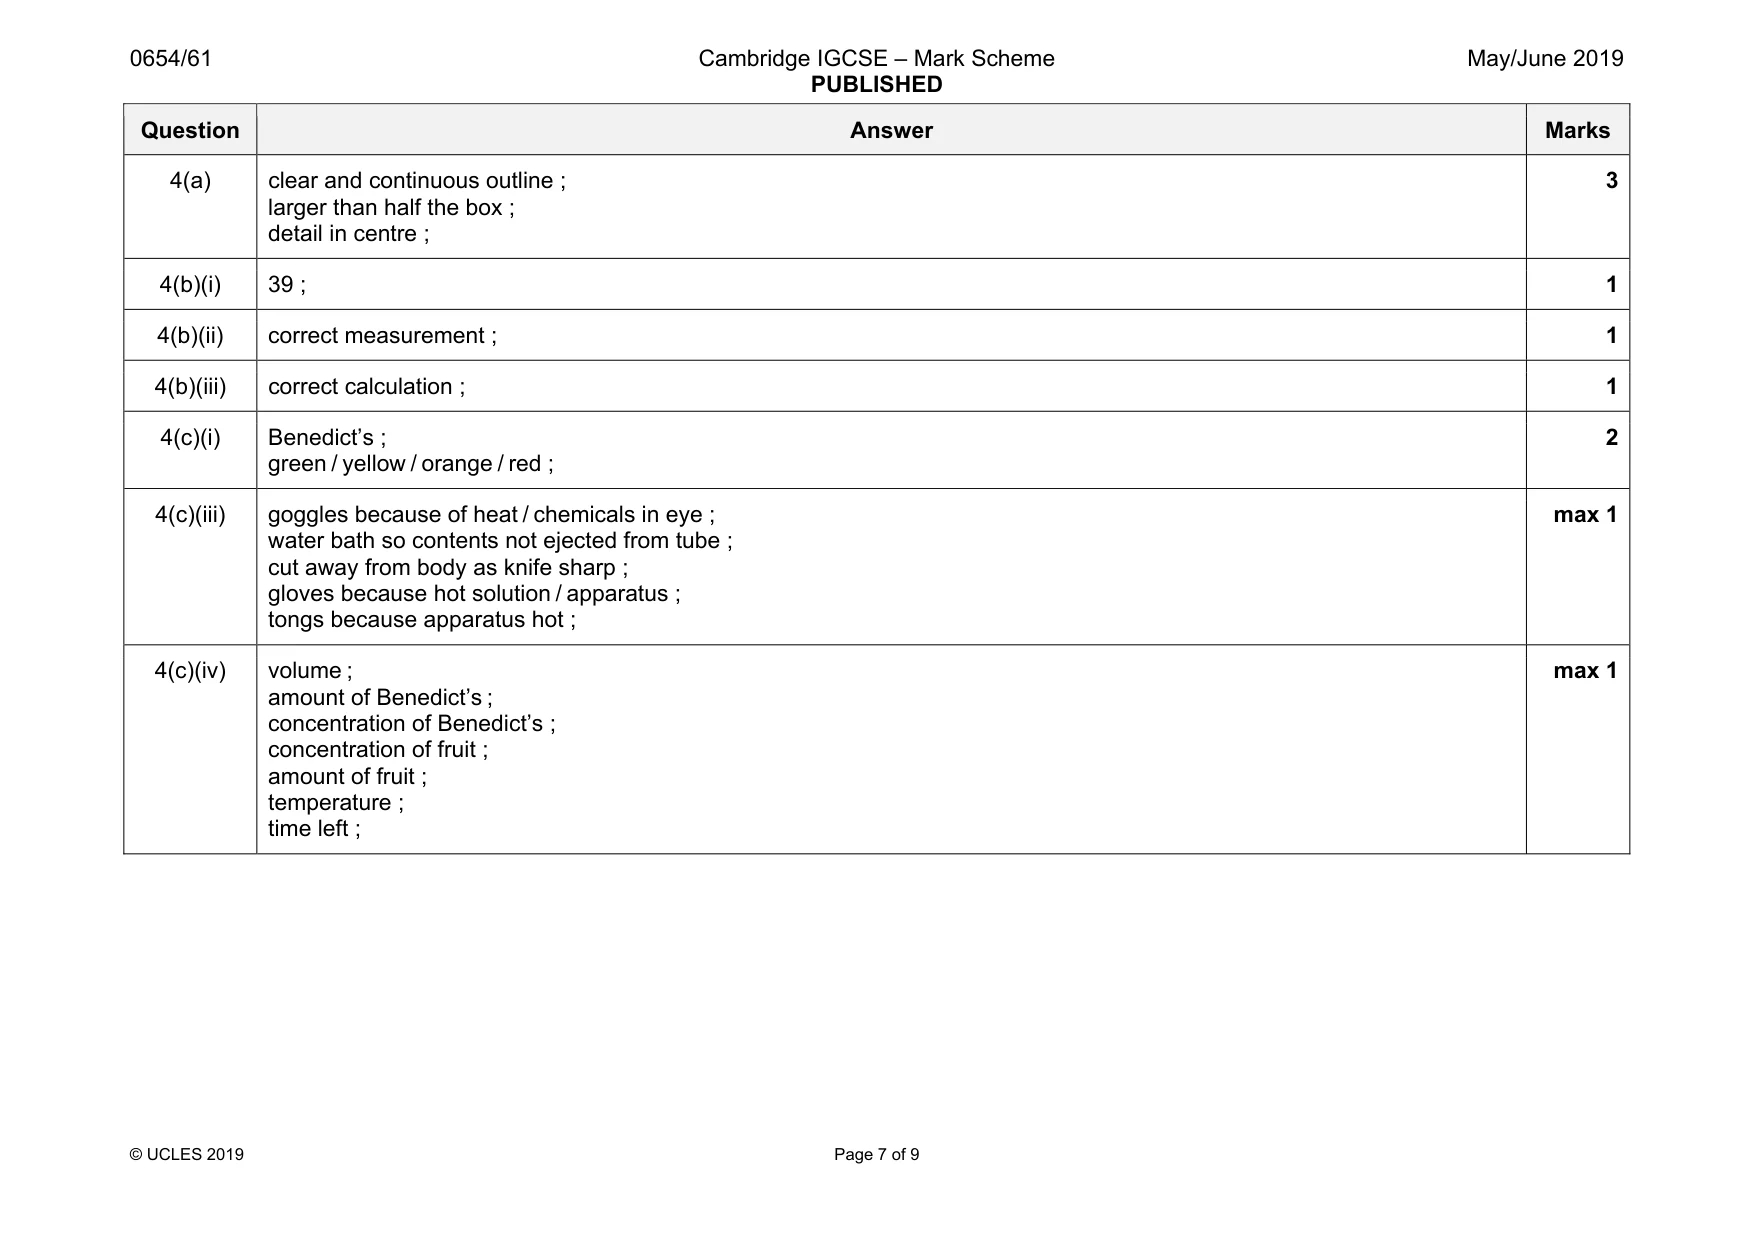
Mark scheme: 4(a) clear and continuous outline ; larger than half the box ; detail in centre ; 3 4(b)(i) 39 ; 1 4(b)(ii) correct measurement ; 1 4(b)(iii) correct calculation ; 1 4(c)(i) Benedict’s ; green / yellow / orange / red ; 2 4(c)(iii) goggles because of heat / chemicals in eye ; water bath so contents not ejected from tube ; cut away from body as knife sharp ; gloves because hot solution / apparatus ; tongs because apparatus hot ; max 1 4(c)(iv) volume ; amount of Benedict’s ; concentration of Benedict’s ; concentration of fruit ; amount of fruit ; temperature ; time left ; max 1
Q5 · A student investigates the use of barium nitrate solution as a reagent in qualitative…
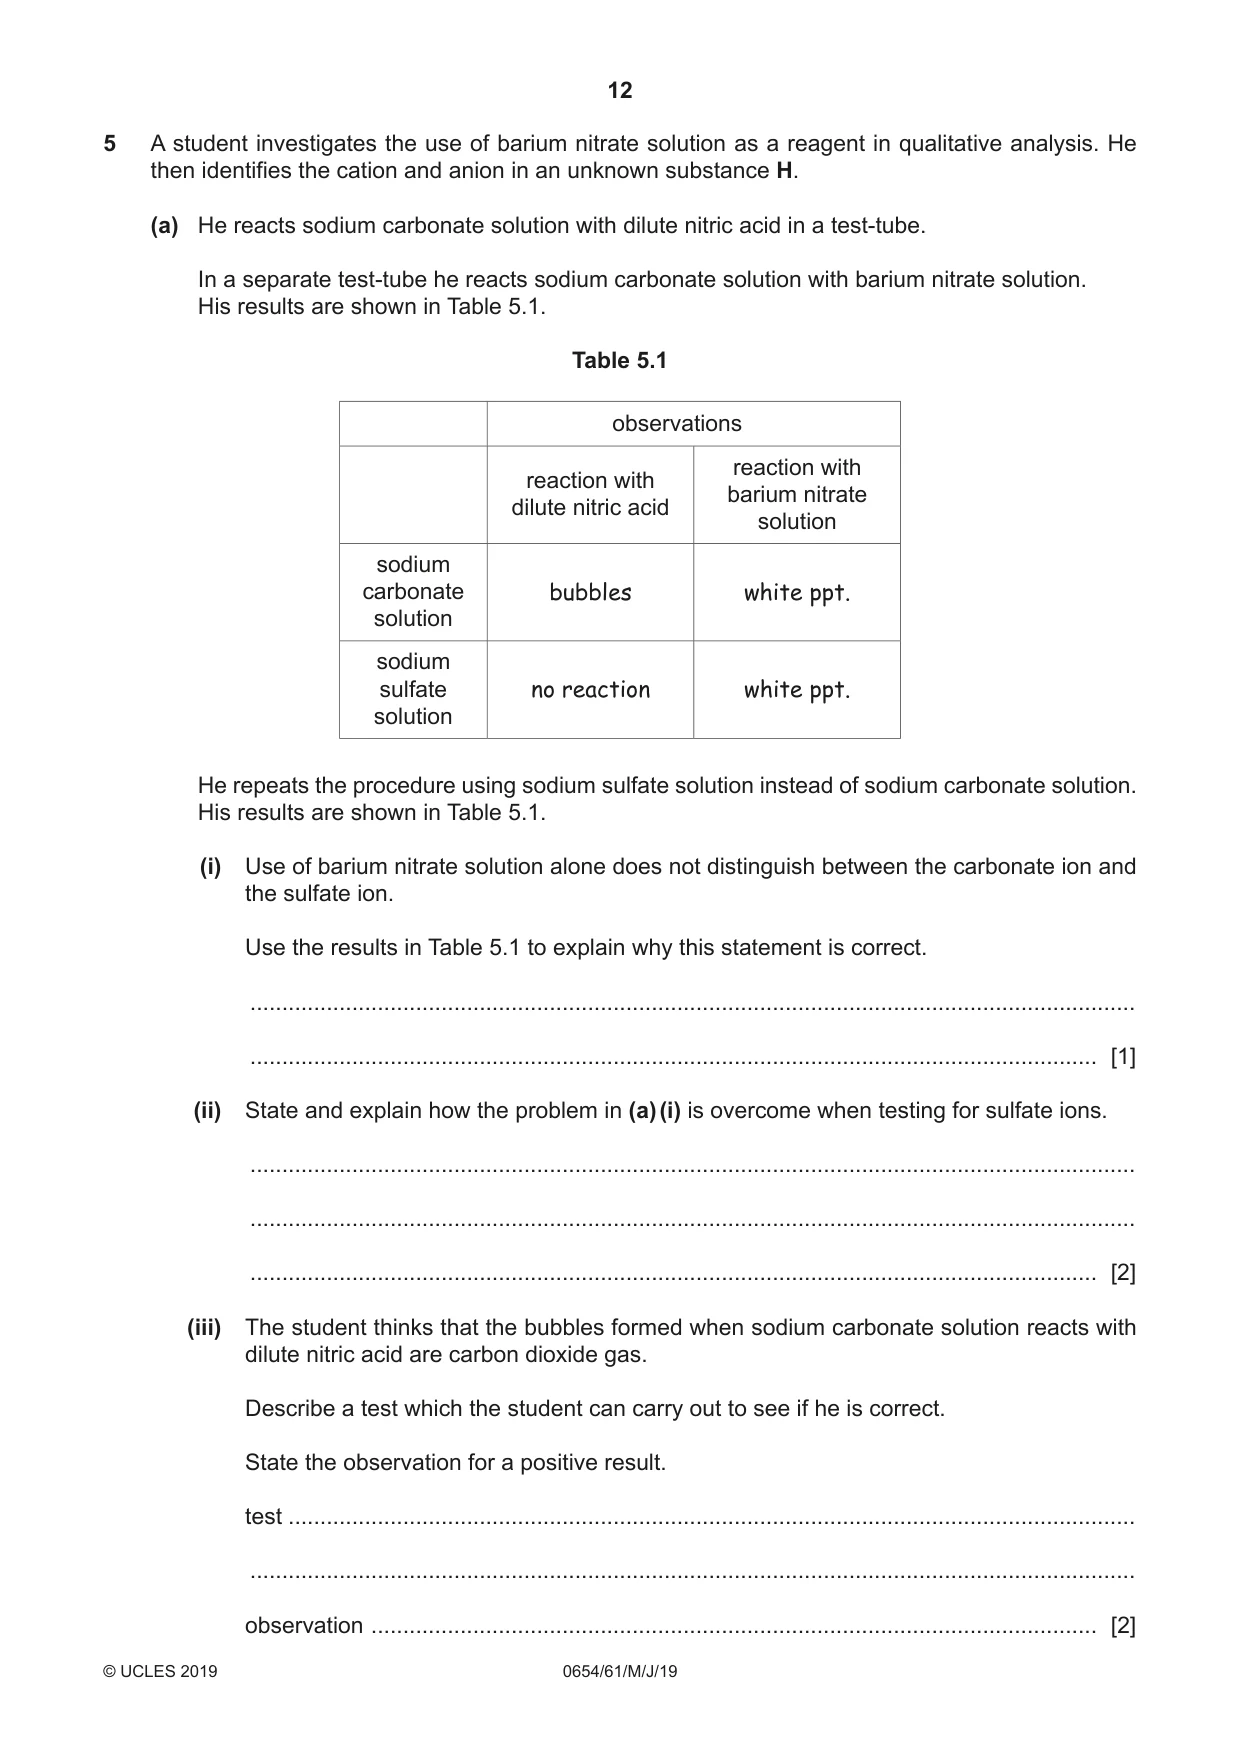
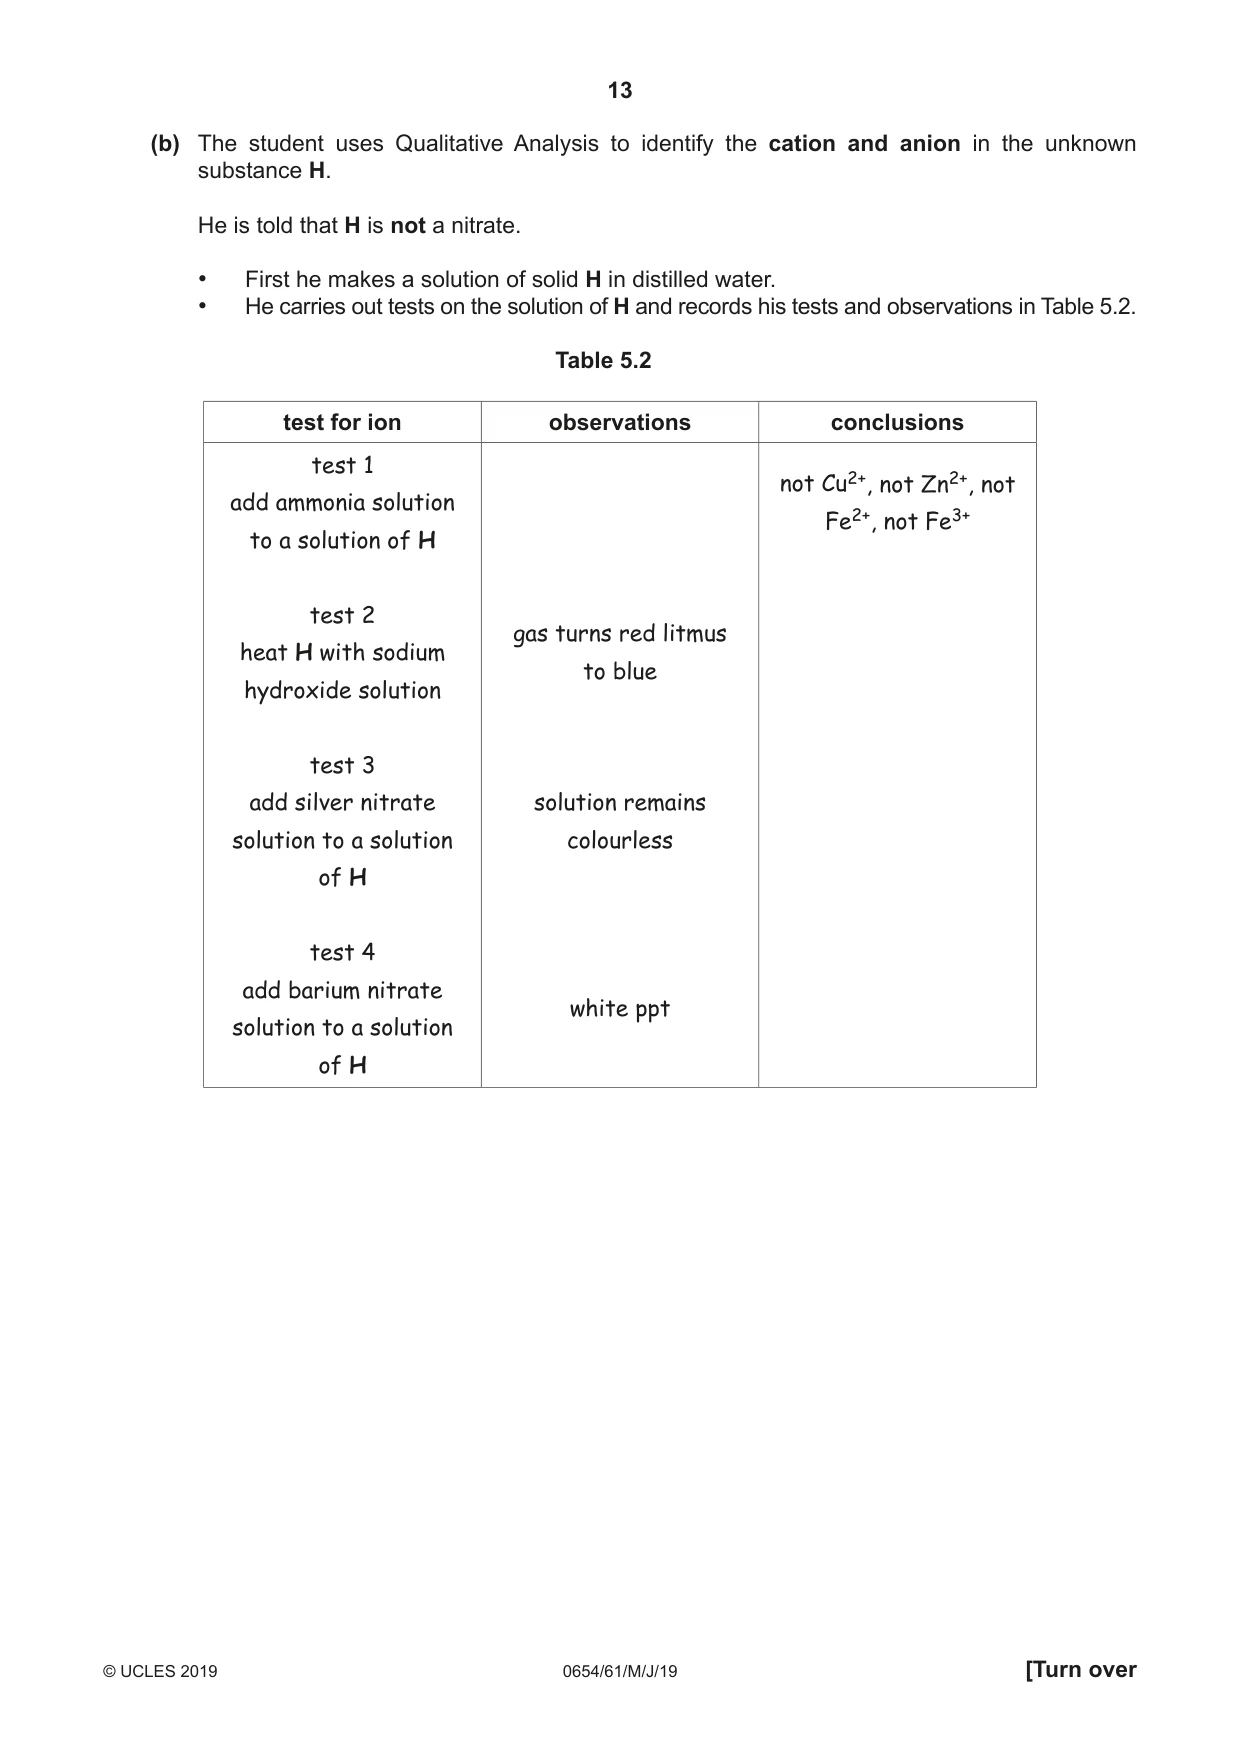
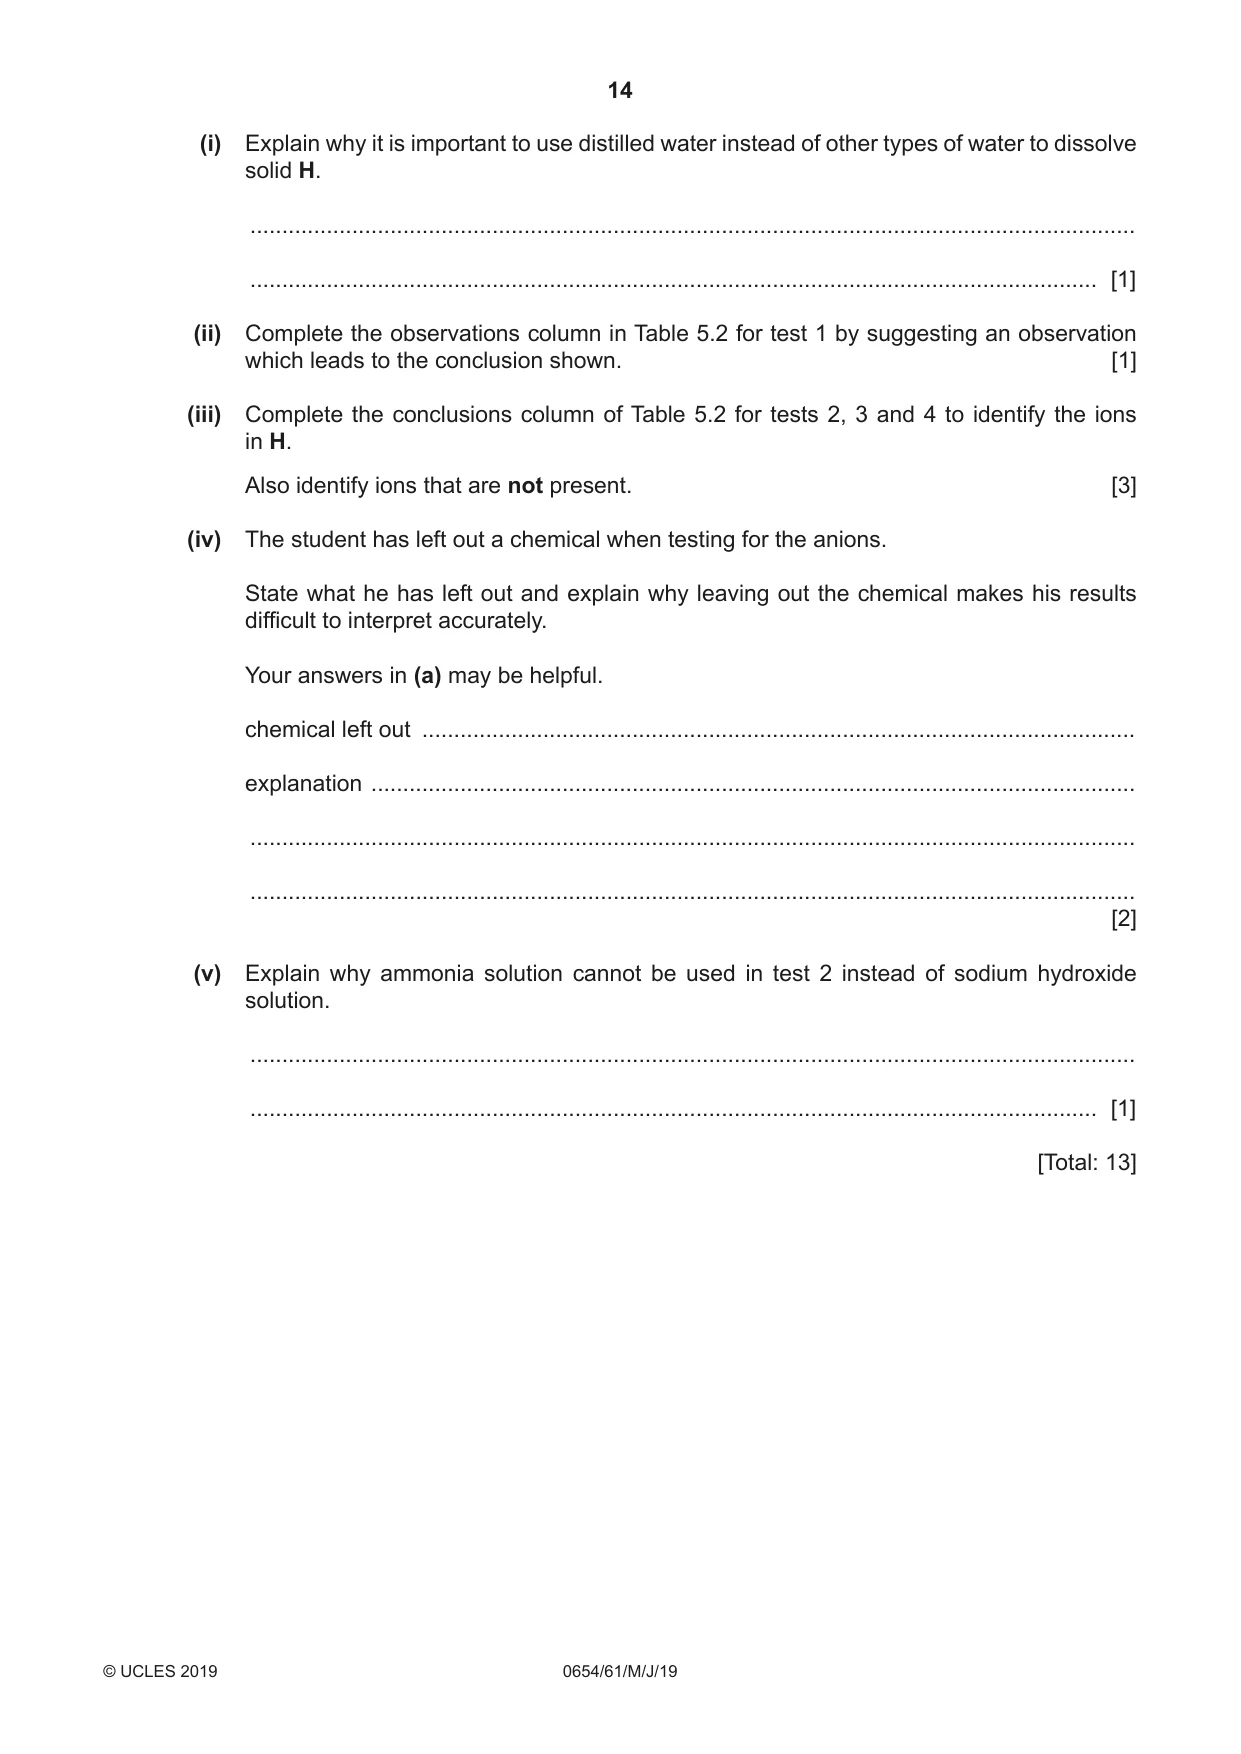
5 A student investigates the use of barium nitrate solution as a reagent in qualitative analysis. He then identifies the cation and anion in an unknown substance H. (a) He reacts sodium carbonate solution with dilute nitric acid in a test-tube. In a separate test-tube he reacts sodium carbonate solution with barium nitrate solution. His results are shown in Table 5.1. Table 5.1 observations reaction with reaction with barium nitrate dilute nitric acid solution sodium carbonate bubbles white ppt. solution sodium sulfate no reaction white ppt. solution He repeats the procedure using sodium sulfate solution instead of sodium carbonate solution. His results are shown in Table 5.1. (i) Use of barium nitrate solution alone does not distinguish between the carbonate ion and the sulfate ion. Use the results in Table 5.1 to explain why this statement is correct. ........................................................................................................................................... ..................................................................................................................................... [1] (ii) State and explain how the problem in (a) (i) is overcome when testing for sulfate ions. ........................................................................................................................................... ........................................................................................................................................... ..................................................................................................................................... [2] (iii) The student thinks that the bubbles formed when sodium carbonate solution reacts with dilute nitric acid are carbon dioxide gas. Describe a test which the student can carry out to see if he is correct. State the observation for a positive result. test ..................................................................................................................................... ........................................................................................................................................... observation .................................................................................................................. [2] (b) The student uses Qualitative Analysis to identify the cation and anion in the unknown substance H. He is told that H is not a nitrate. • First he makes a solution of solid H in distilled water. • He carries out tests on the solution of H and records his tests and observations in Table 5.2. Table 5.2 test for ion observations conclusions test 1 not Cu2+, not Zn2+, not add ammonia solution Fe2+, not Fe3+ to a solution of H test 2 gas turns red litmus heat H with sodium to blue hydroxide solution test 3 add silver nitrate solution remains solution to a solution colourless of H test 4 add barium nitrate white ppt solution to a solution of H (i) Explain why it is important to use distilled water instead of other types of water to dissolve solid H. ........................................................................................................................................... ..................................................................................................................................... [1] (ii) Complete the observations column in Table 5.2 for test 1 by suggesting an observation which leads to the conclusion shown. [1] (iii) Complete the conclusions column of Table 5.2 for tests 2, 3 and 4 to identify the ions in H. Also identify ions that are not present. [3] (iv) The student has left out a chemical when testing for the anions. State what he has left out and explain why leaving out the chemical makes his results difficult to interpret accurately. Your answers in (a) may be helpful. chemical left out ................................................................................................................ explanation ........................................................................................................................ ........................................................................................................................................... ........................................................................................................................................... [2] (v) Explain why ammonia solution cannot be used in test 2 instead of sodium hydroxide solution. ........................................................................................................................................... ..................................................................................................................................... [1] [Total: 13]
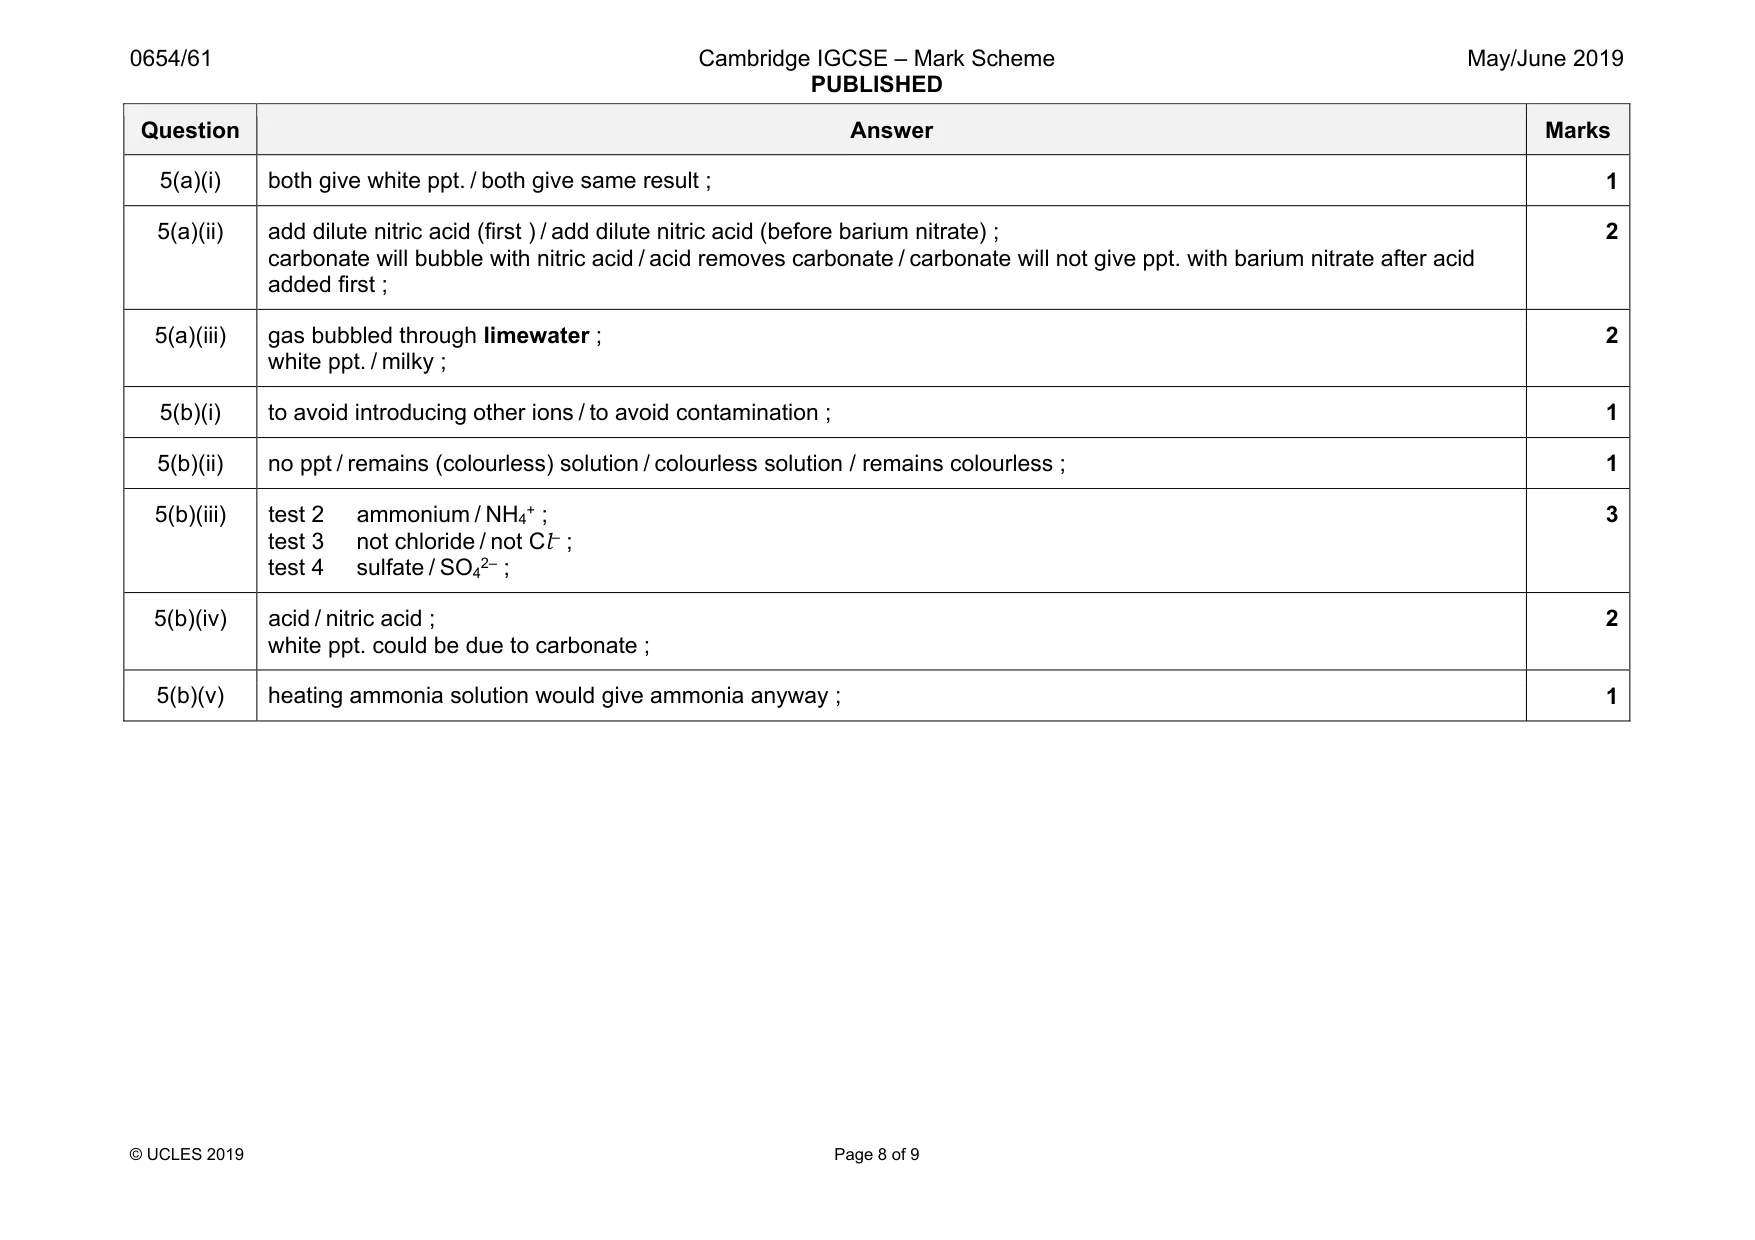
Mark scheme: 5(a)(i) both give white ppt. / both give same result ; 1 5(a)(ii) add dilute nitric acid (first ) / add dilute nitric acid (before barium nitrate) ; carbonate will bubble with nitric acid / acid removes carbonate / carbonate will not give ppt. with barium nitrate after acid added first ; 2 5(a)(iii) gas bubbled through limewater ; white ppt. / milky ; 2 5(b)(i) to avoid introducing other ions / to avoid contamination ; 1 5(b)(ii) no ppt / remains (colourless) solution / colourless solution / remains colourless ; 1 5(b)(iii) test 2 ammonium / NH4+ ; test 3 not chloride / not Cl– ; test 4 sulfate / SO42– ; 3 5(b)(iv) acid / nitric acid ; white ppt. could be due to carbonate ; 2 5(b)(v) heating ammonia solution would give ammonia anyway ; 1
Q6 · A student measures the spring constant k of a spring
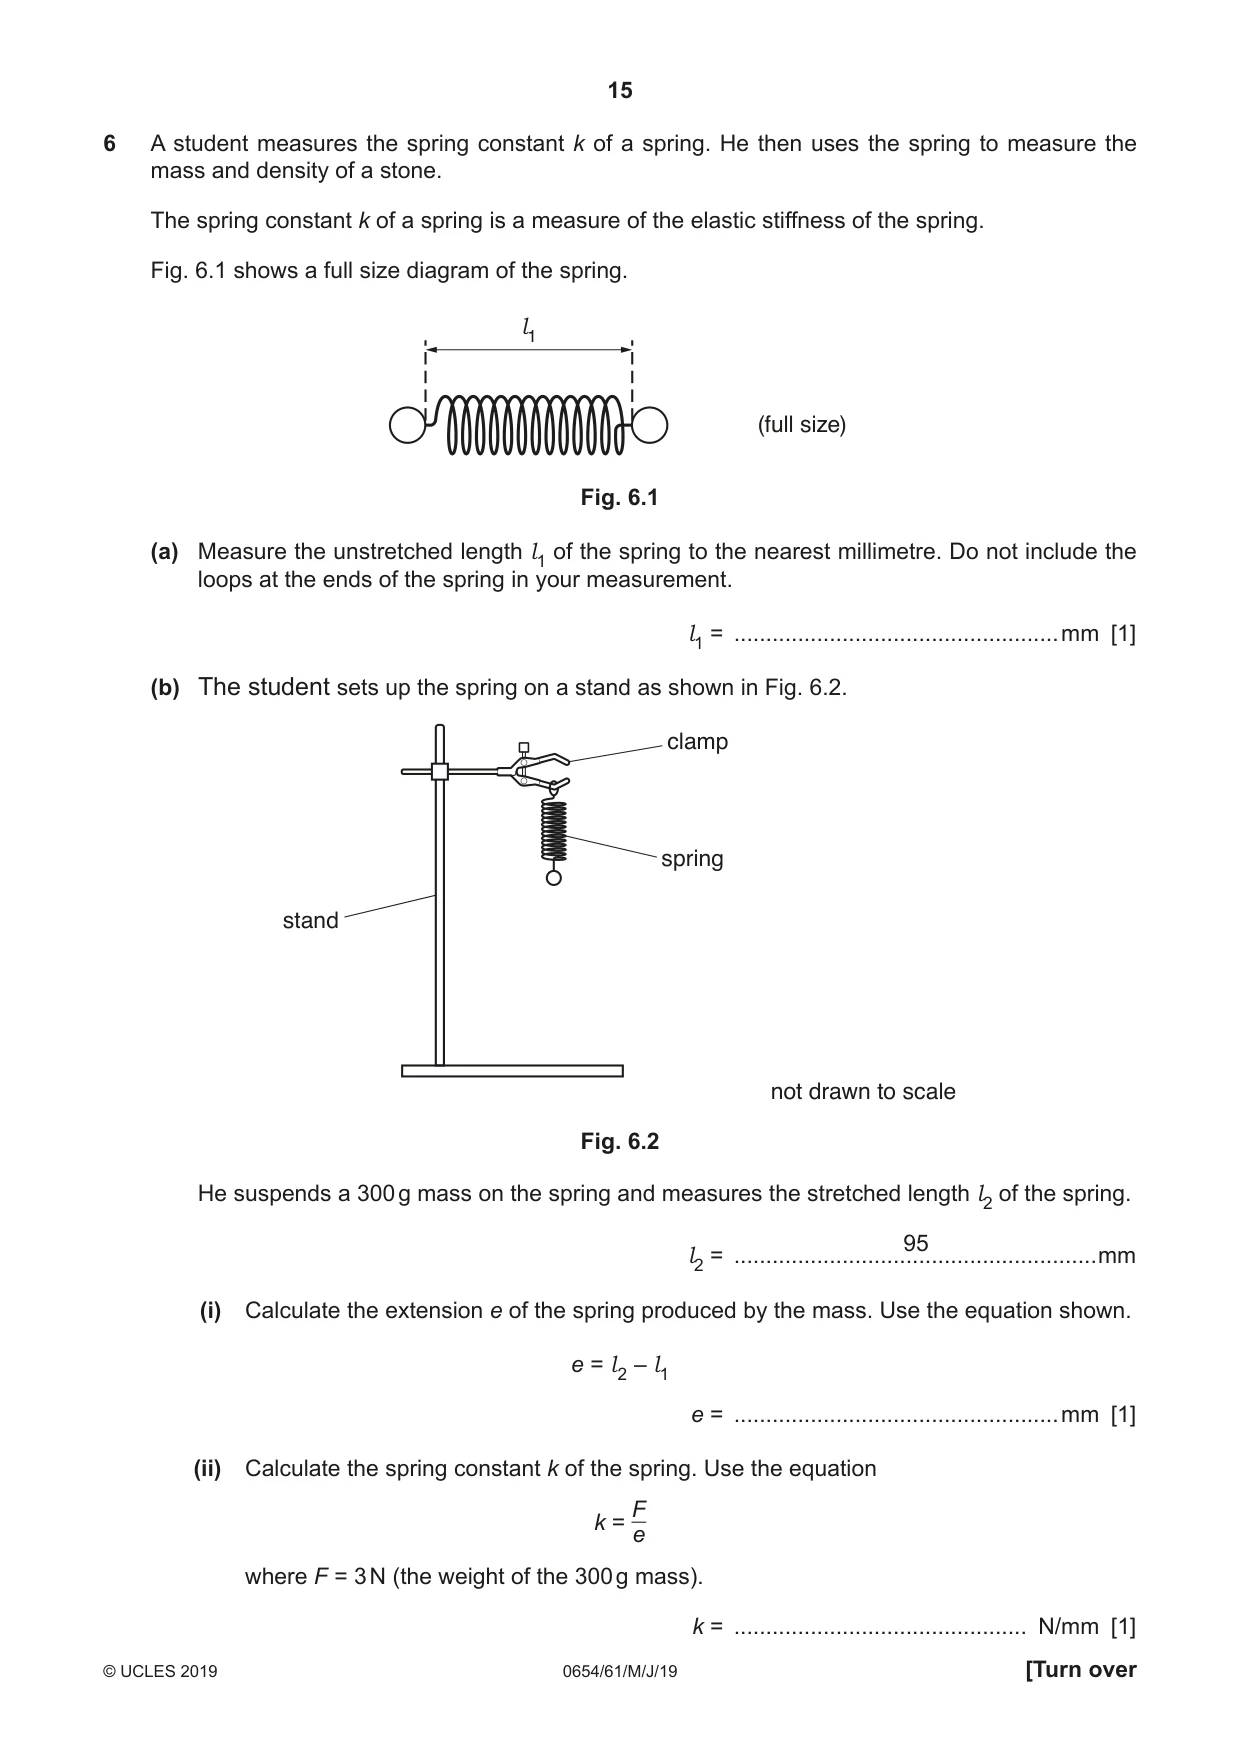
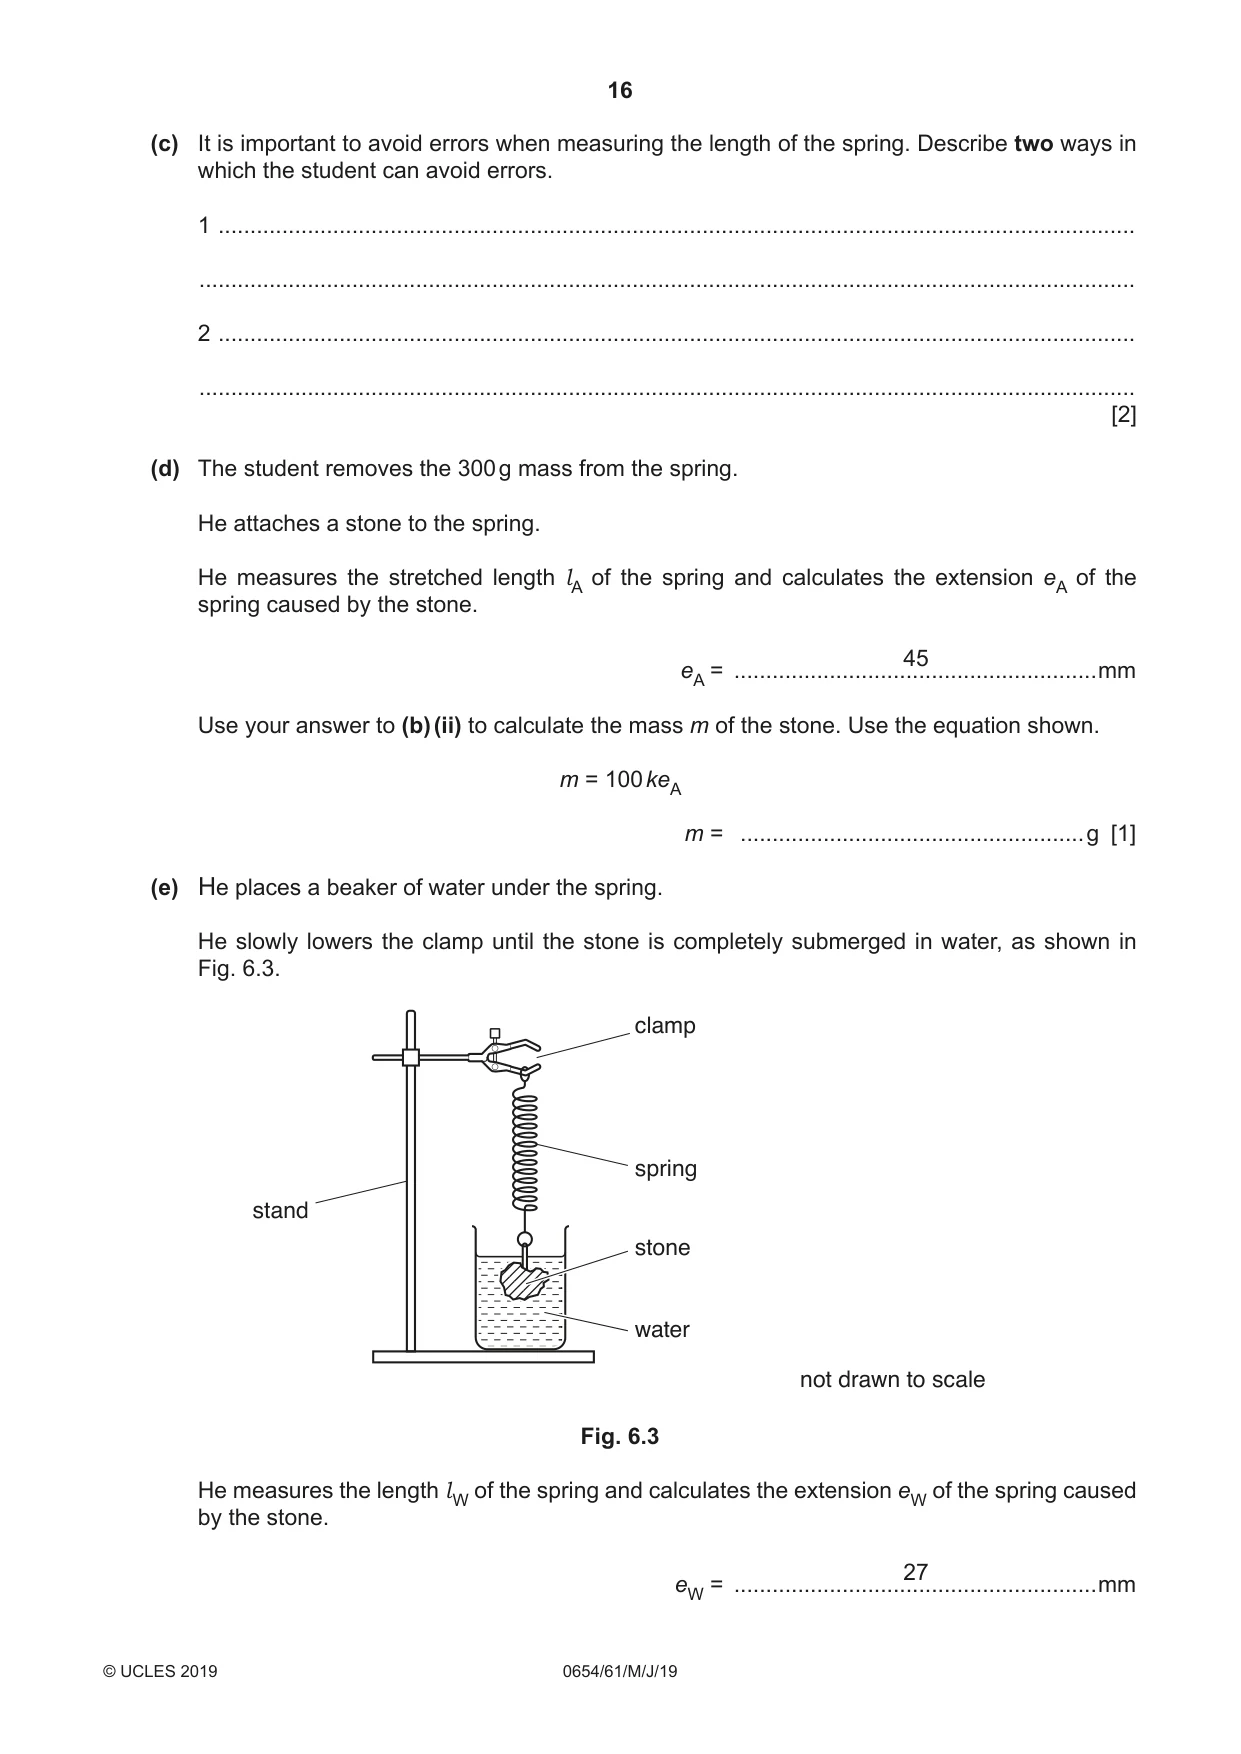
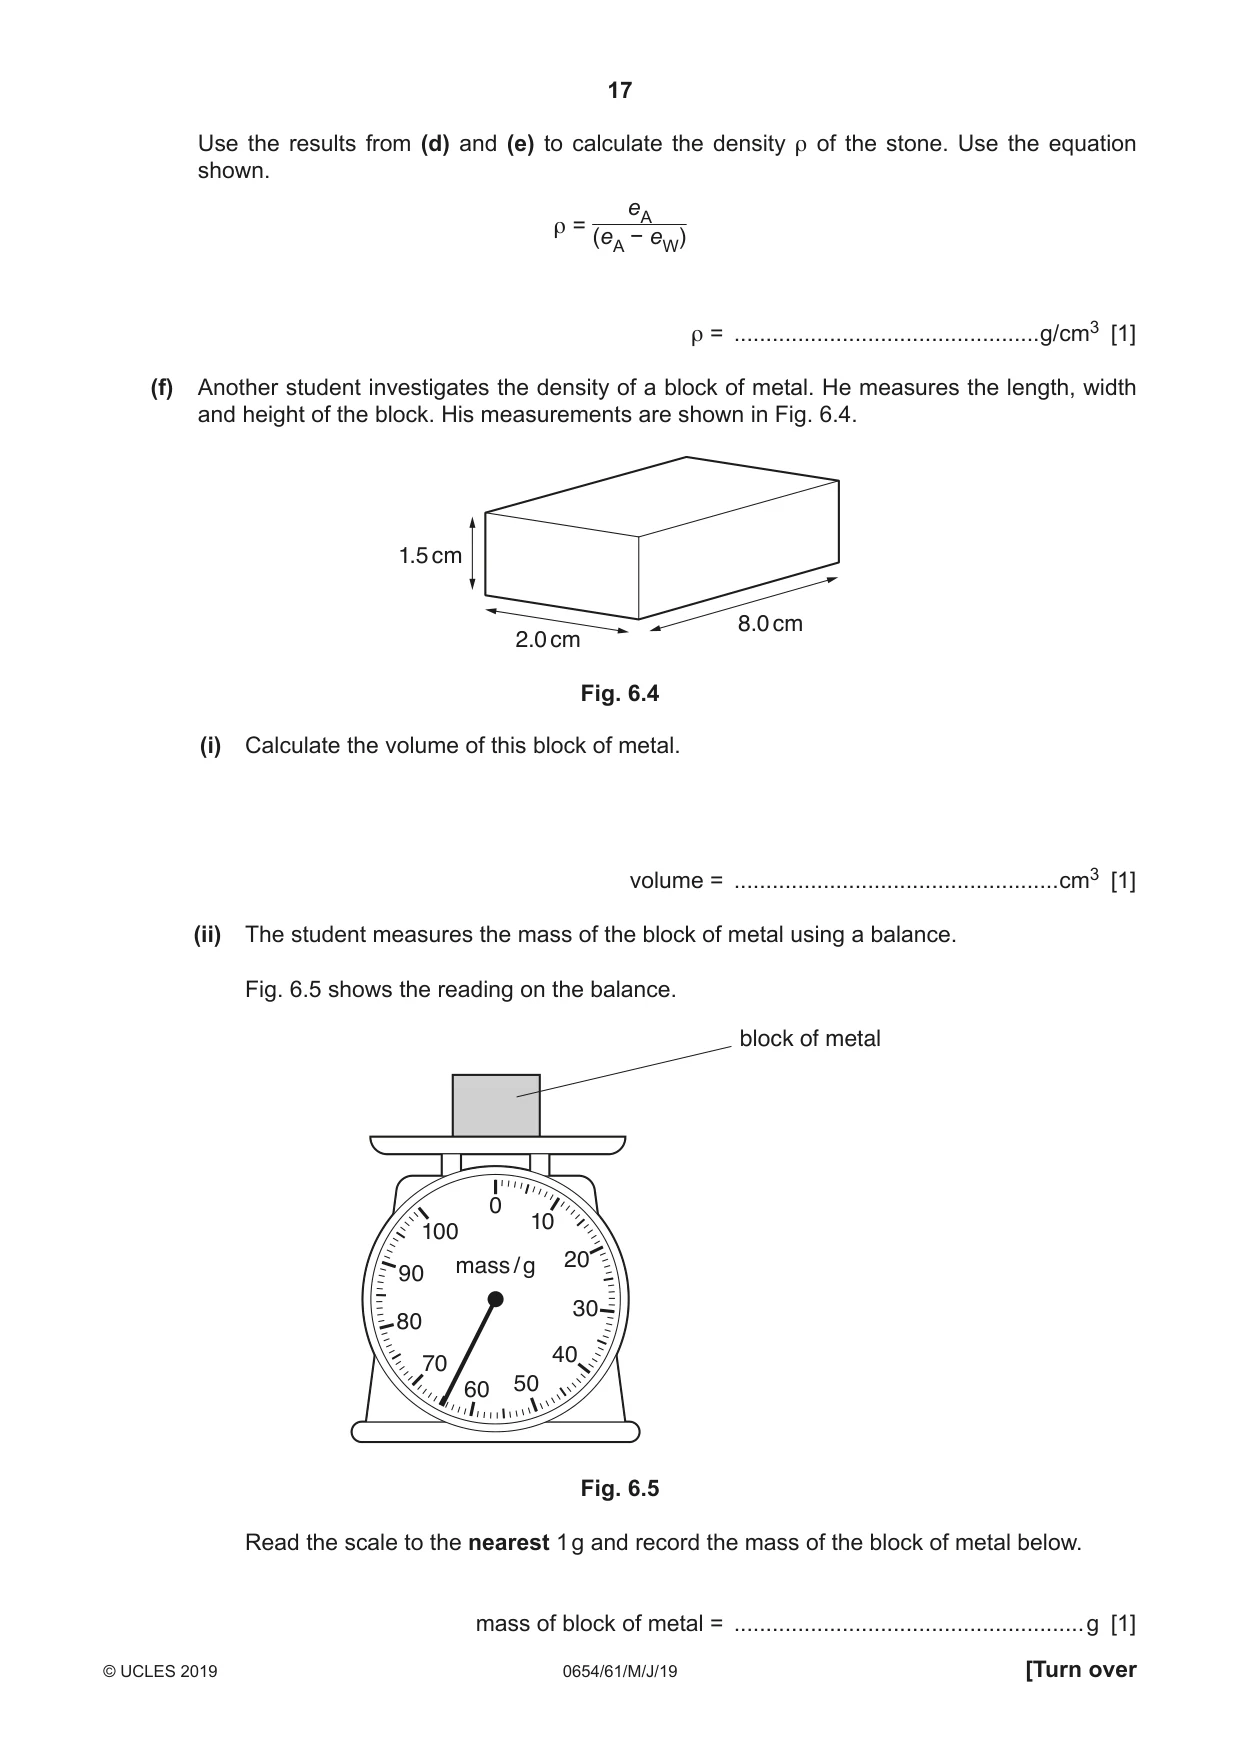
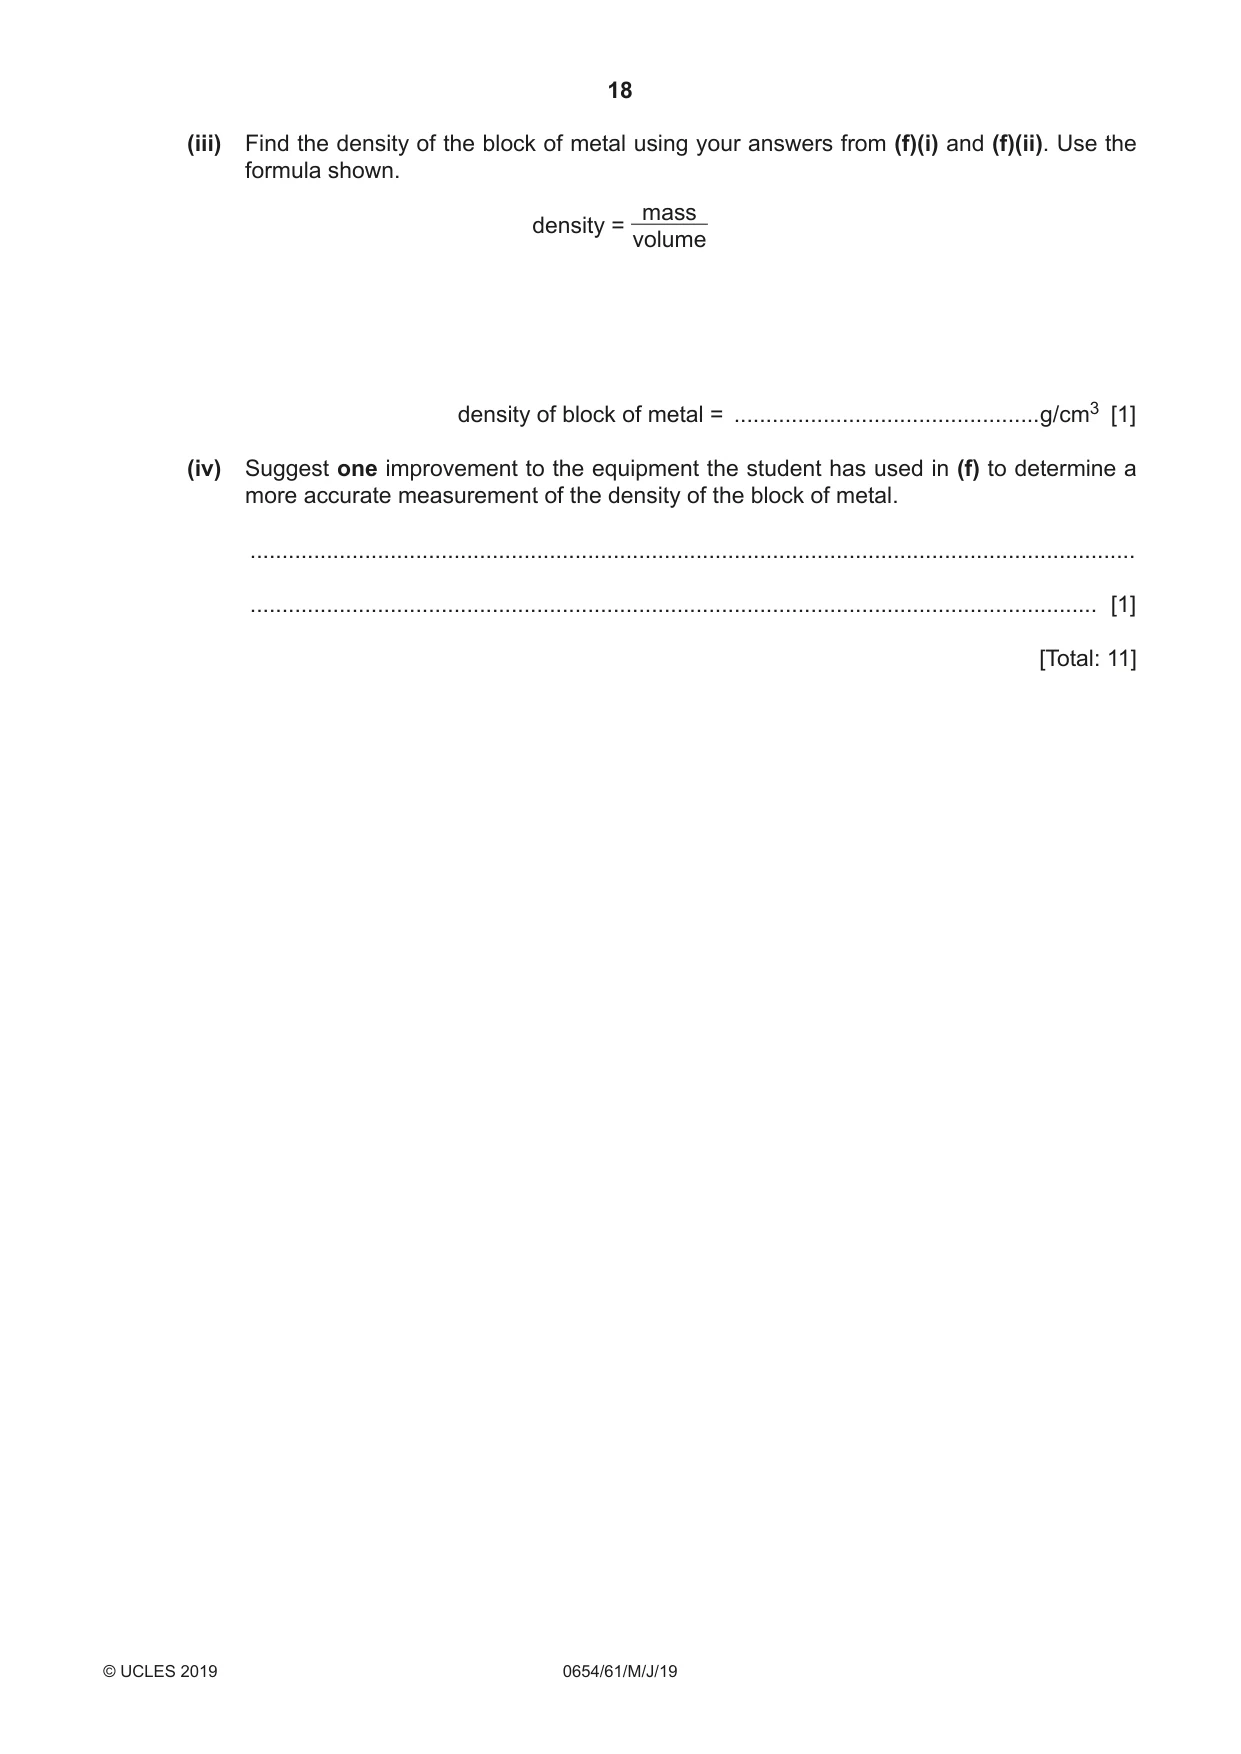
6 A student measures the spring constant k of a spring. He then uses the spring to measure the mass and density of a stone. The spring constant k of a spring is a measure of the elastic stiffness of the spring. Fig. 6.1 shows a full size diagram of the spring. l1 (full size) Fig. 6.1 (a) Measure the unstretched length l1 of the spring to the nearest millimetre. Do not include the loops at the ends of the spring in your measurement. l1 = ...................................................mm [1] (b) The student sets up the spring on a stand as shown in Fig. 6.2. clamp spring stand not drawn to scale Fig. 6.2 He suspends a 300 g mass on the spring and measures the stretched length l2 of the spring. 95 l2 = .........................................................mm (i) Calculate the extension e of the spring produced by the mass. Use the equation shown. e = l2 – l1 e = ...................................................mm [1] (ii) Calculate the spring constant k of the spring. Use the equation F k = e where F = 3 N (the weight of the 300 g mass). k = .............................................. N/mm [1] (c) It is important to avoid errors when measuring the length of the spring. Describe two ways in which the student can avoid errors. 1 ................................................................................................................................................ ................................................................................................................................................... 2 ................................................................................................................................................ ................................................................................................................................................... [2] (d) The student removes the 300 g mass from the spring. He attaches a stone to the spring. He measures the stretched length lA of the spring and calculates the extension eA of the spring caused by the stone. 45 eA = .........................................................mm Use your answer to (b) (ii) to calculate the mass m of the stone. Use the equation shown. m = 100 keA m = ......................................................g [1] (e) He places a beaker of water under the spring. He slowly lowers the clamp until the stone is completely submerged in water, as shown in Fig. 6.3. clamp spring stand stone water not drawn to scale Fig. 6.3 He measures the length lW of the spring and calculates the extension eW of the spring caused by the stone. 27 eW = .........................................................mm Use the results from (d) and (e) to calculate the density ρ of the stone. Use the equation shown. eA ρ = (eA − eW) ρ = ................................................g/cm3 [1] (f) Another student investigates the density of a block of metal. He measures the length, width and height of the block. His measurements are shown in Fig. 6.4. 1.5 cm 8.0 cm 2.0 cm Fig. 6.4 (i) Calculate the volume of this block of metal. volume = ...................................................cm3 [1] (ii) The student measures the mass of the block of metal using a balance. Fig. 6.5 shows the reading on the balance. block of metal 0 10 100 mass / g 20 90 30 80 40 70 60 50 Fig. 6.5 Read the scale to the nearest 1 g and record the mass of the block of metal below. mass of block of metal = .......................................................g [1]
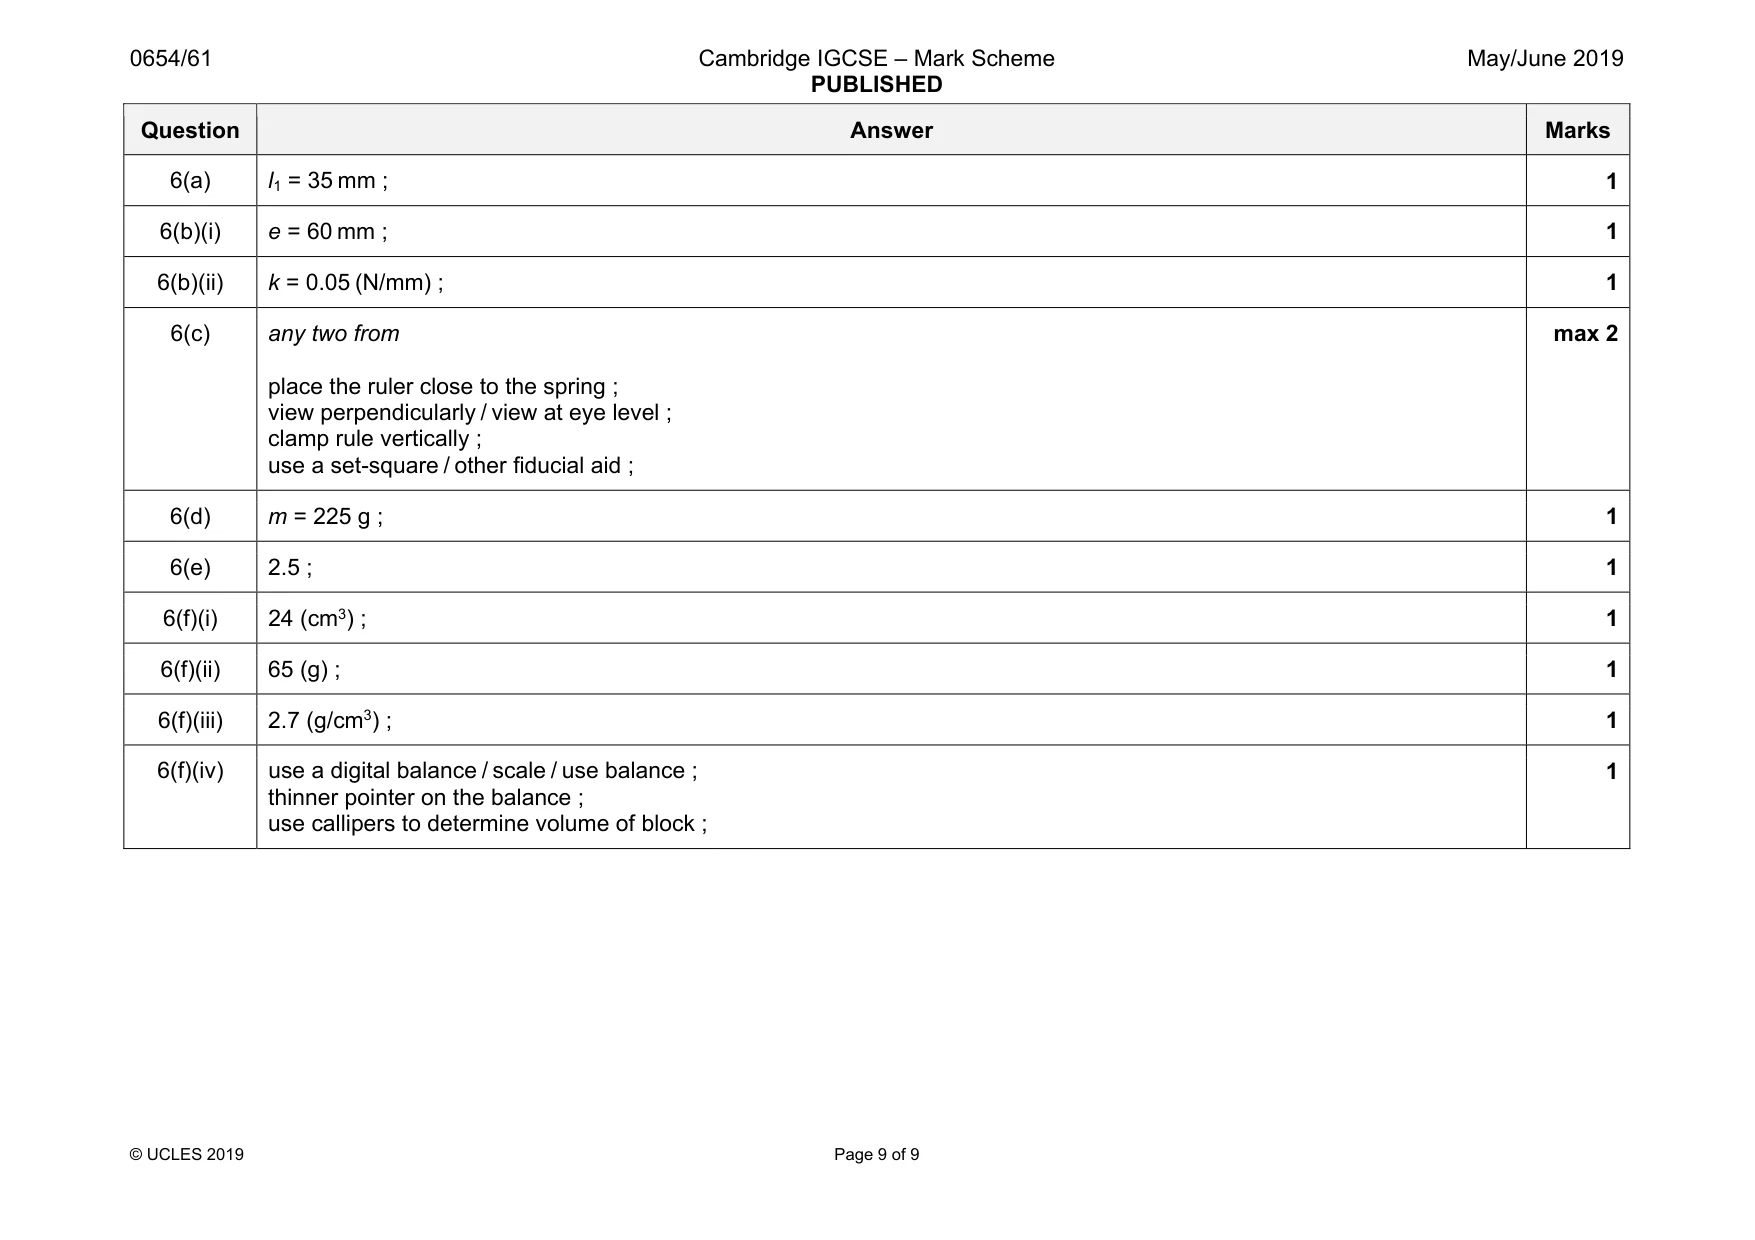
Mark scheme: 6(a) l1 = 35 mm ; 1 6(b)(i) e = 60 mm ; 1 6(b)(ii) k = 0.05 (N/mm) ; 1 6(c) any two from place the ruler close to the spring ; view perpendicularly / view at eye level ; clamp rule vertically ; use a set-square / other fiducial aid ; max 2 6(d) m = 225 g ; 1 6(e) 2.5 ; 1 6(f)(i) 24 (cm3) ; 1 6(f)(ii) 65 (g) ; 1 6(f)(iii) 2.7 (g/cm3) ; 1 6(f)(iv) use a digital balance / scale / use balance ; thinner pointer on the balance ; use callipers to determine volume of block ; 1
What was in this paper
The subtopics covered by these 6 questions, and how many questions each got. Open one in a new tab to see every Cambridge question on it.
What you needed in this session
Cambridge’s own grade thresholds for 2019 May/June, Paper 6 · Variant 1. A higher threshold means an easier paper — the bar moves with how the cohort did.