Cambridge IGCSE Sciences - Co-ordinated (Double) 0654 — 2017 Oct/Nov Paper 6 · Variant 3
0654/63/O/N/17 · 6 questions · 60 marks · ≈68 min
The question paper and its mark scheme, free to read here and free to download. This is Cambridge’s own paper, exactly as it was sat.
Question paper20 pages


Mark scheme7 pages
Answers below. Sit the paper first if you are practising.
Questions as text
Q1 · A student investigates an enzyme-catalysed reaction
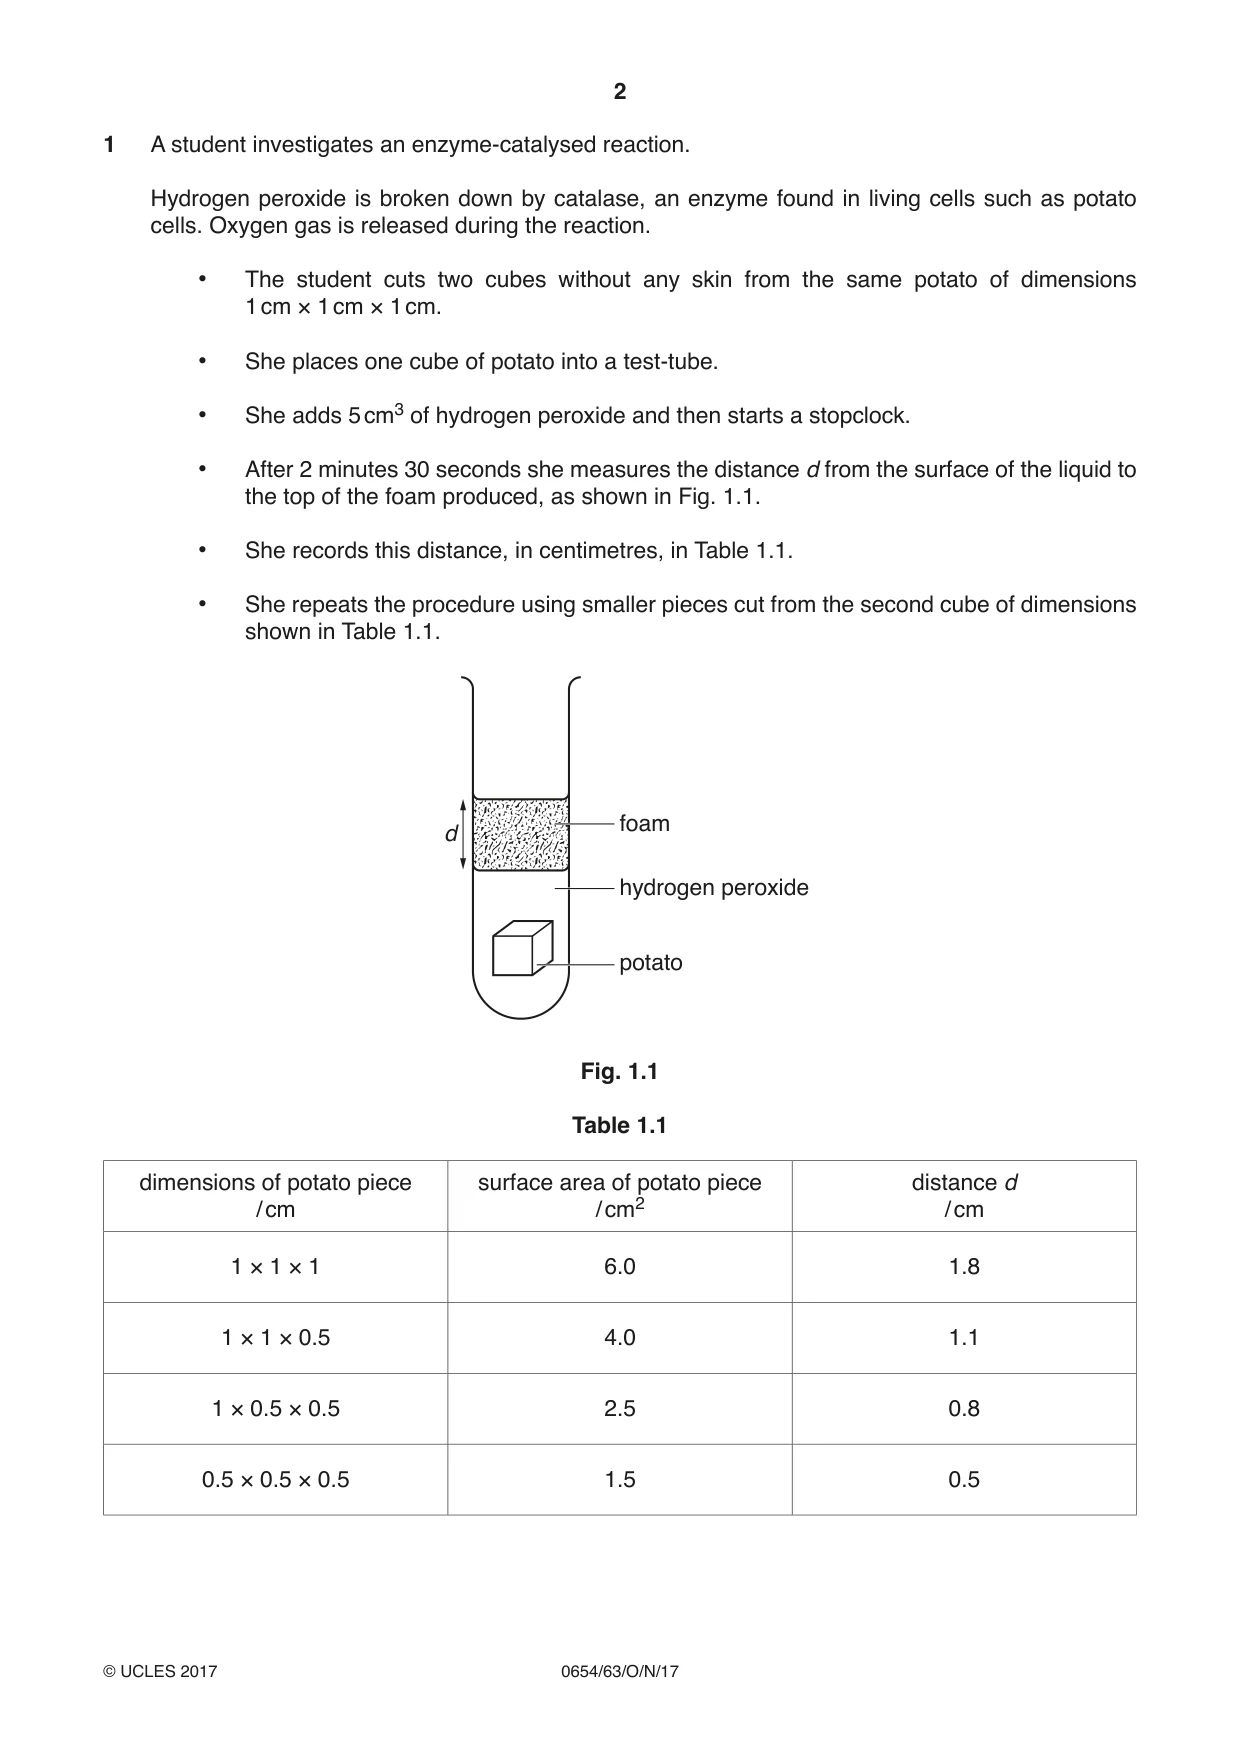
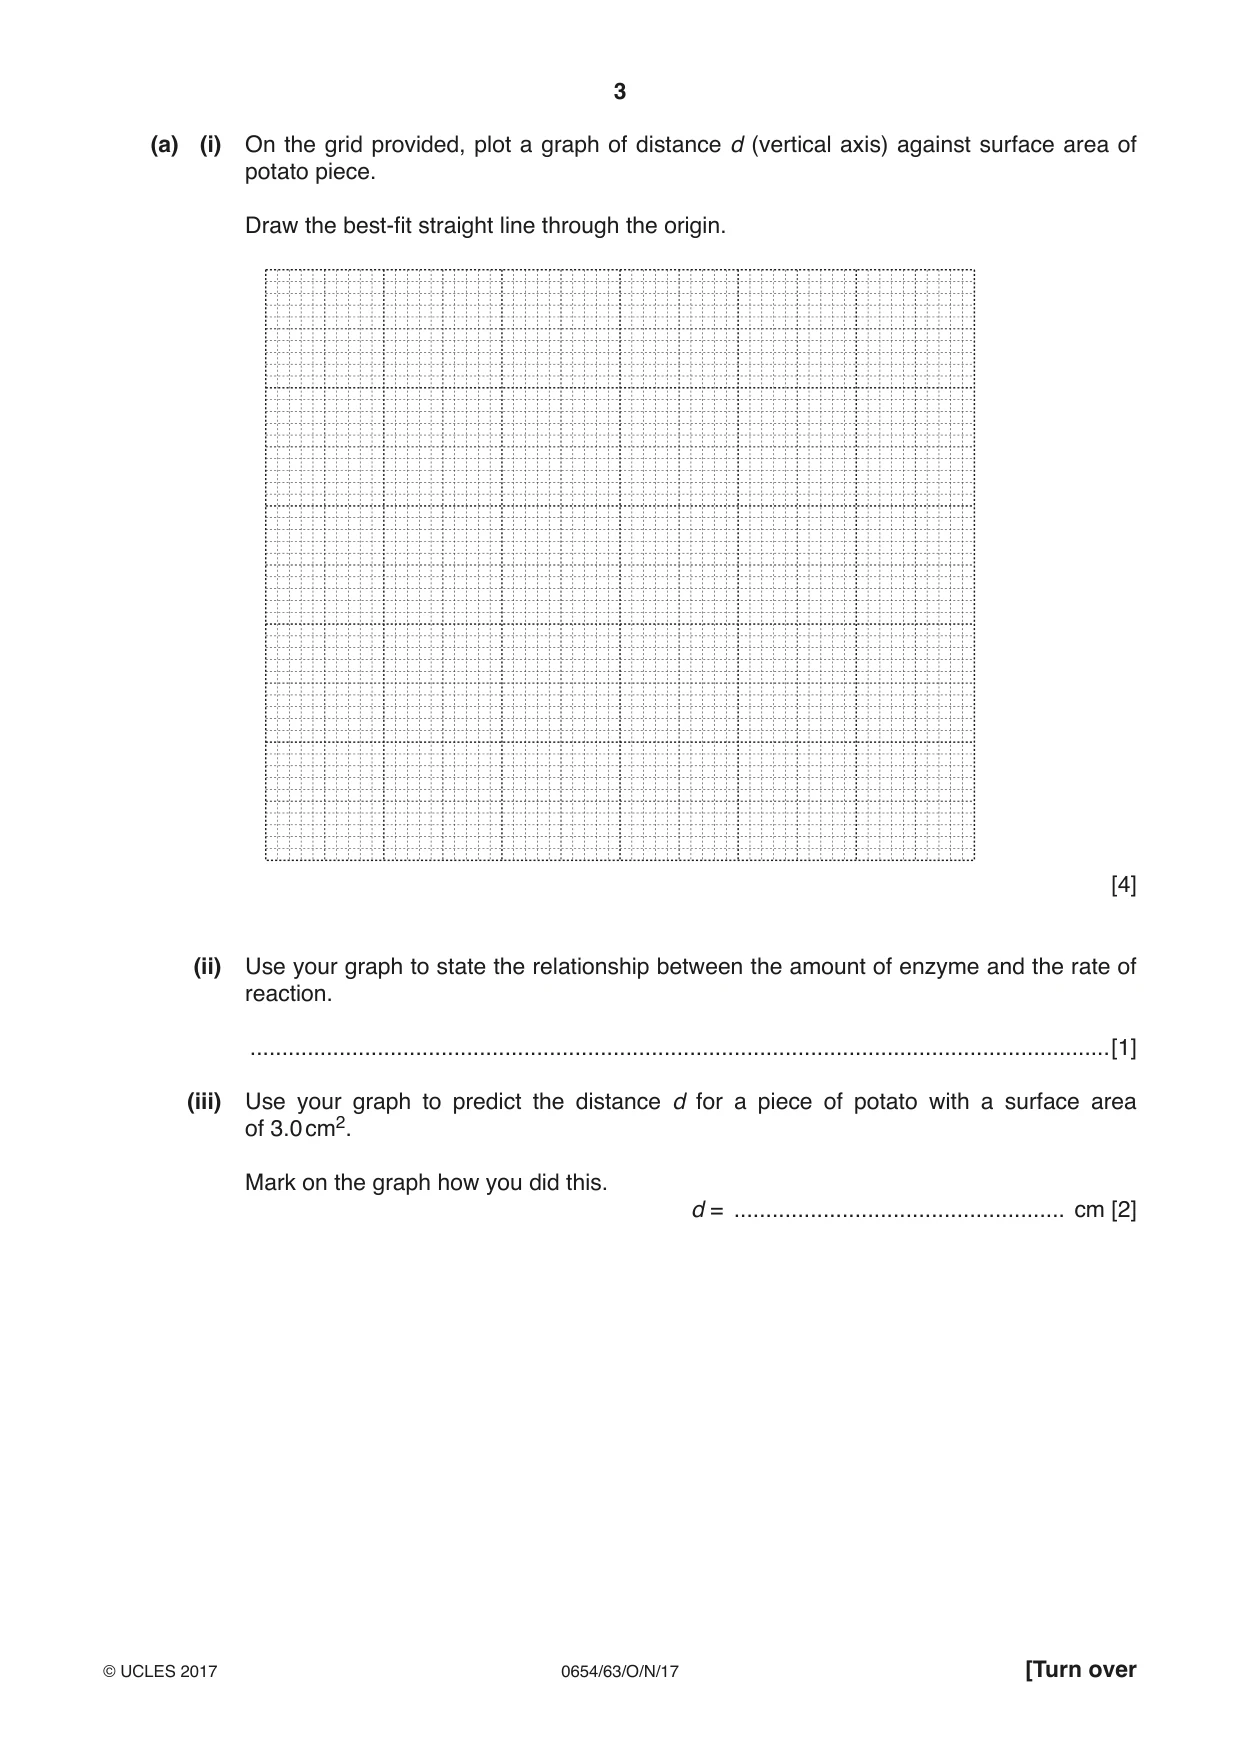
1 A student investigates an enzyme-catalysed reaction. Hydrogen peroxide is broken down by catalase, an enzyme found in living cells such as potato cells. Oxygen gas is released during the reaction. • The student cuts two cubes without any skin from the same potato of dimensions 1 cm × 1 cm × 1 cm. • She places one cube of potato into a test-tube. • She adds 5 cm3 of hydrogen peroxide and then starts a stopclock. • After 2 minutes 30 seconds she measures the distance d from the surface of the liquid to the top of the foam produced, as shown in Fig. 1.1. • She records this distance, in centimetres, in Table 1.1. • She repeats the procedure using smaller pieces cut from the second cube of dimensions shown in Table 1.1. foam d hydrogen peroxide potato Fig. 1.1 Table 1.1 dimensions of potato piece surface area of potato piece distance d / cm / cm2 / cm 1 × 1 × 1 6.0 1.8 1 × 1 × 0.5 4.0 1.1 1 × 0.5 × 0.5 2.5 0.8 0.5 × 0.5 × 0.5 1.5 0.5 (a) (i) On the grid provided, plot a graph of distance d (vertical axis) against surface area of potato piece. Draw the best-fit straight line through the origin. [4] (ii) Use your graph to state the relationship between the amount of enzyme and the rate of reaction. .......................................................................................................................................[1] (iii) Use your graph to predict the distance d for a piece of potato with a surface area of 3.0 cm2. Mark on the graph how you did this. d = .................................................... cm [2] (b) Name two variables that should be kept constant in this experiment to make the results as reliable as possible. variable 1 .................................................................................................................................. variable 2 .................................................................................................................................. [2] (c) Describe how you could confirm that the gas produced in this reaction is oxygen. test ............................................................................................................................................ observation ............................................................................................................................... [1]
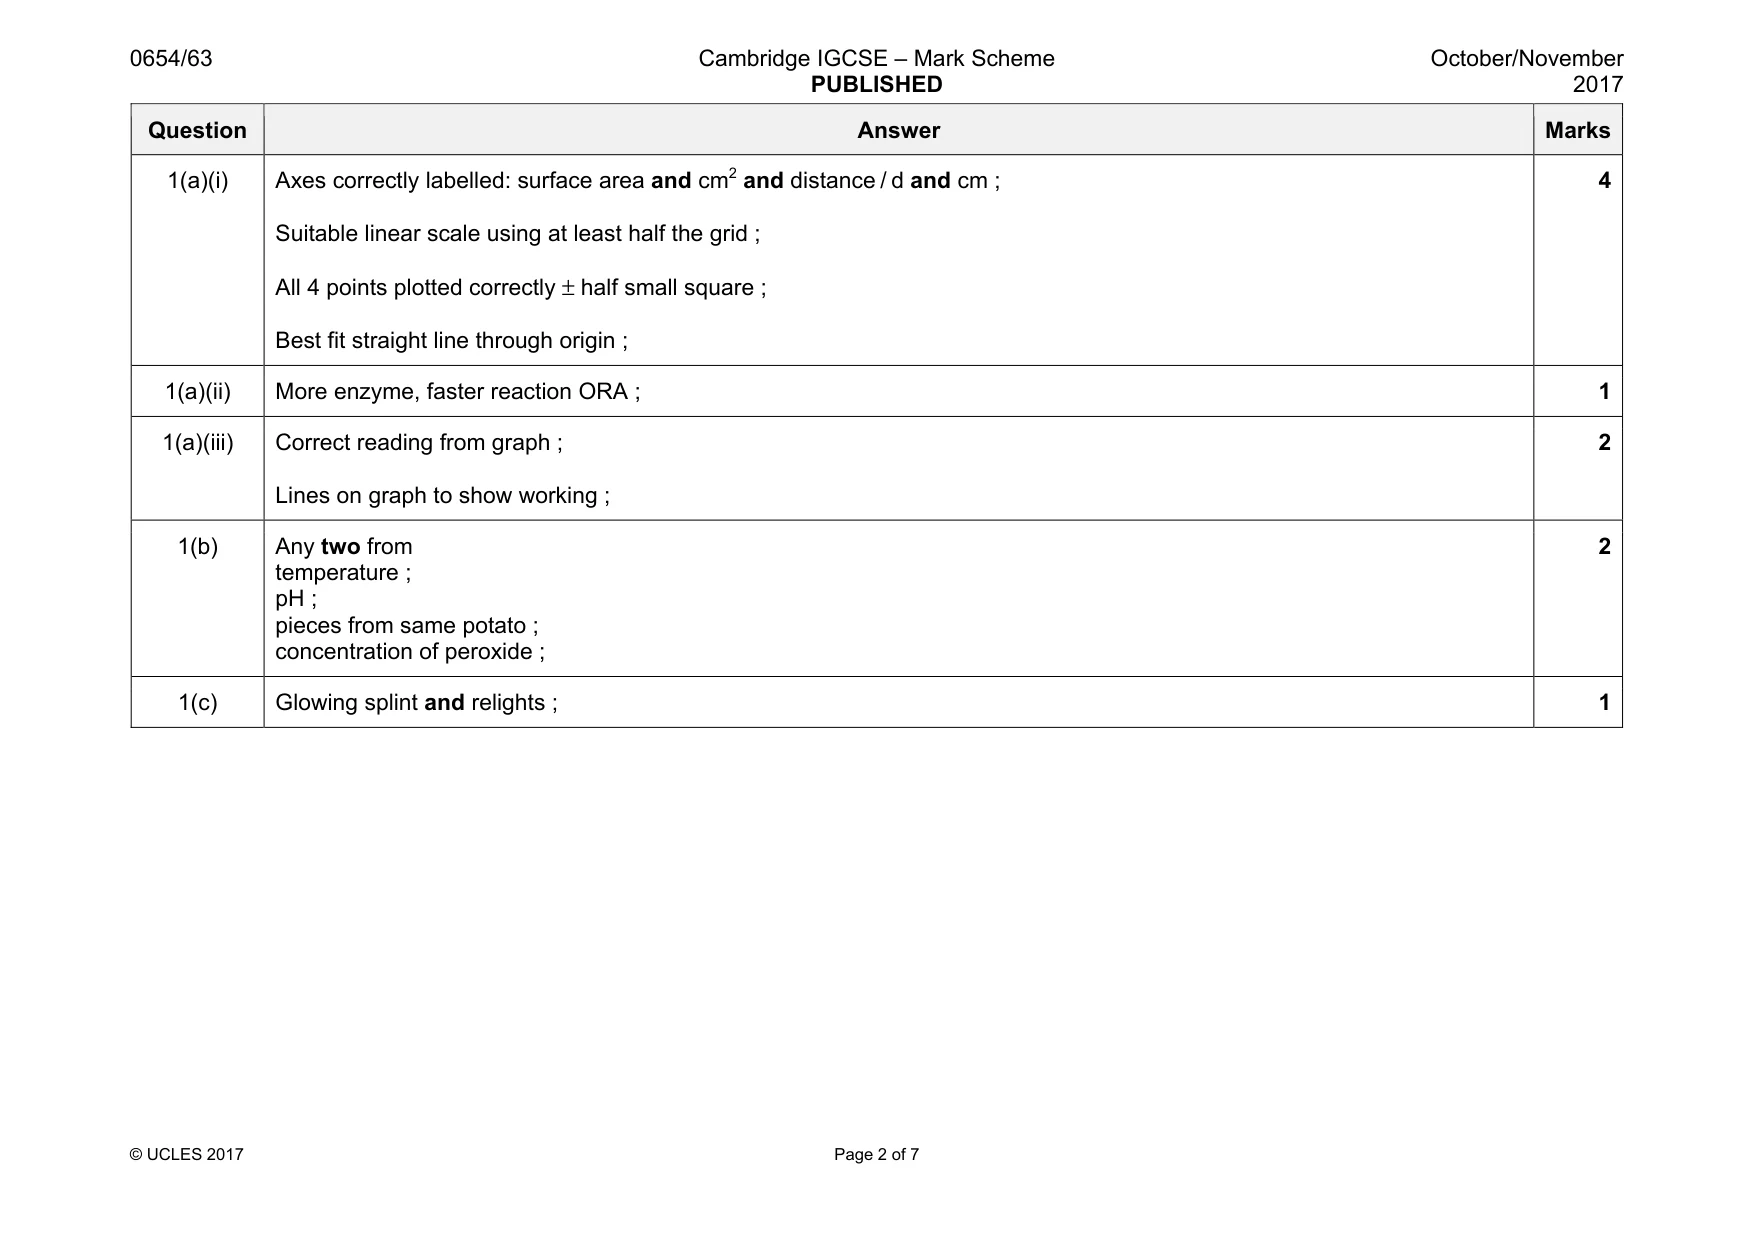
Mark scheme: 1(a)(i) Suitable linear scale using at least half the grid ; All 4 points plotted correctly ± half small square ; Best fit straight line through origin ; 4 1(a)(ii) More enzyme, faster reaction ORA ; 1 1(a)(iii) Correct reading from graph ; Lines on graph to show working ; 2 1(b) Any two from temperature ; pH ; pieces from same potato ; concentration of peroxide ; 2 1(c) Glowing splint and relights ; 1
Q2 · A student carries out reactions with compounds H and J
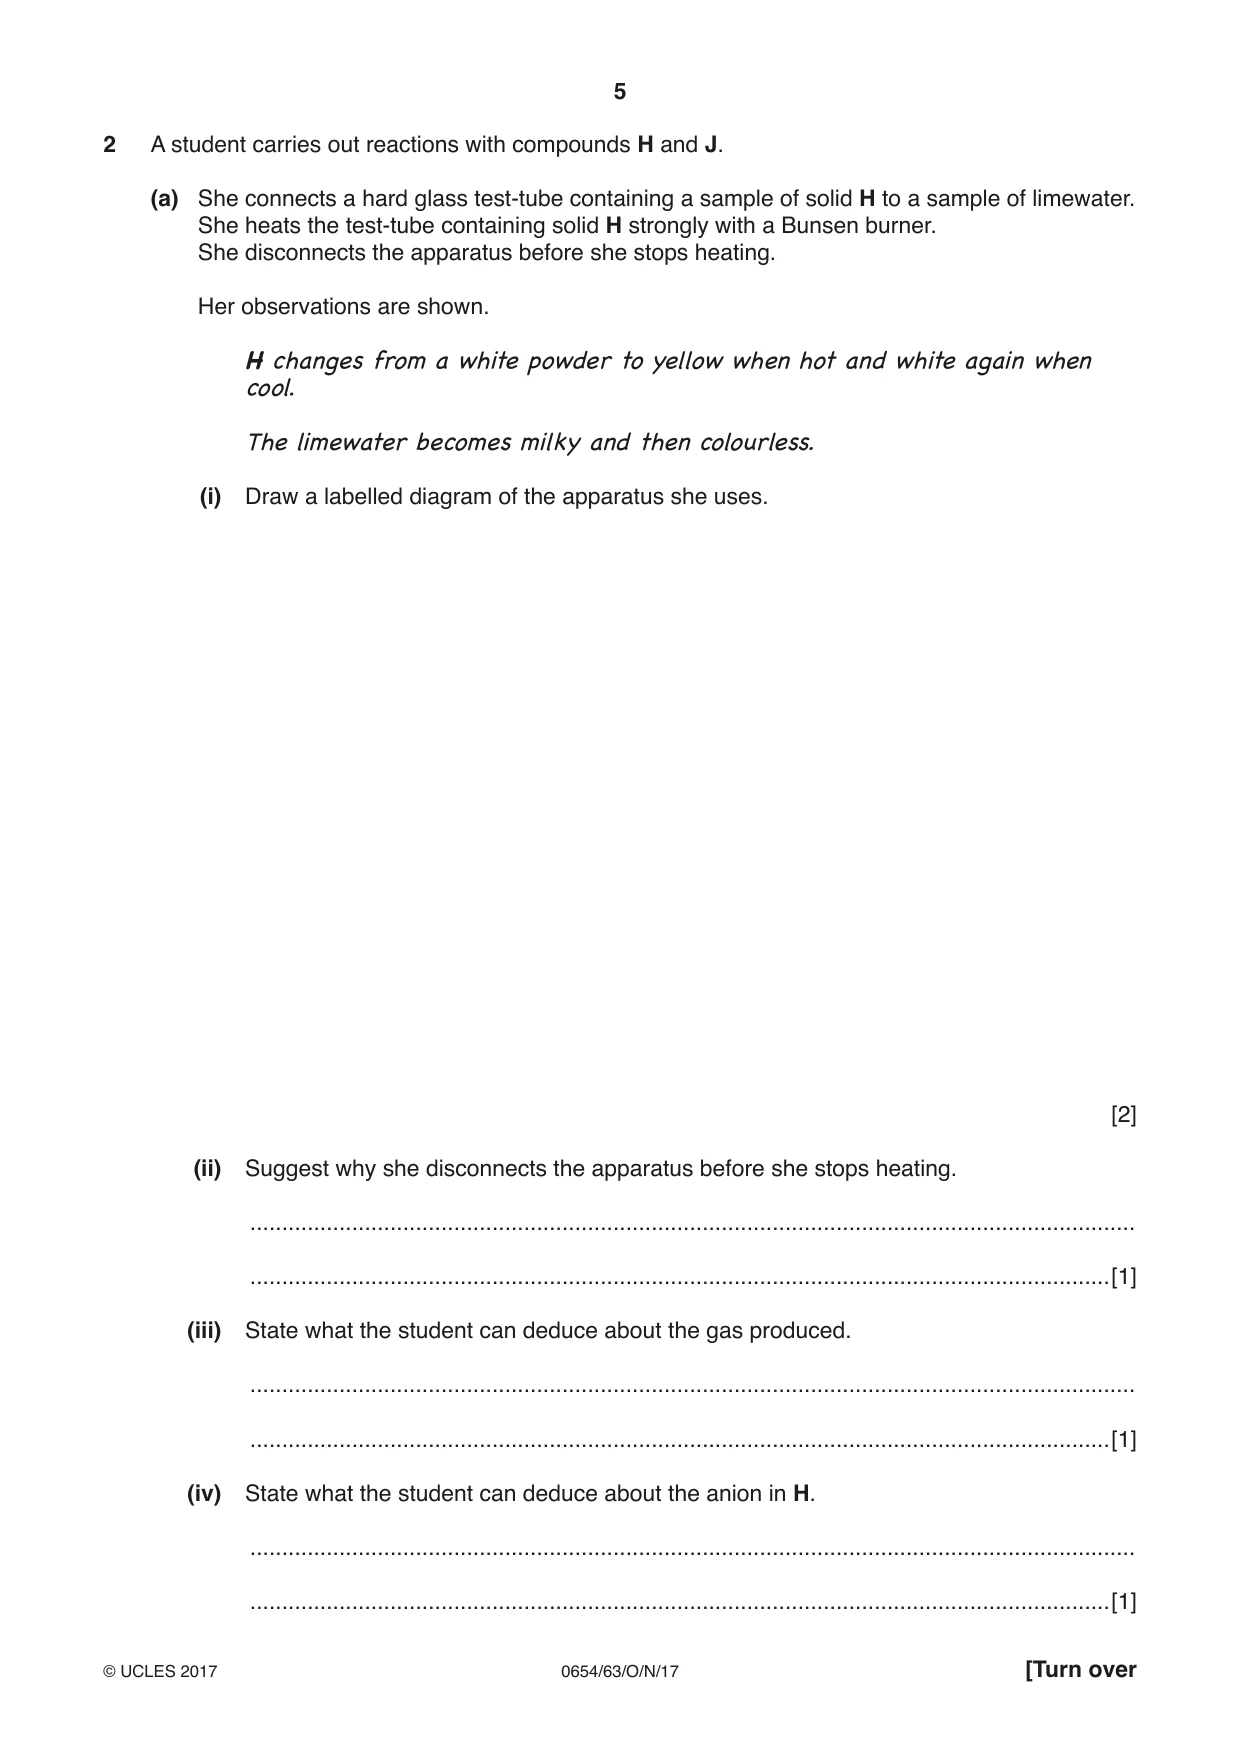
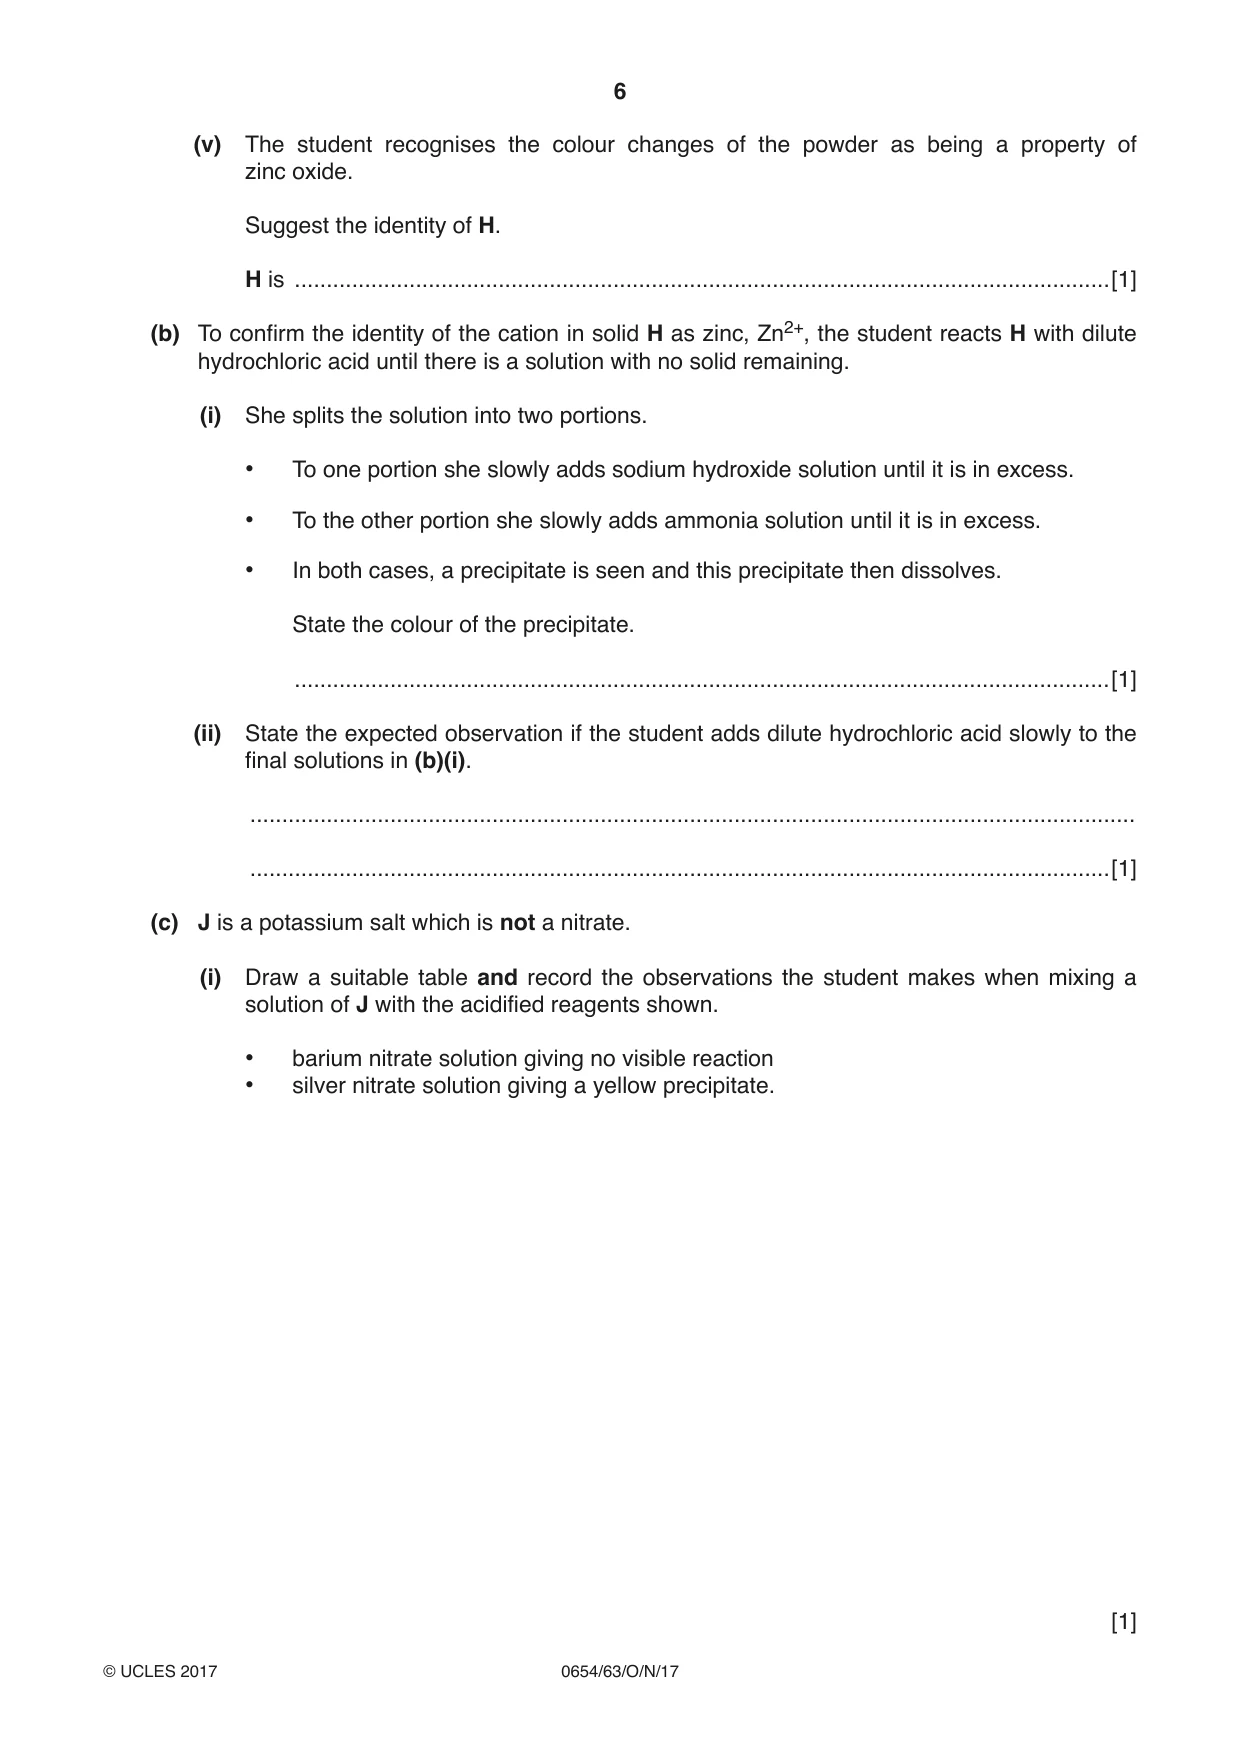
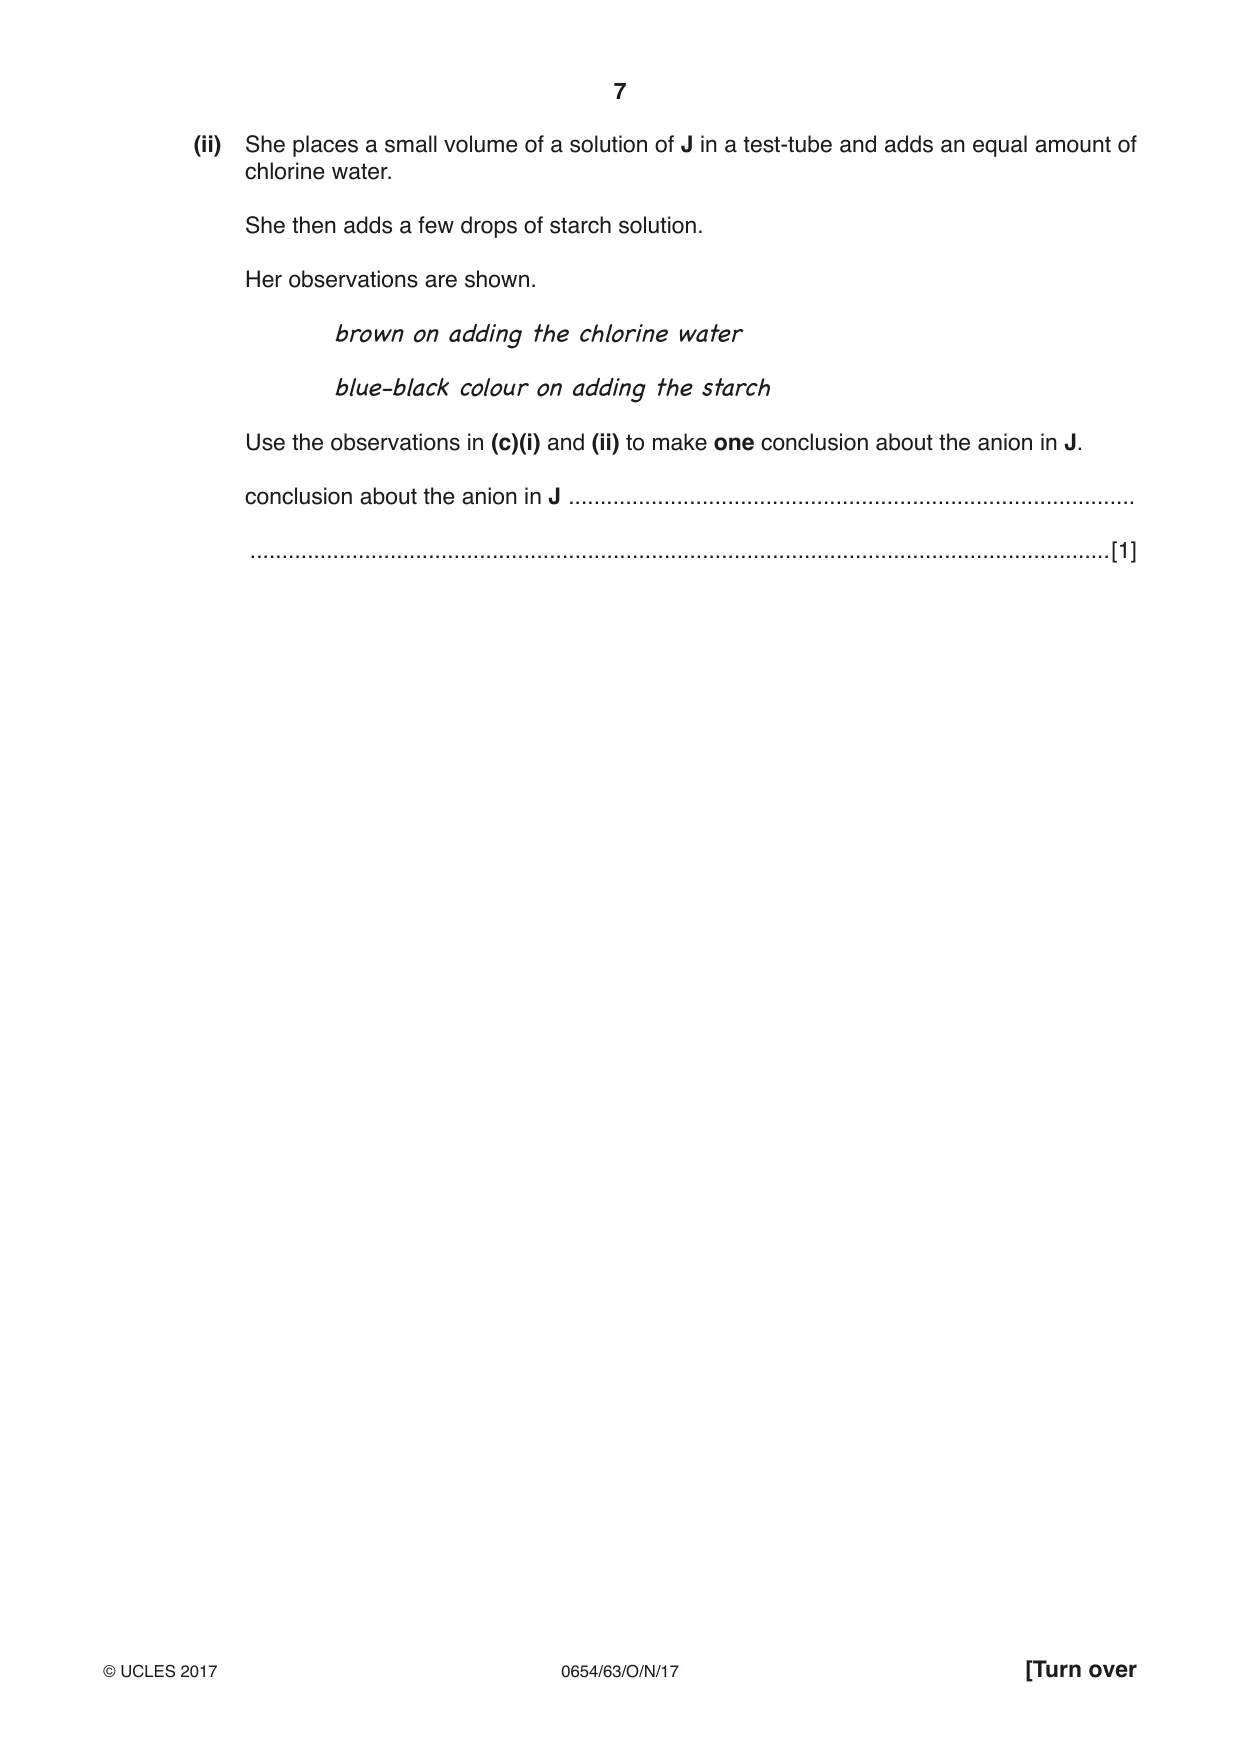
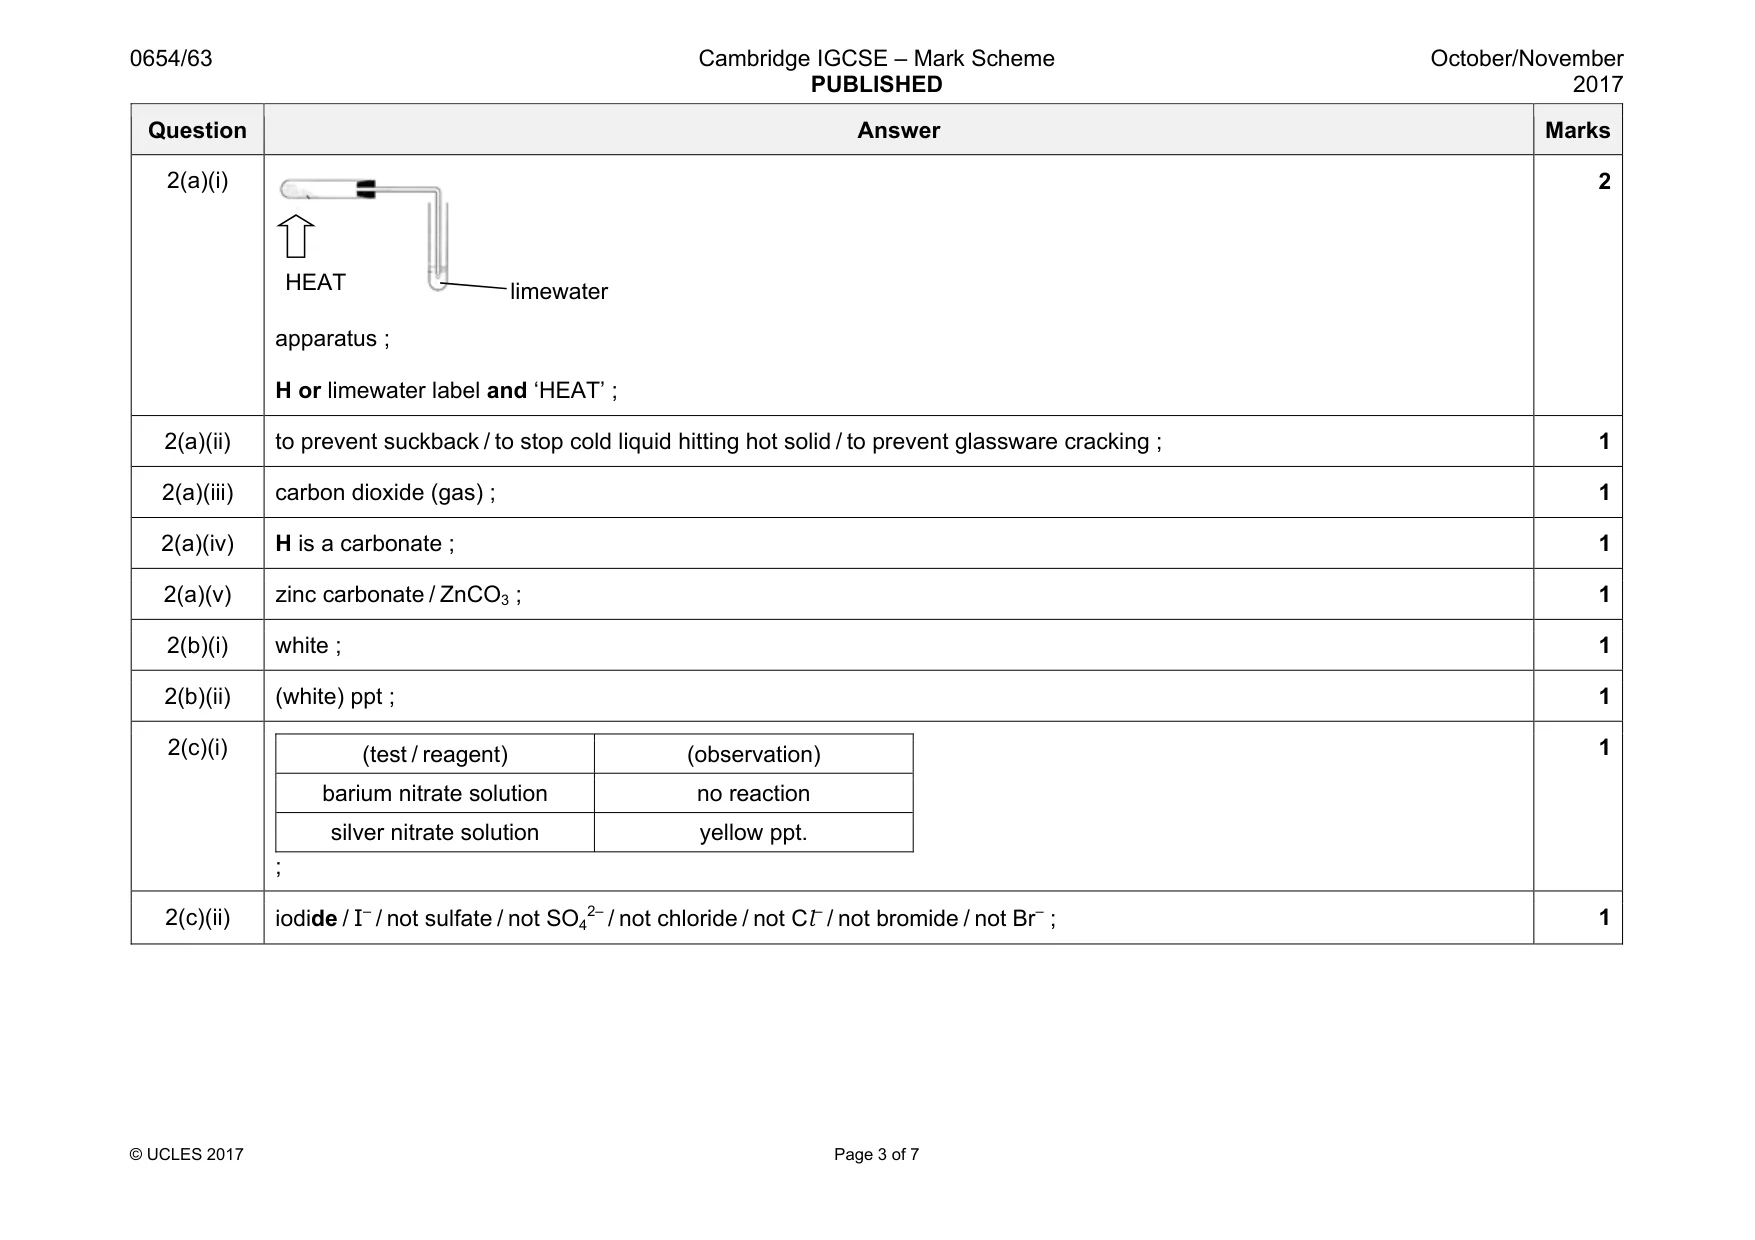
2 A student carries out reactions with compounds H and J. (a) She connects a hard glass test-tube containing a sample of solid H to a sample of limewater. She heats the test-tube containing solid H strongly with a Bunsen burner. She disconnects the apparatus before she stops heating. Her observations are shown. Hchangesfromawhitepowdertoyellowwhenhotandwhiteagainwhen cool. Thelimewaterbecomesmilkyandthencolourless. (i) Draw a labelled diagram of the apparatus she uses. [2] (ii) Suggest why she disconnects the apparatus before she stops heating. ........................................................................................................................................... .......................................................................................................................................[1] (iii) State what the student can deduce about the gas produced. ........................................................................................................................................... .......................................................................................................................................[1] (iv) State what the student can deduce about the anion in H. ........................................................................................................................................... .......................................................................................................................................[1] (v) The student recognises the colour changes of the powder as being a property of zinc oxide. Suggest the identity of H. H is ................................................................................................................................[1] (b) To confirm the identity of the cation in solid H as zinc, Zn2+, the student reacts H with dilute hydrochloric acid until there is a solution with no solid remaining. (i) She splits the solution into two portions. • To one portion she slowly adds sodium hydroxide solution until it is in excess. • To the other portion she slowly adds ammonia solution until it is in excess. • In both cases, a precipitate is seen and this precipitate then dissolves. State the colour of the precipitate. ................................................................................................................................[1] (ii) State the expected observation if the student adds dilute hydrochloric acid slowly to the final solutions in (b)(i). ........................................................................................................................................... .......................................................................................................................................[1] (c) J is a potassium salt which is not a nitrate. (i) Draw a suitable table and record the observations the student makes when mixing a solution of J with the acidified reagents shown. • barium nitrate solution giving no visible reaction • silver nitrate solution giving a yellow precipitate. [1] (ii) She places a small volume of a solution of J in a test-tube and adds an equal amount of chlorine water. She then adds a few drops of starch solution. Her observations are shown. brownonaddingthechlorinewater blue-blackcolouronaddingthestarch Use the observations in (c)(i) and (ii) to make one conclusion about the anion in J. conclusion about the anion in J ......................................................................................... .......................................................................................................................................[1]
Mark scheme: 2(a)(i) apparatus ; H or limewater label and ‘HEAT’ ; 2 2(a)(ii) to prevent suckback / to stop cold liquid hitting hot solid / to prevent glassware cracking ; 1 2(a)(iii) carbon dioxide (gas) ; 1 2(a)(iv) H is a carbonate ; 1 2(a)(v) zinc carbonate / ZnCO3 ; 1 2(b)(i) white ; 1 2(b)(ii) (white) ppt ; 1 2(c)(i) (test / reagent) (observation) barium nitrate solution no reaction silver nitrate solution yellow ppt. ; 1 2(c)(ii) iodide / I– / not sulfate / not SO4 2– / not chloride / not Cl– / not bromide / not Br– ; 1 HEAT limewater
Q3 · A student measures the focal length of a convex lens
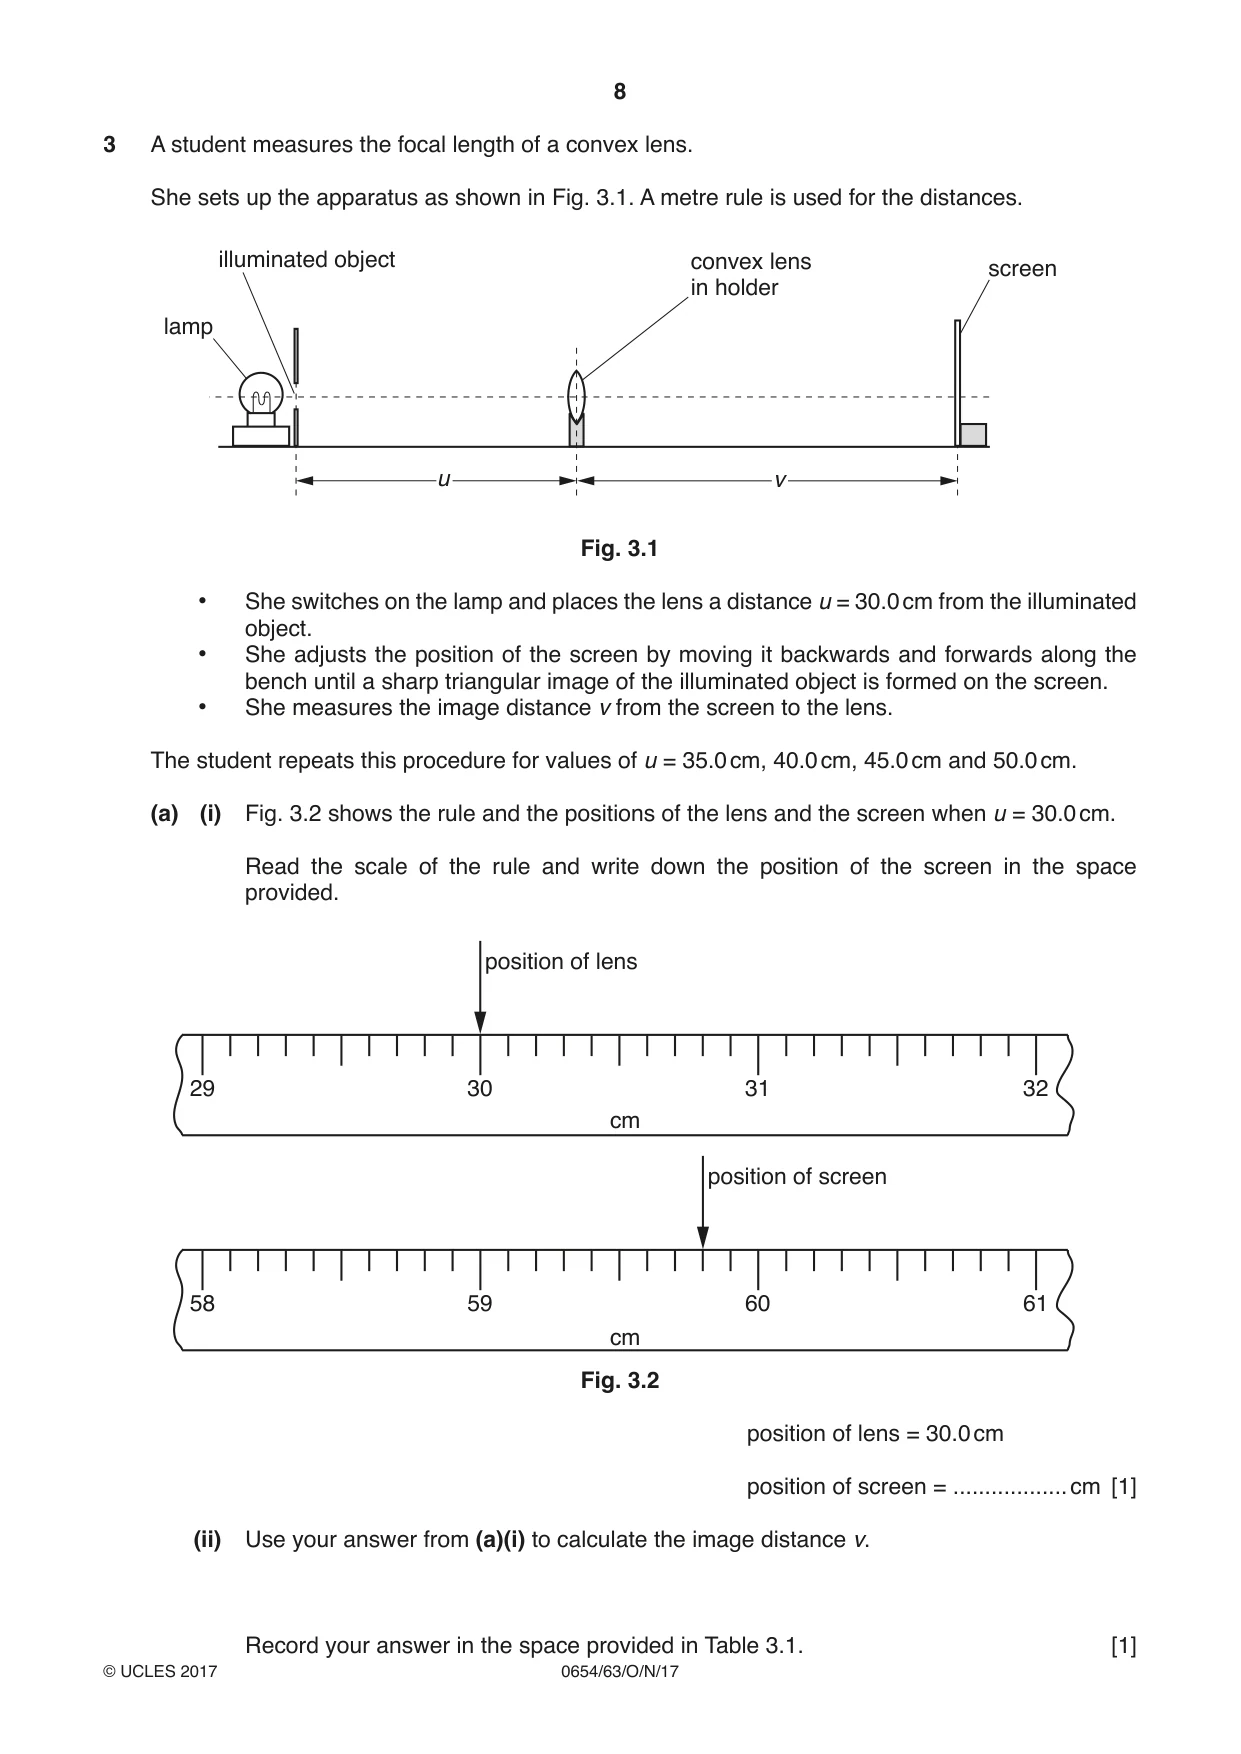
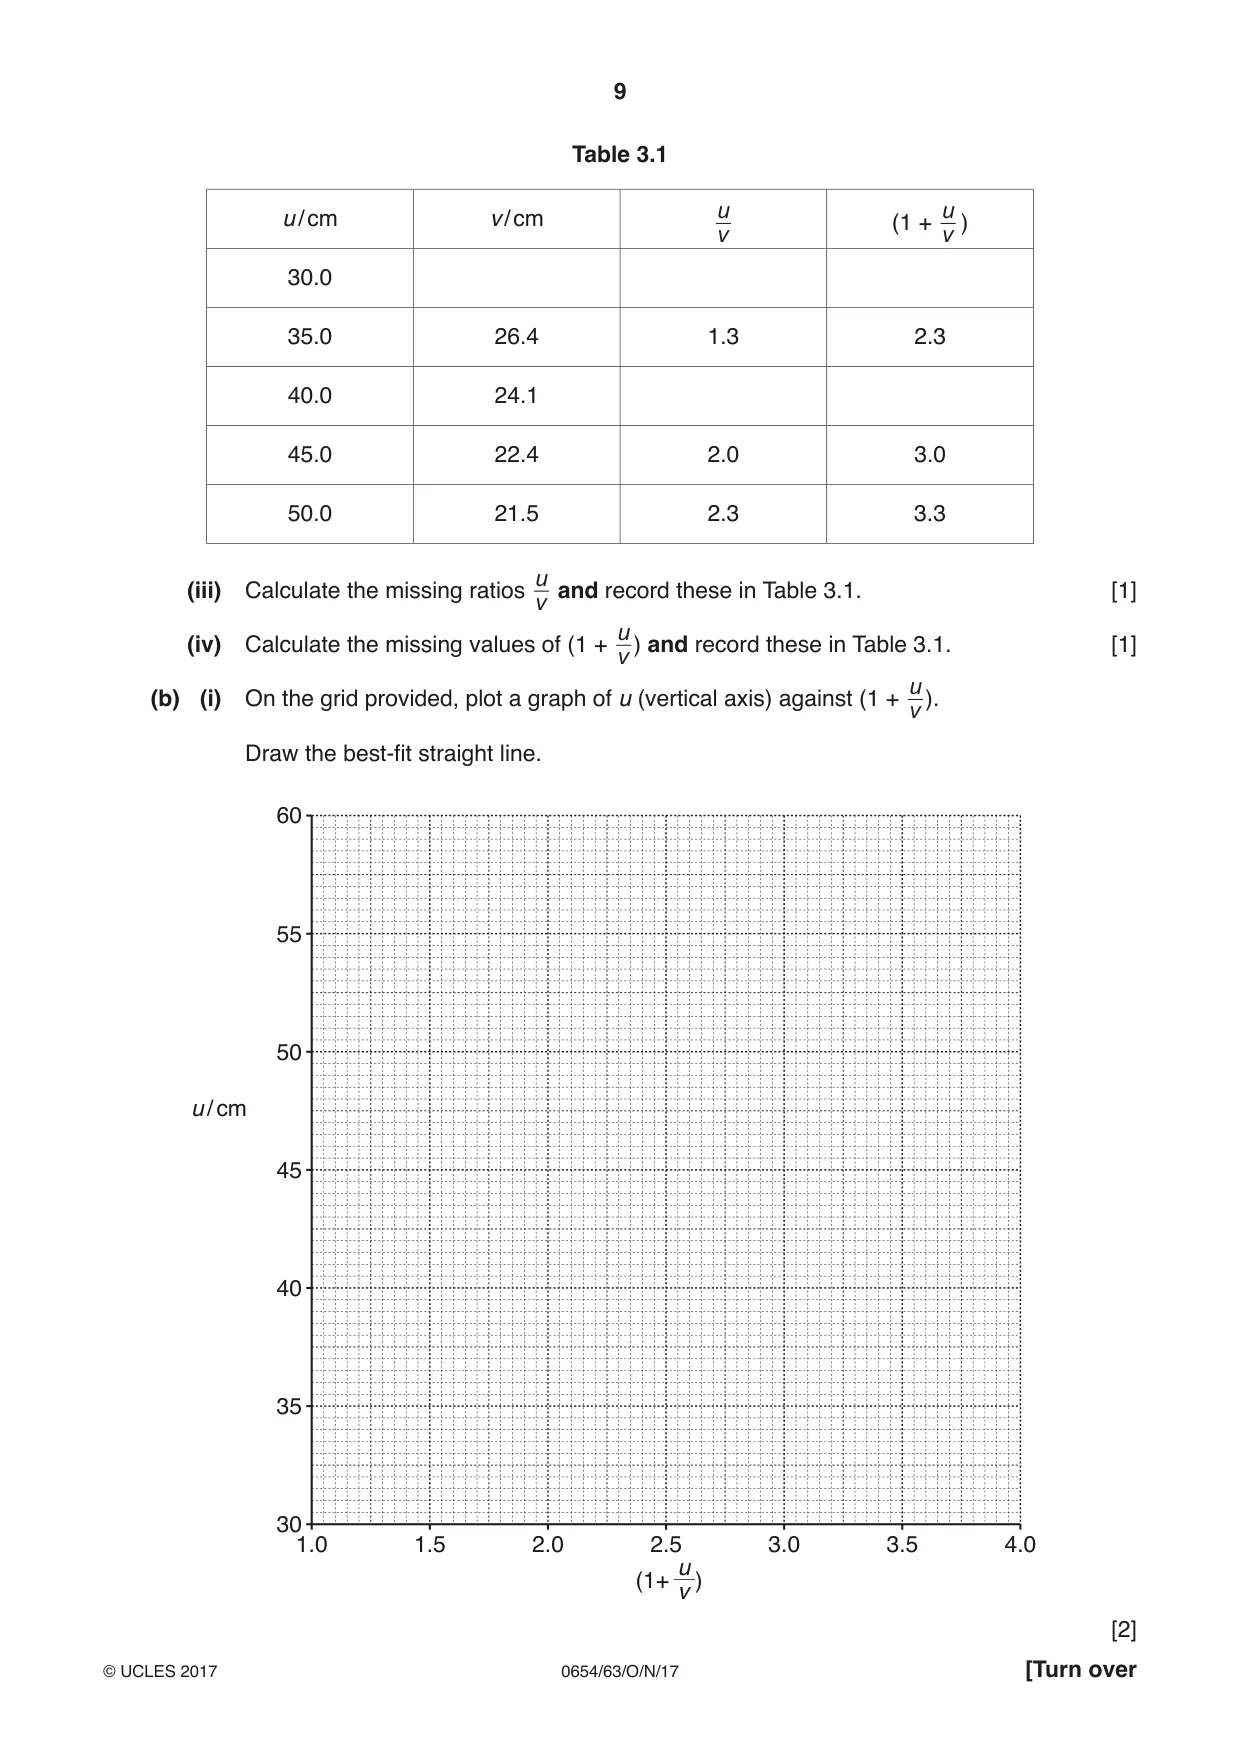
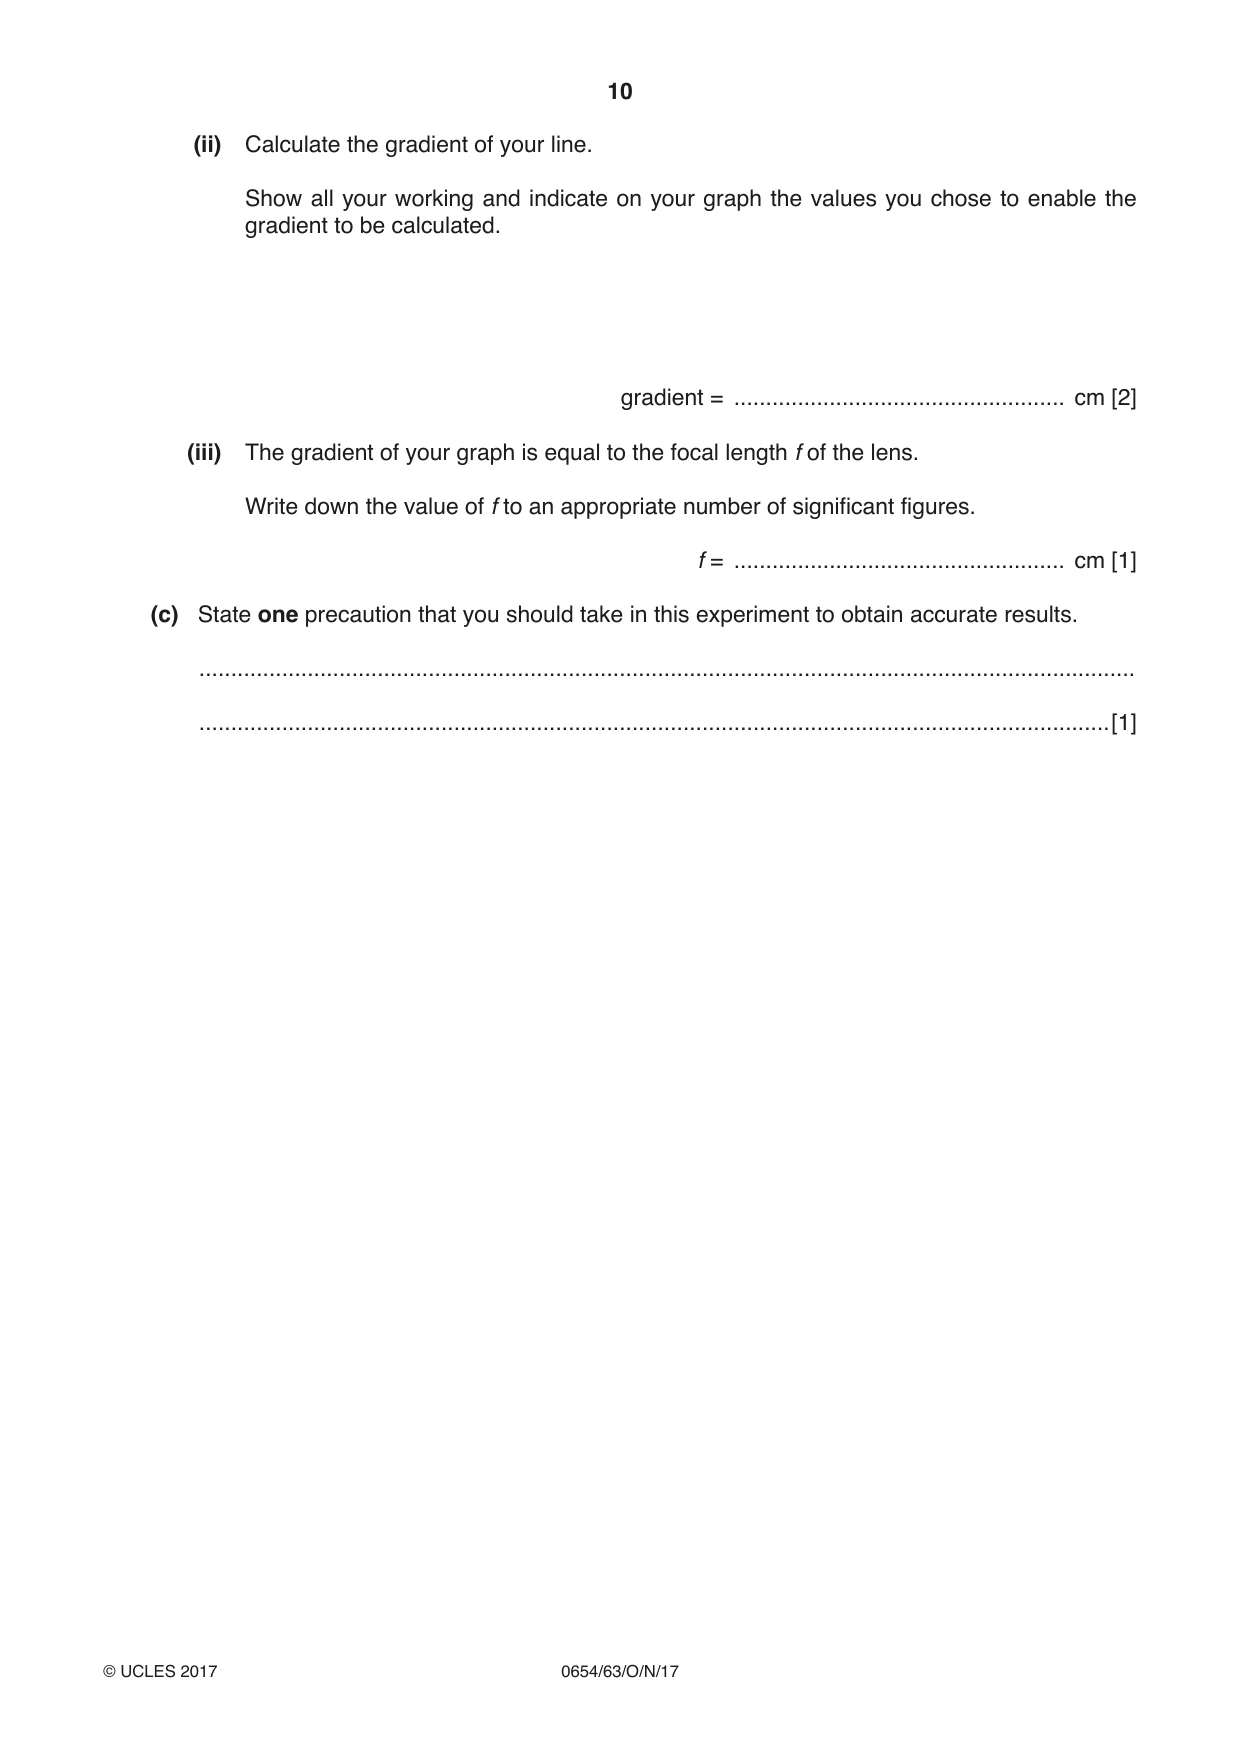
3 A student measures the focal length of a convex lens. She sets up the apparatus as shown in Fig. 3.1. A metre rule is used for the distances. illuminated object convex lens screen in holder lamp u v Fig. 3.1 • She switches on the lamp and places the lens a distance u = 30.0 cm from the illuminated object. • She adjusts the position of the screen by moving it backwards and forwards along the bench until a sharp triangular image of the illuminated object is formed on the screen. • She measures the image distance v from the screen to the lens. The student repeats this procedure for values of u = 35.0 cm, 40.0 cm, 45.0 cm and 50.0 cm. (a) (i) Fig. 3.2 shows the rule and the positions of the lens and the screen when u = 30.0 cm. Read the scale of the rule and write down the position of the screen in the space provided. position of lens 29 30 31 32 cm position of screen 58 59 60 61 cm Fig. 3.2 position of lens = 30.0 cm position of screen = .................. cm [1] (ii) Use your answer from (a)(i) to calculate the image distance v. Table 3.1 u / cm v / cm u (1 + u ) v v 30.0 35.0 26.4 1.3 2.3 40.0 24.1 45.0 22.4 2.0 3.0 50.0 21.5 2.3 3.3 u (iii) Calculate the missing ratios and record these in Table 3.1. [1] v u (iv) Calculate the missing values of (1 + ) and record these in Table 3.1. [1] v u(b) (i) On the grid provided, plot a graph of u (vertical axis) against (1 + ). v Draw the best-fit straight line. 60 55 50 u / cm 45 40 35 30 1.0 1.5 2.0 2.5 3.0 3.5 4.0 u (1+ ) v [2] (ii) Calculate the gradient of your line. Show all your working and indicate on your graph the values you chose to enable the gradient to be calculated. gradient = .................................................... cm [2] (iii) The gradient of your graph is equal to the focal length f of the lens. Write down the value of f to an appropriate number of significant figures. f = .................................................... cm [1] (c) State one precaution that you should take in this experiment to obtain accurate results. ................................................................................................................................................... ...............................................................................................................................................[1]
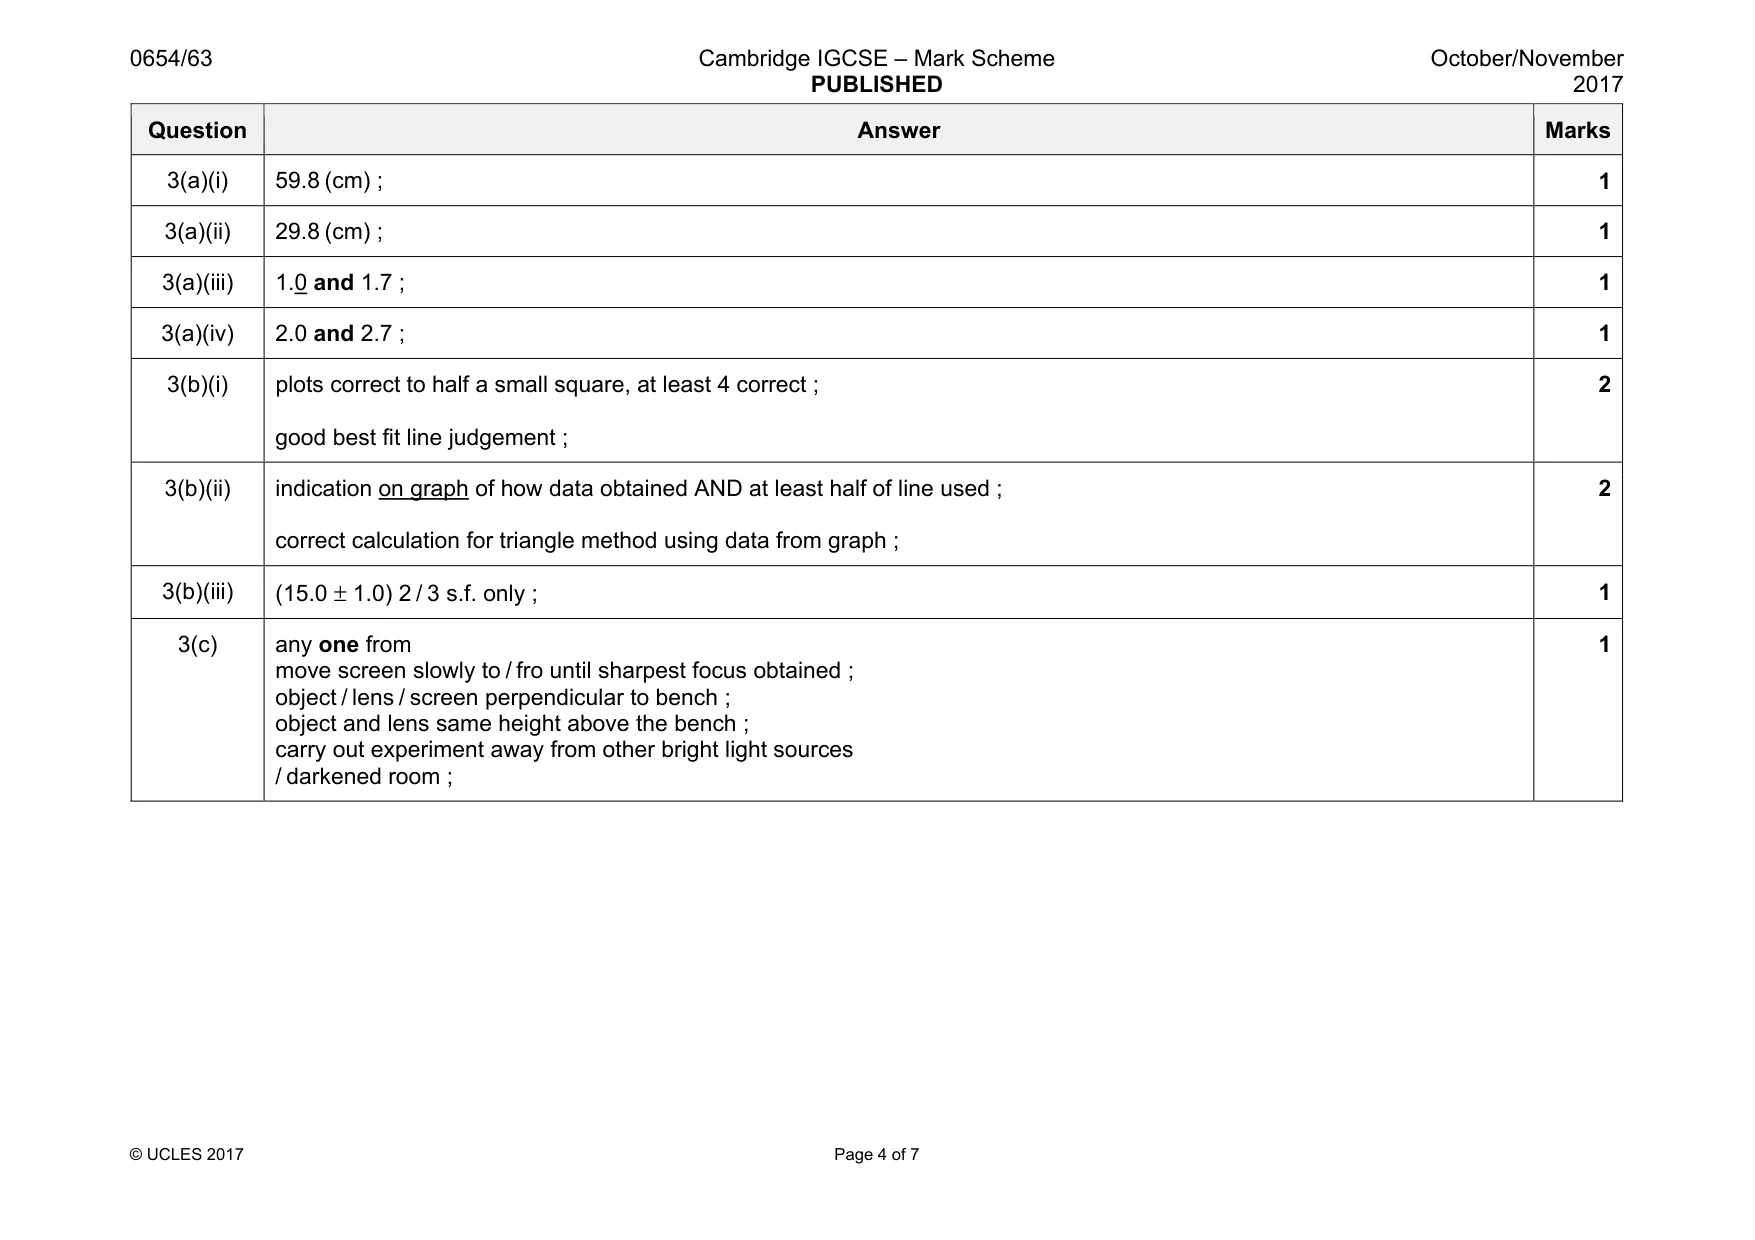
Mark scheme: 3(a)(i) 59.8 (cm) ; 1 3(a)(ii) 29.8 (cm) ; 1 3(a)(iii) 1.0 and 1.7 ; 1 3(a)(iv) 2.0 and 2.7 ; 1 3(b)(i) plots correct to half a small square, at least 4 correct ; good best fit line judgement ; 2 3(b)(ii) indication on graph of how data obtained AND at least half of line used ; correct calculation for triangle method using data from graph ; 2 3(b)(iii) (15.0 ± 1.0) 2 / 3 s.f. only ; 1 3(c) any one from move screen slowly to / fro until sharpest focus obtained ; object / lens / screen perpendicular to bench ; object and lens same height above the bench ; carry out experiment away from other bright light sources / darkened room ; 1
Q4 · A student investigates the effect of temperature on the growth of seedlings
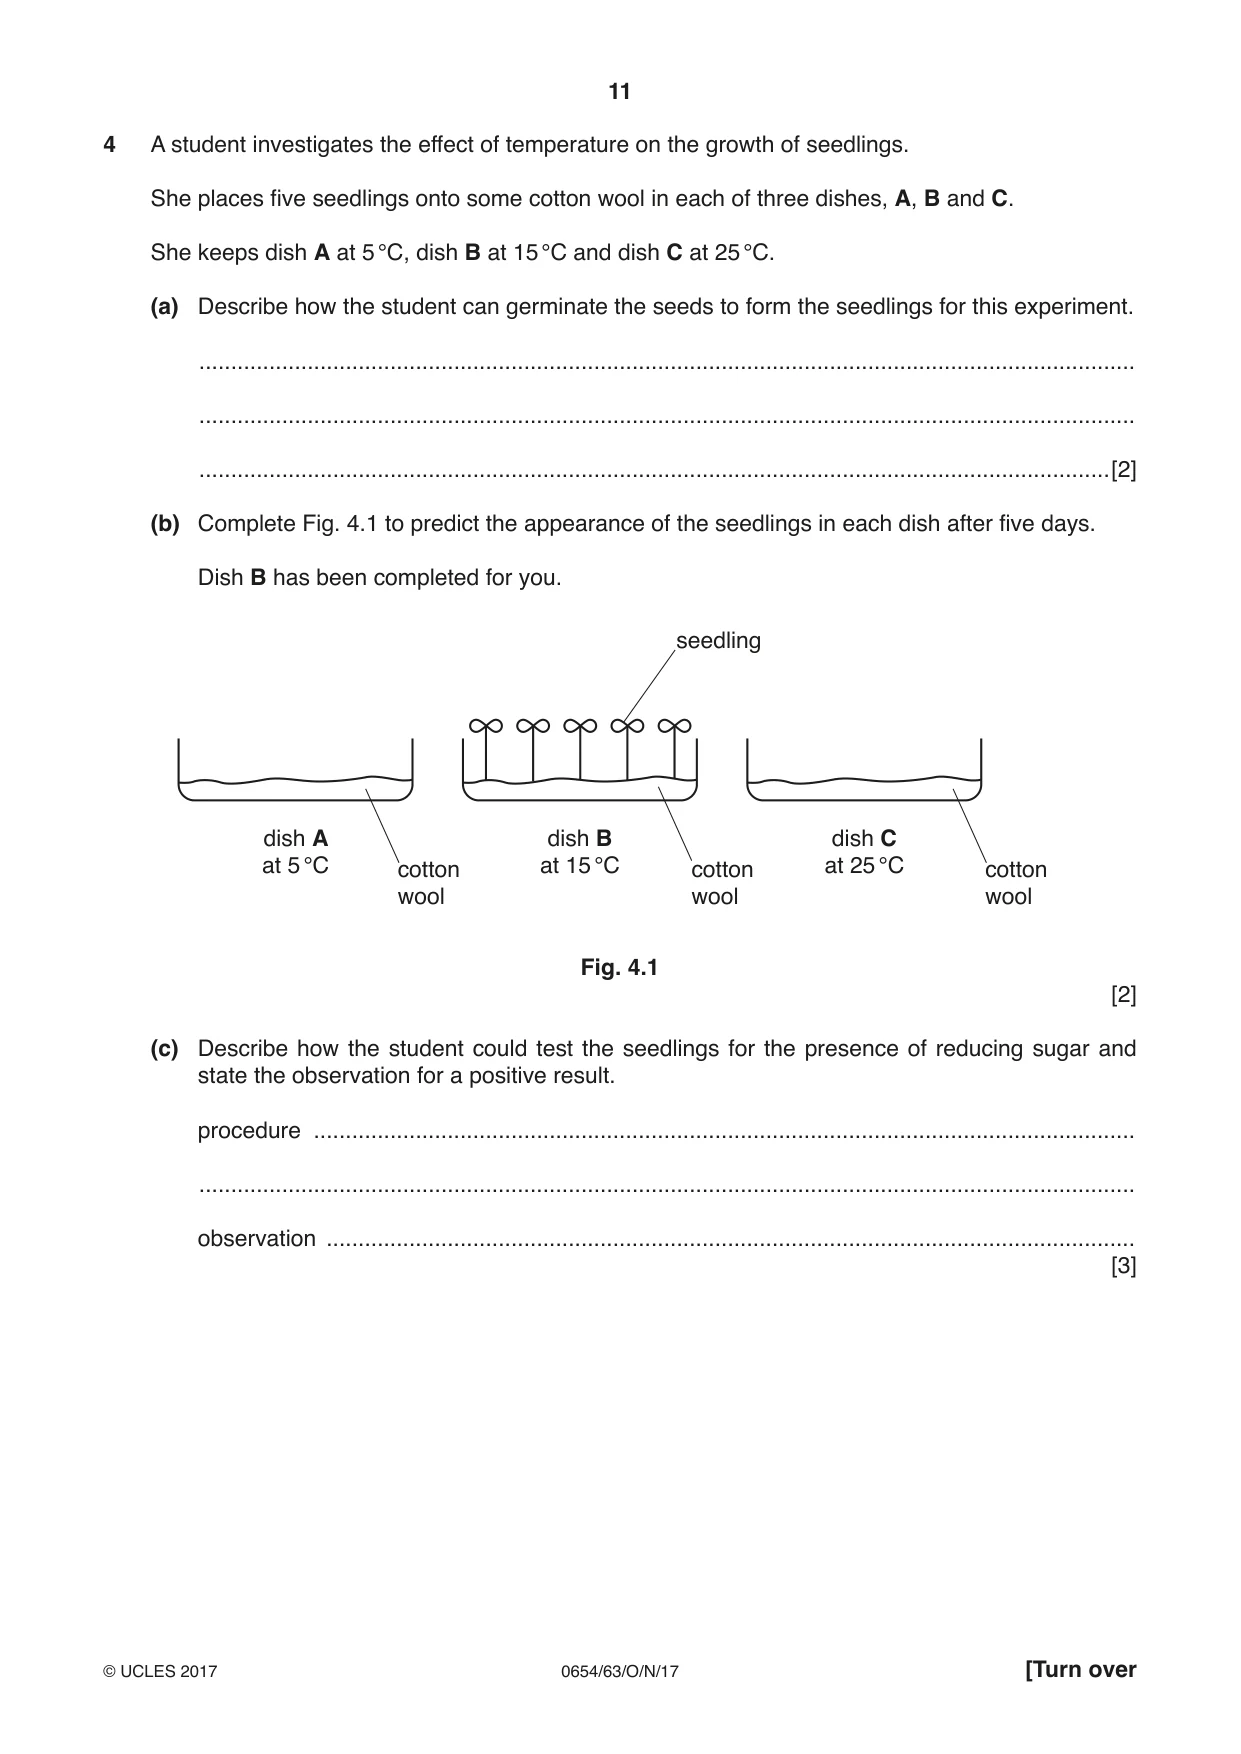
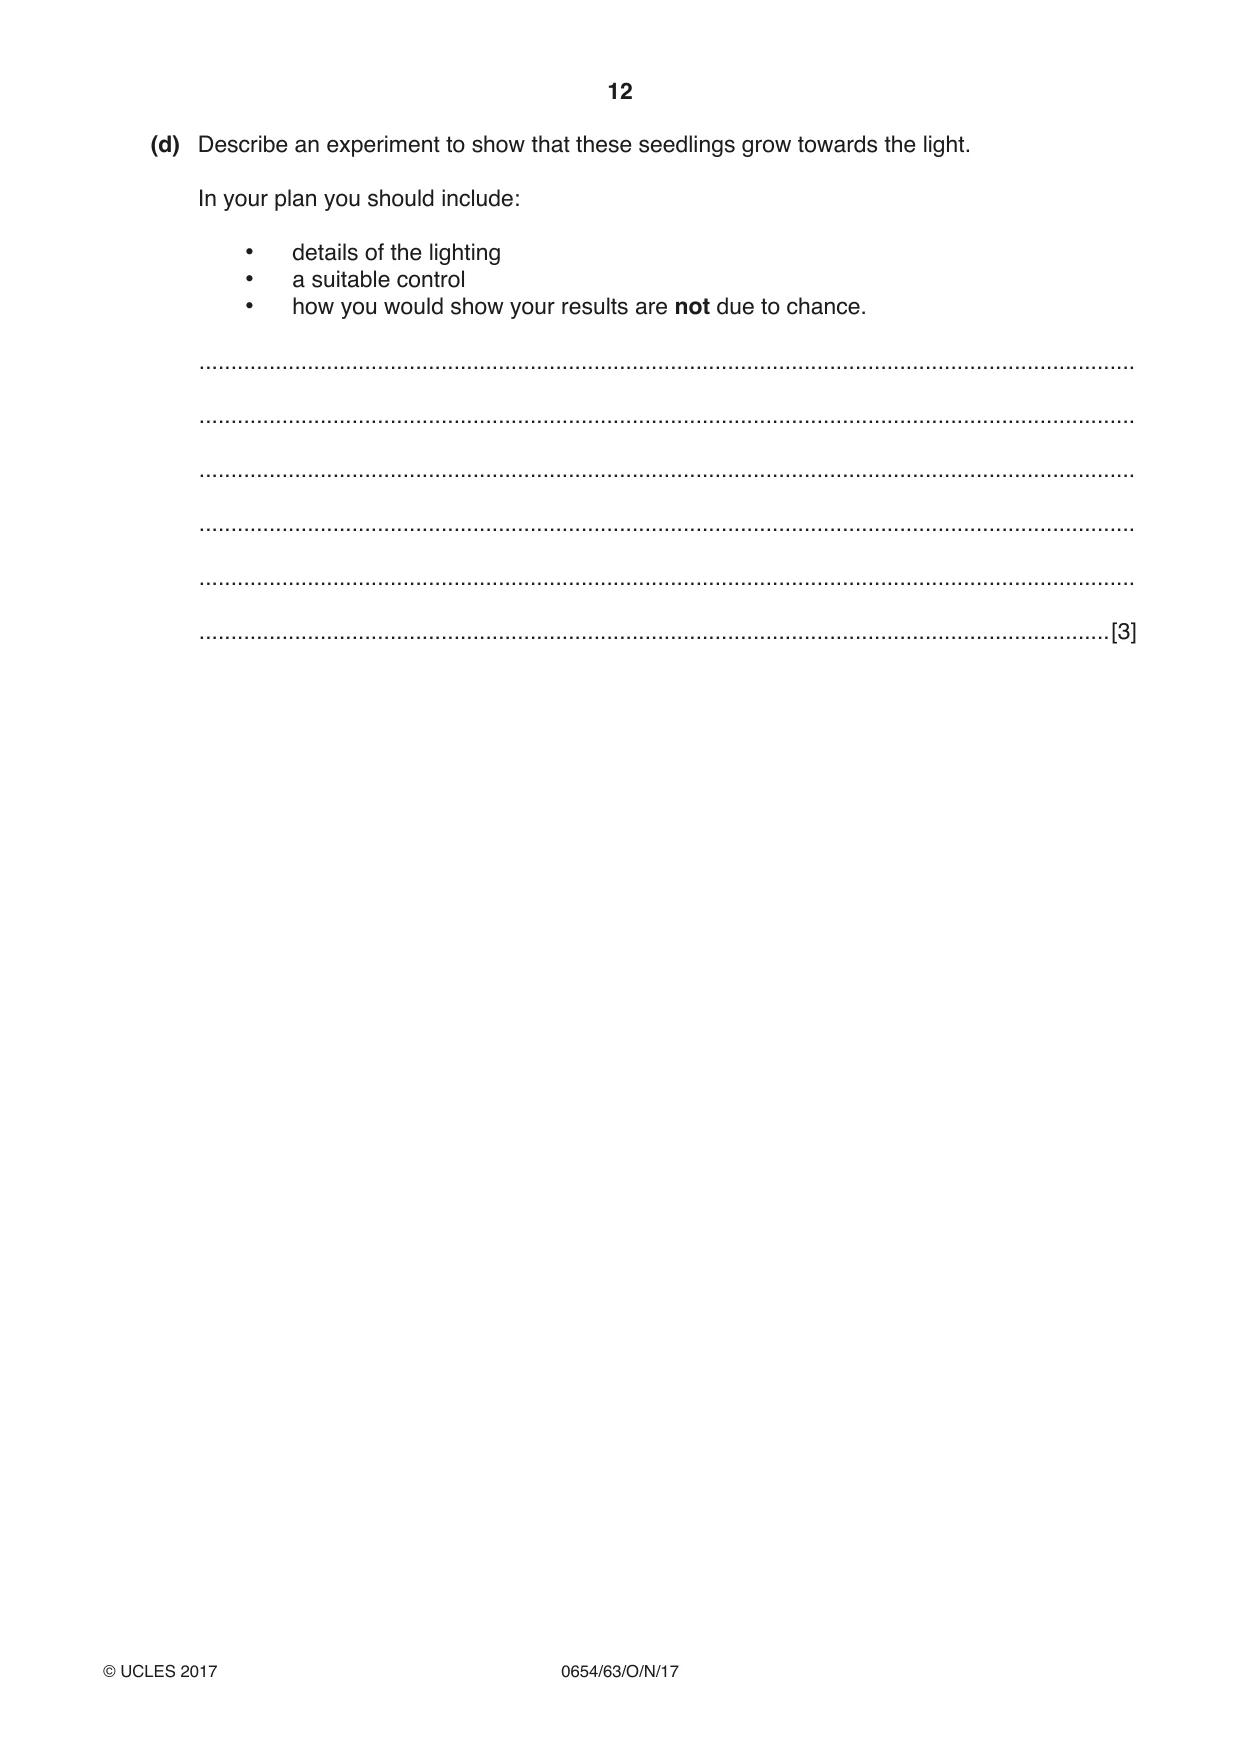
4 A student investigates the effect of temperature on the growth of seedlings. She places five seedlings onto some cotton wool in each of three dishes, A, B and C. She keeps dish A at 5 °C, dish B at 15 °C and dish C at 25 °C. (a) Describe how the student can germinate the seeds to form the seedlings for this experiment. ................................................................................................................................................... ................................................................................................................................................... ...............................................................................................................................................[2] (b) Complete Fig. 4.1 to predict the appearance of the seedlings in each dish after five days. Dish B has been completed for you. seedling dish A dish B dish C at 5 °C cotton at 15 °C cotton at 25 °C cotton wool wool wool Fig. 4.1 [2] (c) Describe how the student could test the seedlings for the presence of reducing sugar and state the observation for a positive result. procedure ................................................................................................................................. ................................................................................................................................................... observation ............................................................................................................................... [3] (d) Describe an experiment to show that these seedlings grow towards the light. In your plan you should include: • details of the lighting • a suitable control • how you would show your results are not due to chance. ................................................................................................................................................... ................................................................................................................................................... ................................................................................................................................................... ................................................................................................................................................... ................................................................................................................................................... ...............................................................................................................................................[3]
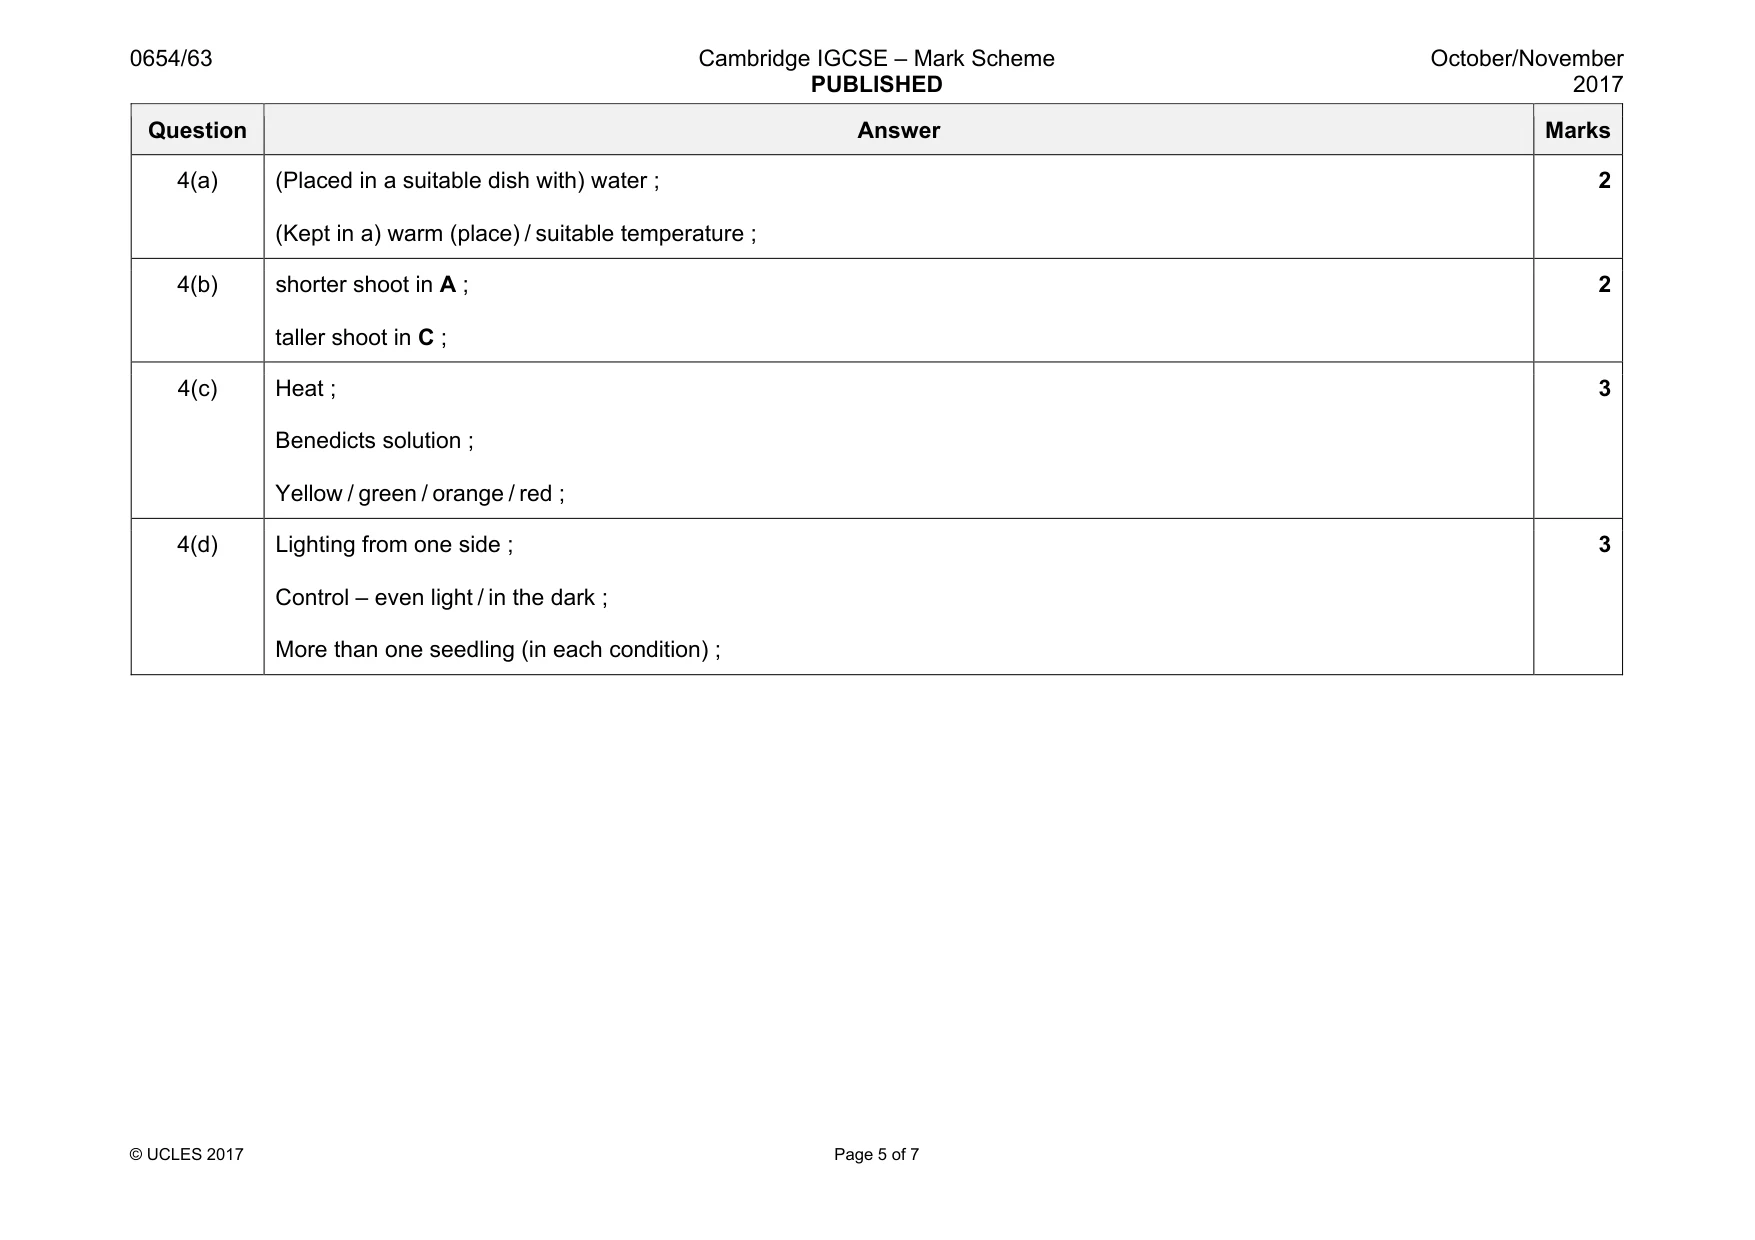
Mark scheme: 4(a) (Placed in a suitable dish with) water ; (Kept in a) warm (place) / suitable temperature ; 2 4(b) shorter shoot in A ; taller shoot in C ; 2 4(c) Heat ; Benedicts solution ; Yellow / green / orange / red ; 3 4(d) Lighting from one side ; Control – even light / in the dark ; More than one seedling (in each condition) ; 3
Q5 · A class is investigating the rusting of iron and steel
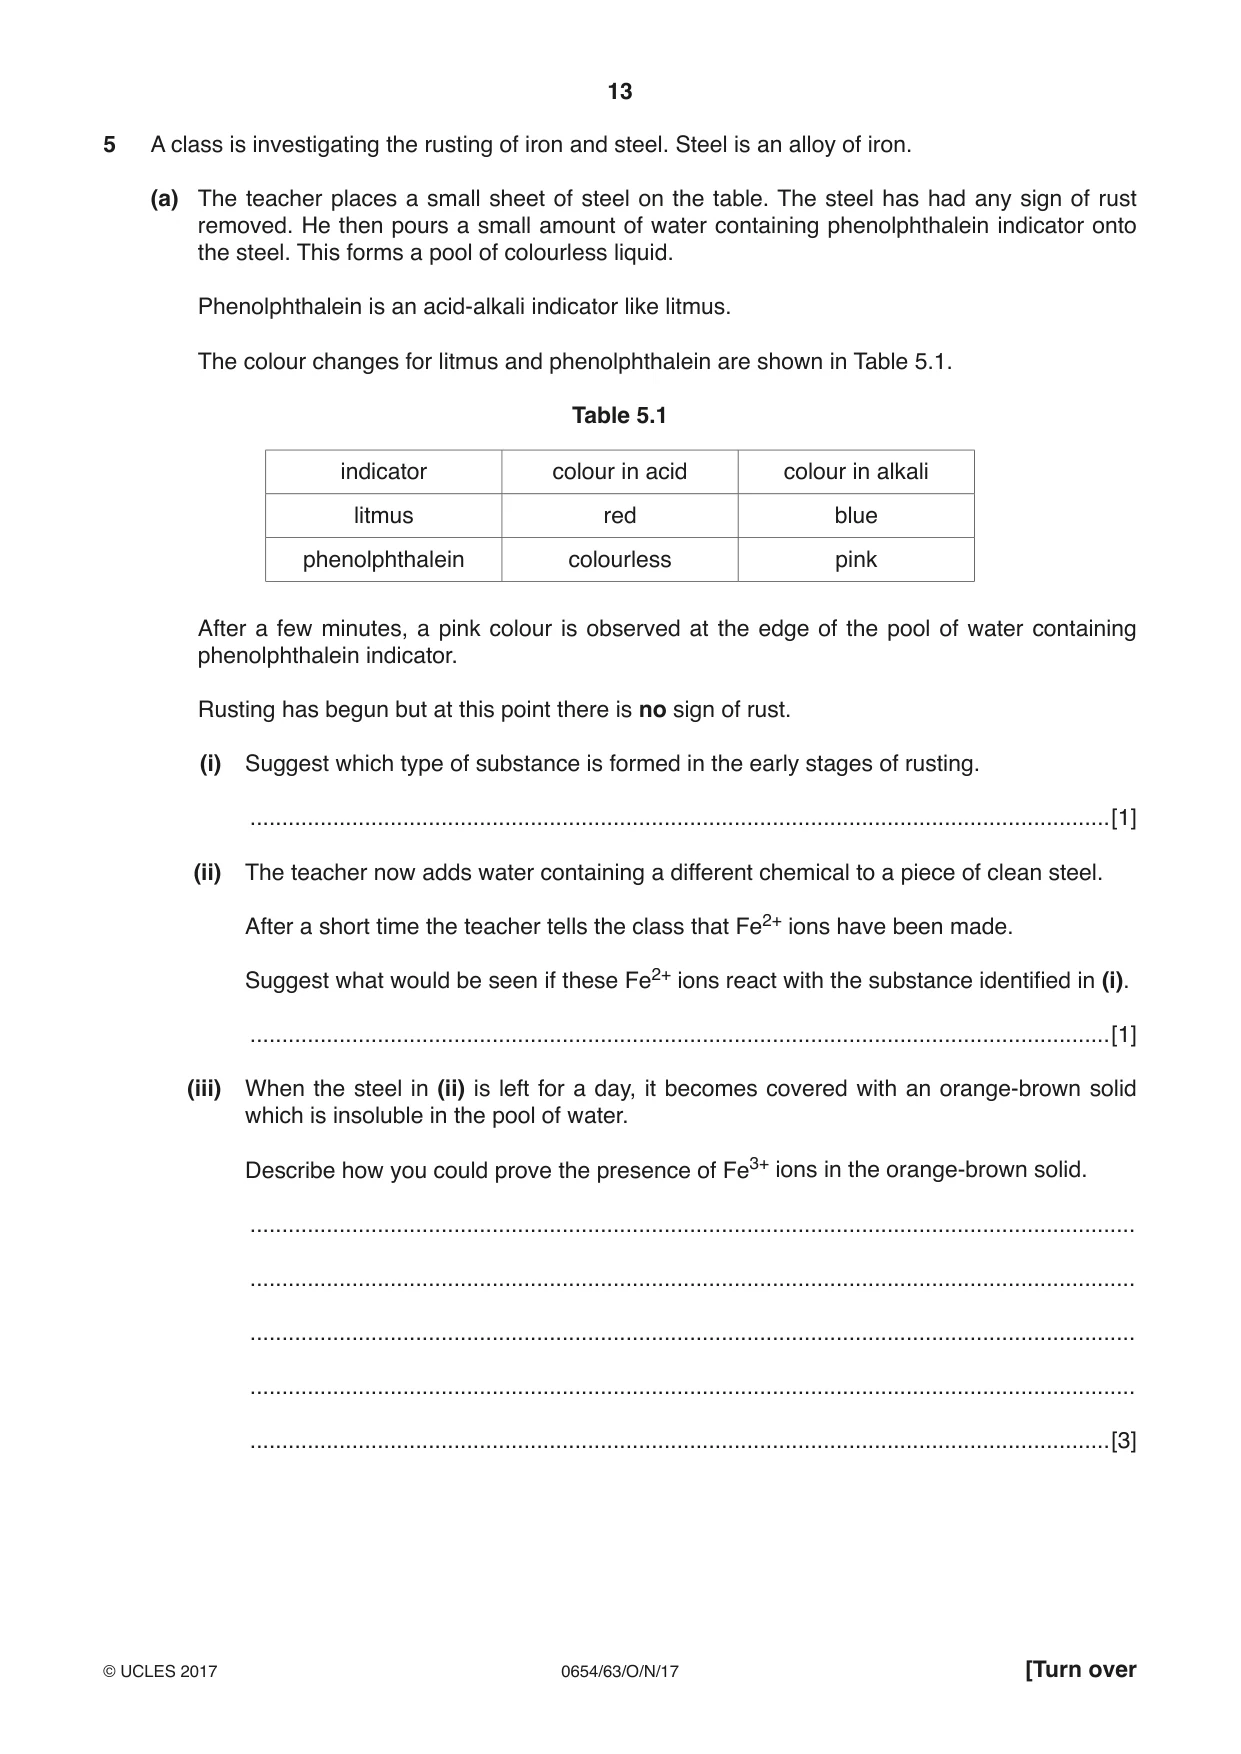
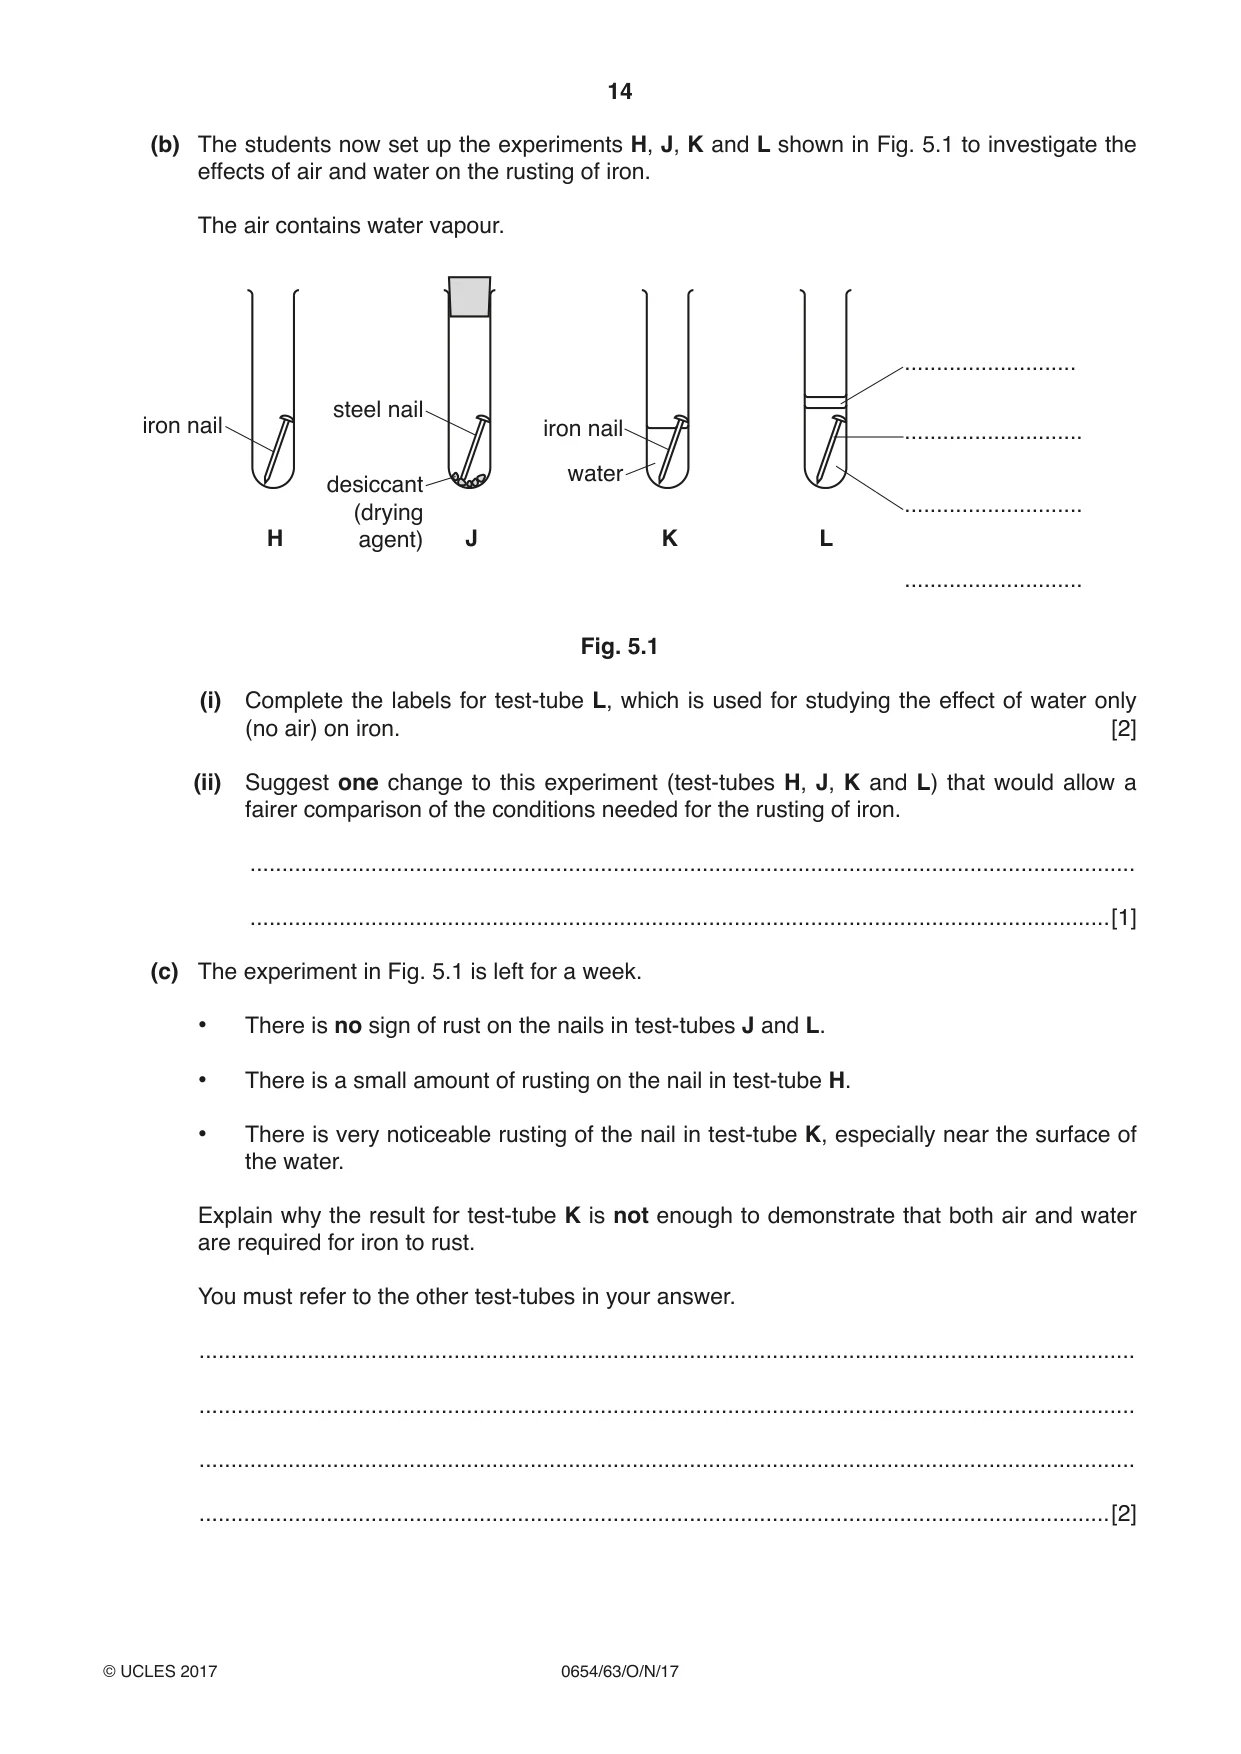
5 A class is investigating the rusting of iron and steel. Steel is an alloy of iron. (a) The teacher places a small sheet of steel on the table. The steel has had any sign of rust removed. He then pours a small amount of water containing phenolphthalein indicator onto the steel. This forms a pool of colourless liquid. Phenolphthalein is an acid-alkali indicator like litmus. The colour changes for litmus and phenolphthalein are shown in Table 5.1. Table 5.1 indicator colour in acid colour in alkali litmus red blue phenolphthalein colourless pink After a few minutes, a pink colour is observed at the edge of the pool of water containing phenolphthalein indicator. Rusting has begun but at this point there is no sign of rust. (i) Suggest which type of substance is formed in the early stages of rusting. .......................................................................................................................................[1] (ii) The teacher now adds water containing a different chemical to a piece of clean steel. After a short time the teacher tells the class that Fe2+ ions have been made. Suggest what would be seen if these Fe2+ ions react with the substance identified in (i). .......................................................................................................................................[1] (iii) When the steel in (ii) is left for a day, it becomes covered with an orange-brown solid which is insoluble in the pool of water. Describe how you could prove the presence of Fe3+ ions in the orange-brown solid. ........................................................................................................................................... ........................................................................................................................................... ........................................................................................................................................... ........................................................................................................................................... .......................................................................................................................................[3] (b) The students now set up the experiments H, J, K and L shown in Fig. 5.1 to investigate the effects of air and water on the rusting of iron. The air contains water vapour. ........................... steel nail iron nail iron nail ............................ water desiccant ............................ (drying H agent) J K L ............................ Fig. 5.1 (i) Complete the labels for test-tube L, which is used for studying the effect of water only (no air) on iron. [2] (ii) Suggest one change to this experiment (test-tubes H, J, K and L) that would allow a fairer comparison of the conditions needed for the rusting of iron. ........................................................................................................................................... .......................................................................................................................................[1] (c) The experiment in Fig. 5.1 is left for a week. • There is no sign of rust on the nails in test-tubes J and L. • There is a small amount of rusting on the nail in test-tube H. • There is very noticeable rusting of the nail in test-tube K, especially near the surface of the water. Explain why the result for test-tube K is not enough to demonstrate that both air and water are required for iron to rust. You must refer to the other test-tubes in your answer. ................................................................................................................................................... ................................................................................................................................................... ................................................................................................................................................... ...............................................................................................................................................[2] Please turn over for Question 6.
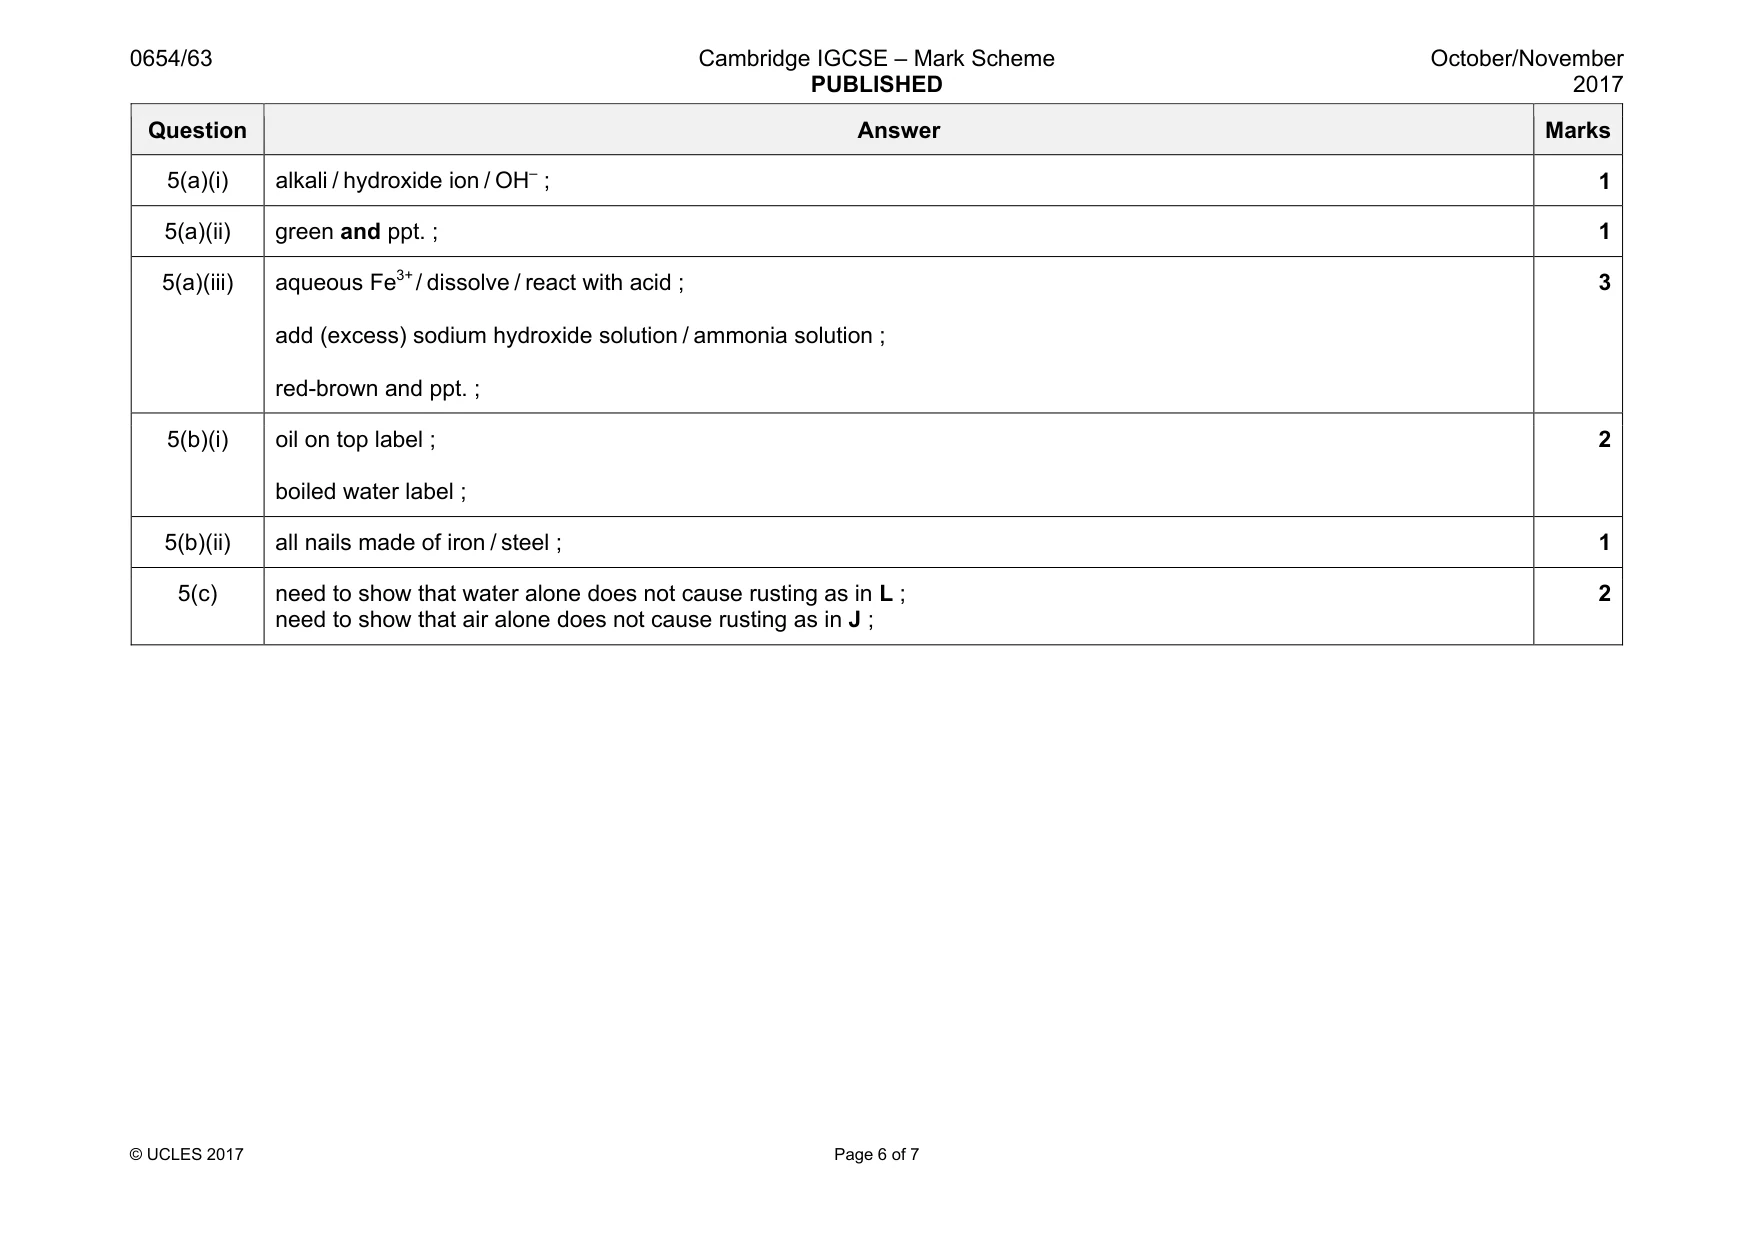
Mark scheme: 5(a)(i) 1 5(a)(ii) green and ppt. ; 1 5(a)(iii) aqueous Fe3+ / dissolve / react with acid ; add (excess) sodium hydroxide solution / ammonia solution ; red-brown and ppt. ; 3 5(b)(i) oil on top label ; boiled water label ; 2 5(b)(ii) all nails made of iron / steel ; 1 5(c) need to show that water alone does not cause rusting as in L ; need to show that air alone does not cause rusting as in J ; 2
Q6 · A student investigates the force needed to make objects move
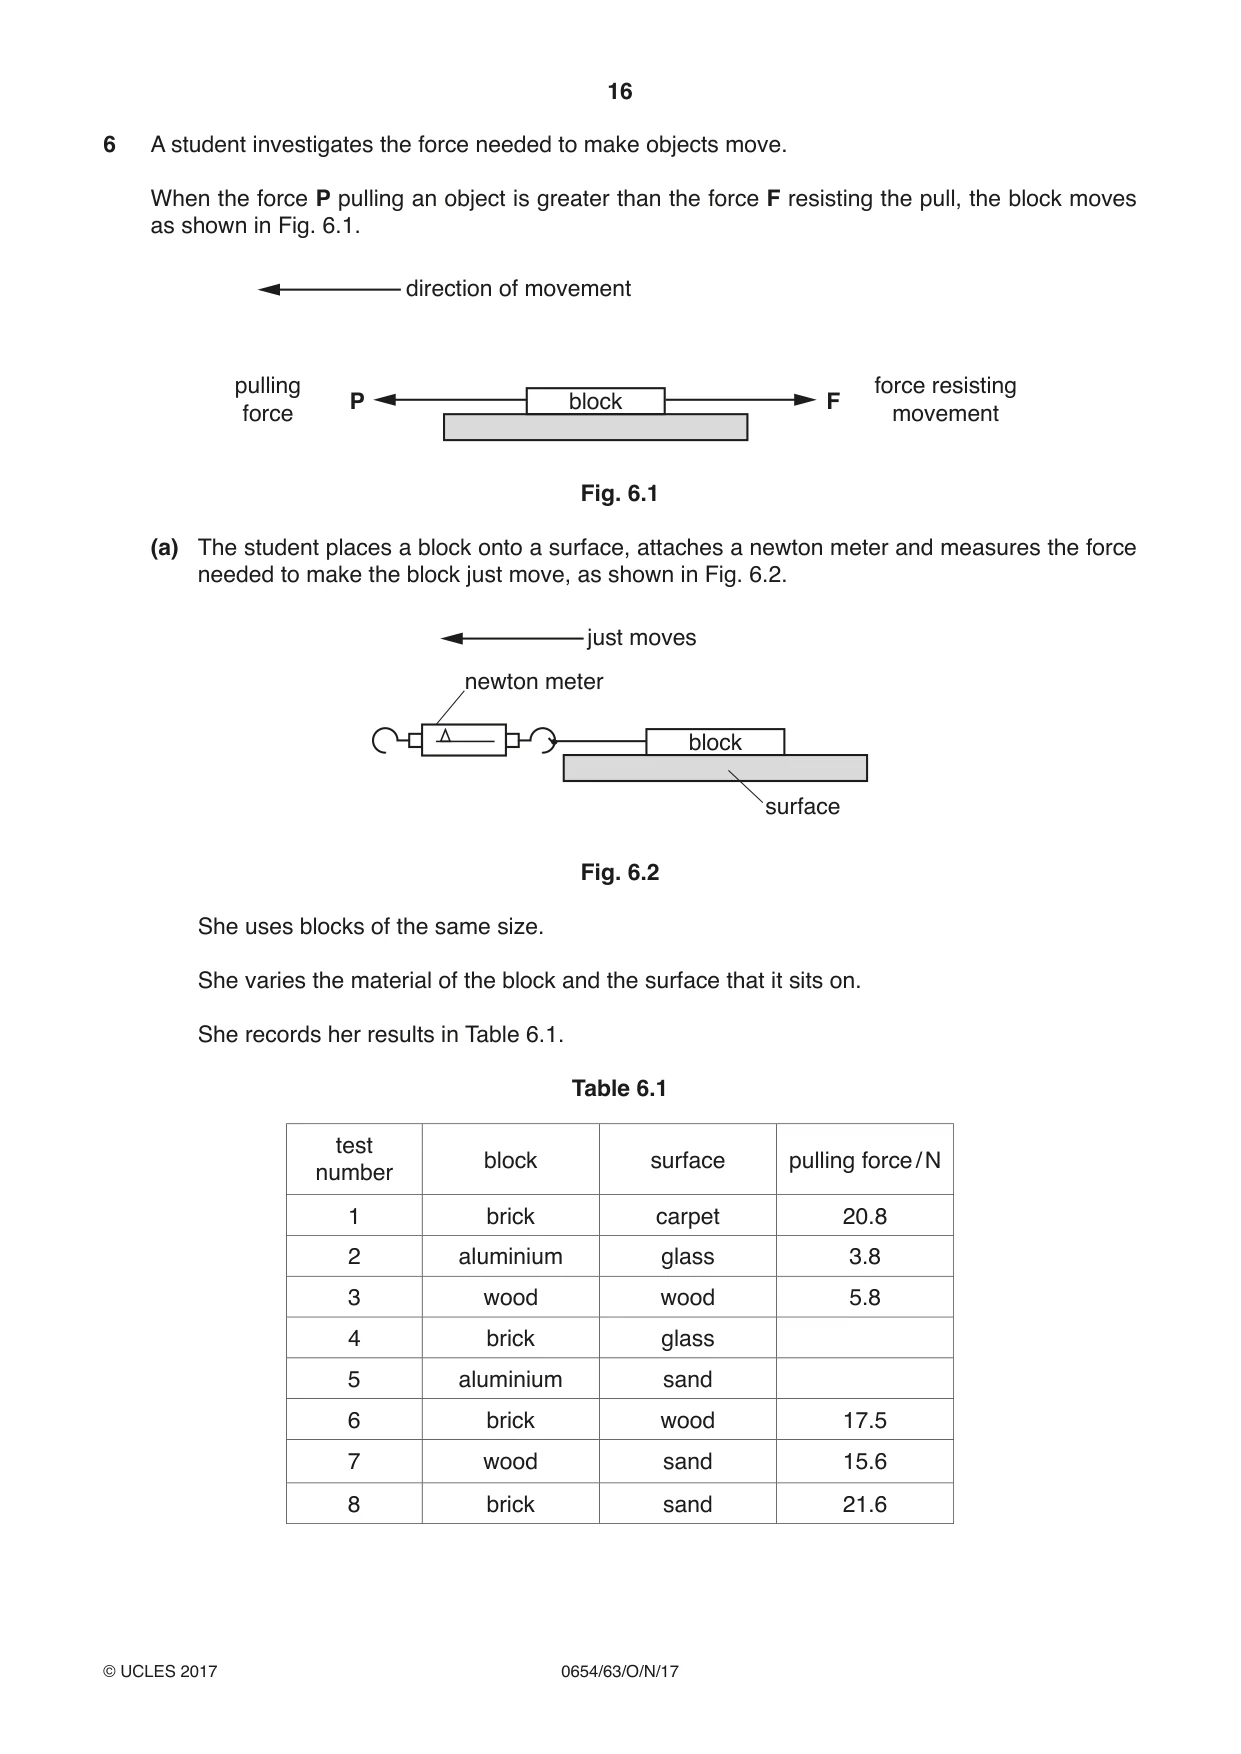
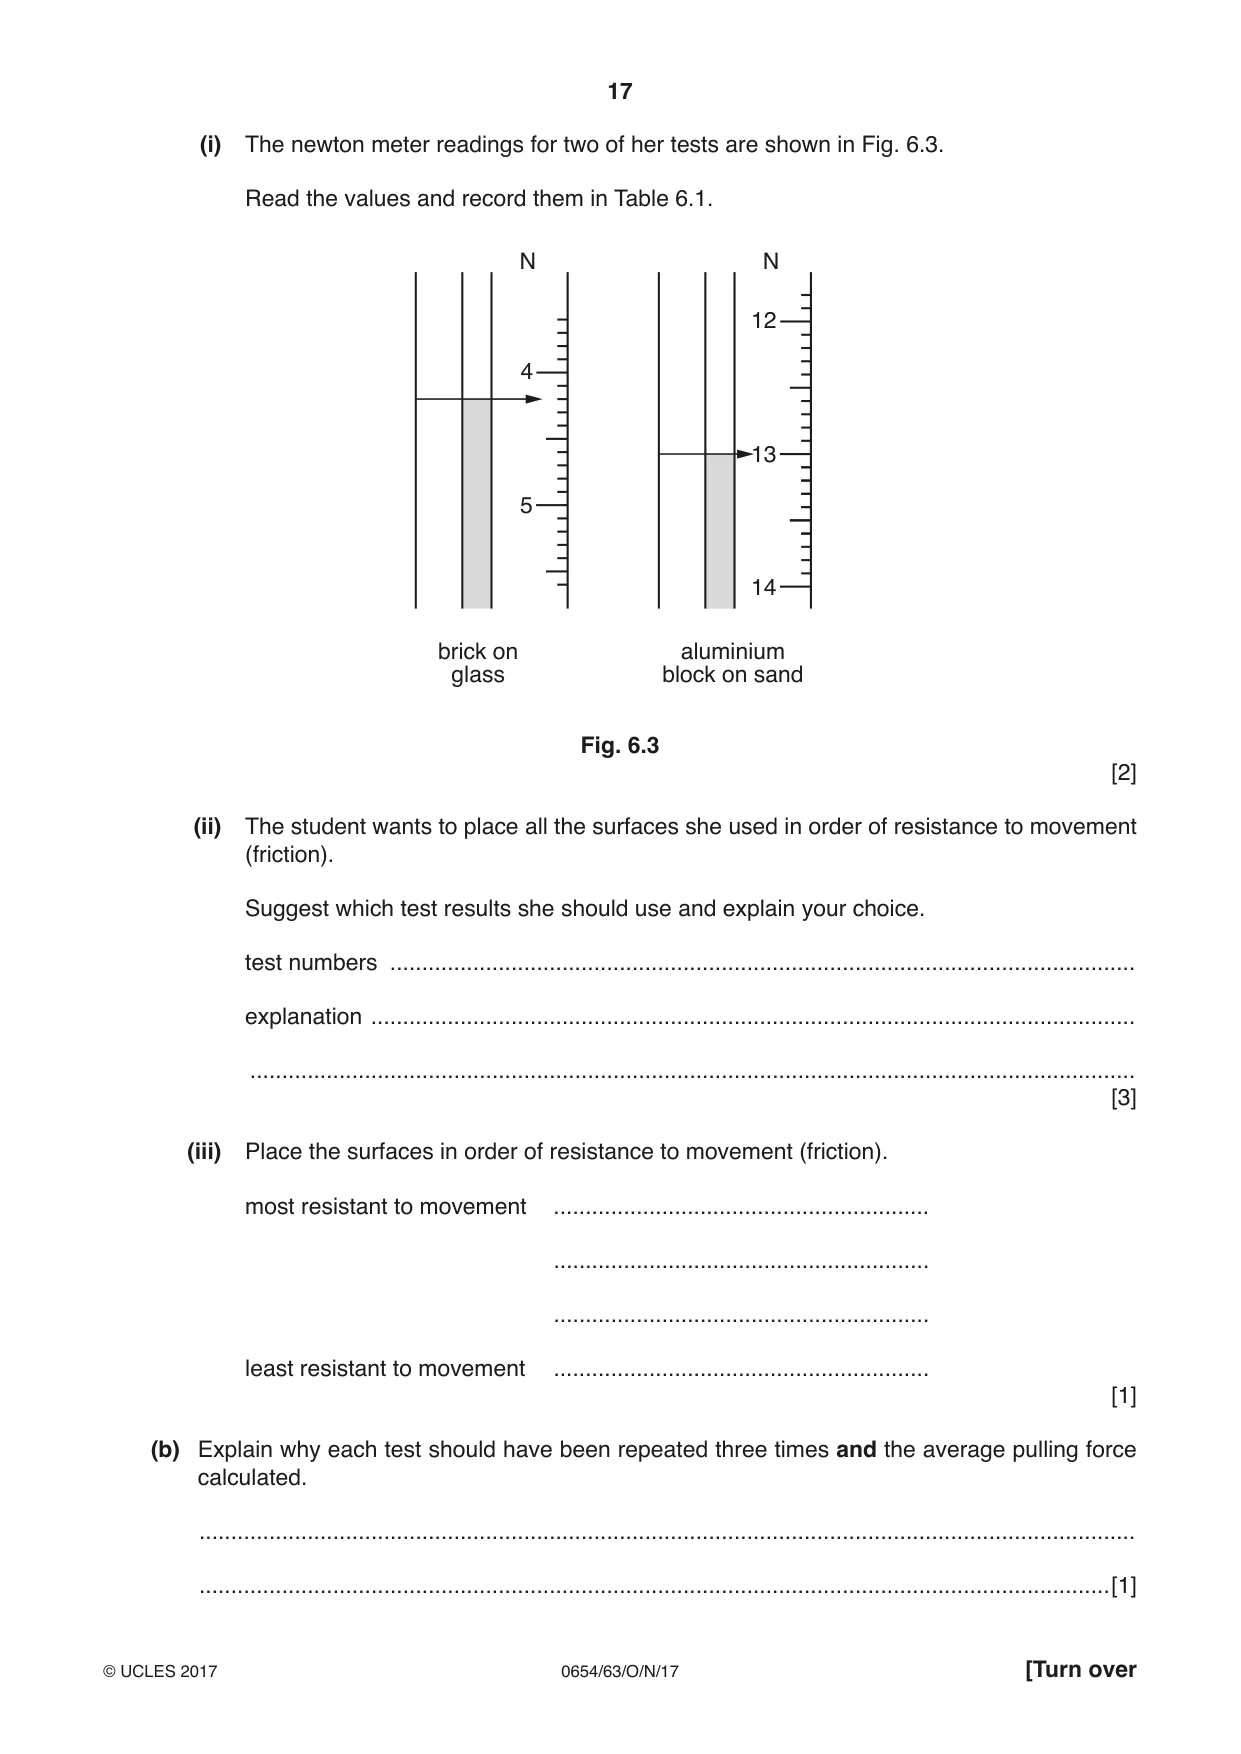
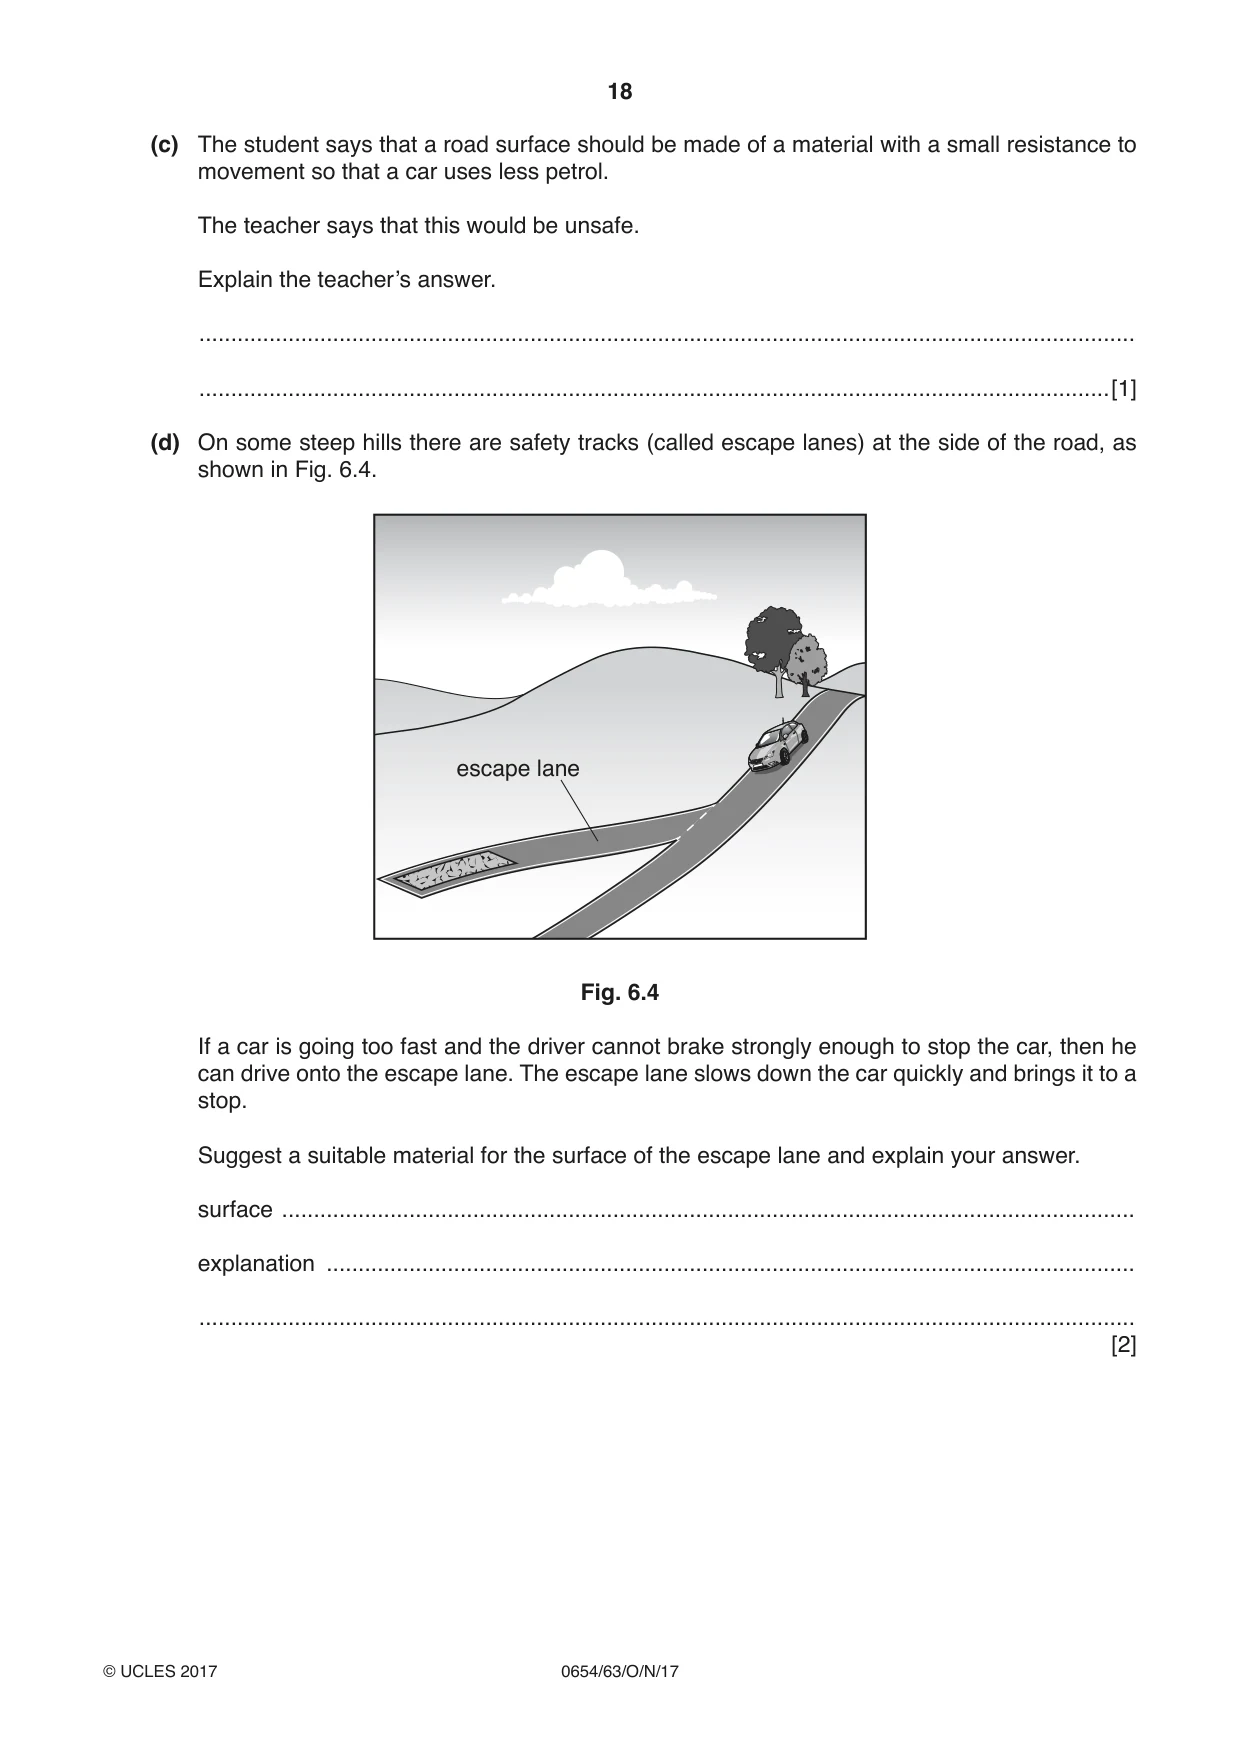
6 A student investigates the force needed to make objects move. When the force P pulling an object is greater than the force F resisting the pull, the block moves as shown in Fig. 6.1. direction of movement pulling force resisting P block F force movement Fig. 6.1 (a) The student places a block onto a surface, attaches a newton meter and measures the force needed to make the block just move, as shown in Fig. 6.2. just moves newton meter block surface Fig. 6.2 She uses blocks of the same size. She varies the material of the block and the surface that it sits on. She records her results in Table 6.1. Table 6.1 test block surface pulling force / N number 1 brick carpet 20.8 2 aluminium glass 3.8 3 wood wood 5.8 4 brick glass 5 aluminium sand 6 brick wood 17.5 7 wood sand 15.6 8 brick sand 21.6 (i) The newton meter readings for two of her tests are shown in Fig. 6.3. Read the values and record them in Table 6.1. N N 12 4 13 5 14 brick on aluminium glass block on sand Fig. 6.3 [2] (ii) The student wants to place all the surfaces she used in order of resistance to movement (friction). Suggest which test results she should use and explain your choice. test numbers ..................................................................................................................... explanation ........................................................................................................................ ........................................................................................................................................... [3] (iii) Place the surfaces in order of resistance to movement (friction). most resistant to movement ........................................................... ........................................................... ........................................................... least resistant to movement ........................................................... [1] (b) Explain why each test should have been repeated three times and the average pulling force calculated. ................................................................................................................................................... ...............................................................................................................................................[1] (c) The student says that a road surface should be made of a material with a small resistance to movement so that a car uses less petrol. The teacher says that this would be unsafe. Explain the teacher’s answer. ................................................................................................................................................... ...............................................................................................................................................[1] (d) On some steep hills there are safety tracks (called escape lanes) at the side of the road, as shown in Fig. 6.4. escape lane Fig. 6.4 If a car is going too fast and the driver cannot brake strongly enough to stop the car, then he can drive onto the escape lane. The escape lane slows down the car quickly and brings it to a stop. Suggest a suitable material for the surface of the escape lane and explain your answer. surface ...................................................................................................................................... explanation ............................................................................................................................... ................................................................................................................................................... [2]
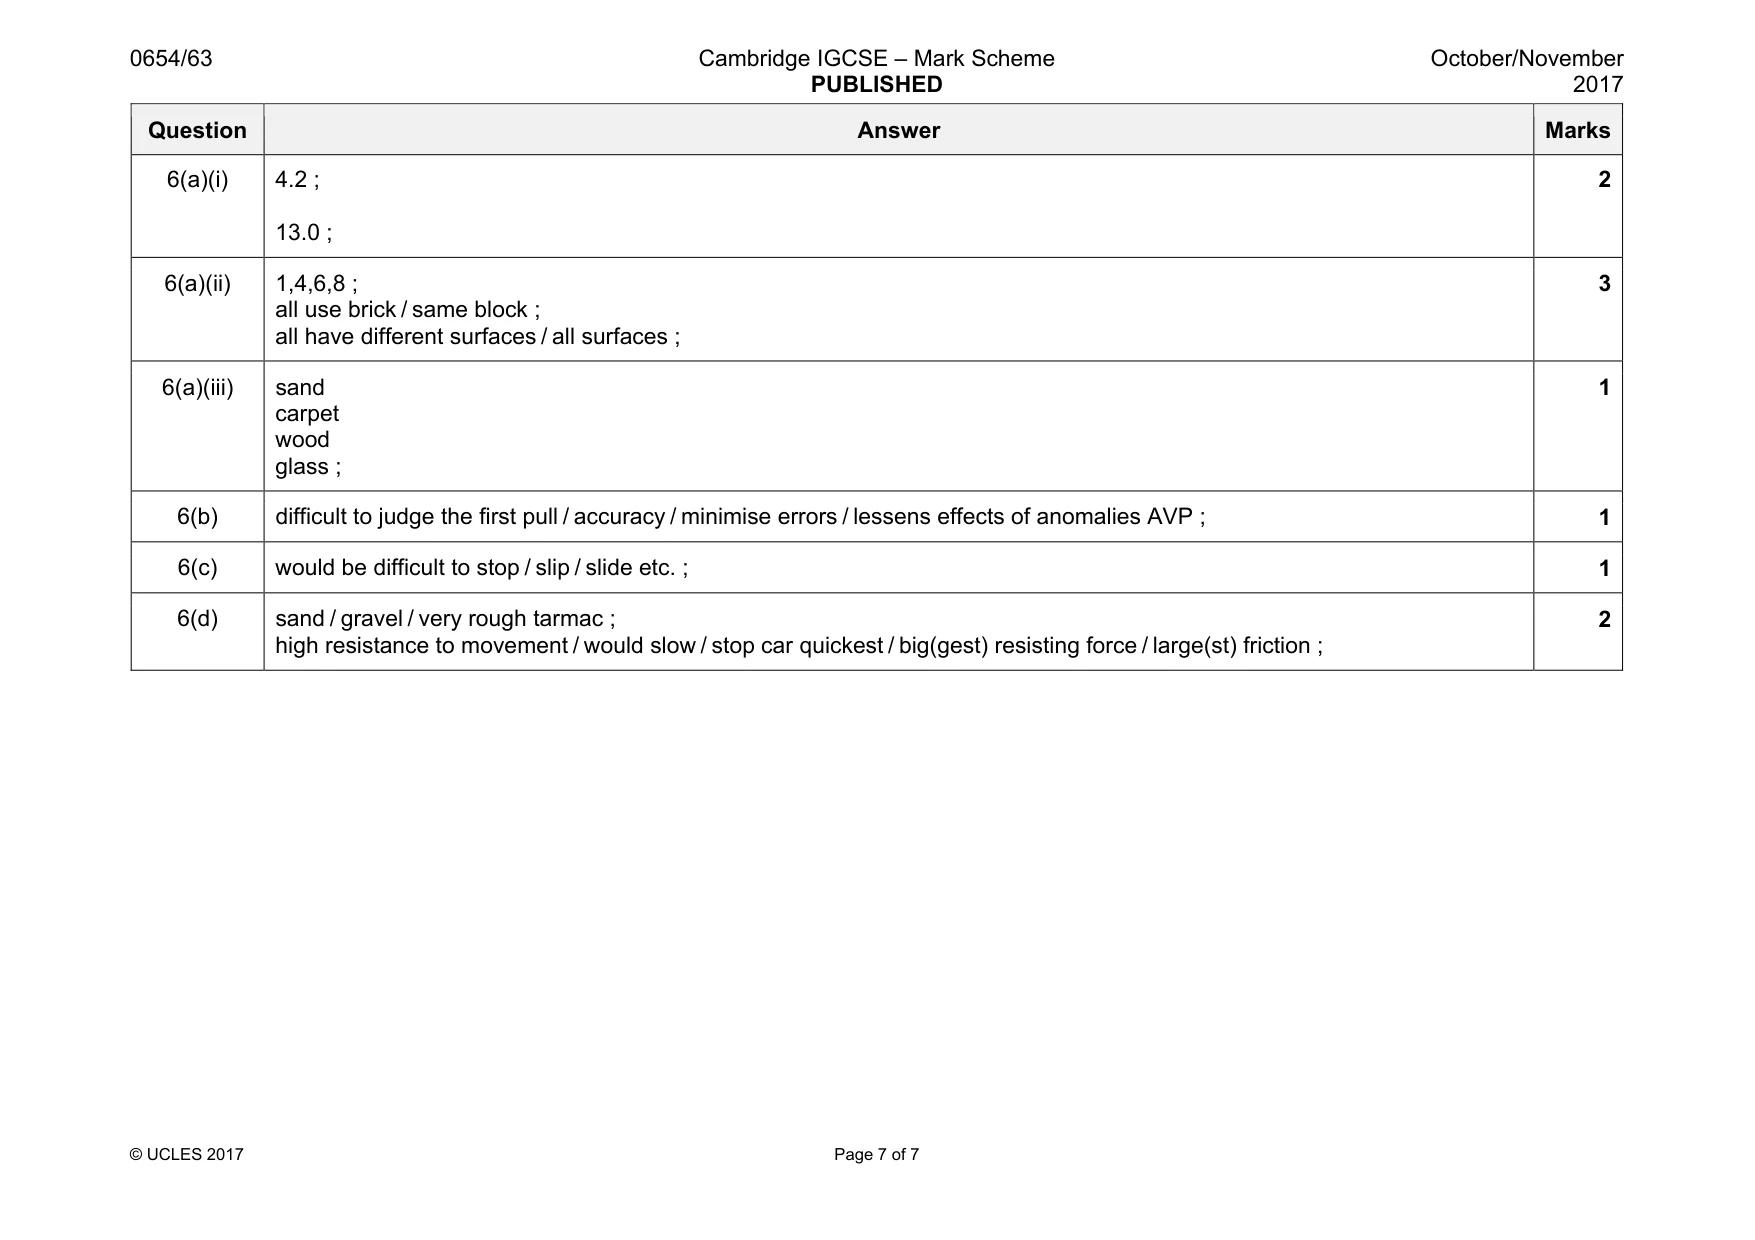
Mark scheme: 6(a)(i) 4.2 ; 13.0 ; 2 6(a)(ii) 1,4,6,8 ; all use brick / same block ; all have different surfaces / all surfaces ; 3 6(a)(iii) sand carpet wood glass ; 1 6(b) difficult to judge the first pull / accuracy / minimise errors / lessens effects of anomalies AVP ; 1 6(c) would be difficult to stop / slip / slide etc. ; 1 6(d) sand / gravel / very rough tarmac ; high resistance to movement / would slow / stop car quickest / big(gest) resisting force / large(st) friction ; 2
What was in this paper
The subtopics covered by these 6 questions, and how many questions each got. Open one in a new tab to see every Cambridge question on it.
What you needed in this session
Cambridge’s own grade thresholds for 2017 Oct/Nov, Paper 6 · Variant 3. A higher threshold means an easier paper — the bar moves with how the cohort did.