Cambridge IGCSE Sciences - Co-ordinated (Double) 0654 — 2017 Oct/Nov Paper 6 · Variant 1
0654/61/O/N/17 · 6 questions · 60 marks · ≈68 min
The question paper and its mark scheme, free to read here and free to download. This is Cambridge’s own paper, exactly as it was sat.
Question paper20 pages


Mark scheme7 pages
Answers below. Sit the paper first if you are practising.
Questions as text
Q1 · A student investigates the action of different concentrations of an enzyme solution on…
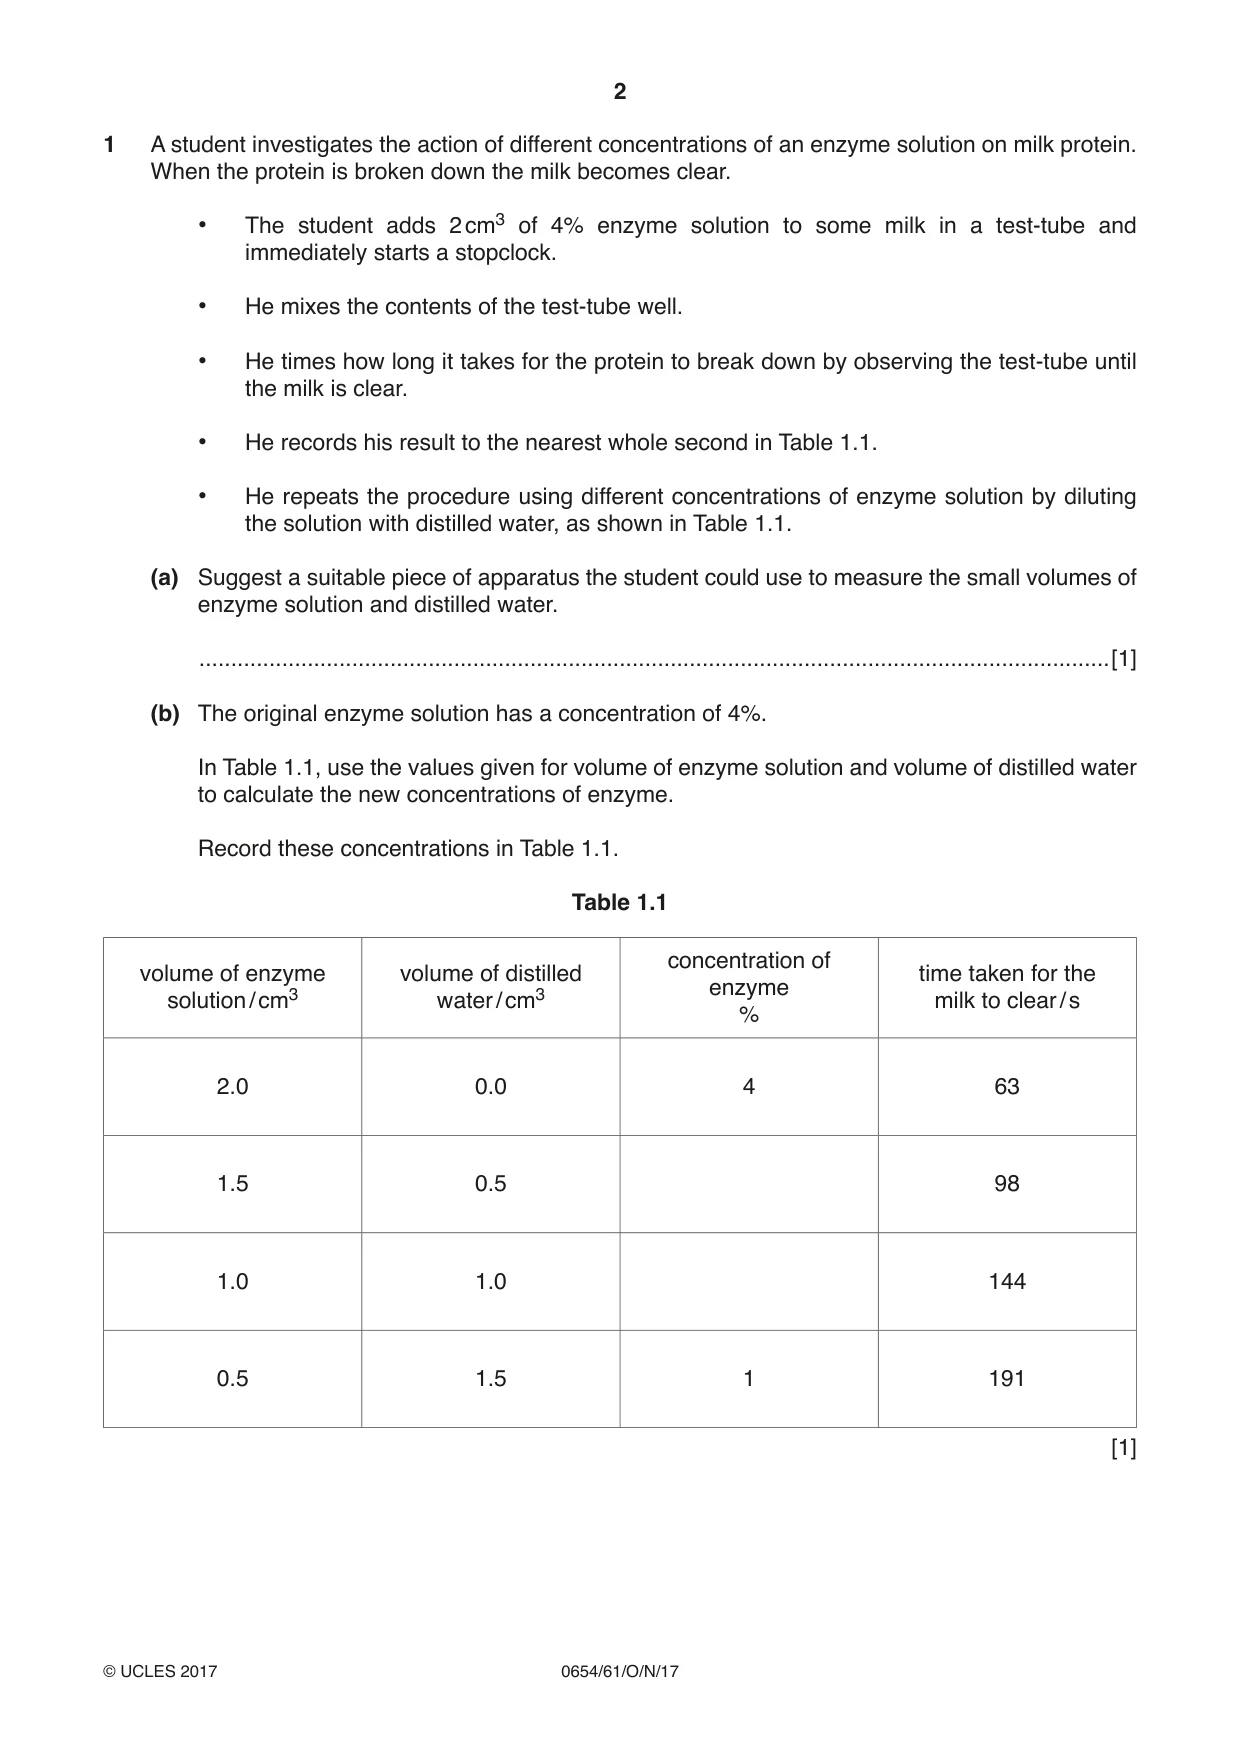
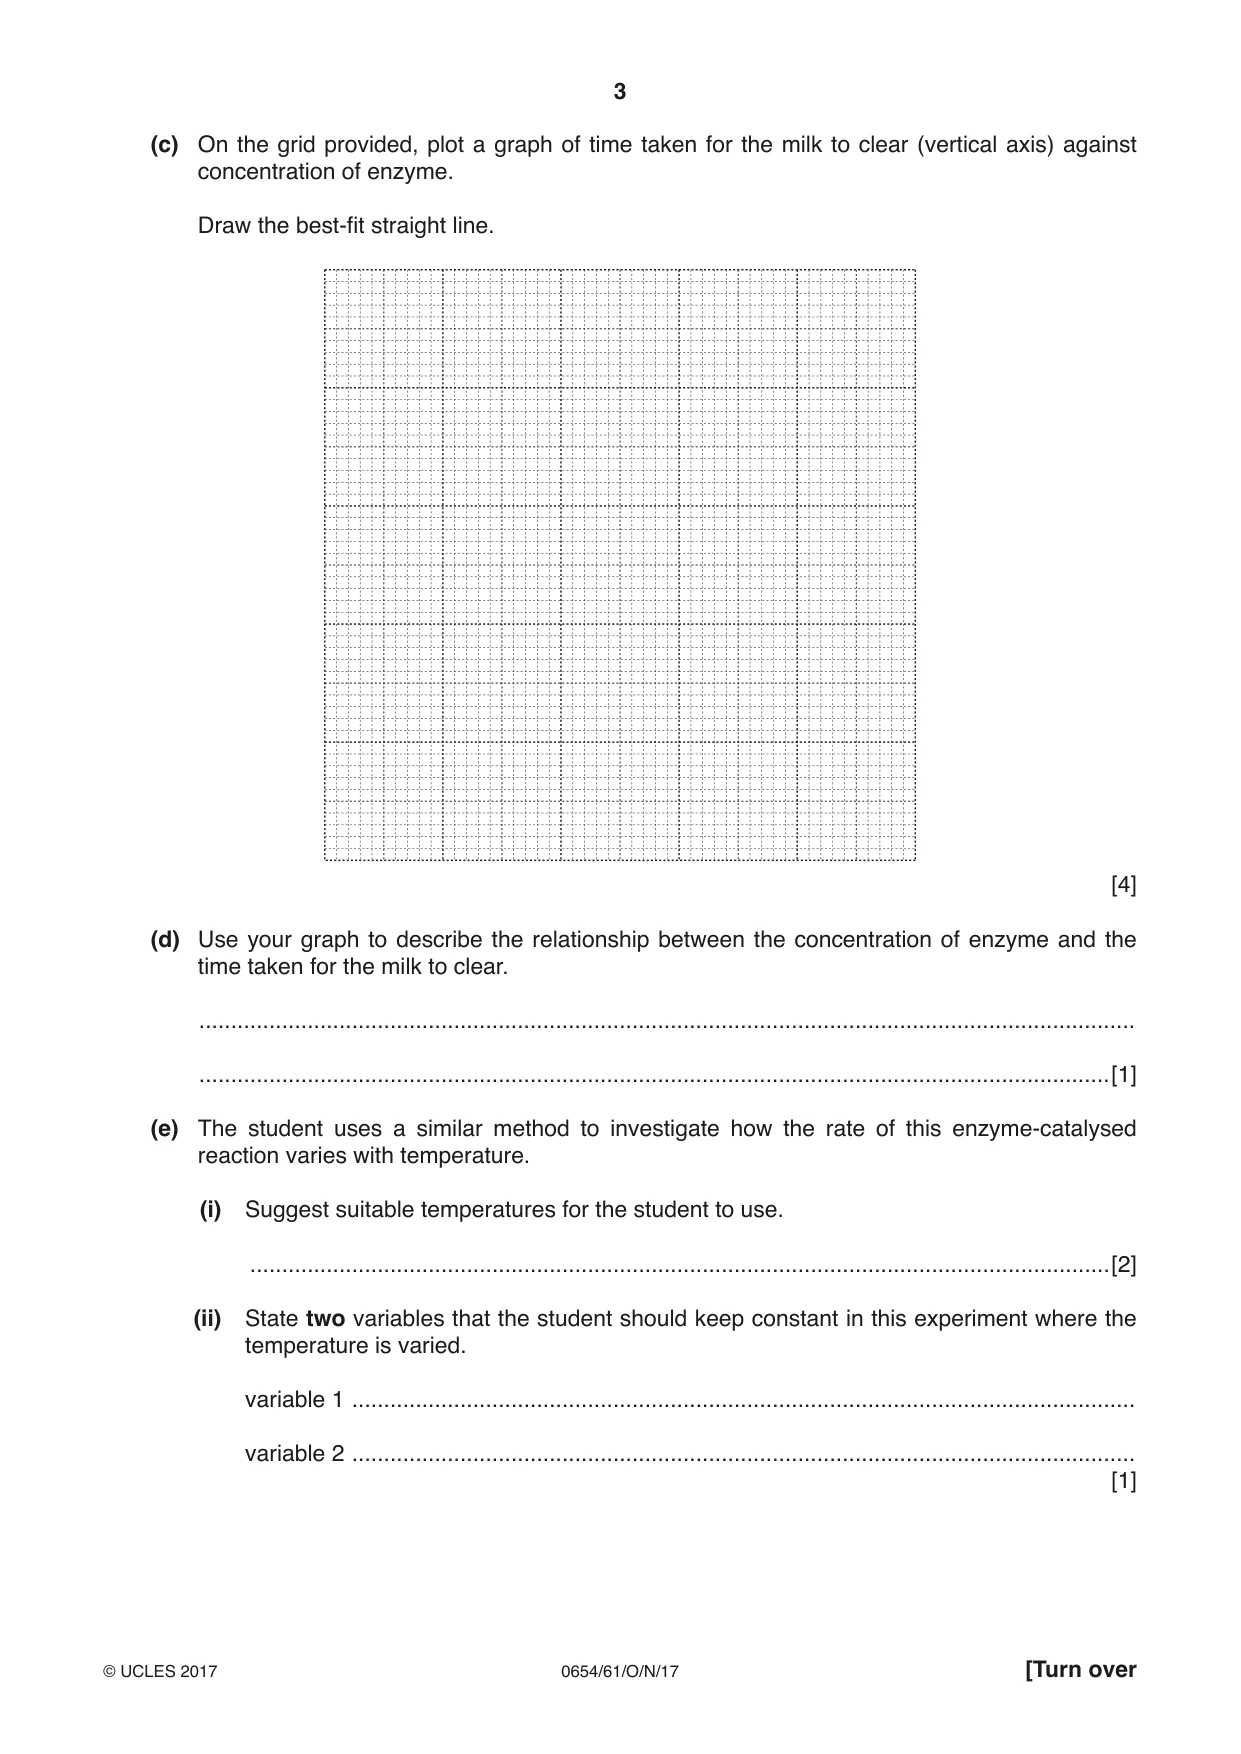
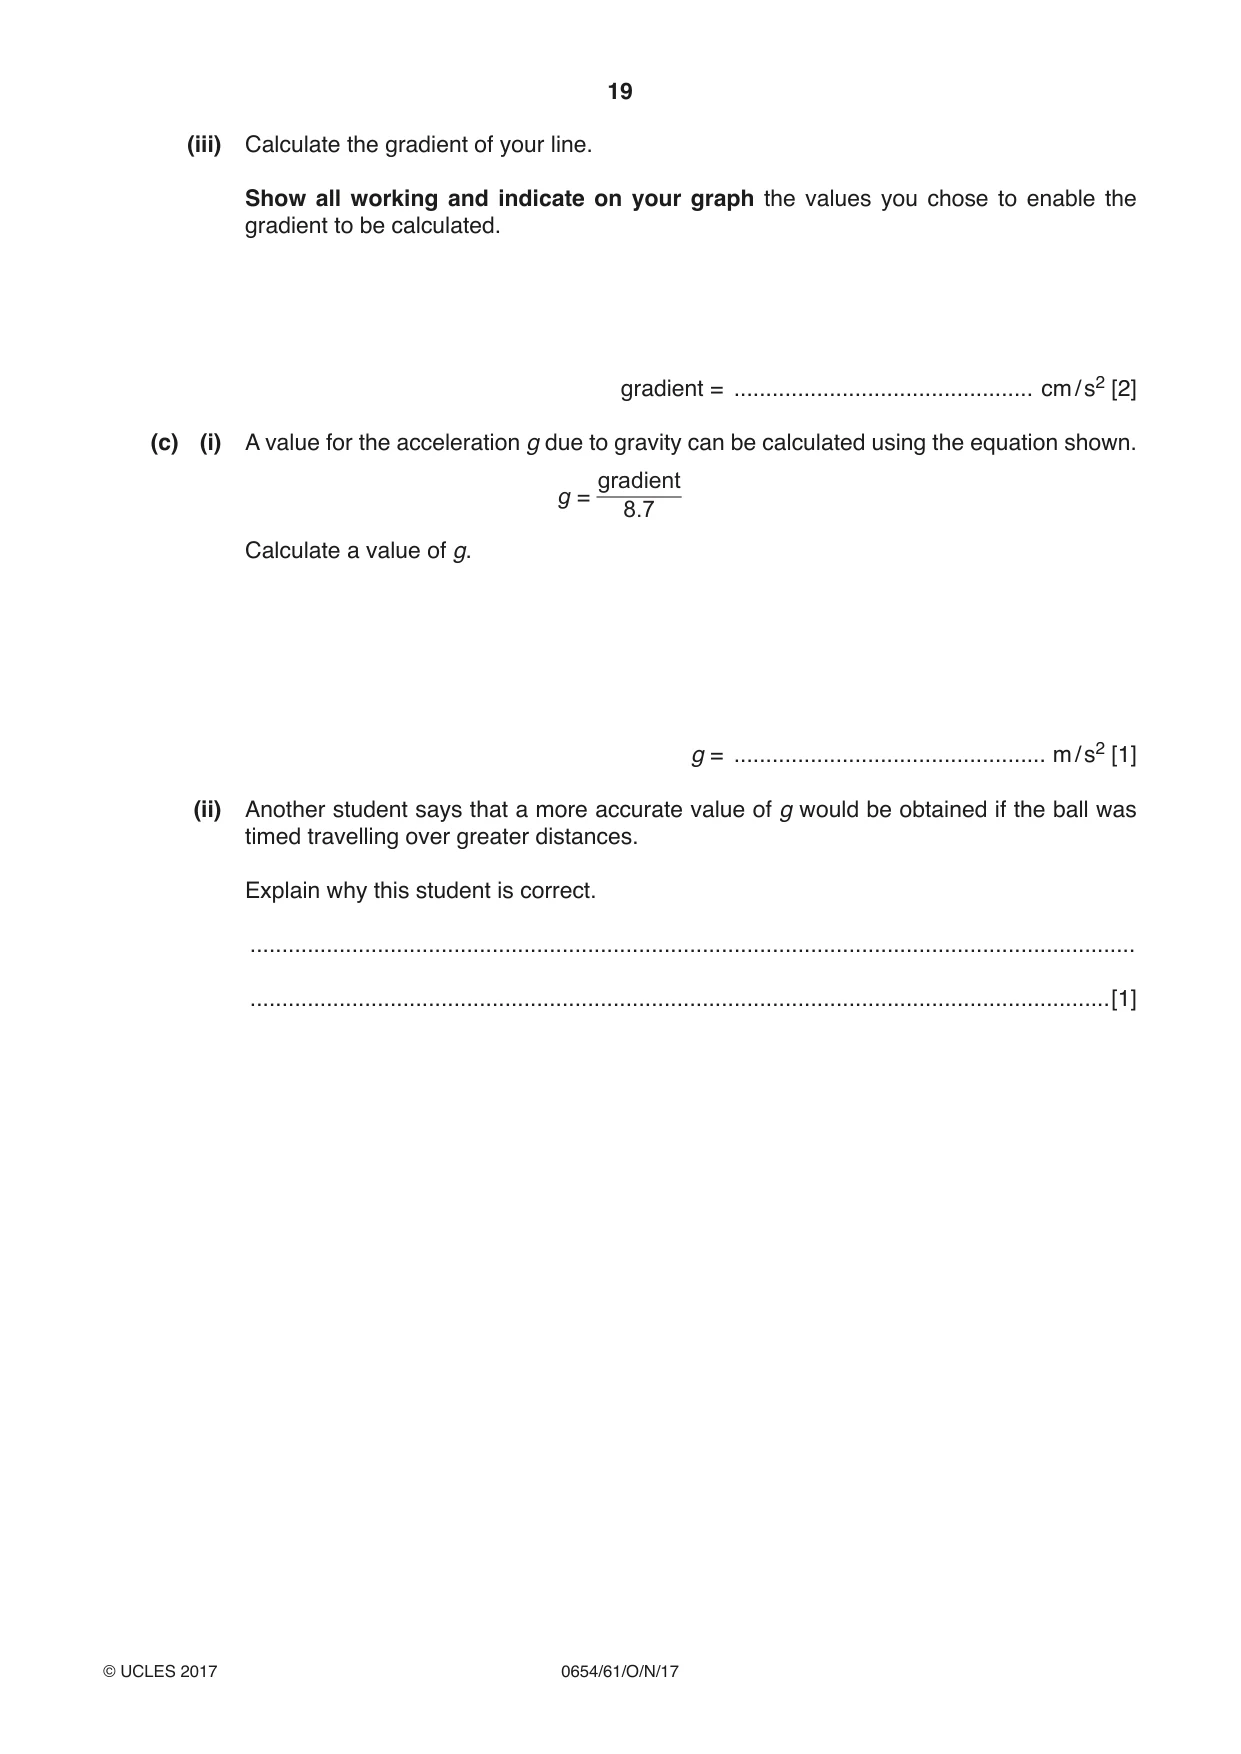
1 A student investigates the action of different concentrations of an enzyme solution on milk protein. When the protein is broken down the milk becomes clear. • The student adds 2 cm3 of 4% enzyme solution to some milk in a test-tube and immediately starts a stopclock. • He mixes the contents of the test-tube well. • He times how long it takes for the protein to break down by observing the test-tube until the milk is clear. • He records his result to the nearest whole second in Table 1.1. • He repeats the procedure using different concentrations of enzyme solution by diluting the solution with distilled water, as shown in Table 1.1. (a) Suggest a suitable piece of apparatus the student could use to measure the small volumes of enzyme solution and distilled water. ...............................................................................................................................................[1] (b) The original enzyme solution has a concentration of 4%. In Table 1.1, use the values given for volume of enzyme solution and volume of distilled water to calculate the new concentrations of enzyme. Record these concentrations in Table 1.1. Table 1.1 concentration of volume of enzyme volume of distilled time taken for the enzyme solution / cm3 water / cm3 milk to clear / s % 2.0 0.0 4 63 1.5 0.5 98 1.0 1.0 144 0.5 1.5 1 191 [1] (c) On the grid provided, plot a graph of time taken for the milk to clear (vertical axis) against concentration of enzyme. Draw the best-fit straight line. [4] (d) Use your graph to describe the relationship between the concentration of enzyme and the time taken for the milk to clear. ................................................................................................................................................... ...............................................................................................................................................[1] (e) The student uses a similar method to investigate how the rate of this enzyme-catalysed reaction varies with temperature. (i) Suggest suitable temperatures for the student to use. .......................................................................................................................................[2] (ii) State two variables that the student should keep constant in this experiment where the temperature is varied. variable 1 ........................................................................................................................... variable 2 ........................................................................................................................... [1]
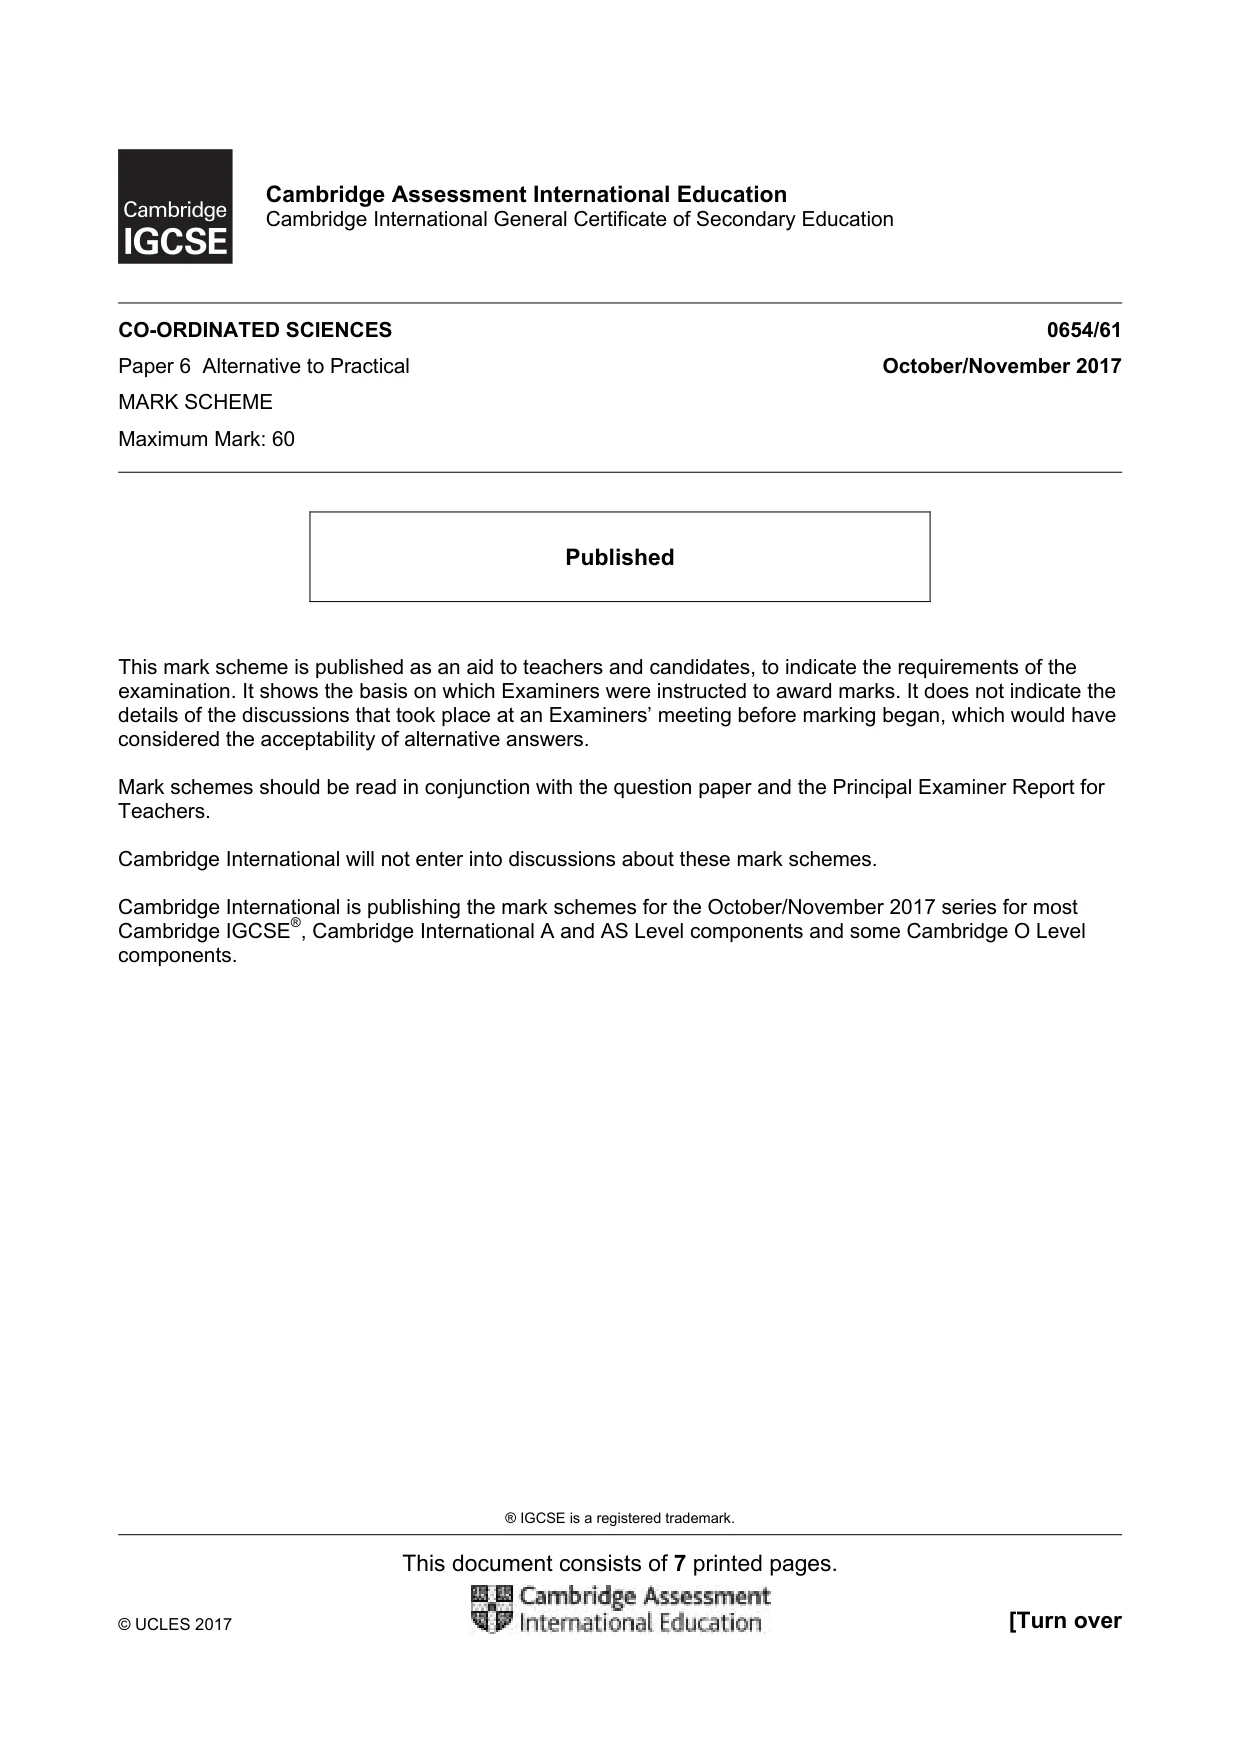
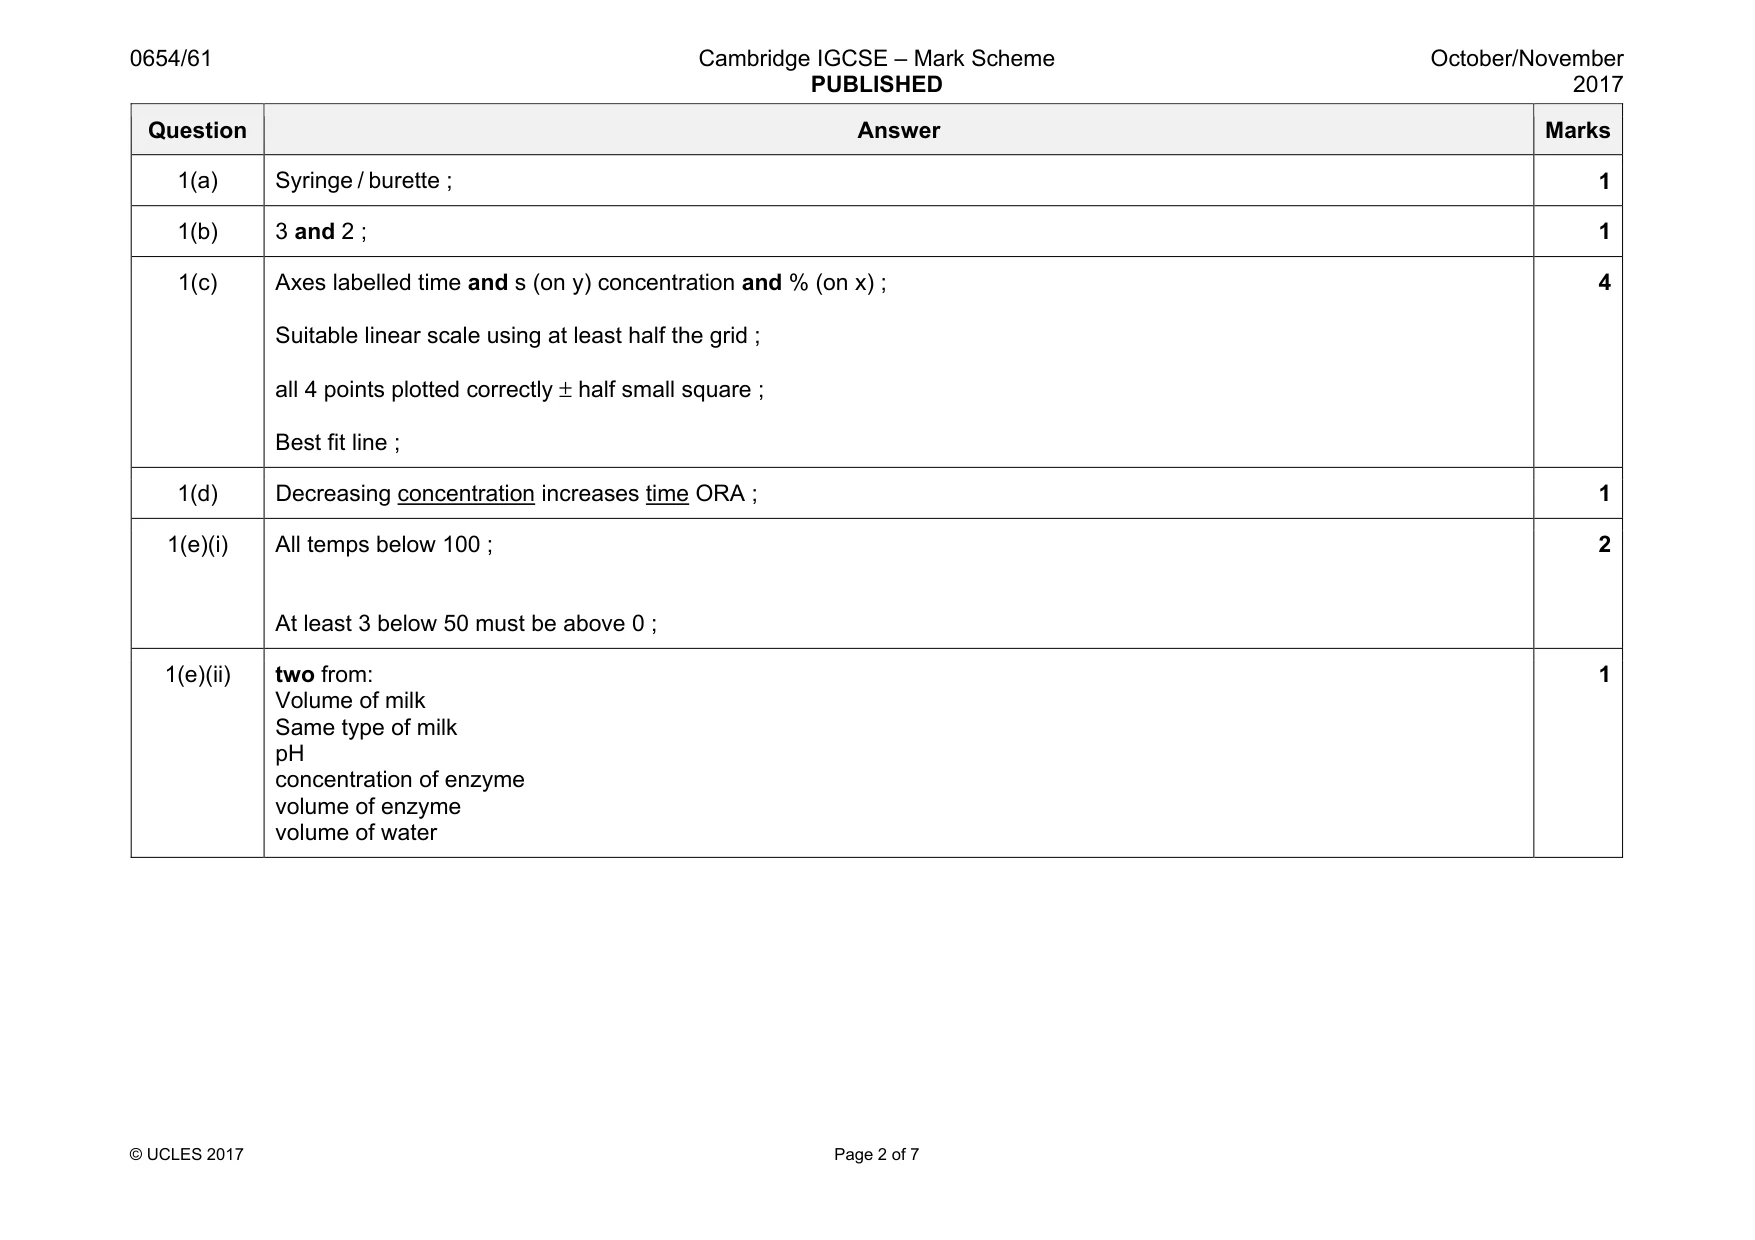
Mark scheme: 1(a) Syringe / burette ; 1 1(b) 3 and 2 ; 1 1(c) Axes labelled time and s (on y) concentration and % (on x) ; Suitable linear scale using at least half the grid ; all 4 points plotted correctly ± half small square ; Best fit line ; 4 1(d) Decreasing concentration increases time ORA ; 1 1(e)(i) All temps below 100 ; At least 3 below 50 must be above 0 ; 2 1(e)(ii) two from: Volume of milk Same type of milk pH concentration of enzyme volume of enzyme volume of water 1
Q2 · A student investigates the temperature change in the reaction between H and water
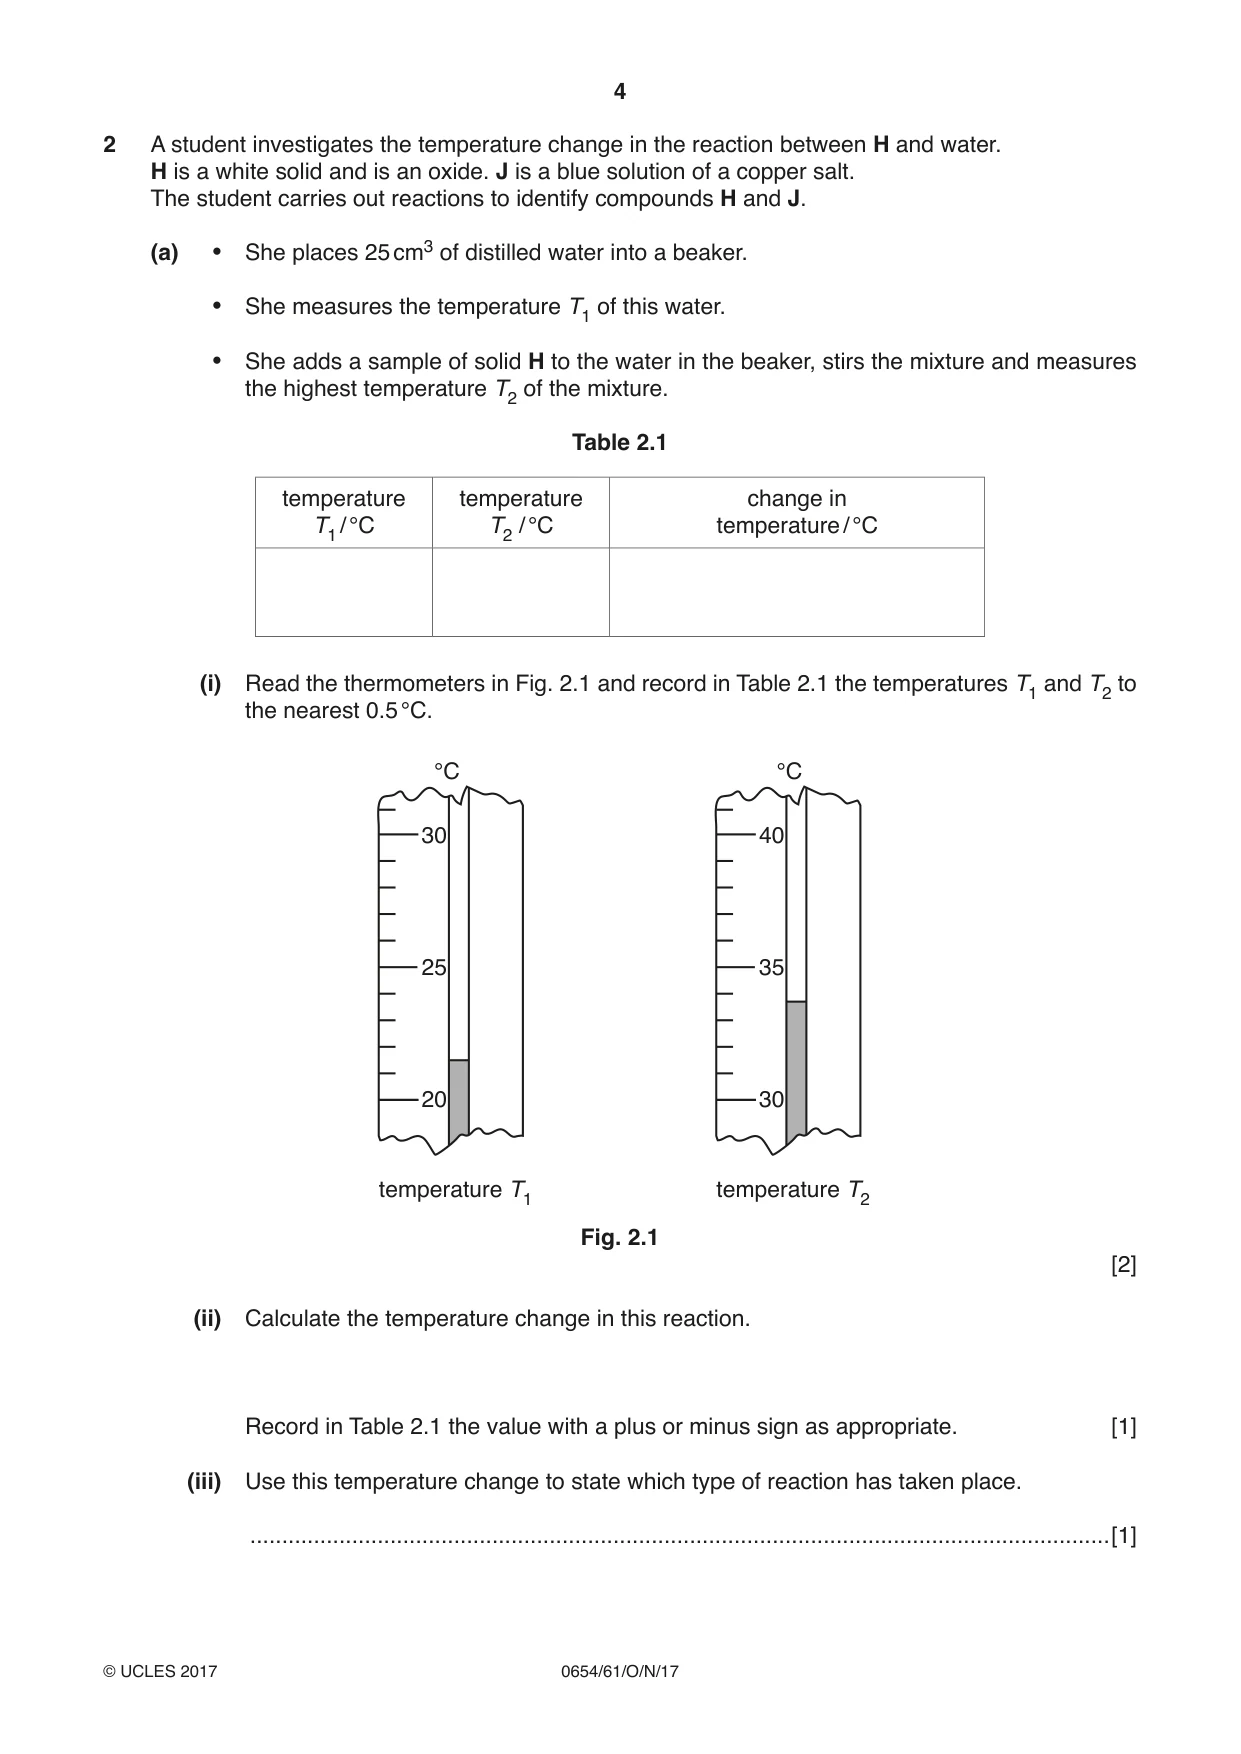
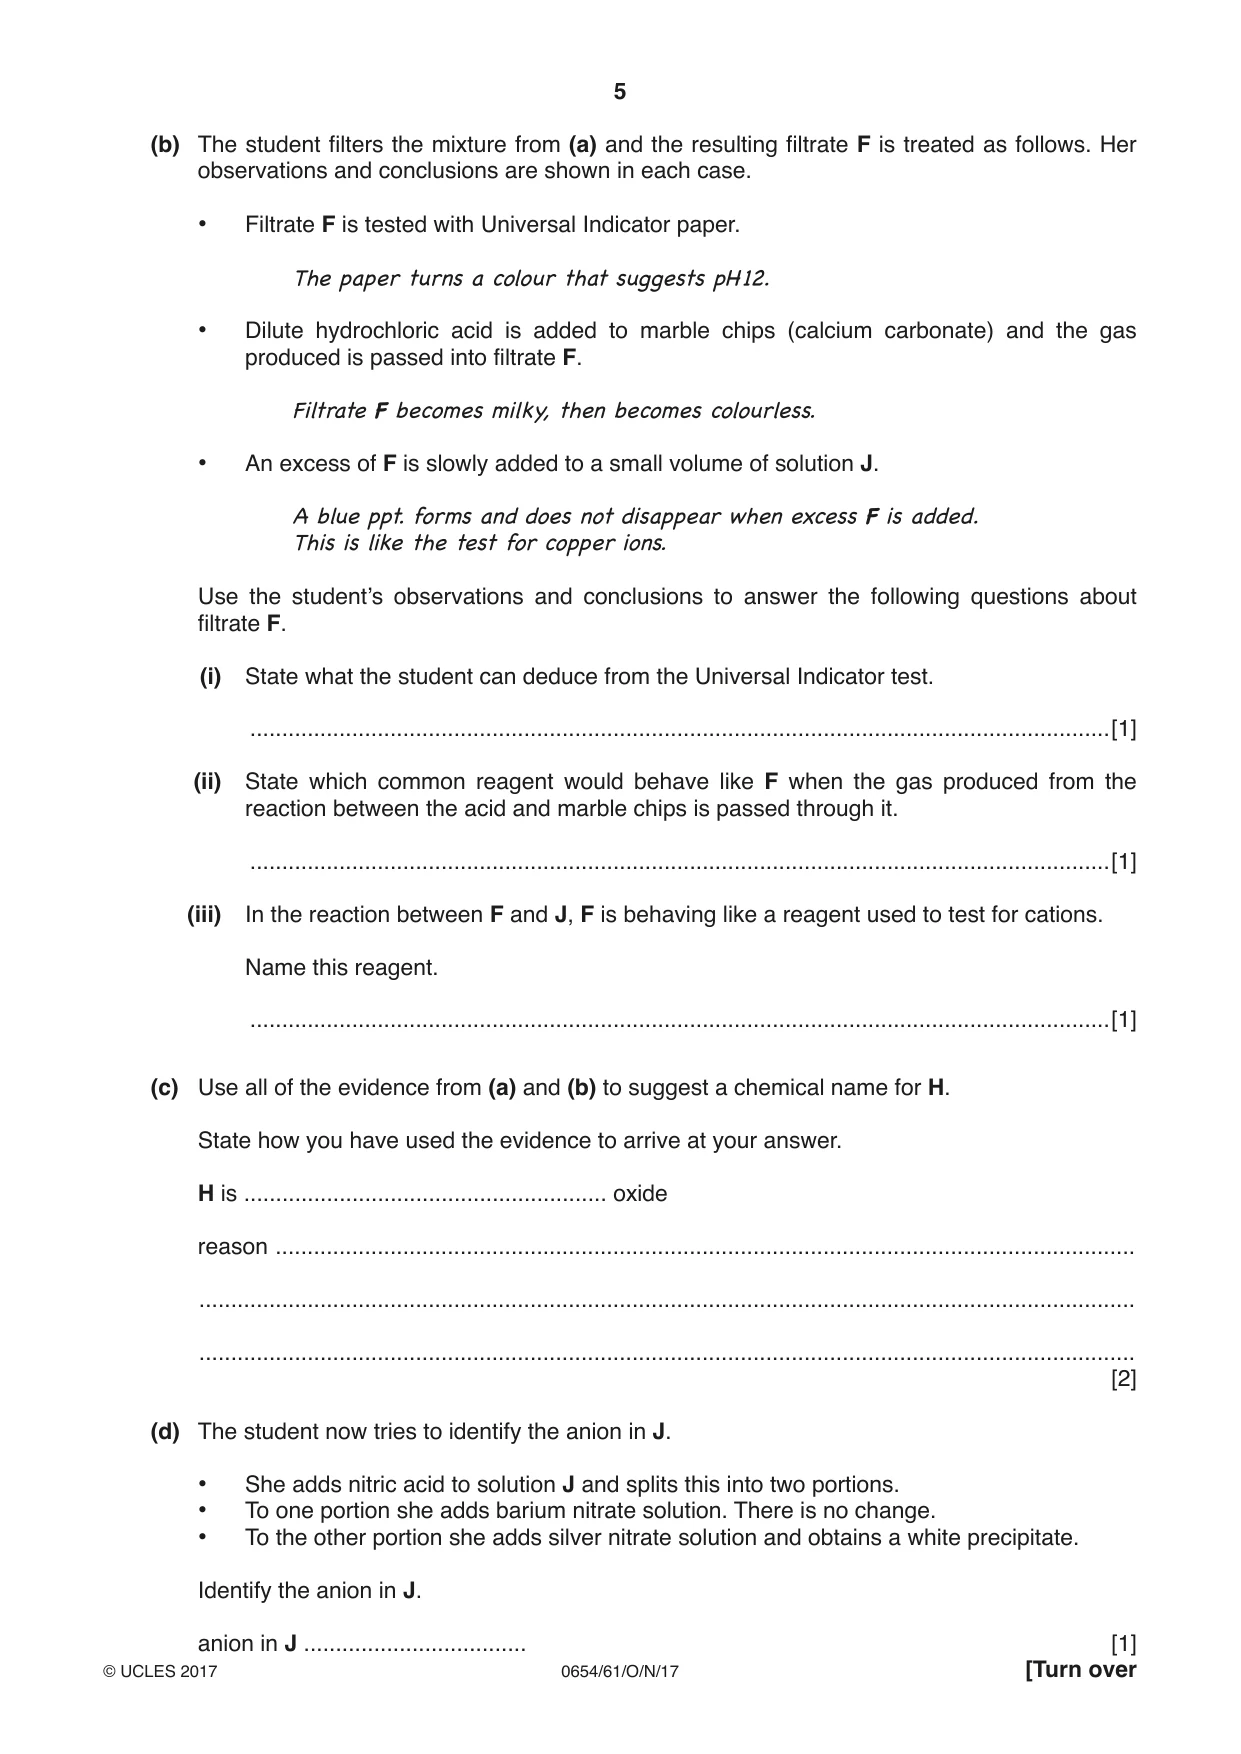
2 A student investigates the temperature change in the reaction between H and water. H is a white solid and is an oxide. J is a blue solution of a copper salt. The student carries out reactions to identify compounds H and J. (a) • She places 25 cm3 of distilled water into a beaker. • She measures the temperature T1 of this water. • She adds a sample of solid H to the water in the beaker, stirs the mixture and measures the highest temperature T2 of the mixture. Table 2.1 temperature temperature change in T1 / °C T2 / °C temperature / °C (i) Read the thermometers in Fig. 2.1 and record in Table 2.1 the temperatures T1 and T2 to the nearest 0.5 °C. °C °C 30 40 25 35 20 30 temperature T1 temperature T2 Fig. 2.1 [2] (ii) Calculate the temperature change in this reaction. Record in Table 2.1 the value with a plus or minus sign as appropriate. [1] (iii) Use this temperature change to state which type of reaction has taken place. .......................................................................................................................................[1] (b) The student filters the mixture from (a) and the resulting filtrate F is treated as follows. Her observations and conclusions are shown in each case. • Filtrate F is tested with Universal Indicator paper. ThepaperturnsacolourthatsuggestspH12. • Dilute hydrochloric acid is added to marble chips (calcium carbonate) and the gas produced is passed into filtrate F. FiltrateFbecomesmilky,thenbecomescolourless. • An excess of F is slowly added to a small volume of solution J. Ablueppt.formsanddoesnotdisappearwhenexcessFisadded. Thisislikethetestforcopperions. Use the student’s observations and conclusions to answer the following questions about filtrate F. (i) State what the student can deduce from the Universal Indicator test. .......................................................................................................................................[1] (ii) State which common reagent would behave like F when the gas produced from the reaction between the acid and marble chips is passed through it. .......................................................................................................................................[1] (iii) In the reaction between F and J, F is behaving like a reagent used to test for cations. Name this reagent. .......................................................................................................................................[1] (c) Use all of the evidence from (a) and (b) to suggest a chemical name for H. State how you have used the evidence to arrive at your answer. H is ......................................................... oxide reason ....................................................................................................................................... ................................................................................................................................................... ................................................................................................................................................... [2] (d) The student now tries to identify the anion in J. • She adds nitric acid to solution J and splits this into two portions. • To one portion she adds barium nitrate solution. There is no change. • To the other portion she adds silver nitrate solution and obtains a white precipitate. Identify the anion in J.
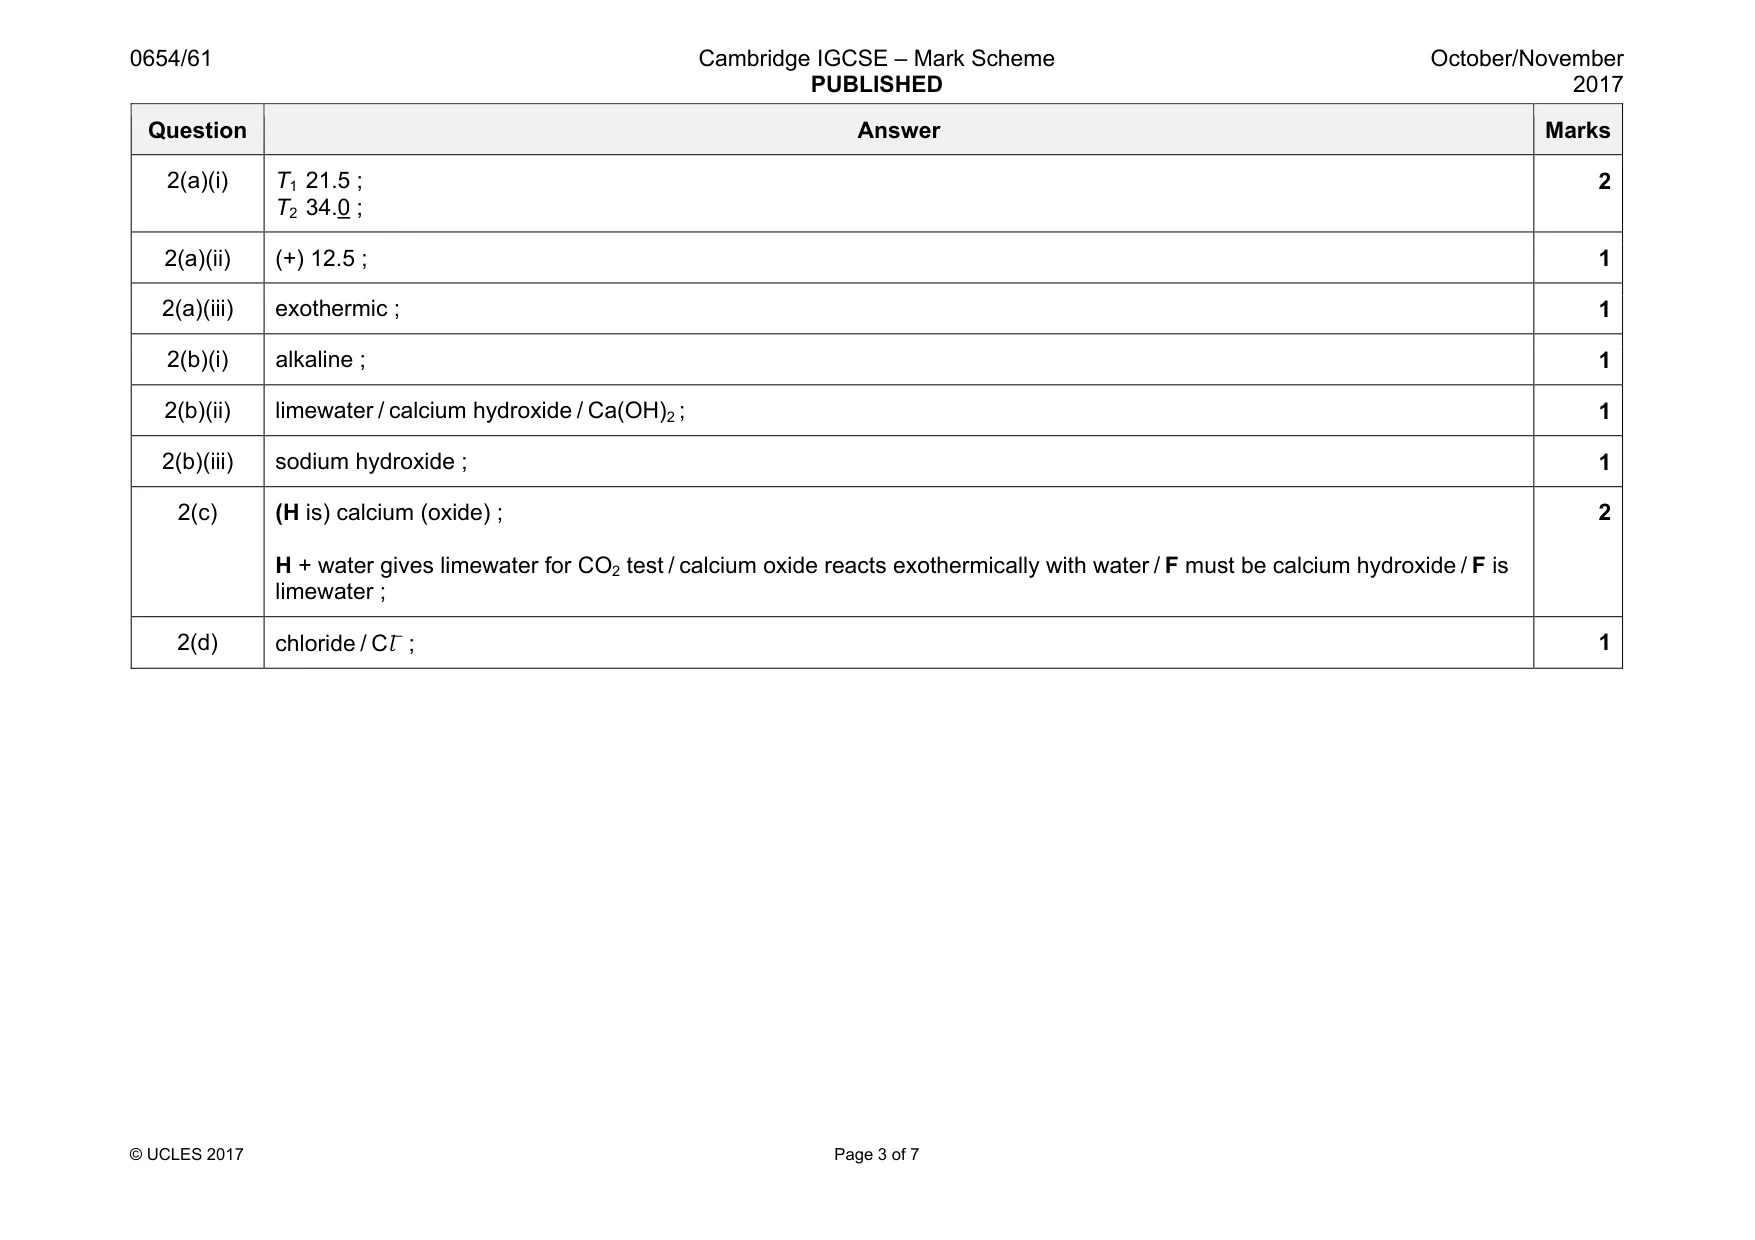
Mark scheme: 2(a)(i) T1 21.5 ; T2 34.0 ; 2 2(a)(ii) (+) 12.5 ; 1 2(a)(iii) exothermic ; 1 2(b)(i) alkaline ; 1 2(b)(ii) limewater / calcium hydroxide / Ca(OH)2 ; 1 2(b)(iii) sodium hydroxide ; 1 2(c) (H is) calcium (oxide) ; H + water gives limewater for CO2 test / calcium oxide reacts exothermically with water / F must be calcium hydroxide / F is limewater ; 2 2(d) chloride / Cl– ; 1
Q3 · A student investigates how the power P of a filament lamp depends upon the current I…
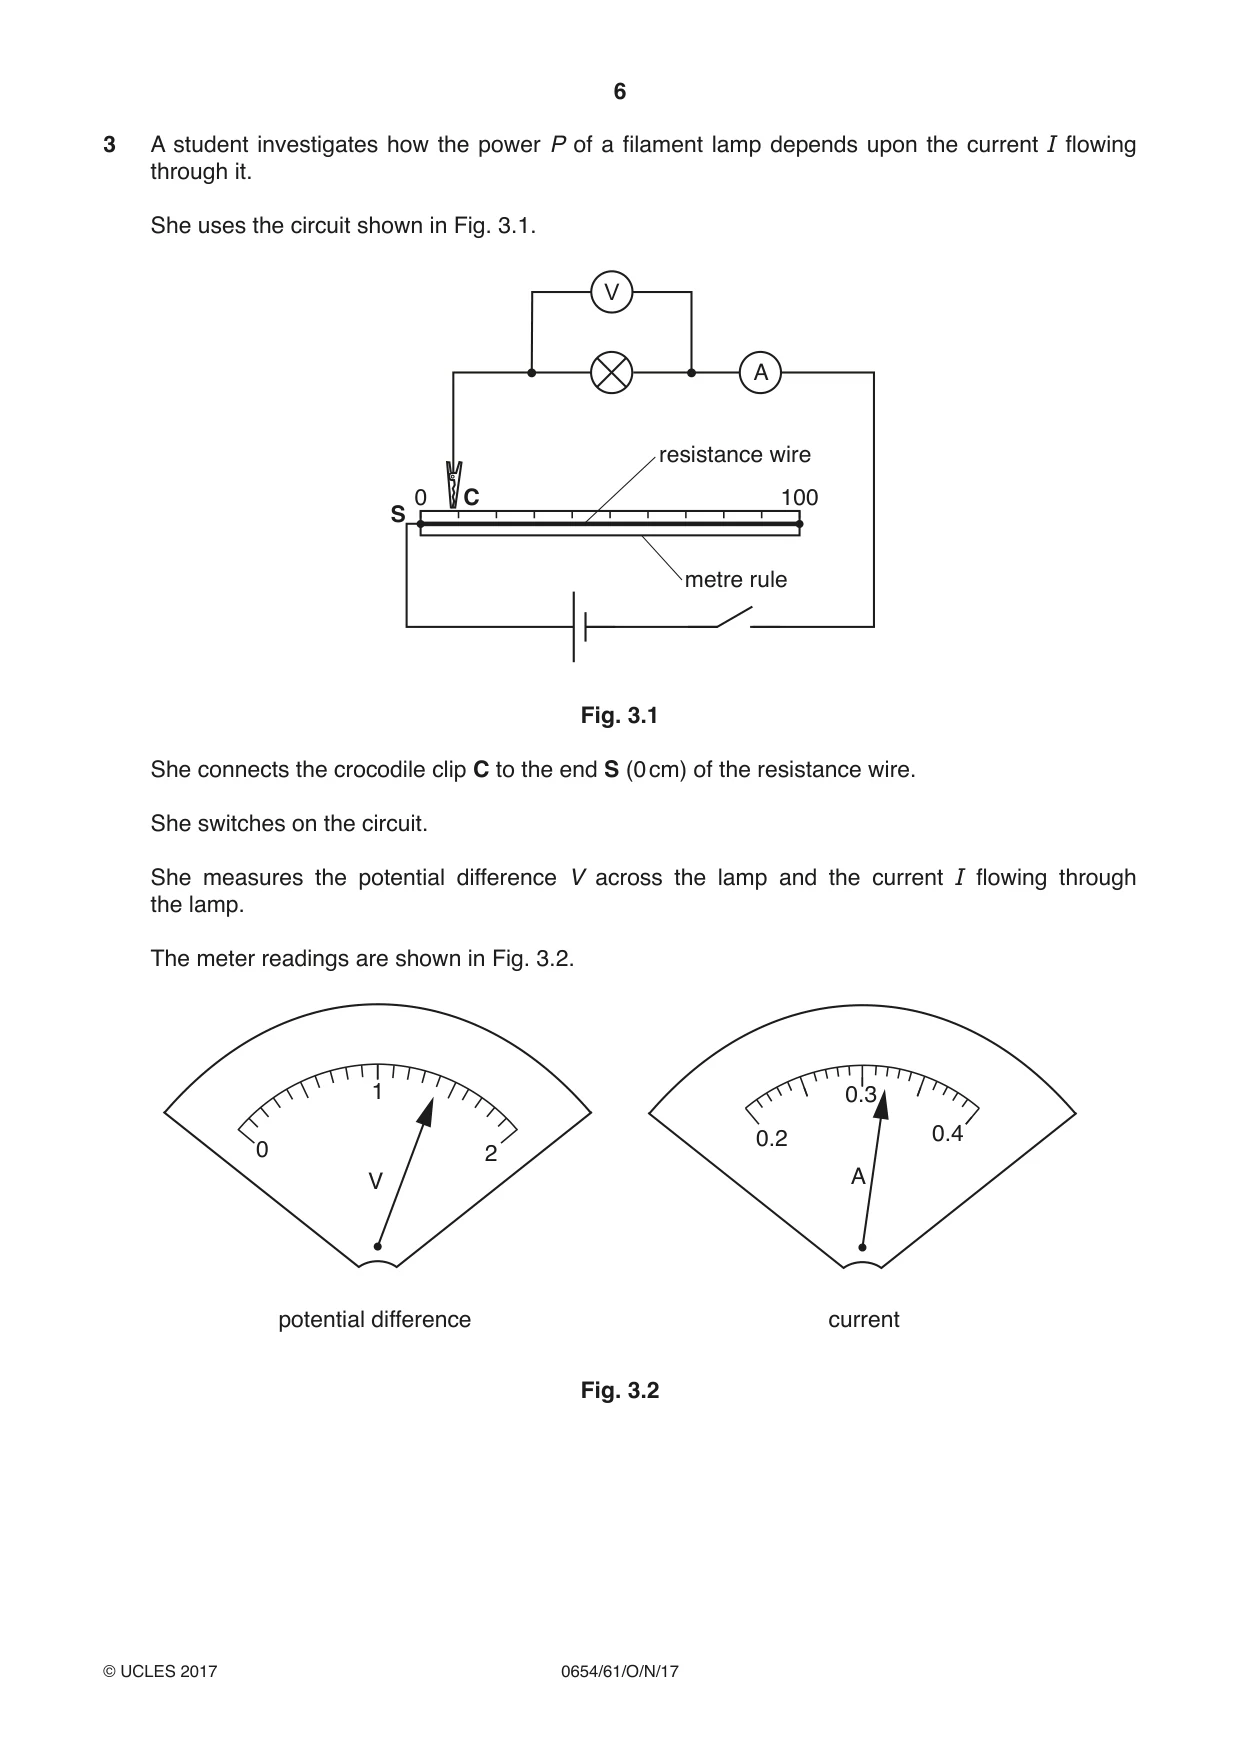
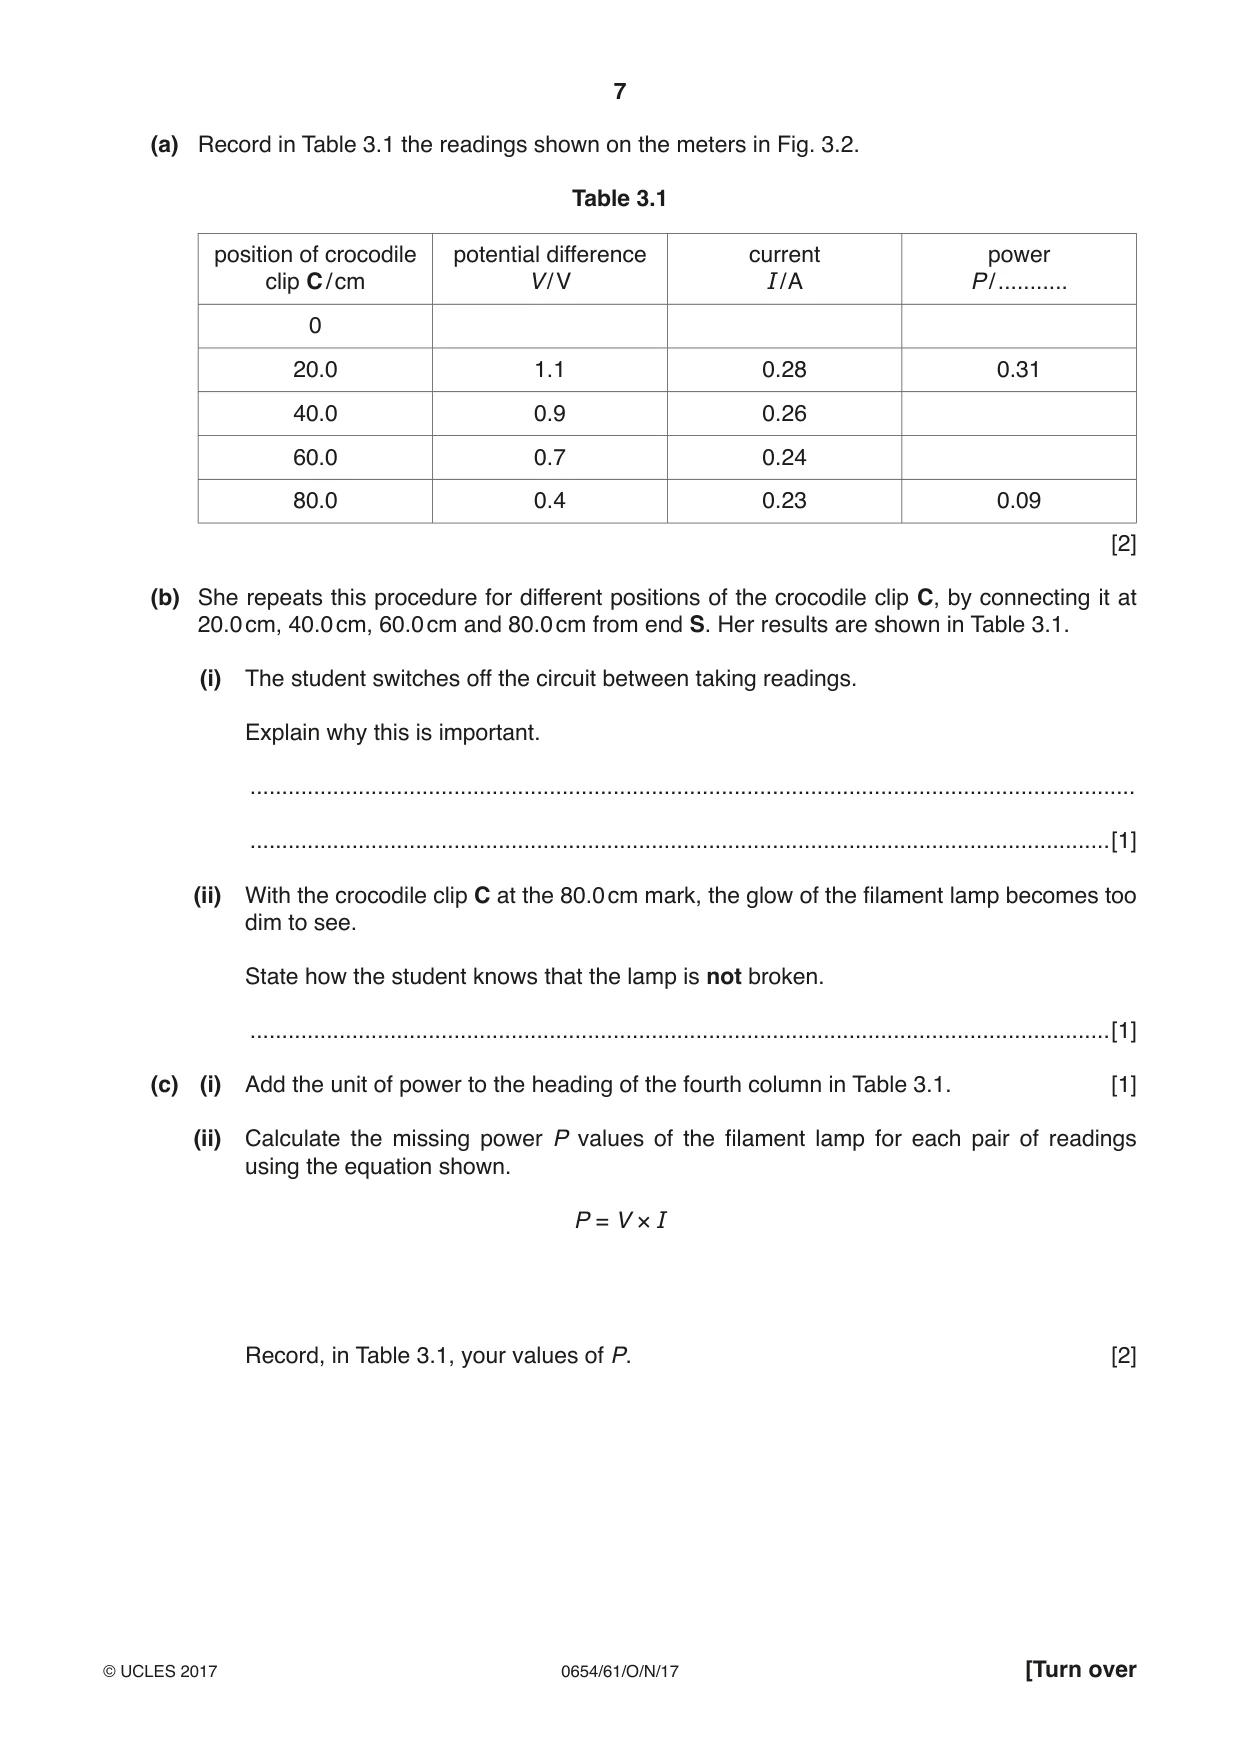
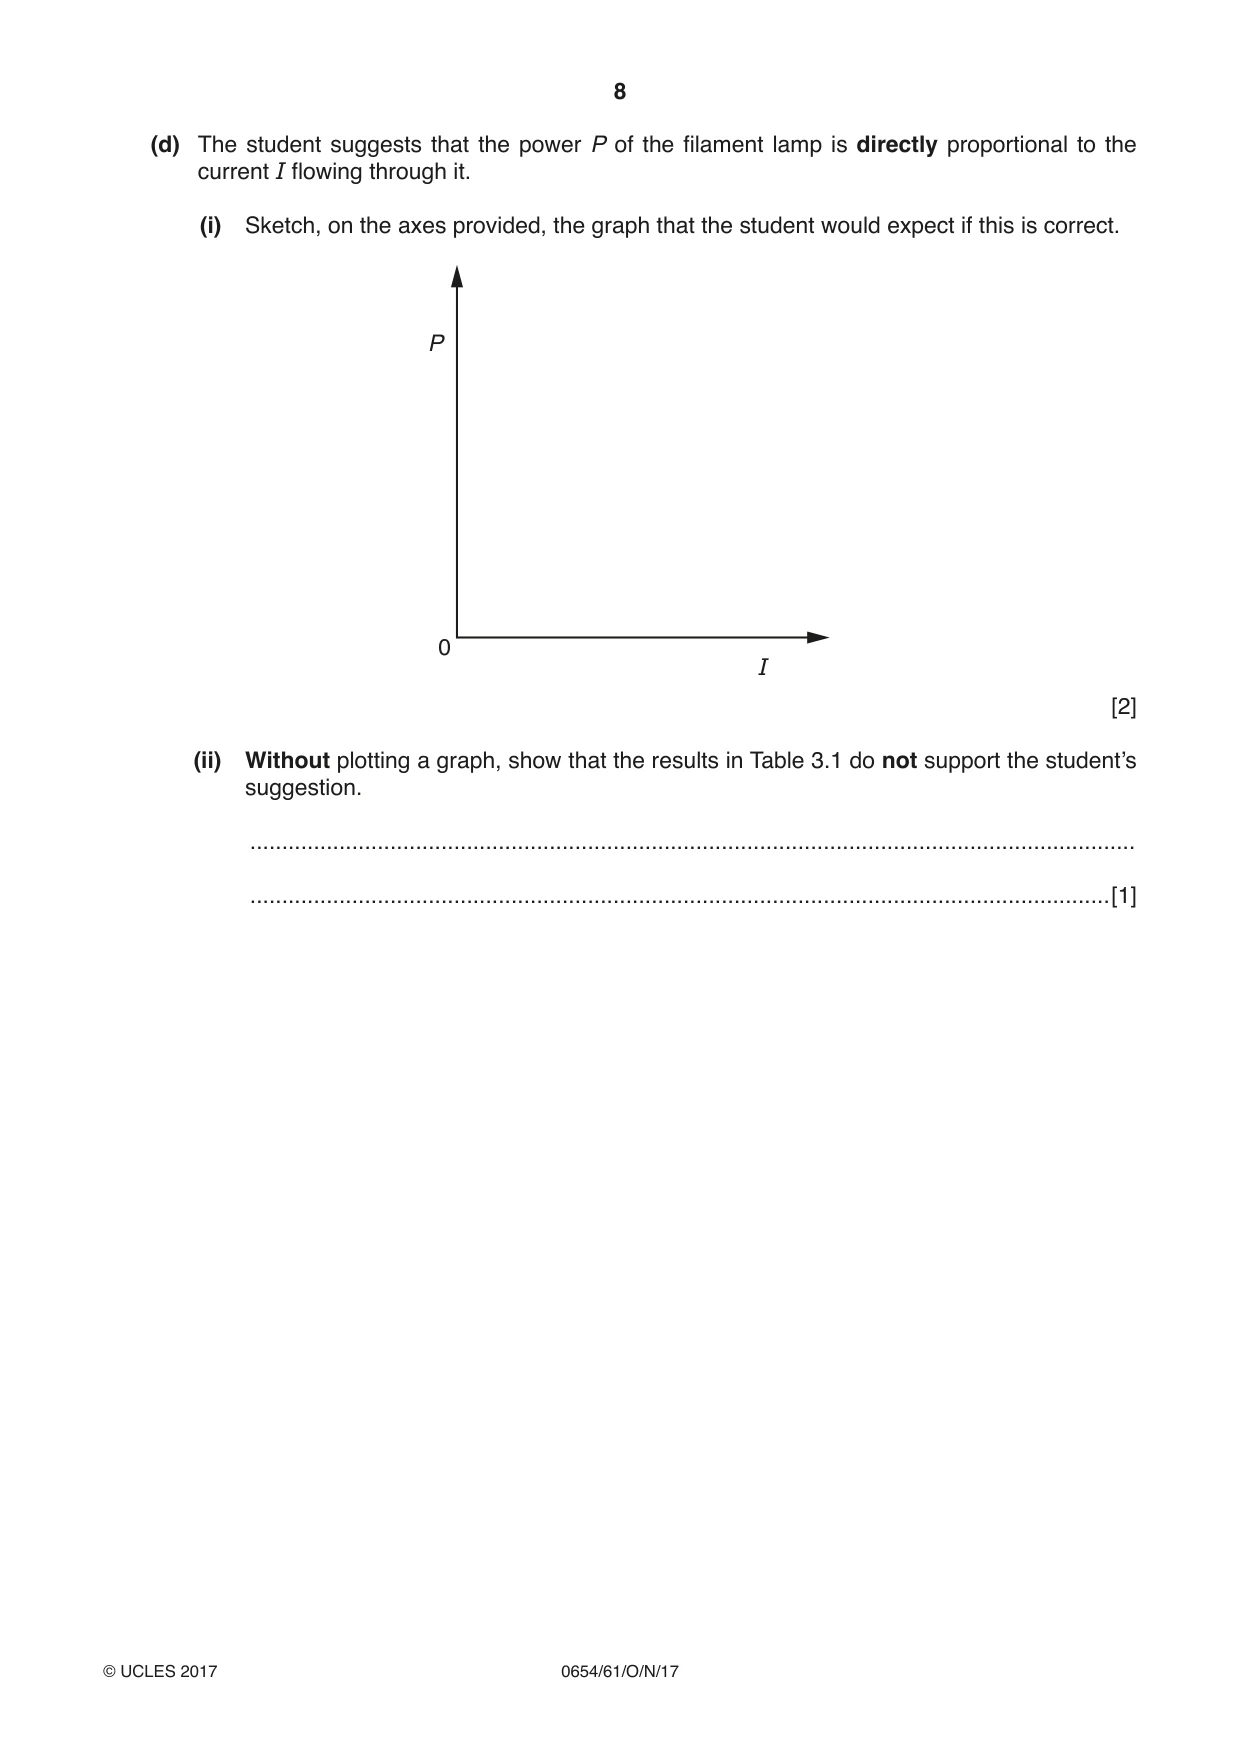
3 A student investigates how the power P of a filament lamp depends upon the current I flowing through it. She uses the circuit shown in Fig. 3.1. V A resistance wire 0 C 100 S metre rule Fig. 3.1 She connects the crocodile clip C to the end S (0 cm) of the resistance wire. She switches on the circuit. She measures the potential difference V across the lamp and the current I flowing through the lamp. The meter readings are shown in Fig. 3.2. 1 0.3 0.2 0.4 0 2 V A potential difference current Fig. 3.2 (a) Record in Table 3.1 the readings shown on the meters in Fig. 3.2. Table 3.1 position of crocodile potential difference current power clip C / cm V / V I / A P / ........... 0 20.0 1.1 0.28 0.31 40.0 0.9 0.26 60.0 0.7 0.24 80.0 0.4 0.23 0.09 [2] (b) She repeats this procedure for different positions of the crocodile clip C, by connecting it at 20.0 cm, 40.0 cm, 60.0 cm and 80.0 cm from end S. Her results are shown in Table 3.1. (i) The student switches off the circuit between taking readings. Explain why this is important. ........................................................................................................................................... .......................................................................................................................................[1] (ii) With the crocodile clip C at the 80.0 cm mark, the glow of the filament lamp becomes too dim to see. State how the student knows that the lamp is not broken. .......................................................................................................................................[1] (c) (i) Add the unit of power to the heading of the fourth column in Table 3.1. [1] (ii) Calculate the missing power P values of the filament lamp for each pair of readings using the equation shown. P = V × I Record, in Table 3.1, your values of P. [2] (d) The student suggests that the power P of the filament lamp is directly proportional to the current I flowing through it. (i) Sketch, on the axes provided, the graph that the student would expect if this is correct. P 0 I [2] (ii) Without plotting a graph, show that the results in Table 3.1 do not support the student’s suggestion. ........................................................................................................................................... .......................................................................................................................................[1] Please turn over for Question 4.
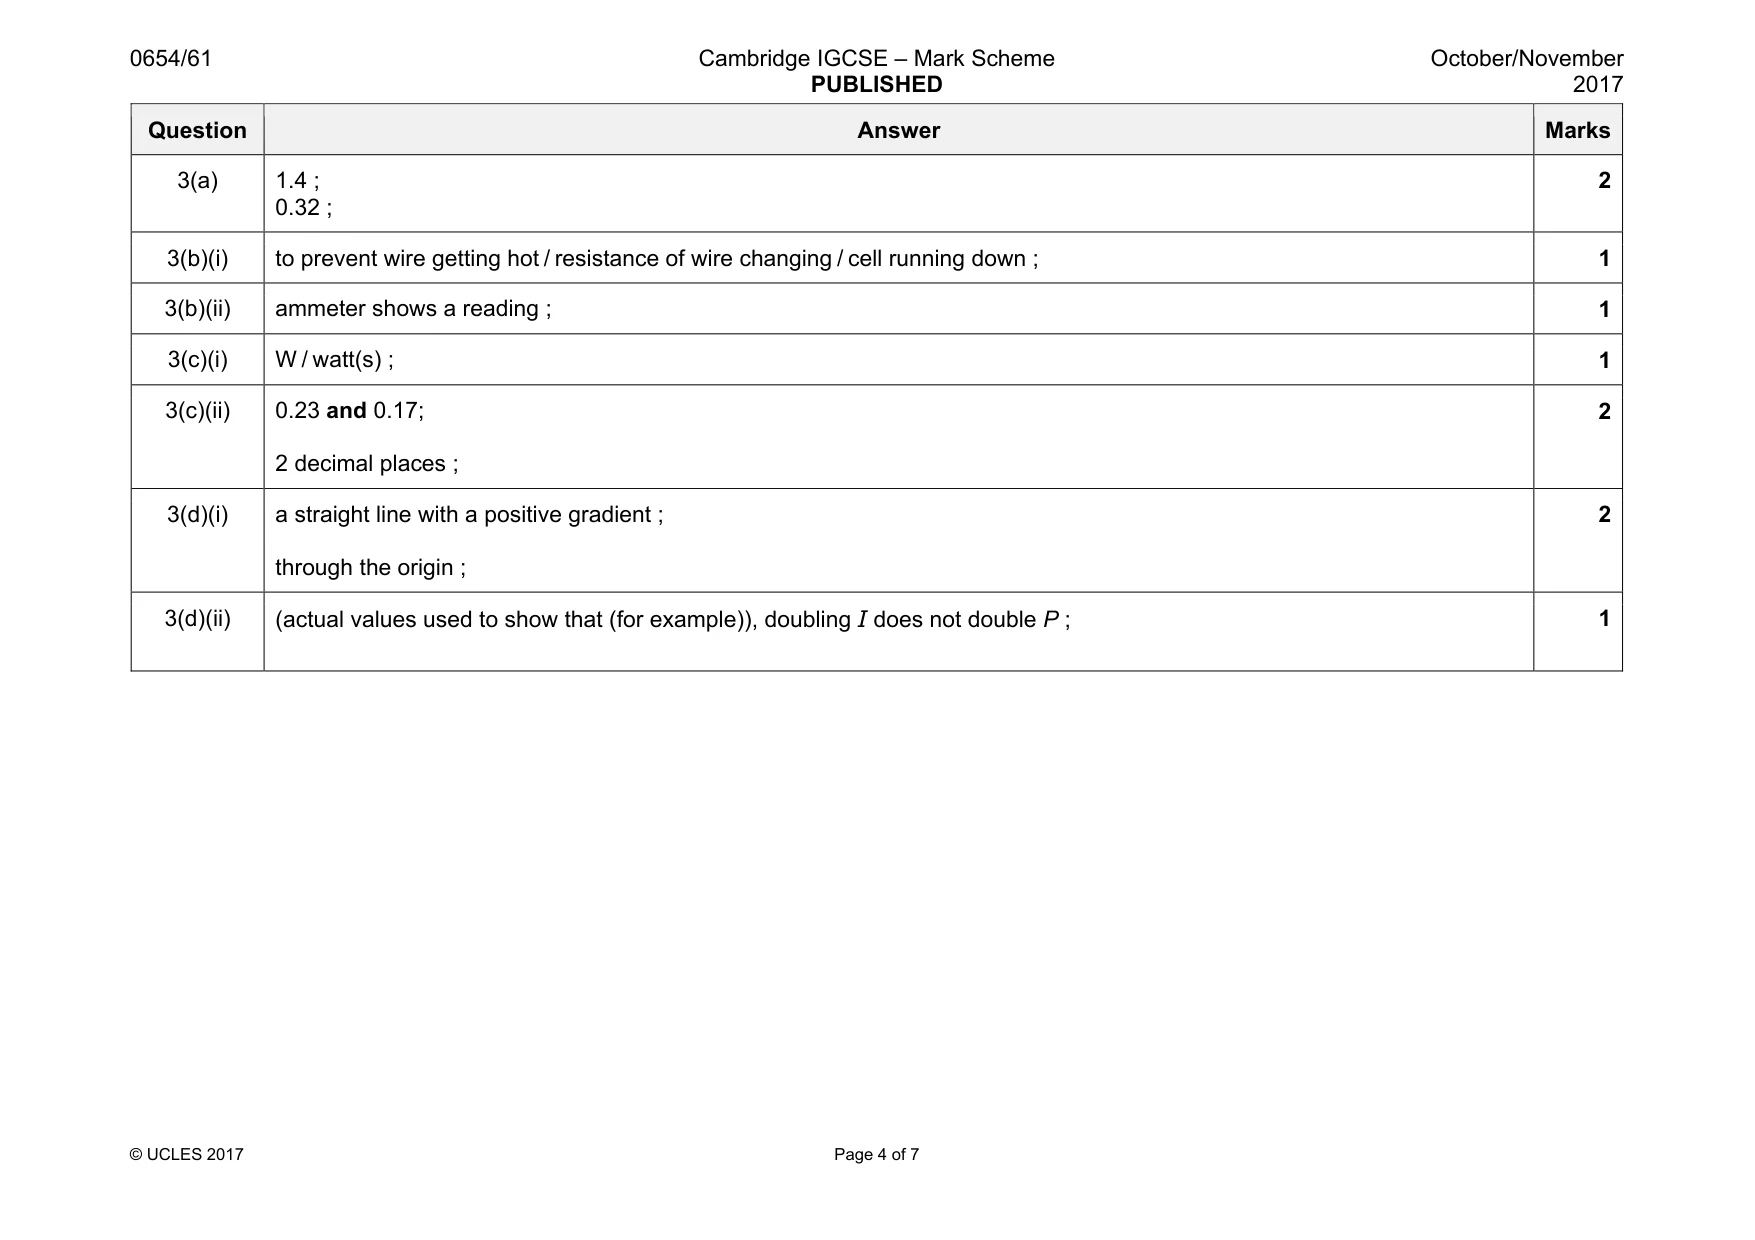
Mark scheme: 3(a) 1.4 ; 0.32 ; 2 3(b)(i) to prevent wire getting hot / resistance of wire changing / cell running down ; 1 3(b)(ii) ammeter shows a reading ; 1 3(c)(i) W / watt(s) ; 1 3(c)(ii) 0.23 and 0.17; 2 decimal places ; 2 3(d)(i) a straight line with a positive gradient ; through the origin ; 2 3(d)(ii) (actual values used to show that (for example)), doubling I does not double P ; 1
Q4 · A student is studying cells using a light microscope
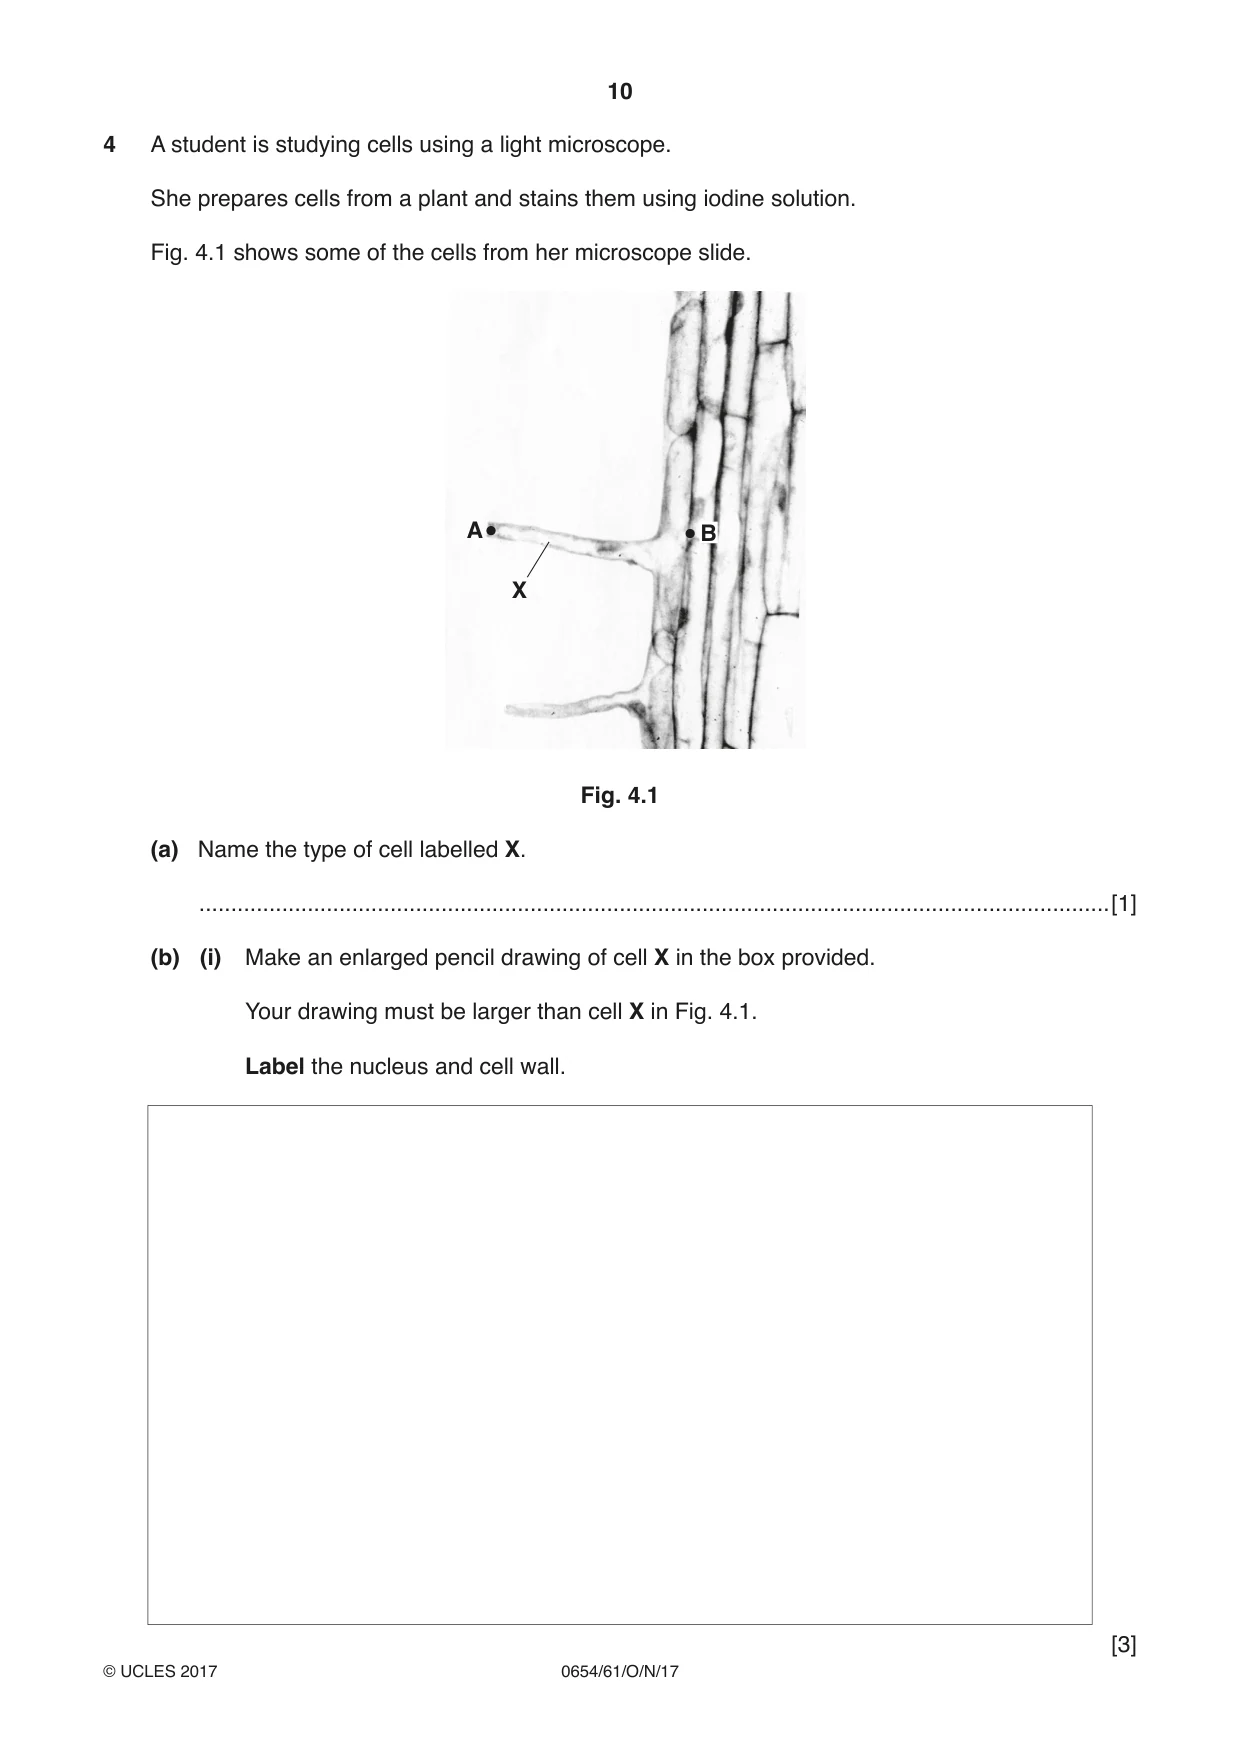
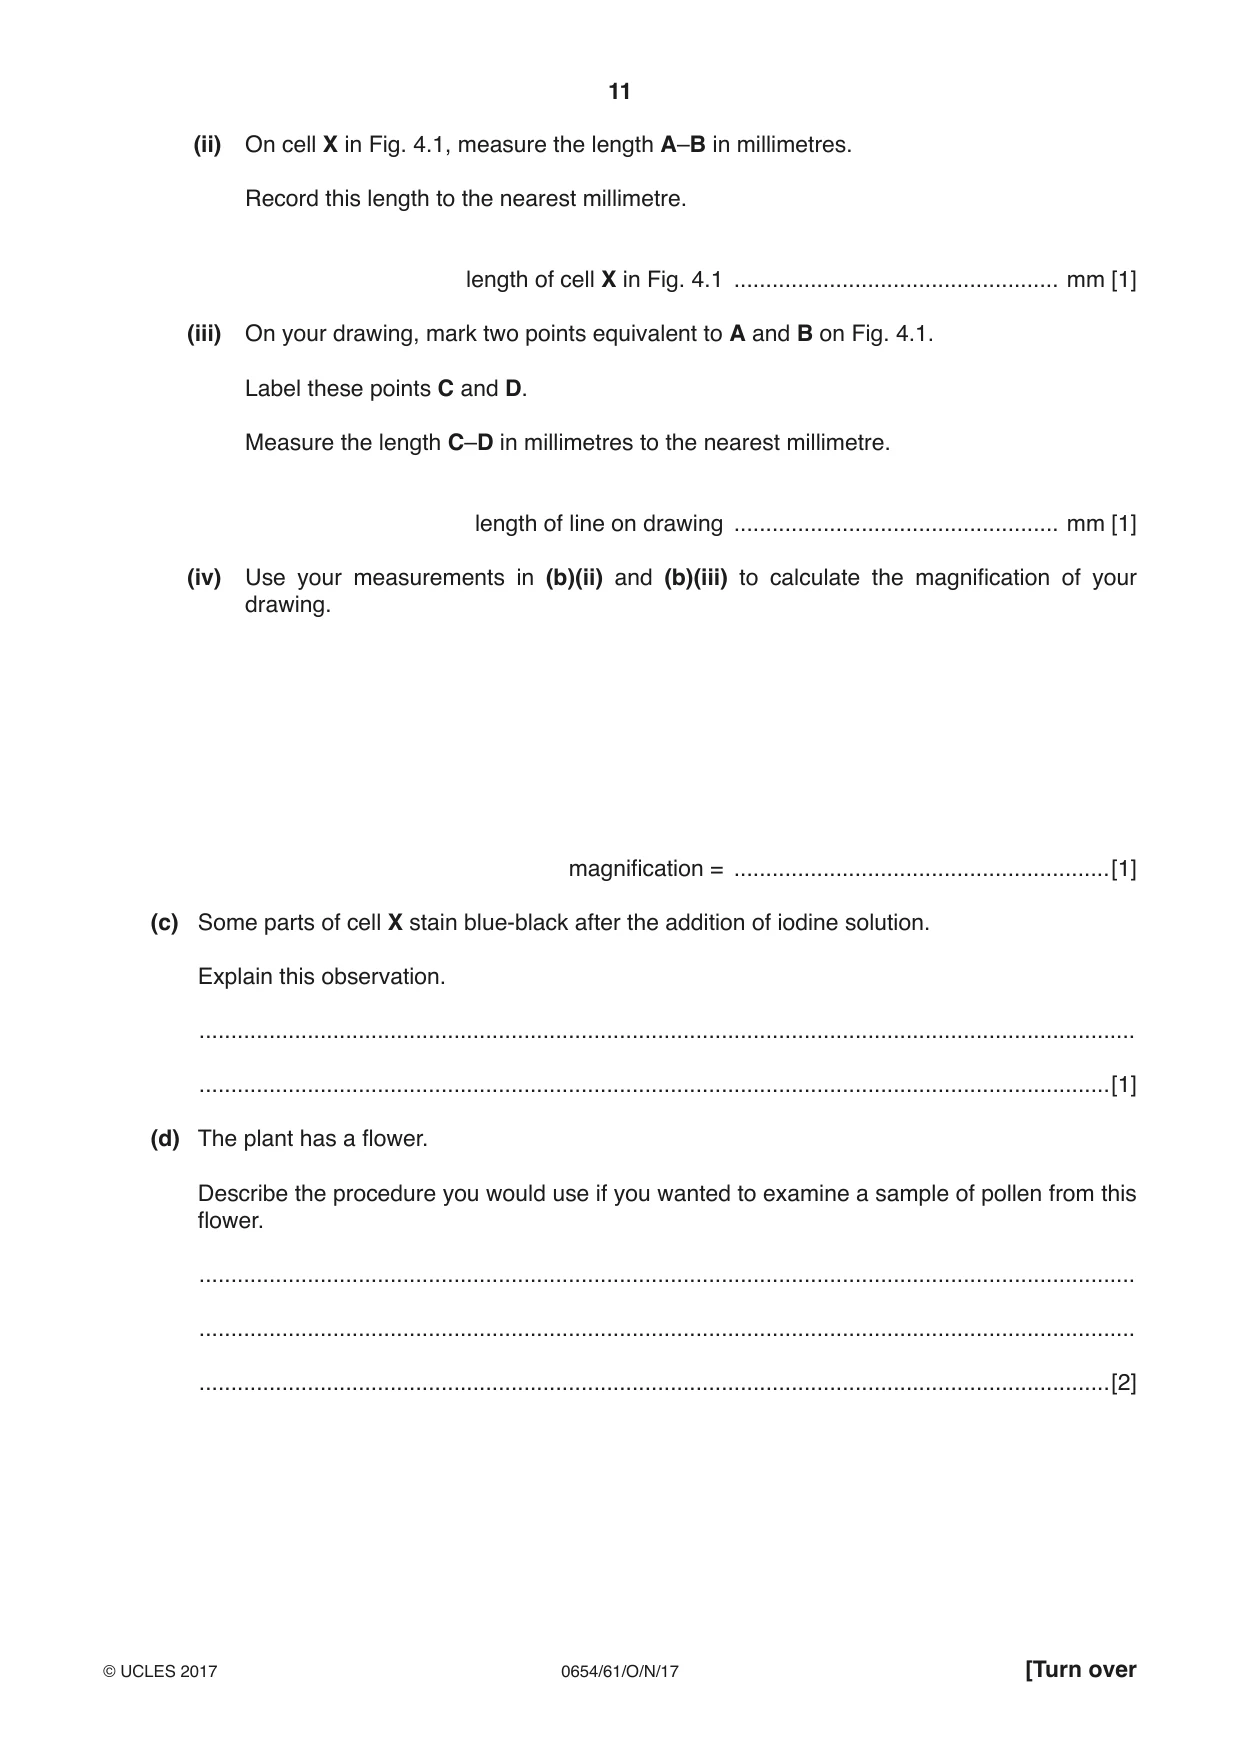
4 A student is studying cells using a light microscope. She prepares cells from a plant and stains them using iodine solution. Fig. 4.1 shows some of the cells from her microscope slide. A B X Fig. 4.1 (a) Name the type of cell labelled X. ...............................................................................................................................................[1] (b) (i) Make an enlarged pencil drawing of cell X in the box provided. Your drawing must be larger than cell X in Fig. 4.1. Label the nucleus and cell wall. (ii) On cell X in Fig. 4.1, measure the length A–B in millimetres. Record this length to the nearest millimetre. length of cell X in Fig. 4.1 ................................................... mm [1] (iii) On your drawing, mark two points equivalent to A and B on Fig. 4.1. Label these points C and D. Measure the length C–D in millimetres to the nearest millimetre. length of line on drawing ................................................... mm [1] (iv) Use your measurements in (b)(ii) and (b)(iii) to calculate the magnification of your drawing. magnification = ...........................................................[1] (c) Some parts of cell X stain blue-black after the addition of iodine solution. Explain this observation. ................................................................................................................................................... ...............................................................................................................................................[1] (d) The plant has a flower. Describe the procedure you would use if you wanted to examine a sample of pollen from this flower. ................................................................................................................................................... ................................................................................................................................................... ...............................................................................................................................................[2]
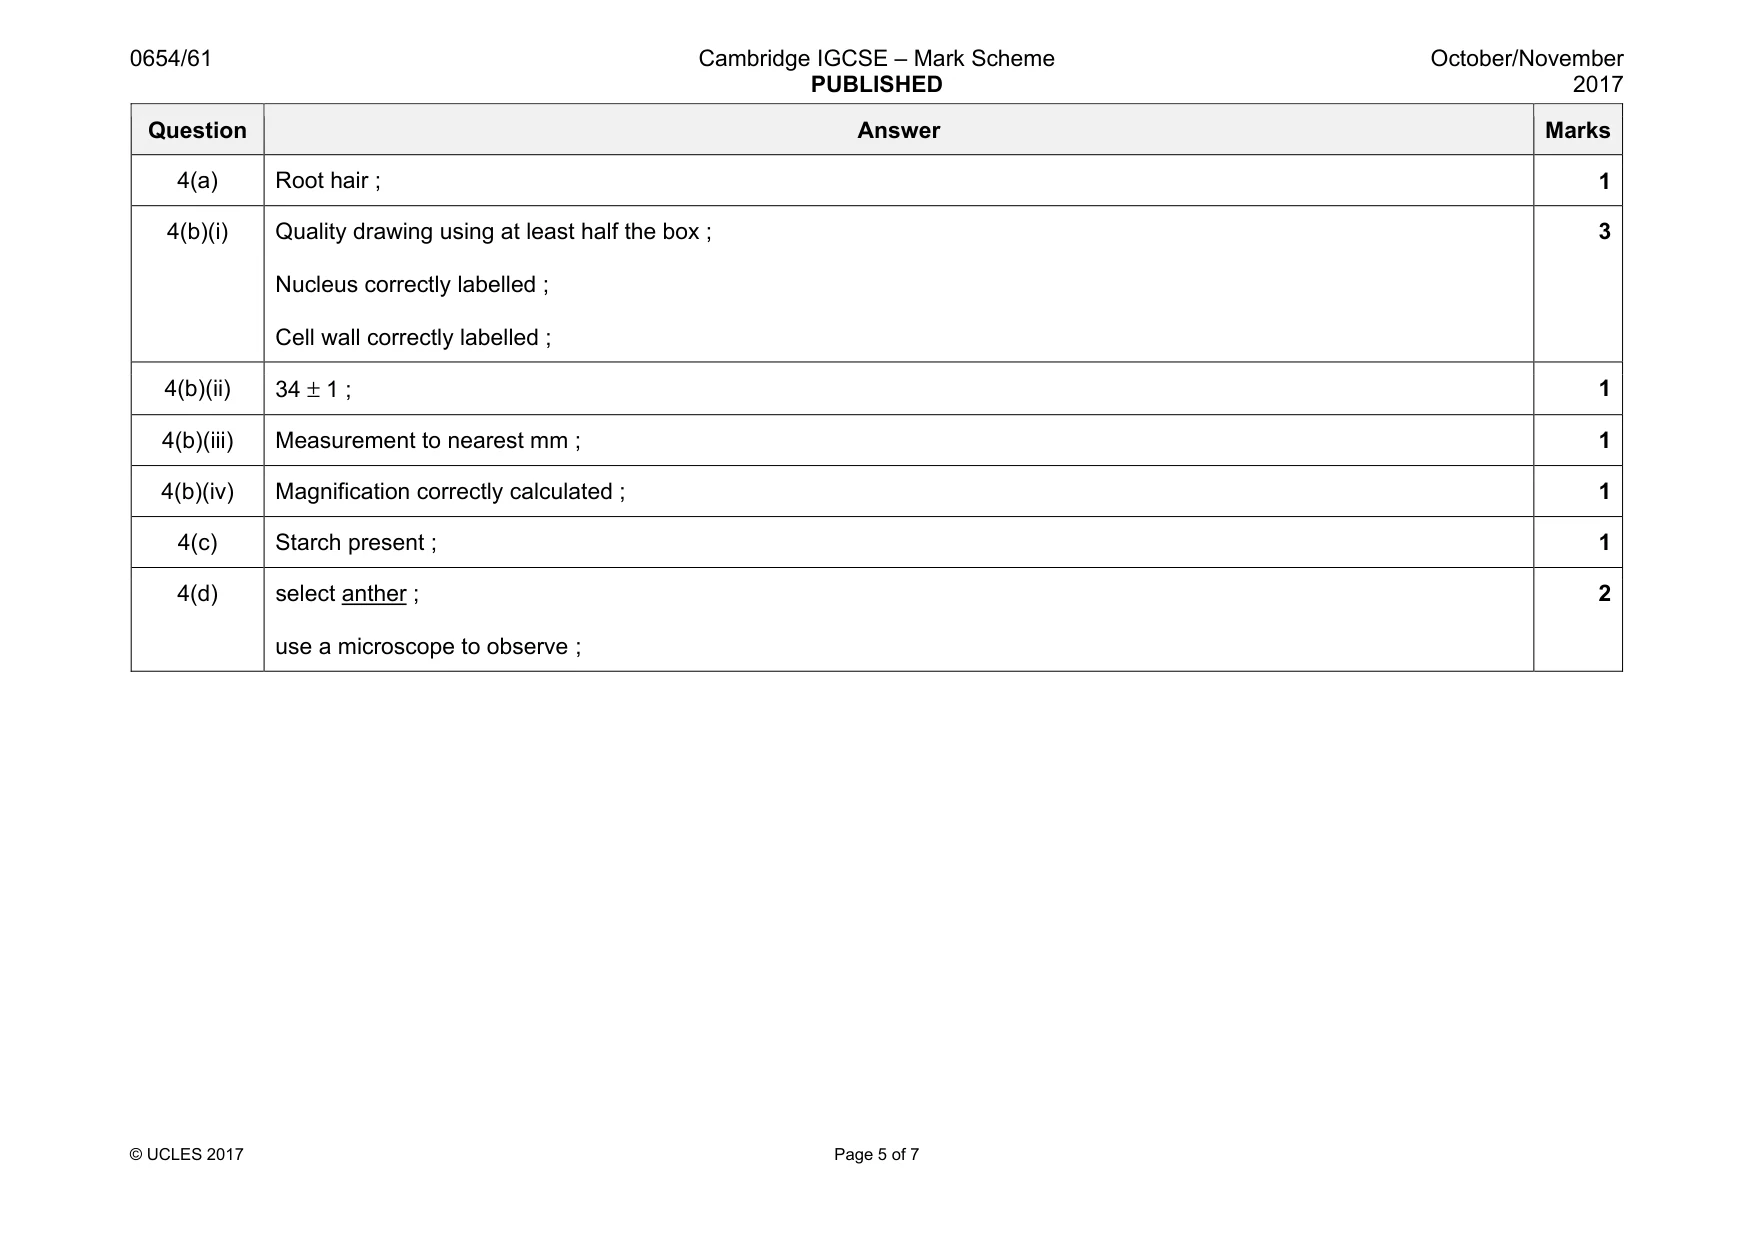
Mark scheme: 4(a) Root hair ; 1 4(b)(i) Quality drawing using at least half the box ; Nucleus correctly labelled ; Cell wall correctly labelled ; 3 4(b)(ii) 34 ± 1 ; 1 4(b)(iii) Measurement to nearest mm ; 1 4(b)(iv) Magnification correctly calculated ; 1 4(c) Starch present ; 1 4(d) select anther ; use a microscope to observe ; 2
Q5 · A student investigates the electroplating of copper onto metals
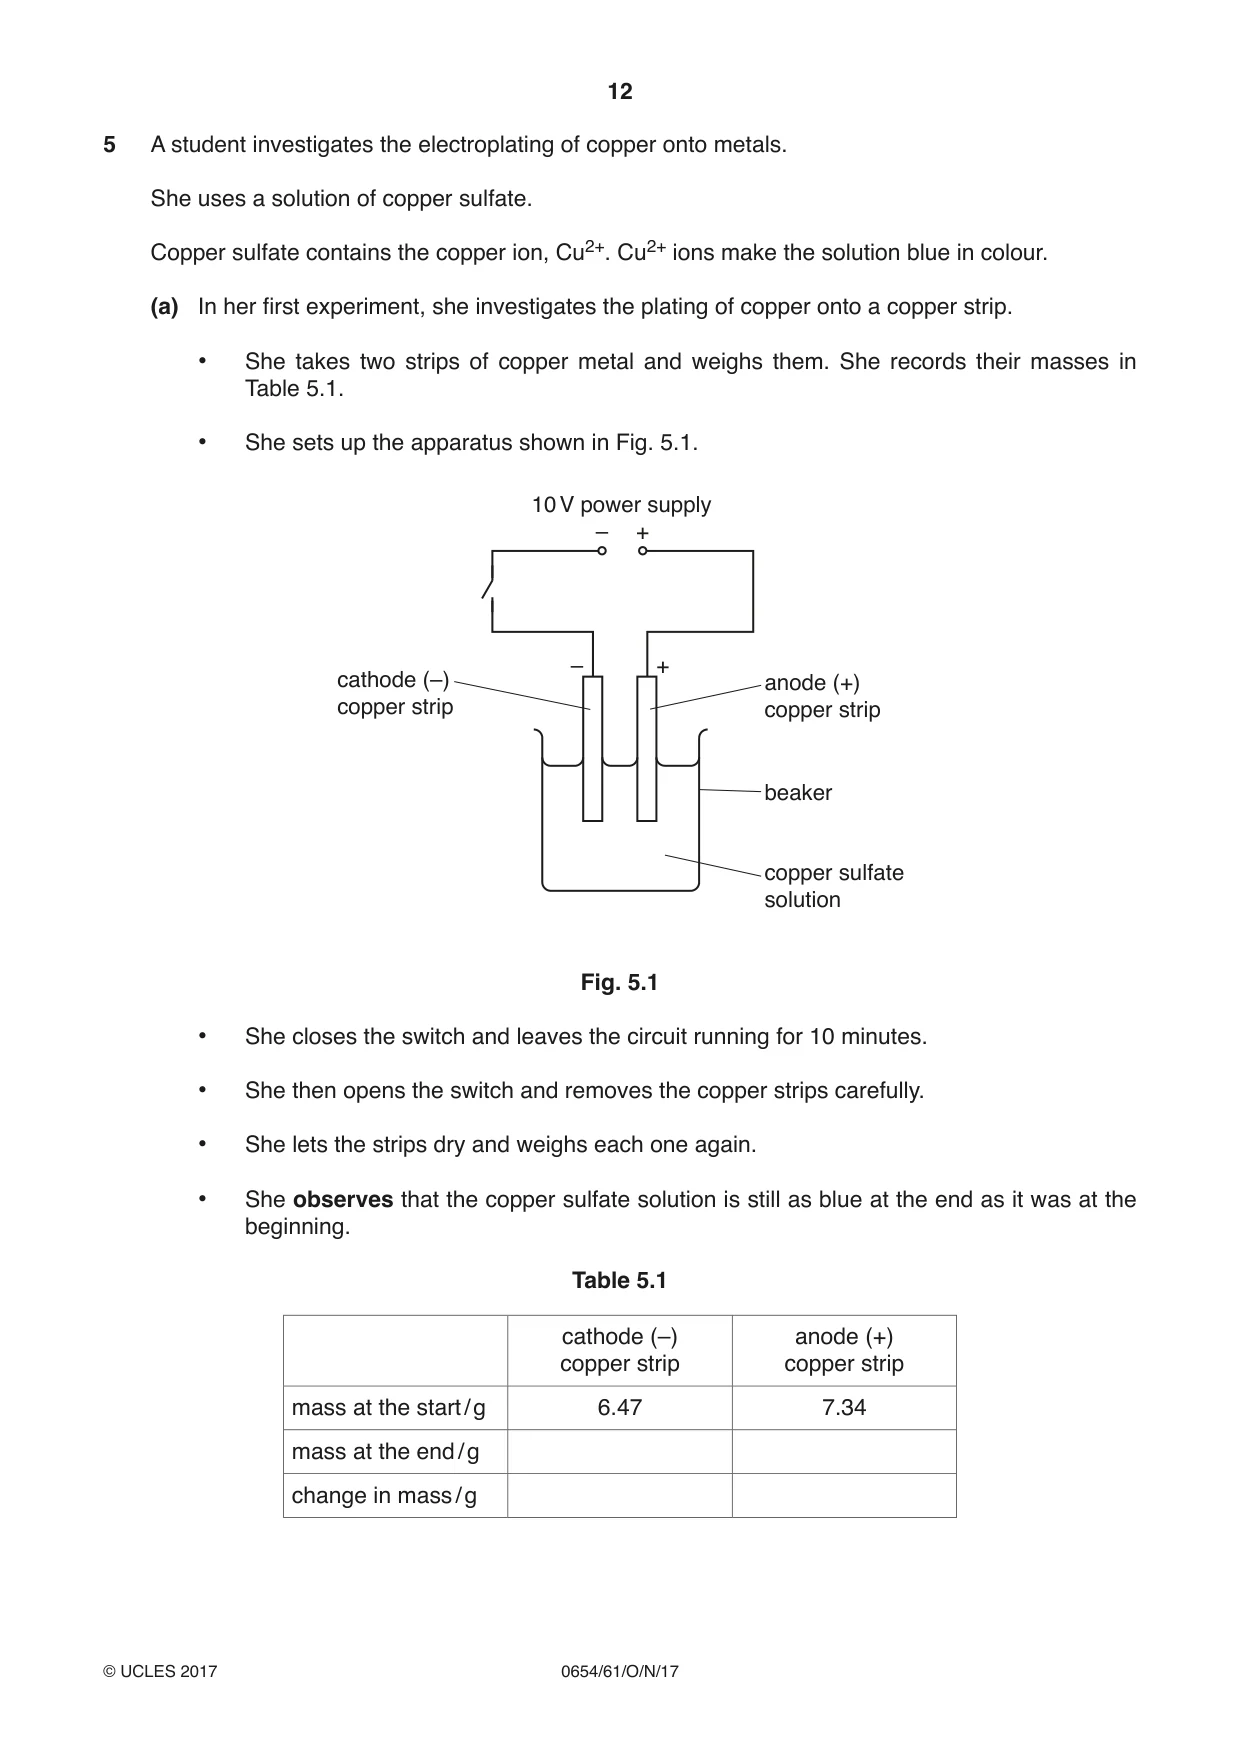
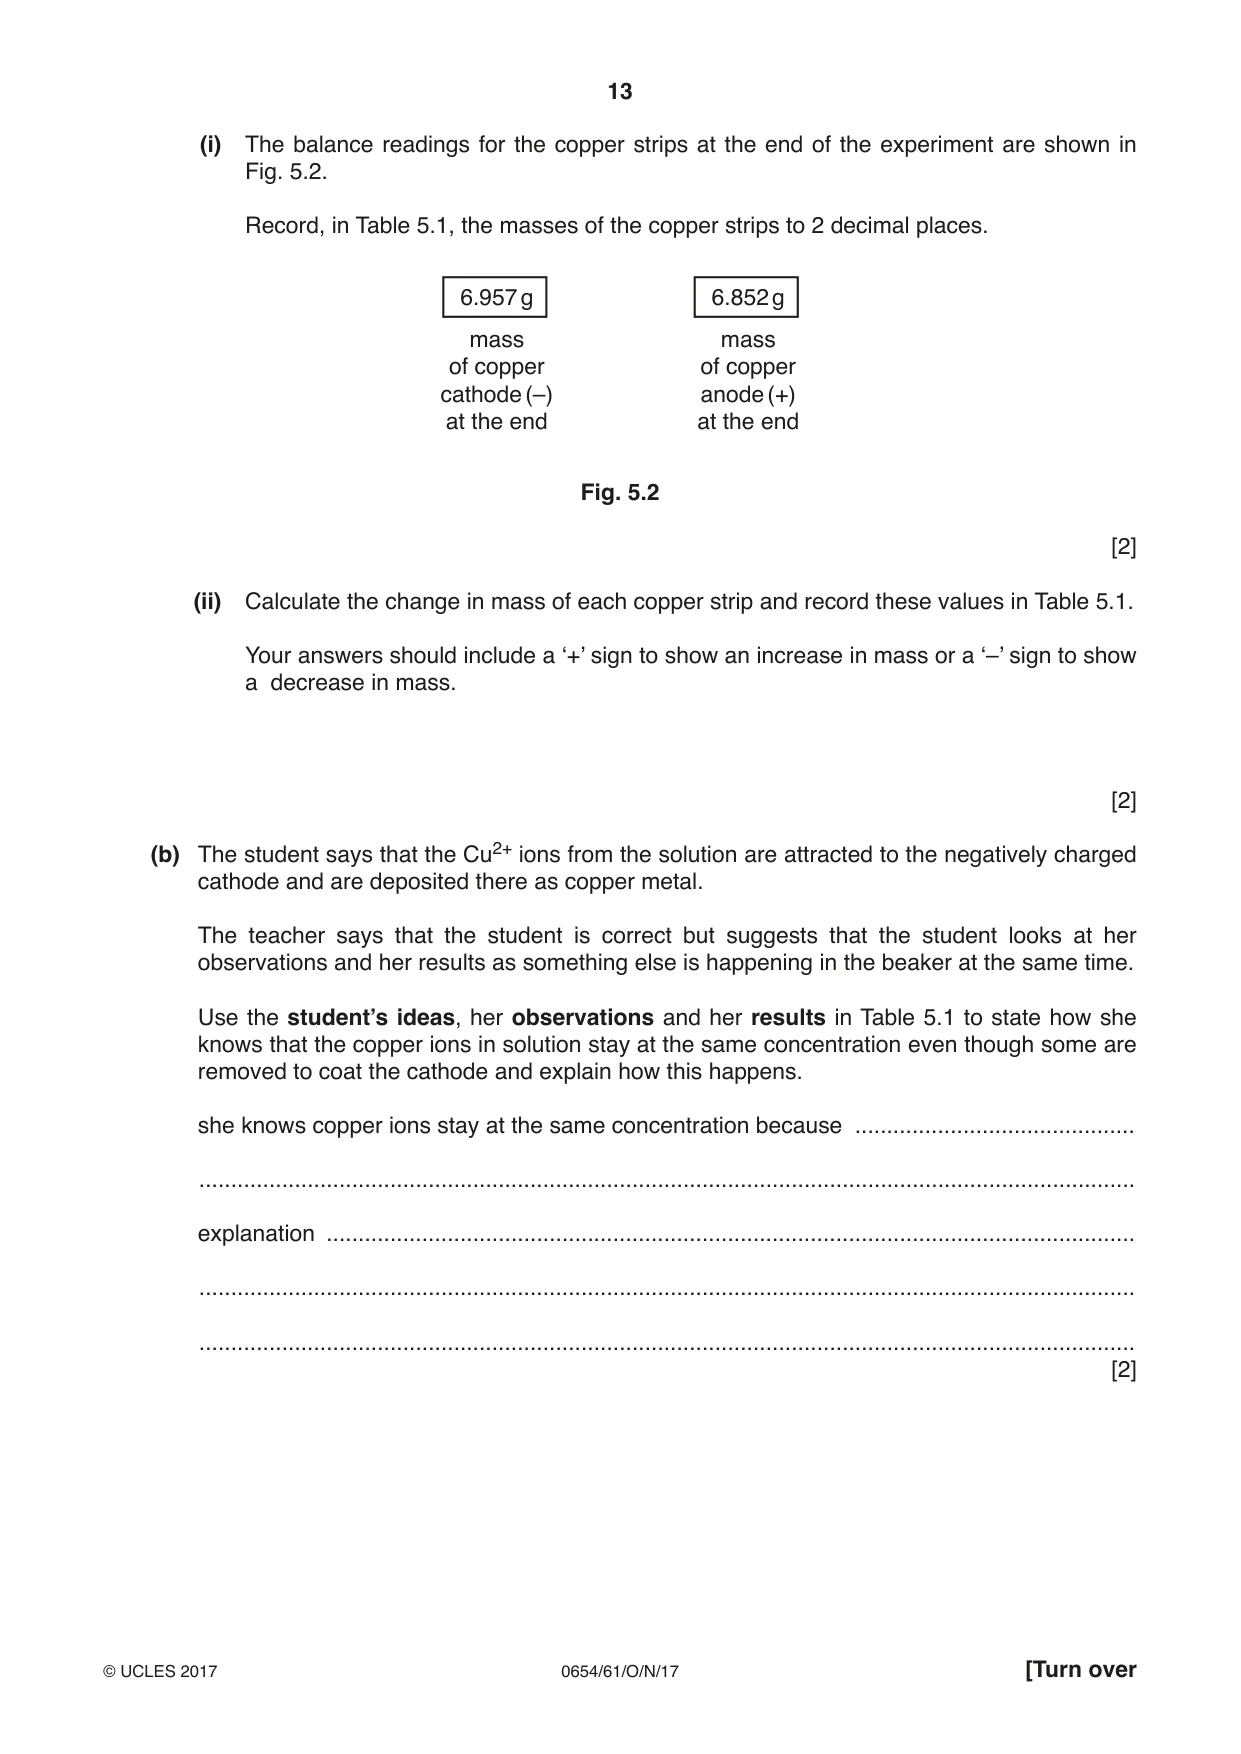
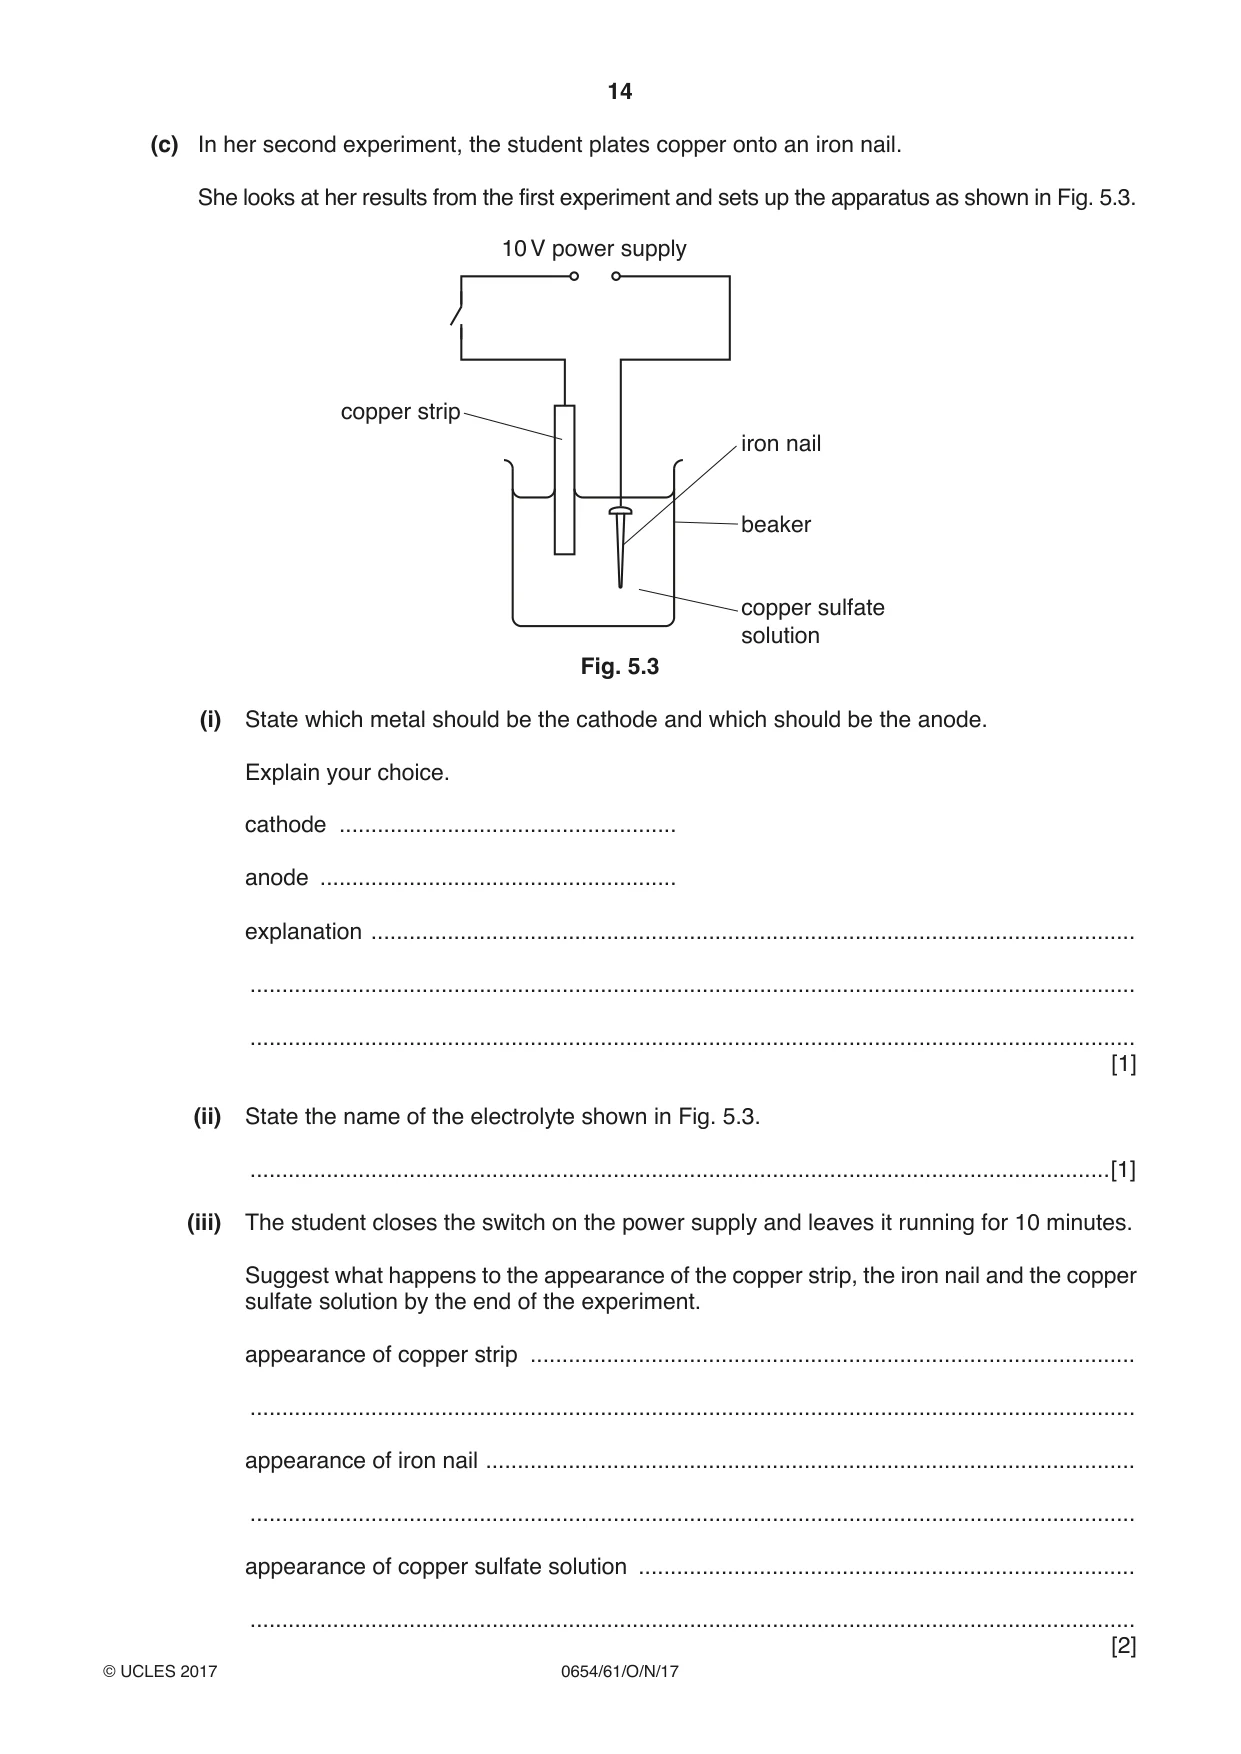
5 A student investigates the electroplating of copper onto metals. She uses a solution of copper sulfate. Copper sulfate contains the copper ion, Cu2+. Cu2+ ions make the solution blue in colour. (a) In her first experiment, she investigates the plating of copper onto a copper strip. • She takes two strips of copper metal and weighs them. She records their masses in Table 5.1. • She sets up the apparatus shown in Fig. 5.1. 10 V power supply – + – + cathode (–) anode (+) copper strip copper strip beaker copper sulfate solution Fig. 5.1 • She closes the switch and leaves the circuit running for 10 minutes. • She then opens the switch and removes the copper strips carefully. • She lets the strips dry and weighs each one again. • She observes that the copper sulfate solution is still as blue at the end as it was at the beginning. Table 5.1 cathode (–) anode (+) copper strip copper strip mass at the start / g 6.47 7.34 mass at the end / g change in mass / g (i) The balance readings for the copper strips at the end of the experiment are shown in Fig. 5.2. Record, in Table 5.1, the masses of the copper strips to 2 decimal places. 6.957 g 6.852 g mass mass of copper of copper cathode (–) anode (+) at the end at the end Fig. 5.2 [2] (ii) Calculate the change in mass of each copper strip and record these values in Table 5.1. Your answers should include a ‘+’ sign to show an increase in mass or a ‘–’ sign to show a decrease in mass. [2] (b) The student says that the Cu2+ ions from the solution are attracted to the negatively charged cathode and are deposited there as copper metal. The teacher says that the student is correct but suggests that the student looks at her observations and her results as something else is happening in the beaker at the same time. Use the student’s ideas, her observations and her results in Table 5.1 to state how she knows that the copper ions in solution stay at the same concentration even though some are removed to coat the cathode and explain how this happens. she knows copper ions stay at the same concentration because ............................................ ................................................................................................................................................... explanation ............................................................................................................................... ................................................................................................................................................... ................................................................................................................................................... [2] (c) In her second experiment, the student plates copper onto an iron nail. She looks at her results from the first experiment and sets up the apparatus as shown in Fig. 5.3. 10 V power supply copper strip iron nail beaker copper sulfate solution Fig. 5.3 (i) State which metal should be the cathode and which should be the anode. Explain your choice. cathode ..................................................... anode ........................................................ explanation ........................................................................................................................ ........................................................................................................................................... ........................................................................................................................................... [1] (ii) State the name of the electrolyte shown in Fig. 5.3. .......................................................................................................................................[1] (iii) The student closes the switch on the power supply and leaves it running for 10 minutes. Suggest what happens to the appearance of the copper strip, the iron nail and the copper sulfate solution by the end of the experiment. appearance of copper strip ............................................................................................... ........................................................................................................................................... appearance of iron nail ...................................................................................................... ........................................................................................................................................... appearance of copper sulfate solution .............................................................................. ........................................................................................................................................... Please turn over for Question 6.
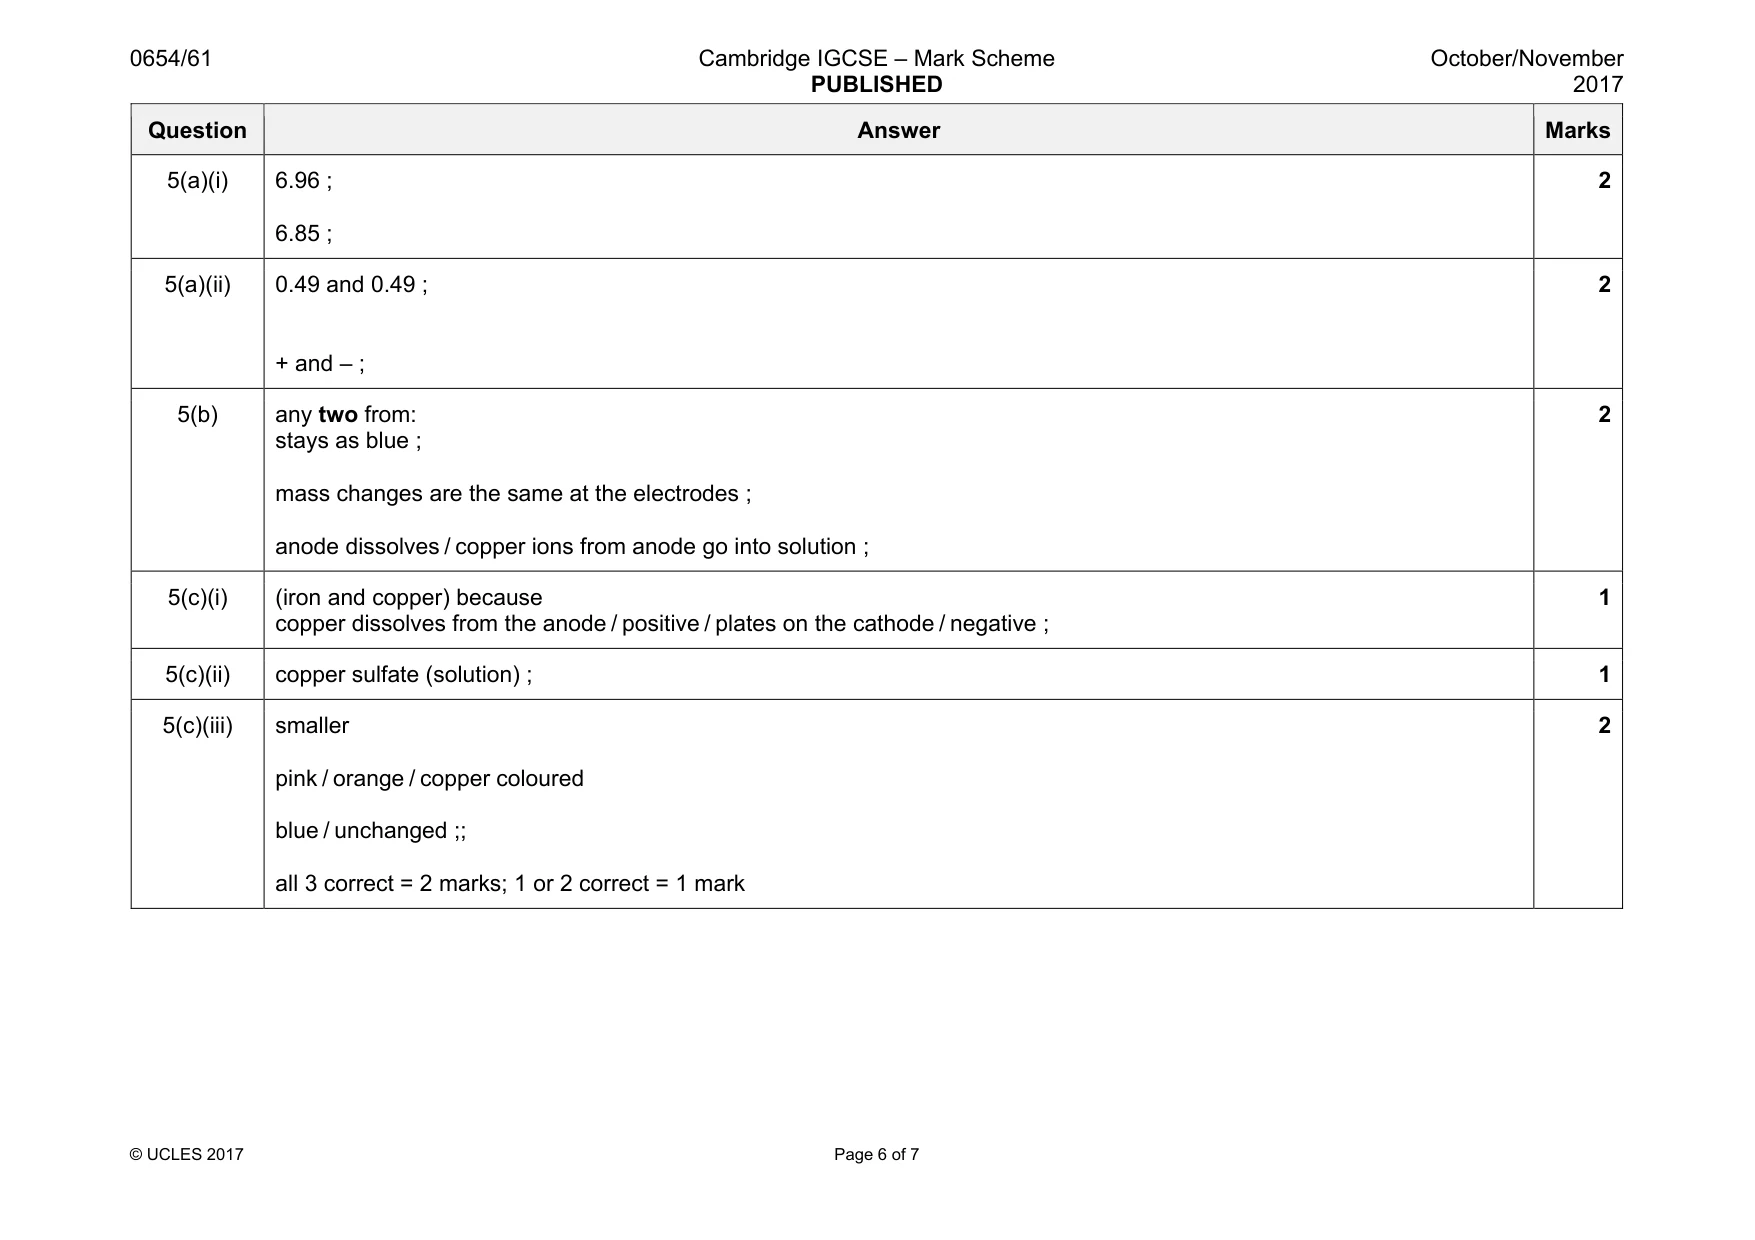
Mark scheme: 5(a)(i) 6.96 ; 6.85 ; 2 5(a)(ii) 0.49 and 0.49 ; + and – ; 2 5(b) any two from: stays as blue ; mass changes are the same at the electrodes ; anode dissolves / copper ions from anode go into solution ; 2 5(c)(i) (iron and copper) because copper dissolves from the anode / positive / plates on the cathode / negative ; 1 5(c)(ii) copper sulfate (solution) ; 1 5(c)(iii) smaller pink / orange / copper coloured blue / unchanged ;; all 3 correct = 2 marks; 1 or 2 correct = 1 mark 2
Q6 · A student measures the acceleration g due to gravity by timing a small steel ball rolling…
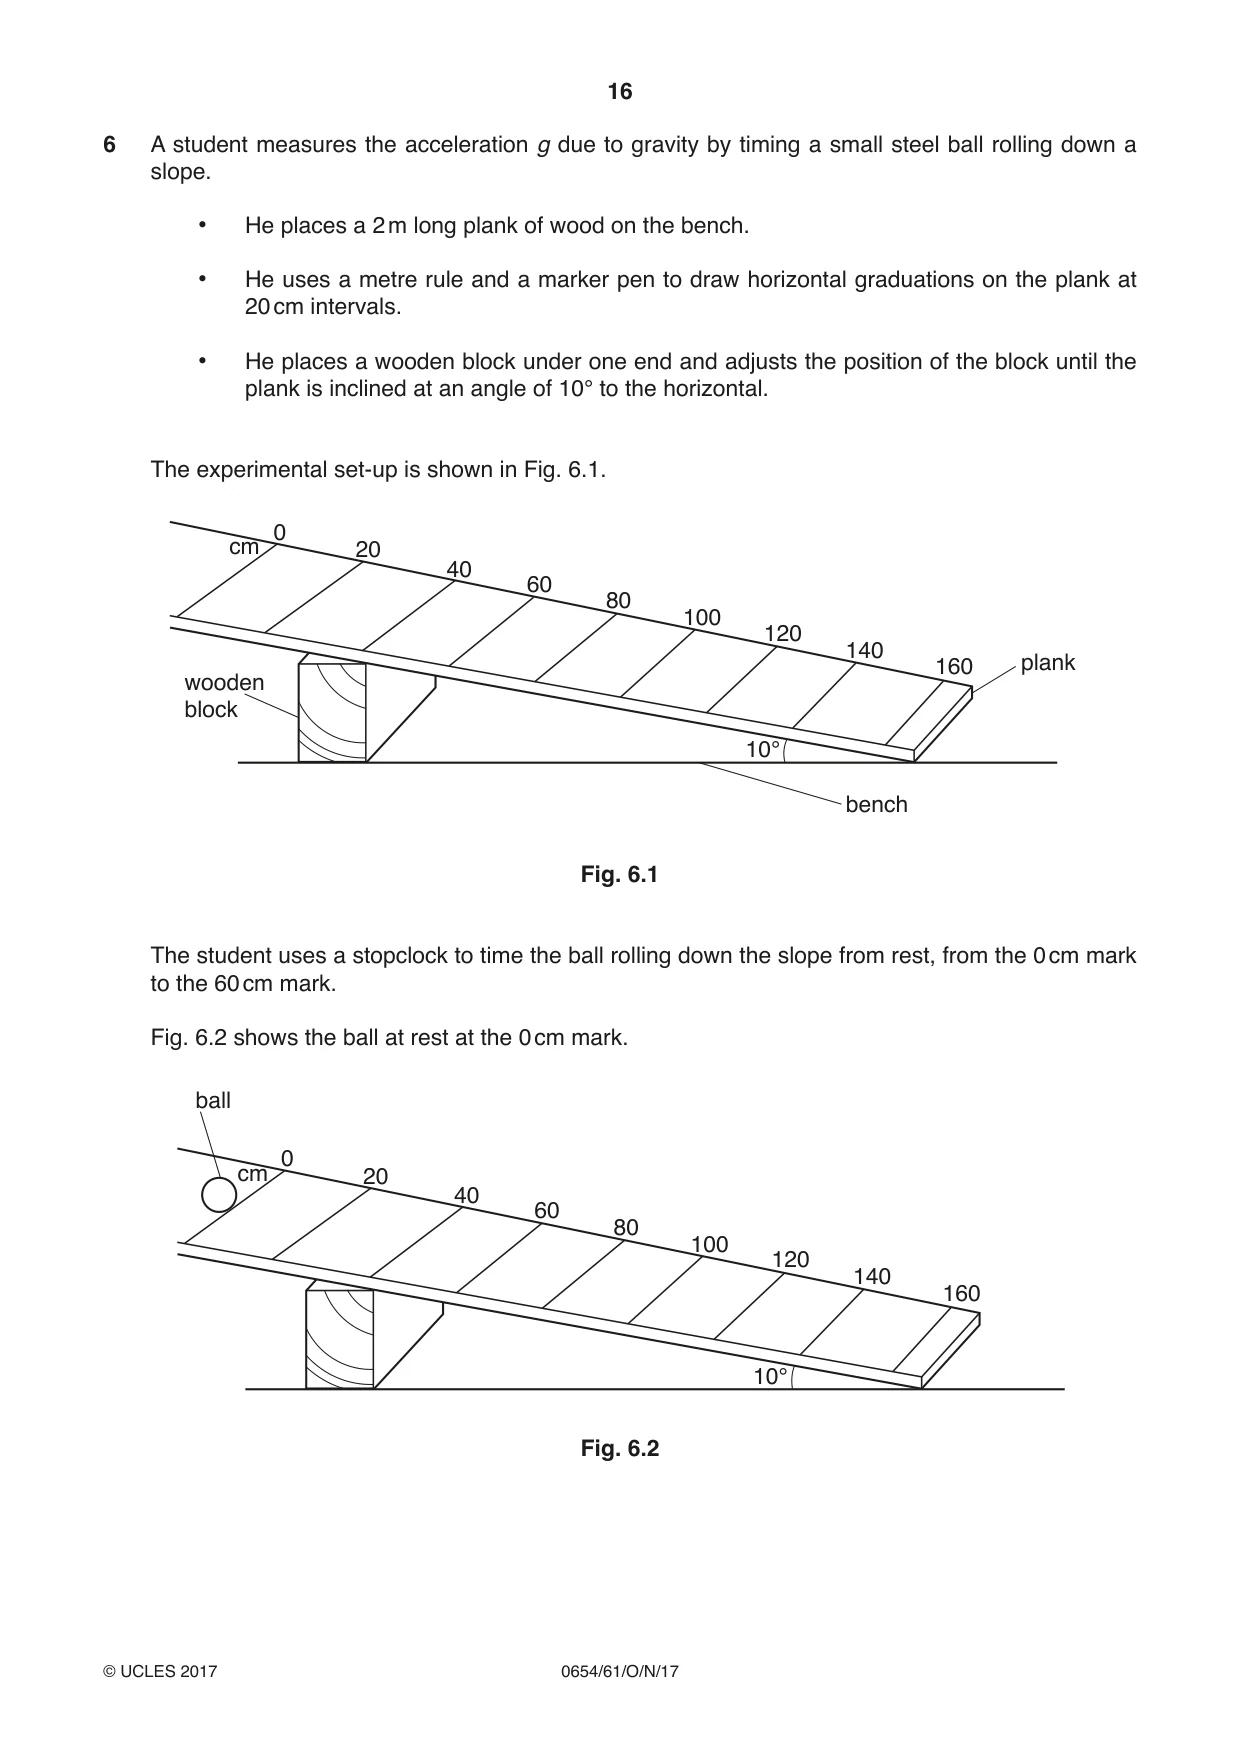
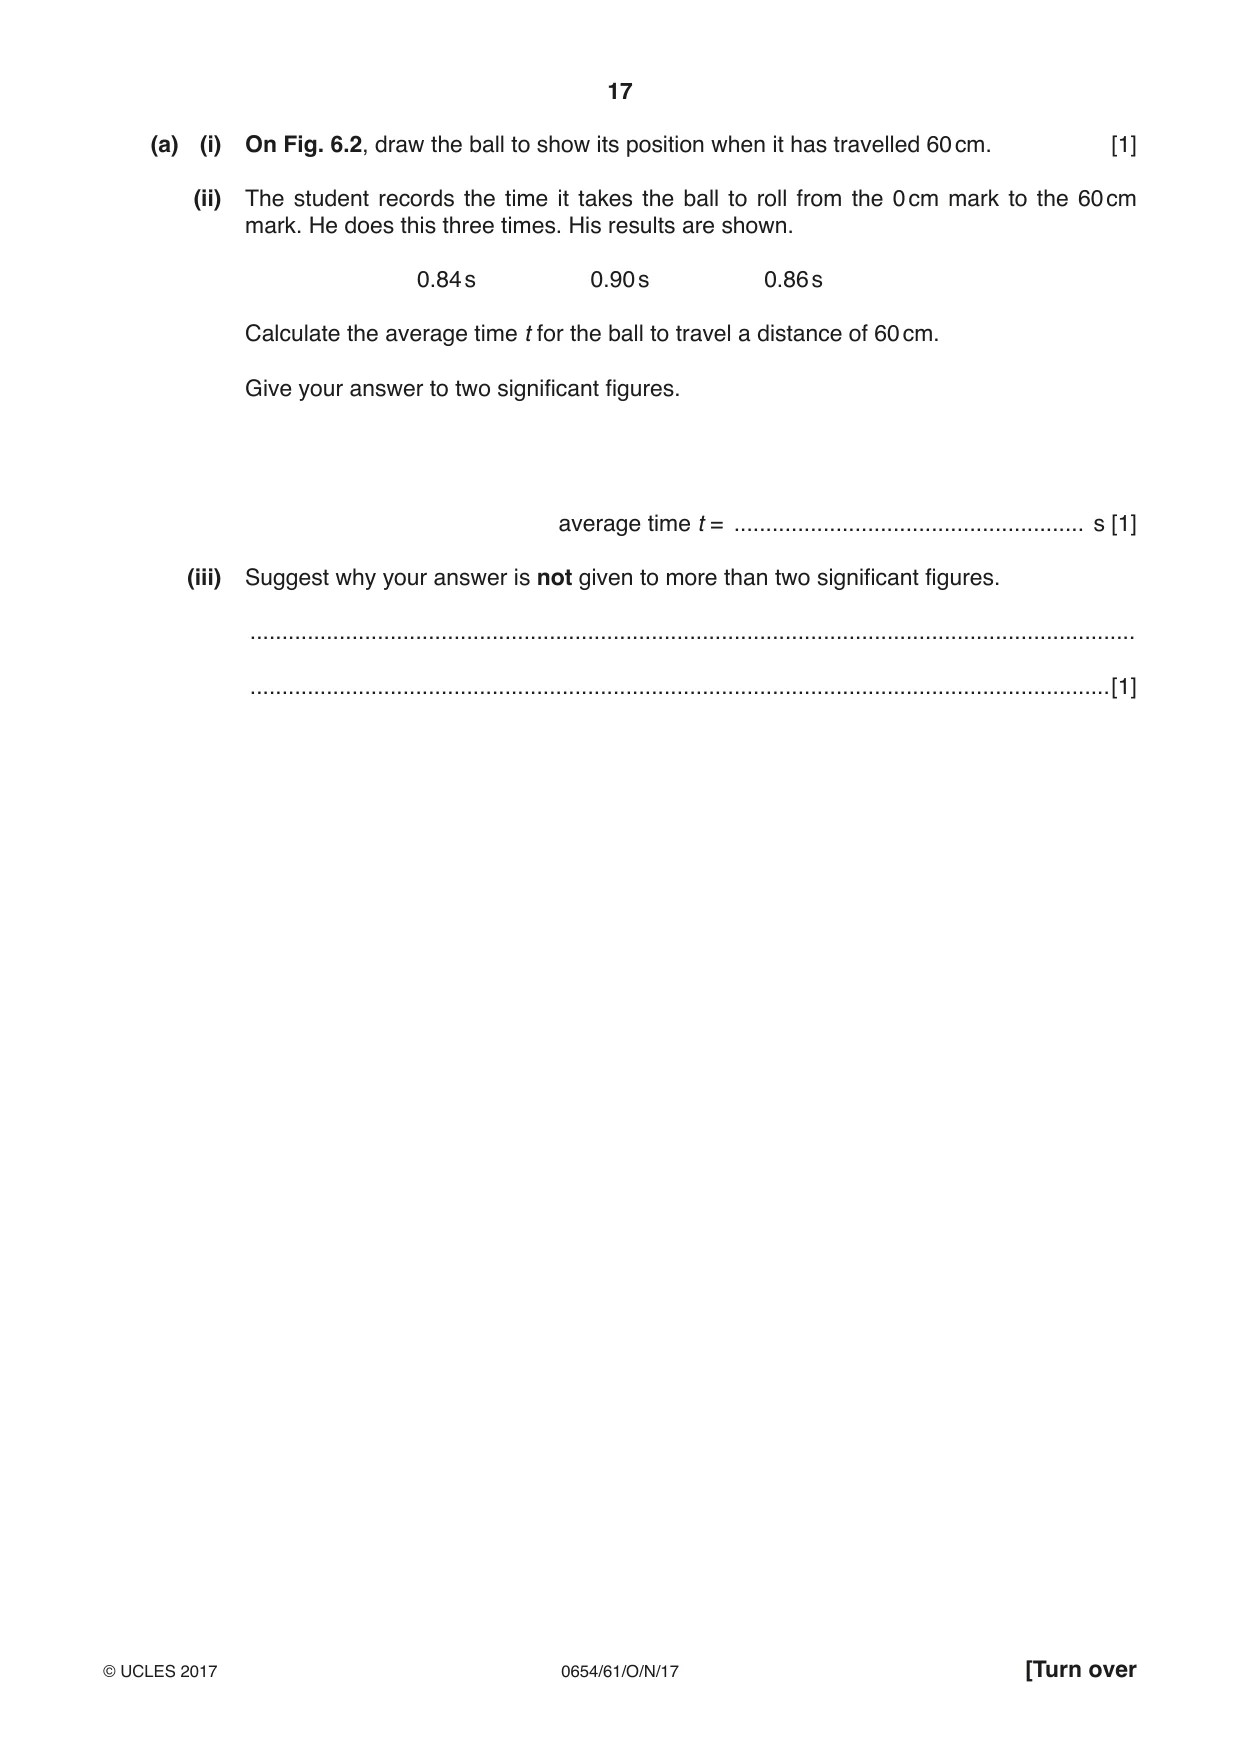
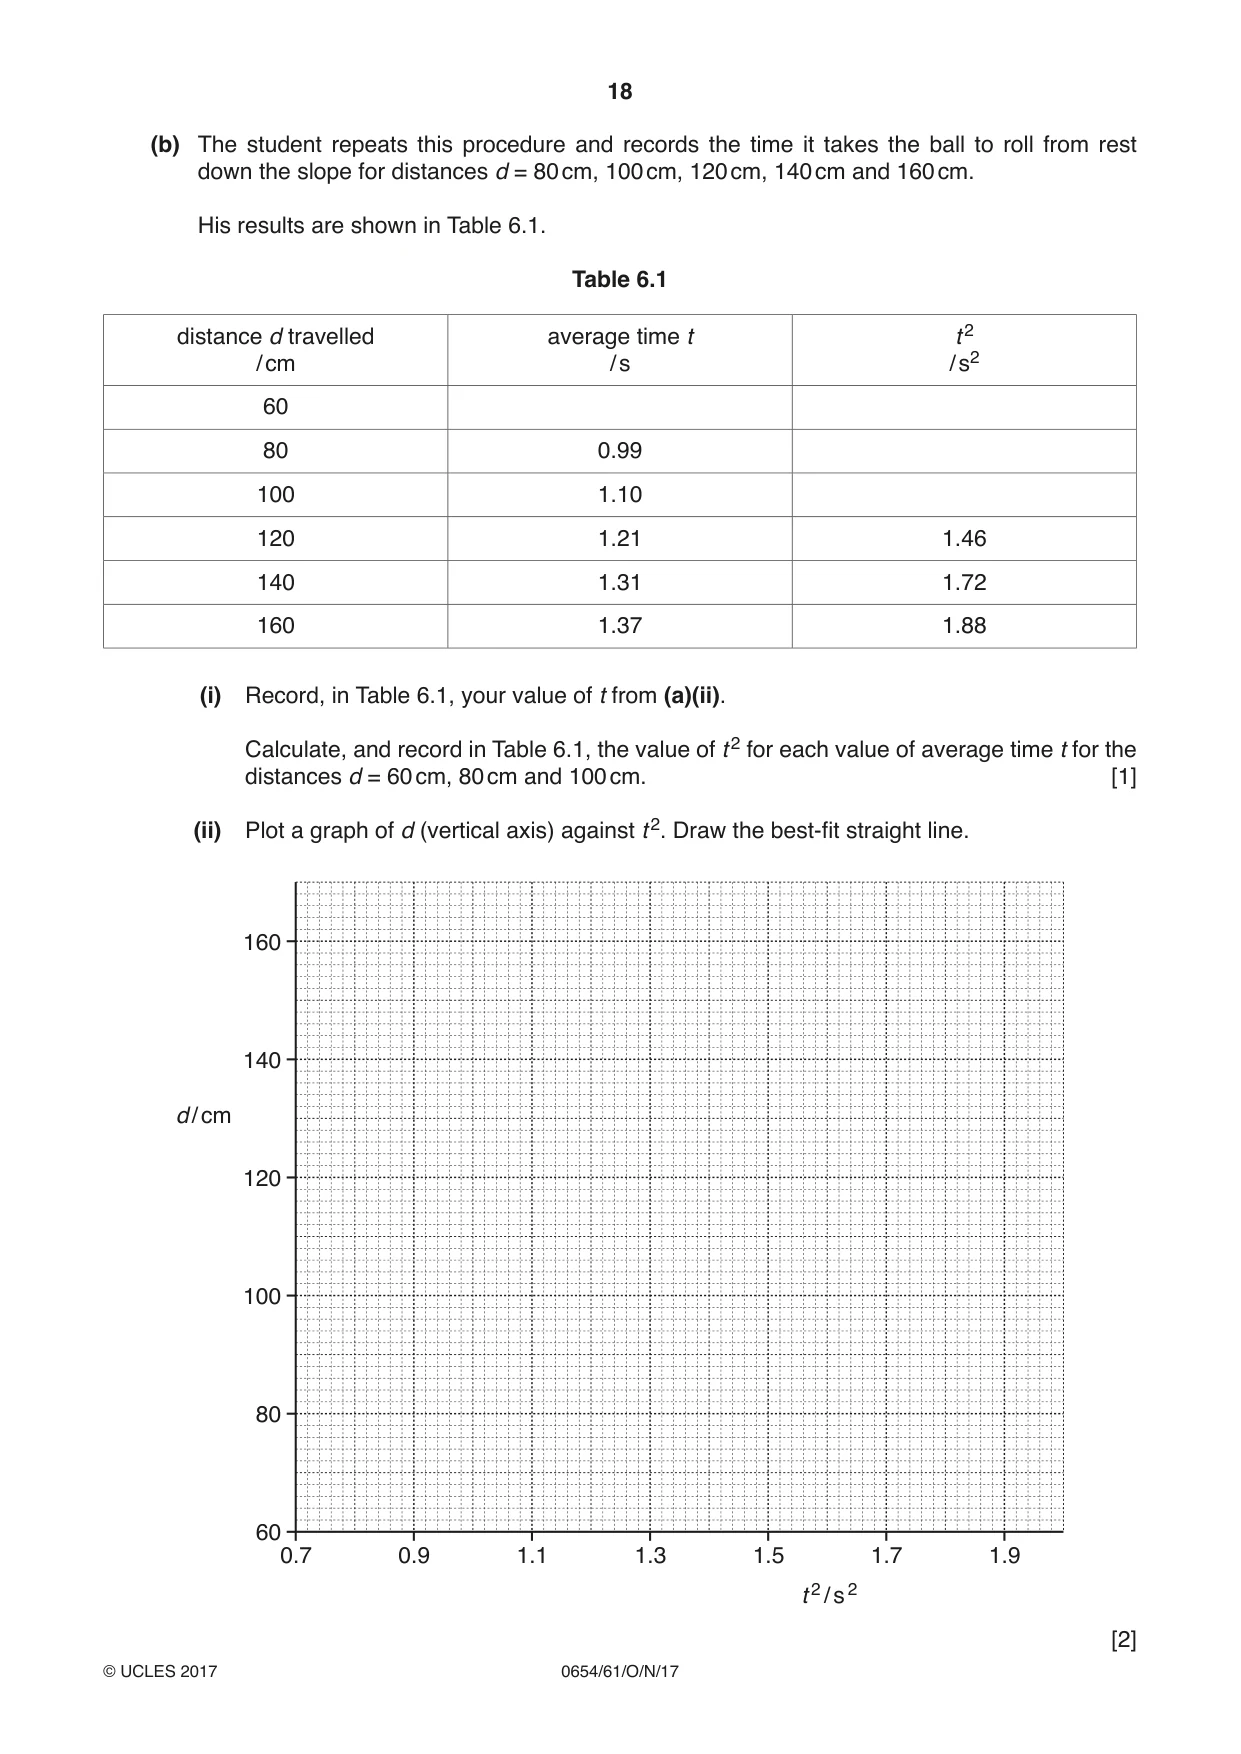
6 A student measures the acceleration g due to gravity by timing a small steel ball rolling down a slope. • He places a 2 m long plank of wood on the bench. • He uses a metre rule and a marker pen to draw horizontal graduations on the plank at 20 cm intervals. • He places a wooden block under one end and adjusts the position of the block until the plank is inclined at an angle of 10° to the horizontal. The experimental set-up is shown in Fig. 6.1. 0 cm 20 40 60 80 100 120 140 160 plank wooden block 10° bench Fig. 6.1 The student uses a stopclock to time the ball rolling down the slope from rest, from the 0 cm mark to the 60 cm mark. Fig. 6.2 shows the ball at rest at the 0 cm mark. ball 0 cm 20 40 60 80 100 120 140 160 10° Fig. 6.2 (a) (i) On Fig. 6.2, draw the ball to show its position when it has travelled 60 cm. [1] (ii) The student records the time it takes the ball to roll from the 0 cm mark to the 60 cm mark. He does this three times. His results are shown. 0.84 s 0.90 s 0.86 s Calculate the average time t for the ball to travel a distance of 60 cm. Give your answer to two significant figures. average time t = ....................................................... s [1] (iii) Suggest why your answer is not given to more than two significant figures. ........................................................................................................................................... .......................................................................................................................................[1] (b) The student repeats this procedure and records the time it takes the ball to roll from rest down the slope for distances d = 80 cm, 100 cm, 120 cm, 140 cm and 160 cm. His results are shown in Table 6.1. Table 6.1 distance d travelled average time t t 2 / cm / s / s2 60 80 0.99 100 1.10 120 1.21 1.46 140 1.31 1.72 160 1.37 1.88 (i) Record, in Table 6.1, your value of t from (a)(ii). Calculate, and record in Table 6.1, the value of t 2 for each value of average time t for the distances d = 60 cm, 80 cm and 100 cm. [1] (ii) Plot a graph of d (vertical axis) against t 2. Draw the best-fit straight line. 160 140 d / cm 120 100 80 60 0.7 0.9 1.1 1.3 1.5 1.7 1.9 t 2 / s 2
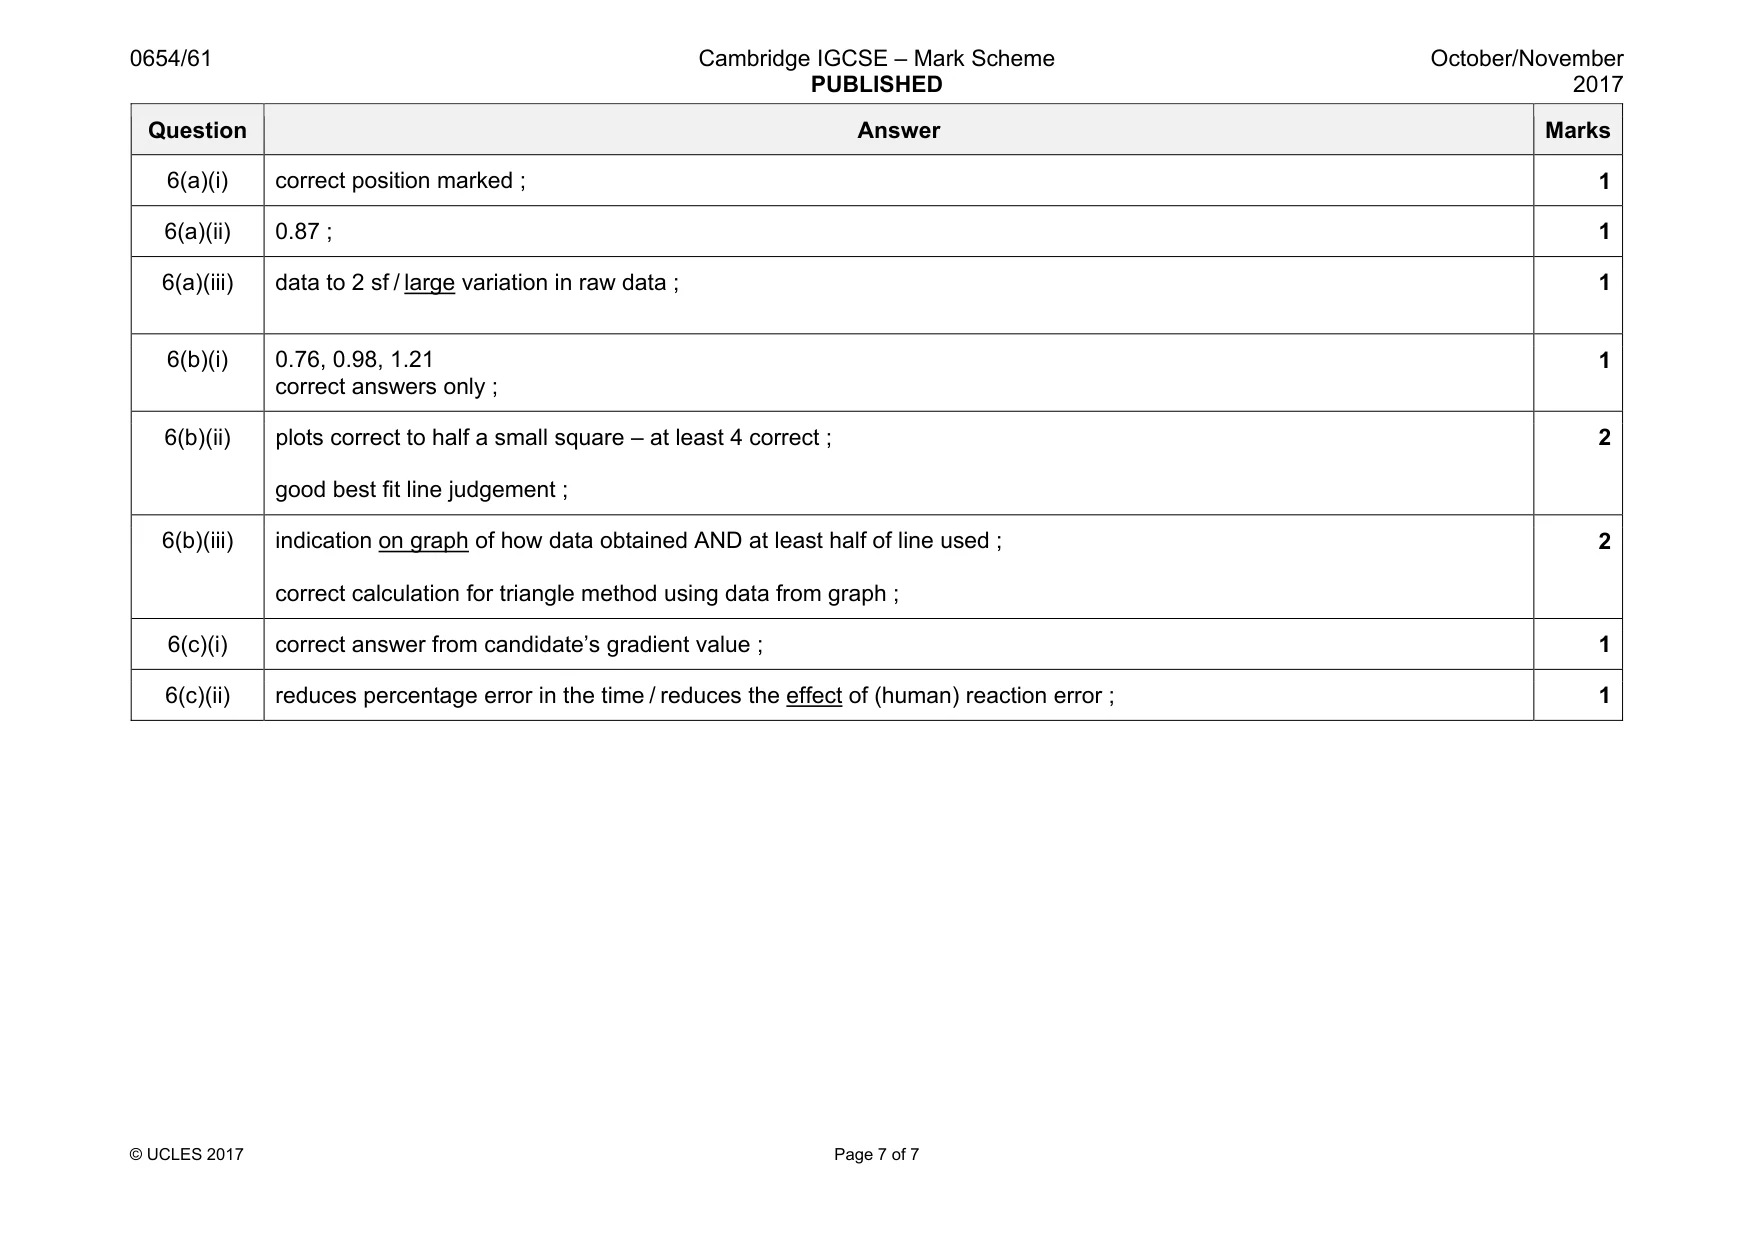
Mark scheme: 6(a)(i) correct position marked ; 1 6(a)(ii) 0.87 ; 1 6(a)(iii) data to 2 sf / large variation in raw data ; 1 6(b)(i) 0.76, 0.98, 1.21 correct answers only ; 1 6(b)(ii) plots correct to half a small square – at least 4 correct ; good best fit line judgement ; 2 6(b)(iii) indication on graph of how data obtained AND at least half of line used ; correct calculation for triangle method using data from graph ; 2 6(c)(i) correct answer from candidate’s gradient value ; 1 6(c)(ii) reduces percentage error in the time / reduces the effect of (human) reaction error ; 1
What was in this paper
The subtopics covered by these 6 questions, and how many questions each got. Open one in a new tab to see every Cambridge question on it.
What you needed in this session
Cambridge’s own grade thresholds for 2017 Oct/Nov, Paper 6 · Variant 1. A higher threshold means an easier paper — the bar moves with how the cohort did.