Cambridge IGCSE Sciences - Co-ordinated (Double) 0654 — 2014 May/June Paper 6 · Variant 2
0654/62/M/J/14 · 60 marks · ≈68 min
The question paper and its mark scheme, free to read here and free to download. This is Cambridge’s own paper, exactly as it was sat.
Question paper20 pages



Mark scheme4 pages
Answers below. Sit the paper first if you are practising.
Paper as text
Question paper, page 1
This document consists of 18 printed pages and 2 blank pages. IB14 06_0654_62/6RP © UCLES 2014 [Turn over *9161477759* Cambridge International Examinations Cambridge International General Certificate of Secondary Education CO-ORDINATED SCIENCES 0654/62 Paper 6 Alternative to Practical May/June 2014 1 hour Candidates answer on the Question paper. No Additional Materials are required. READ THESE INSTRUCTIONS FIRST Write your Centre number, candidate number and name on all the work you hand in. Write in dark blue or black pen. You may use an HB pencil for any diagrams or graphs. Do not use staples, paper clips, glue or correction fluid. DO NOT WRITE IN ANY BARCODES. Answer all questions. Electronic calculators may be used. You may lose marks if you do not show your working or if you do not use appropriate units. At the end of the examination, fasten all your work securely together. The number of marks is given in brackets [ ] at the end of each question or part question.
Question paper, page 2
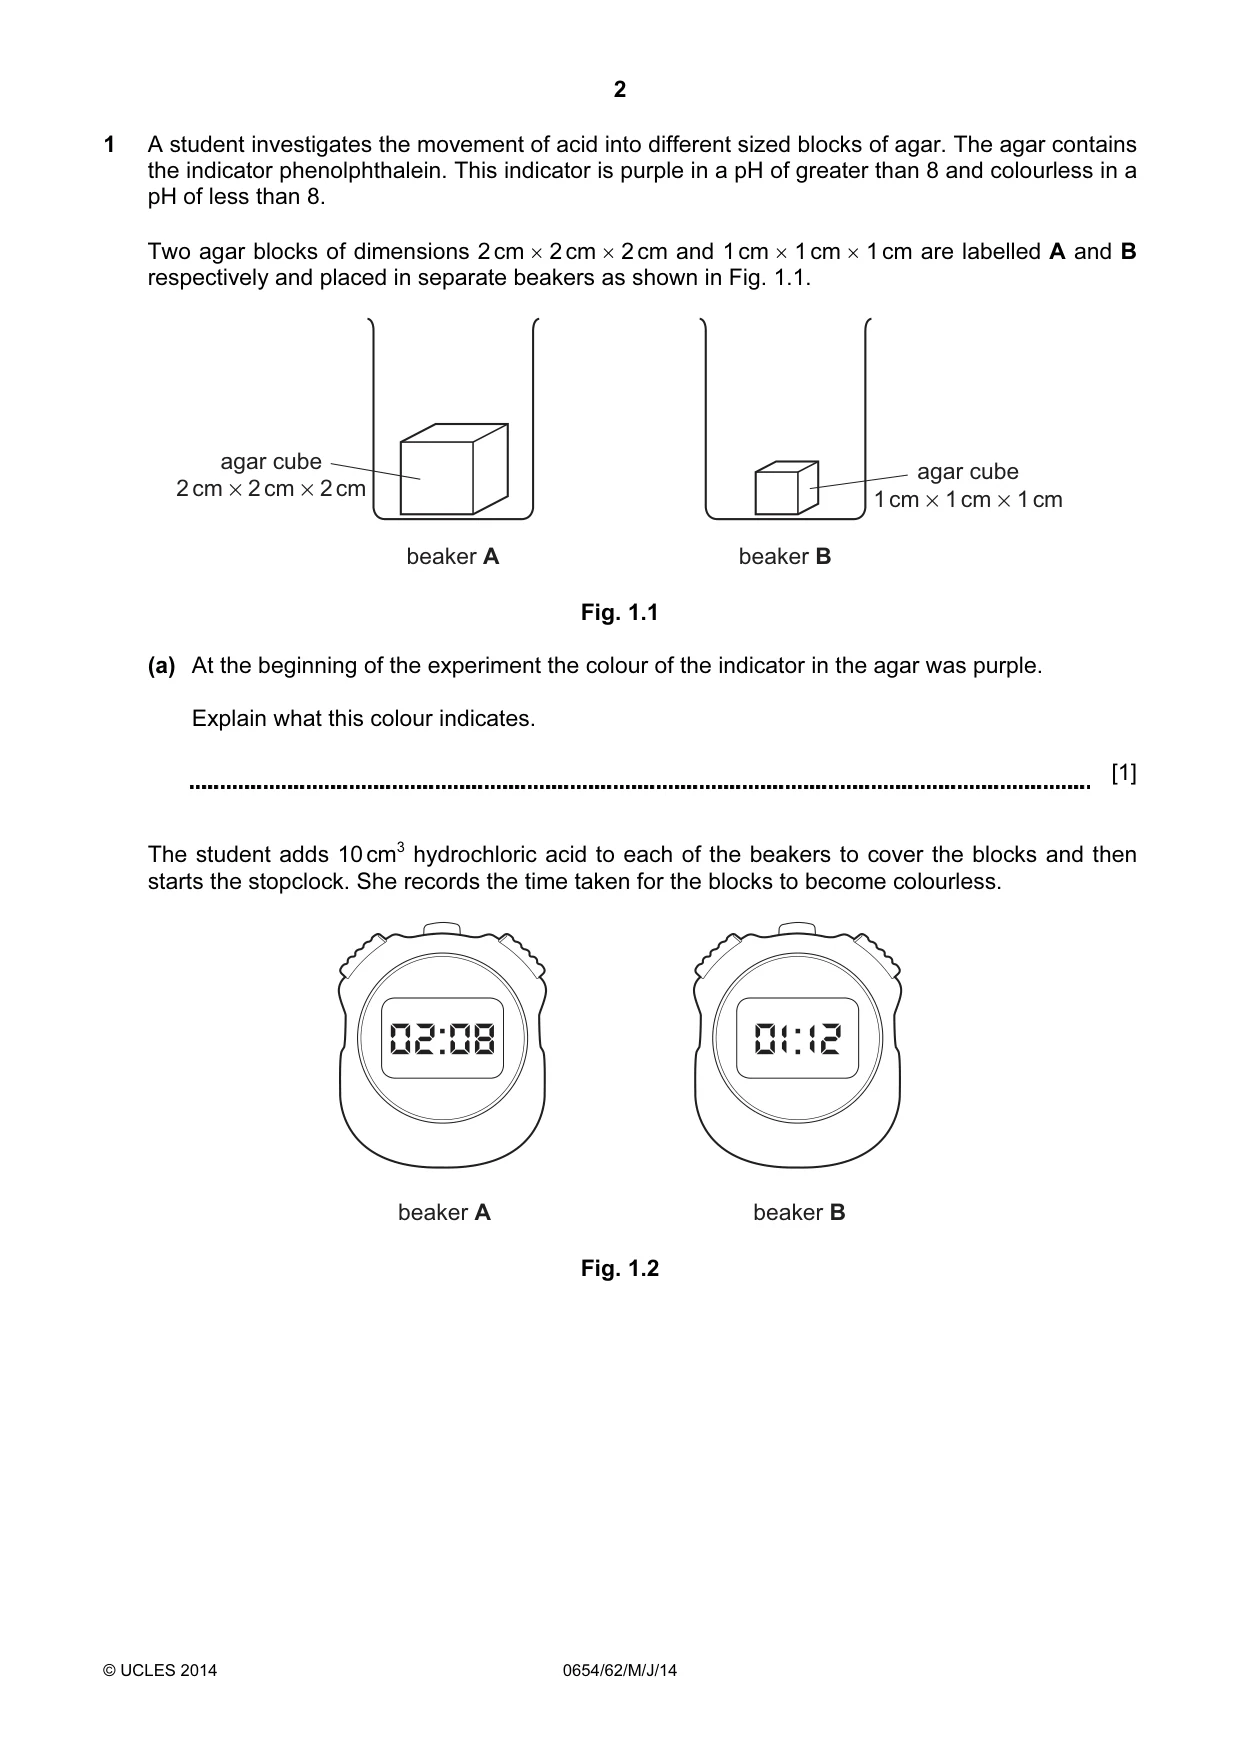
2 © UCLES 2014 0654/62/M/J/14 1 A student investigates the movement of acid into different sized blocks of agar. The agar contains the indicator phenolphthalein. This indicator is purple in a pH of greater than 8 and colourless in a pH of less than 8. Two agar blocks of dimensions 2 cm × 2 cm × 2 cm and 1 cm × 1 cm × 1 cm are labelled A and B respectively and placed in separate beakers as shown in Fig. 1.1. beaker A beaker B agar cube 2 cm × 2 cm × 2 cm agar cube 1 cm × 1 cm × 1 cm Fig. 1.1 (a) At the beginning of the experiment the colour of the indicator in the agar was purple. Explain what this colour indicates. [1] The student adds 10 cm3 hydrochloric acid to each of the beakers to cover the blocks and then starts the stopclock. She records the time taken for the blocks to become colourless. beaker A beaker B Fig. 1.2
Question paper, page 3
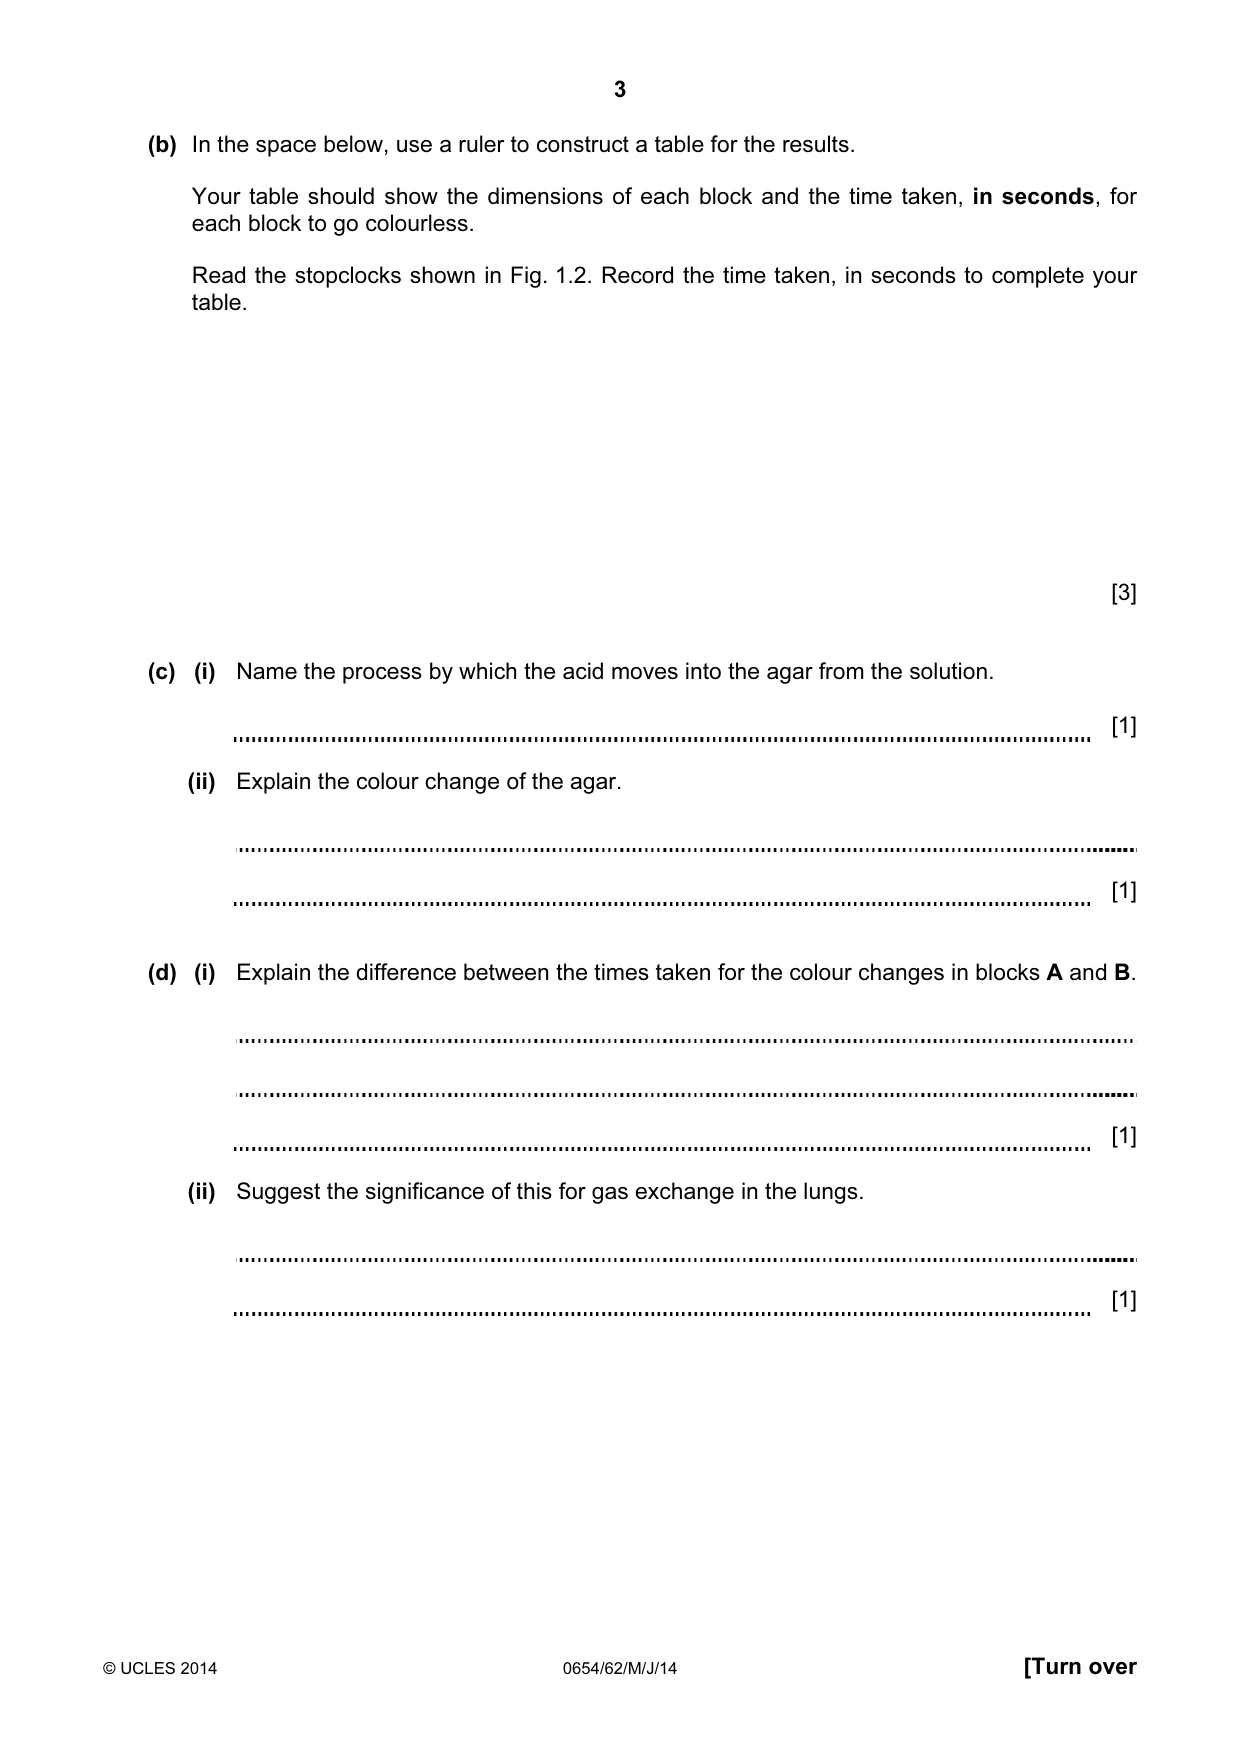
3 © UCLES 2014 0654/62/M/J/14 [Turn over (b) In the space below, use a ruler to construct a table for the results. Your table should show the dimensions of each block and the time taken, in seconds, for each block to go colourless. Read the stopclocks shown in Fig. 1.2. Record the time taken, in seconds to complete your table. [3] (c) (i) Name the process by which the acid moves into the agar from the solution. [1] (ii) Explain the colour change of the agar. [1] (d) (i) Explain the difference between the times taken for the colour changes in blocks A and B. [1] (ii) Suggest the significance of this for gas exchange in the lungs. [1]
Question paper, page 4
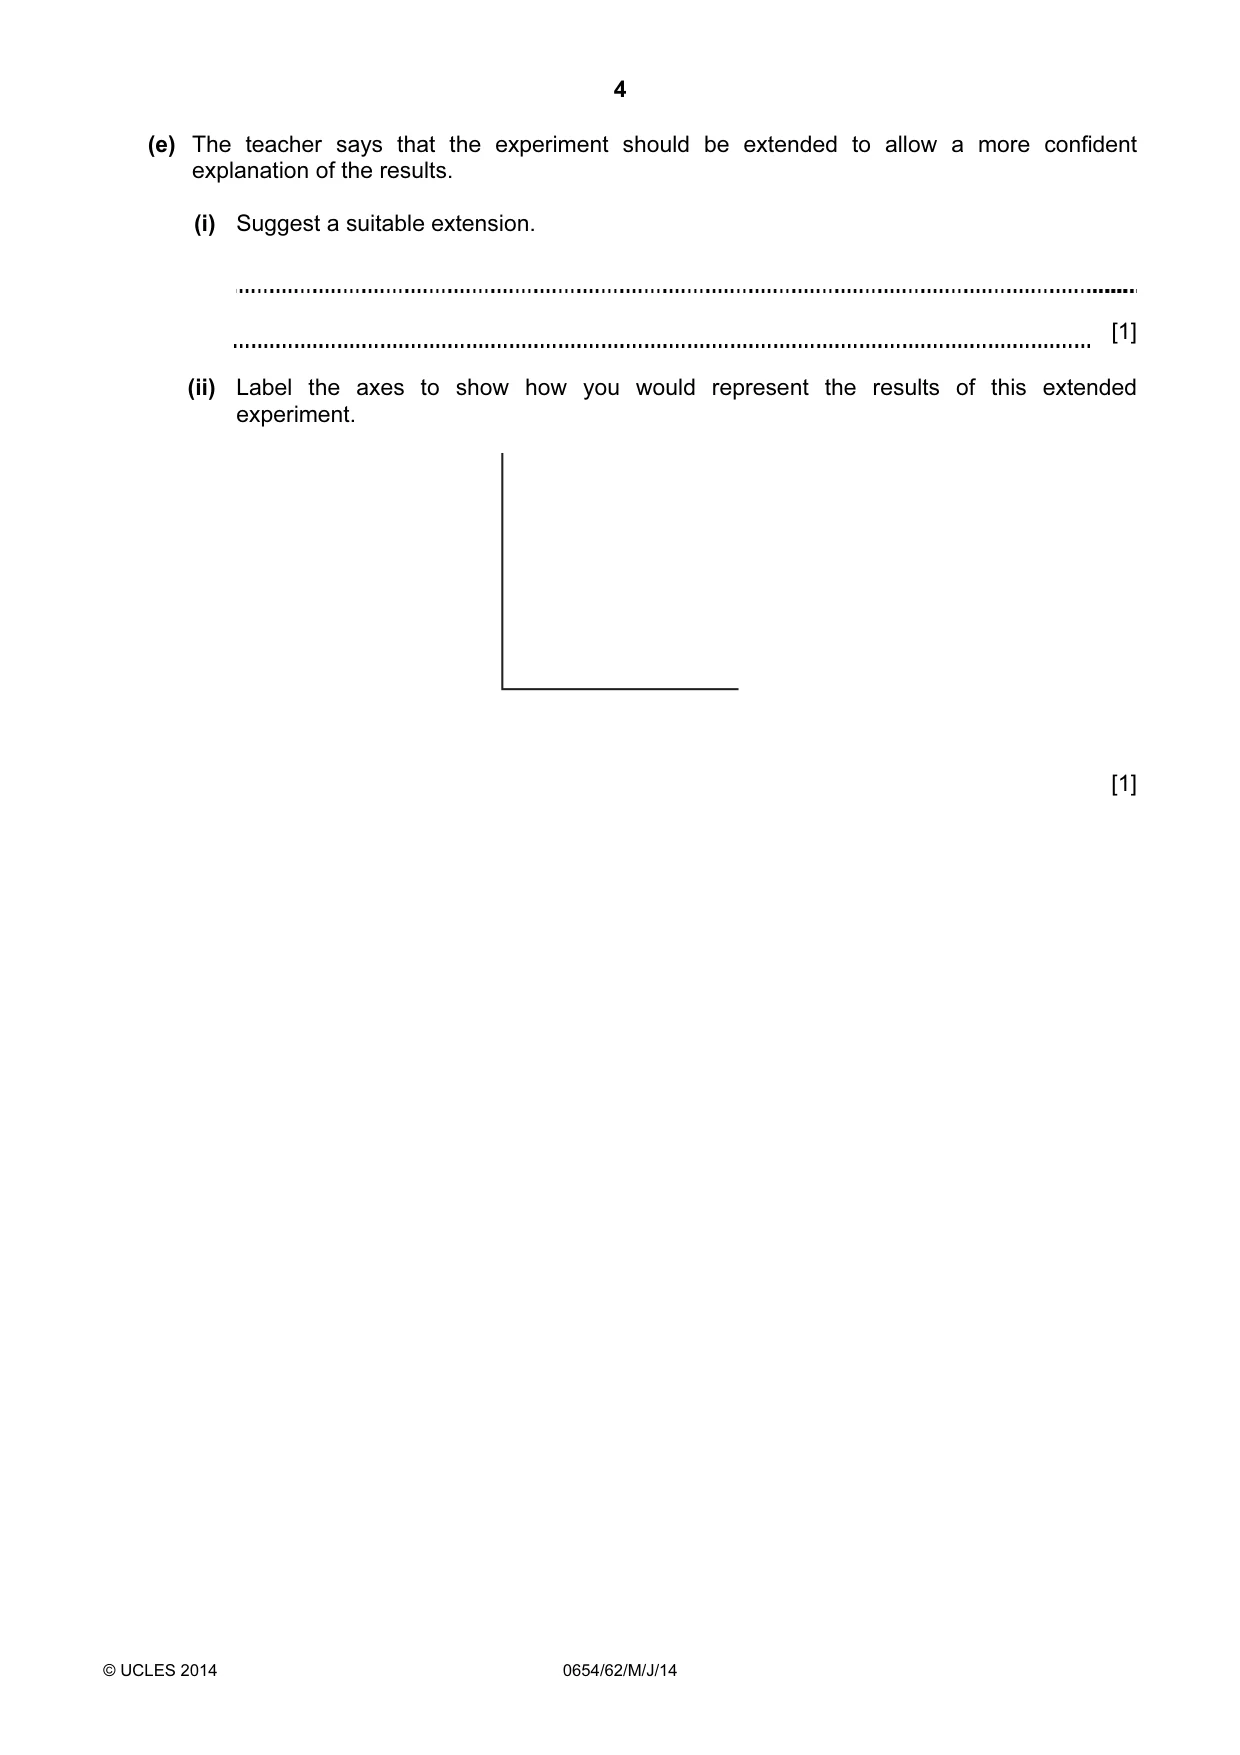
4 © UCLES 2014 0654/62/M/J/14 (e) The teacher says that the experiment should be extended to allow a more confident explanation of the results. (i) Suggest a suitable extension. [1] (ii) Label the axes to show how you would represent the results of this extended experiment. [1]
Question paper, page 5
5 © UCLES 2014 0654/62/M/J/14 [Turn over Please turn over for Question 2.
Question paper, page 6
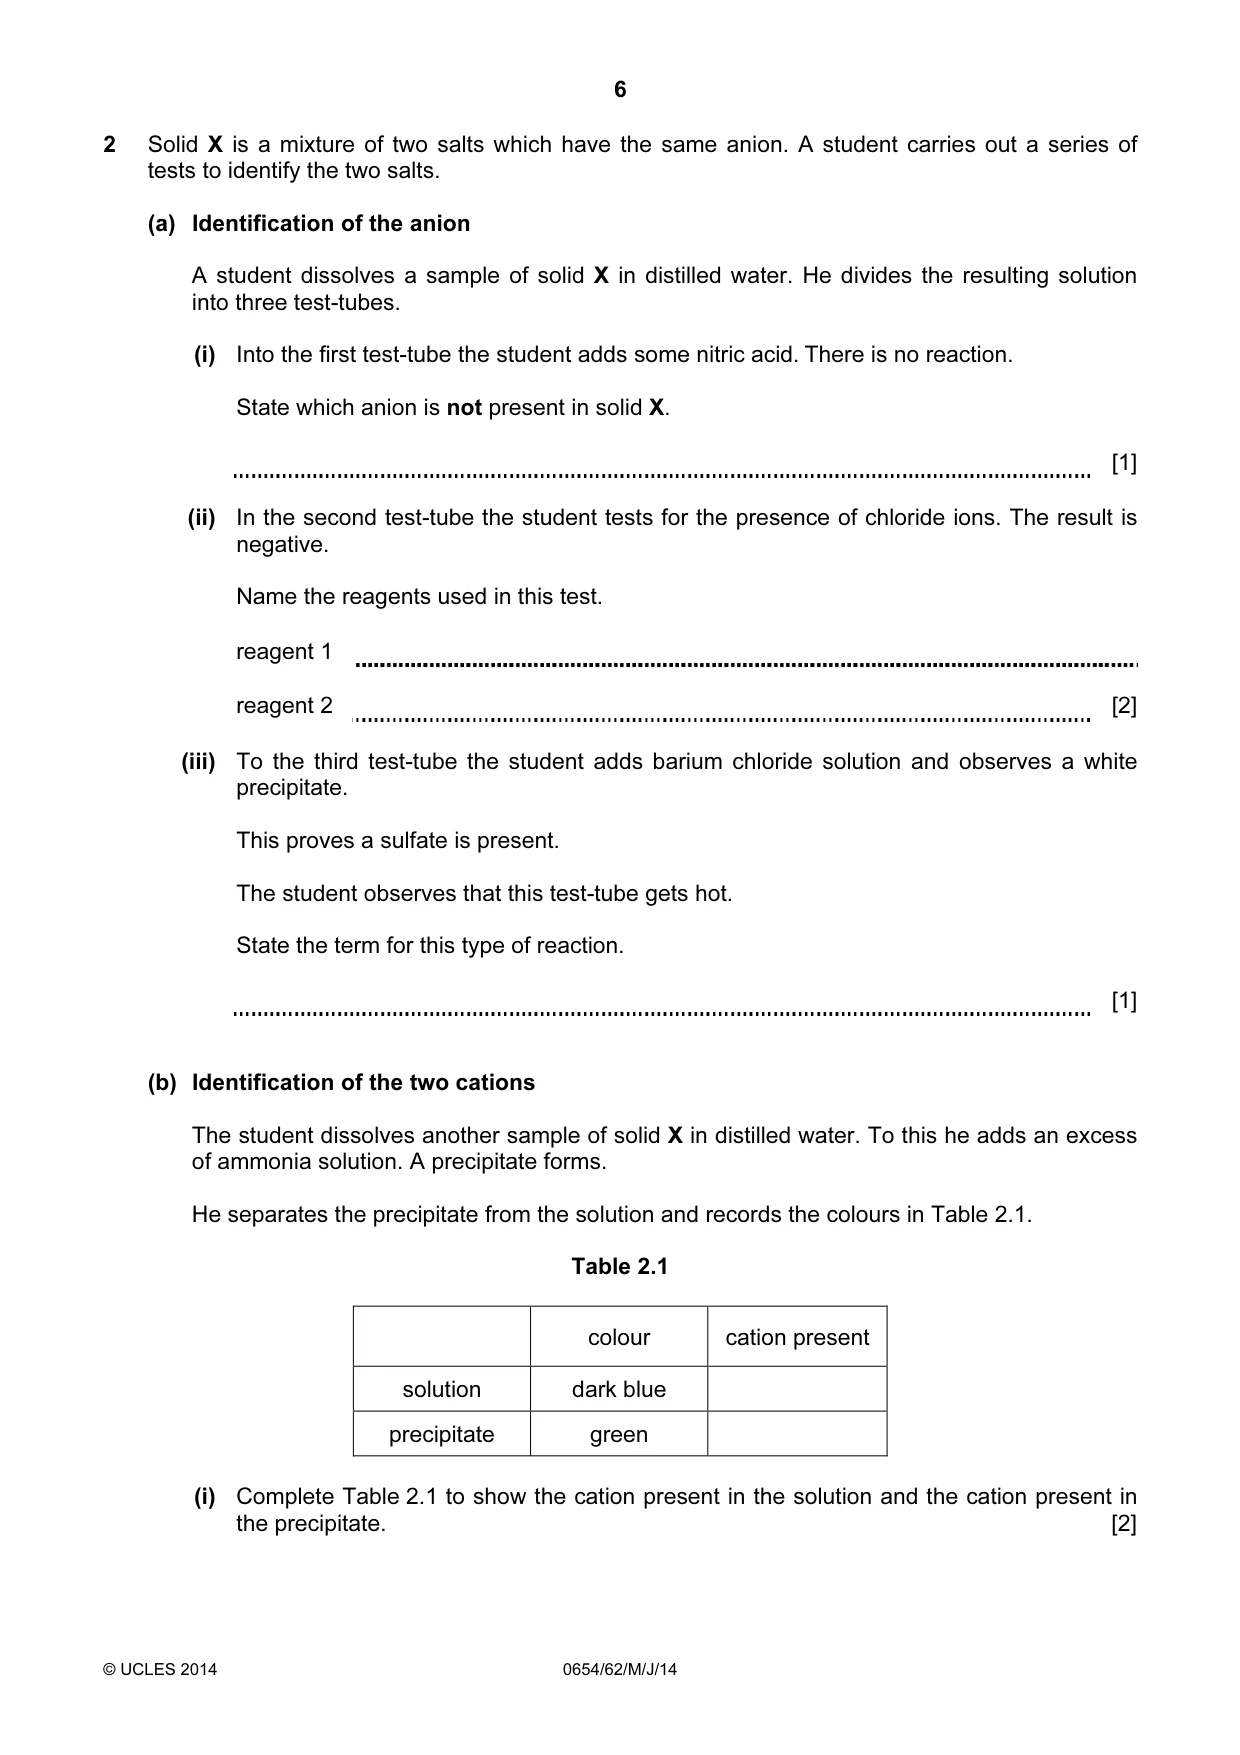
6 © UCLES 2014 0654/62/M/J/14 2 Solid X is a mixture of two salts which have the same anion. A student carries out a series of tests to identify the two salts. (a) Identification of the anion A student dissolves a sample of solid X in distilled water. He divides the resulting solution into three test-tubes. (i) Into the first test-tube the student adds some nitric acid. There is no reaction. State which anion is not present in solid X. [1] (ii) In the second test-tube the student tests for the presence of chloride ions. The result is negative. Name the reagents used in this test. reagent 1 reagent 2 [2] (iii) To the third test-tube the student adds barium chloride solution and observes a white precipitate. This proves a sulfate is present. The student observes that this test-tube gets hot. State the term for this type of reaction. [1] (b) Identification of the two cations The student dissolves another sample of solid X in distilled water. To this he adds an excess of ammonia solution. A precipitate forms. He separates the precipitate from the solution and records the colours in Table 2.1. Table 2.1 colour cation present solution dark blue precipitate green (i) Complete Table 2.1 to show the cation present in the solution and the cation present in the precipitate. [2]
Question paper, page 7
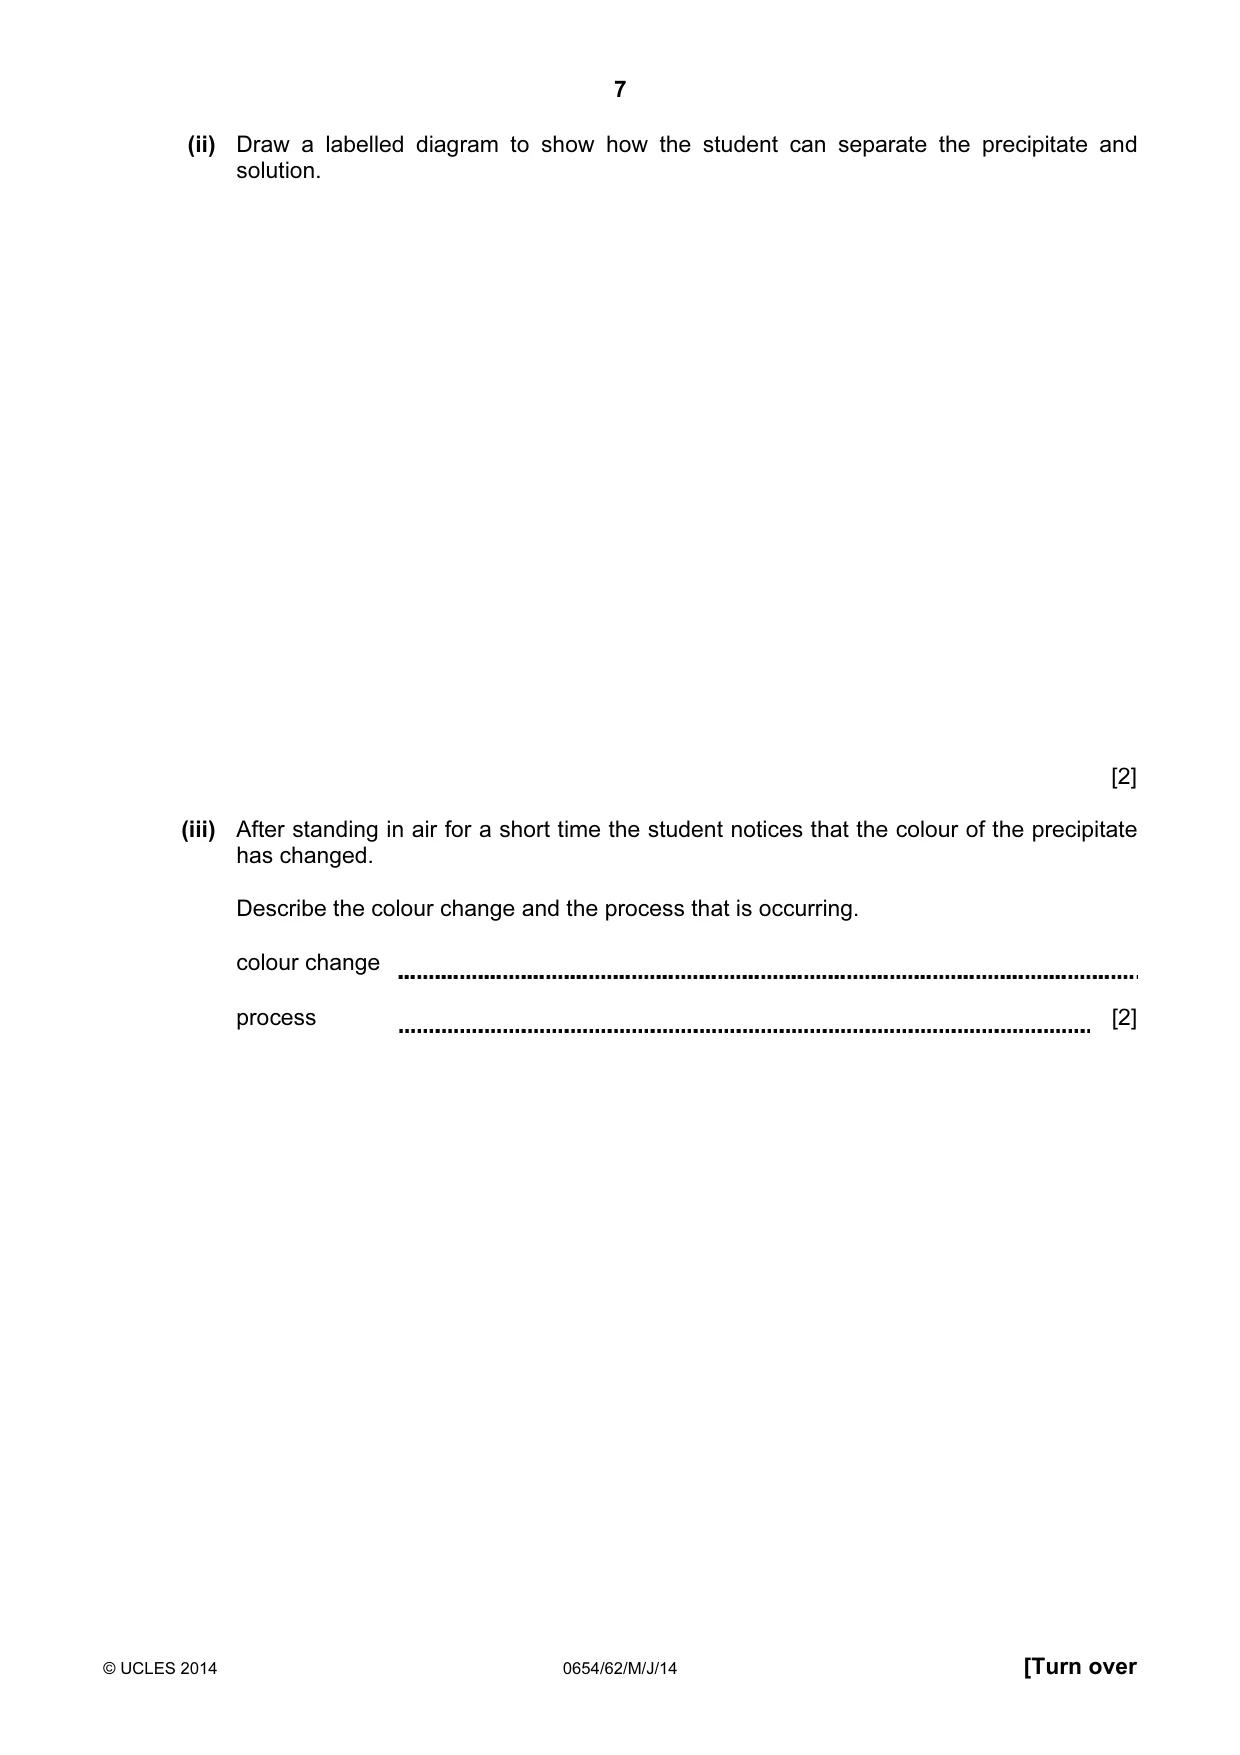
7 © UCLES 2014 0654/62/M/J/14 [Turn over (ii) Draw a labelled diagram to show how the student can separate the precipitate and solution. [2] (iii) After standing in air for a short time the student notices that the colour of the precipitate has changed. Describe the colour change and the process that is occurring. colour change process [2]
Question paper, page 8
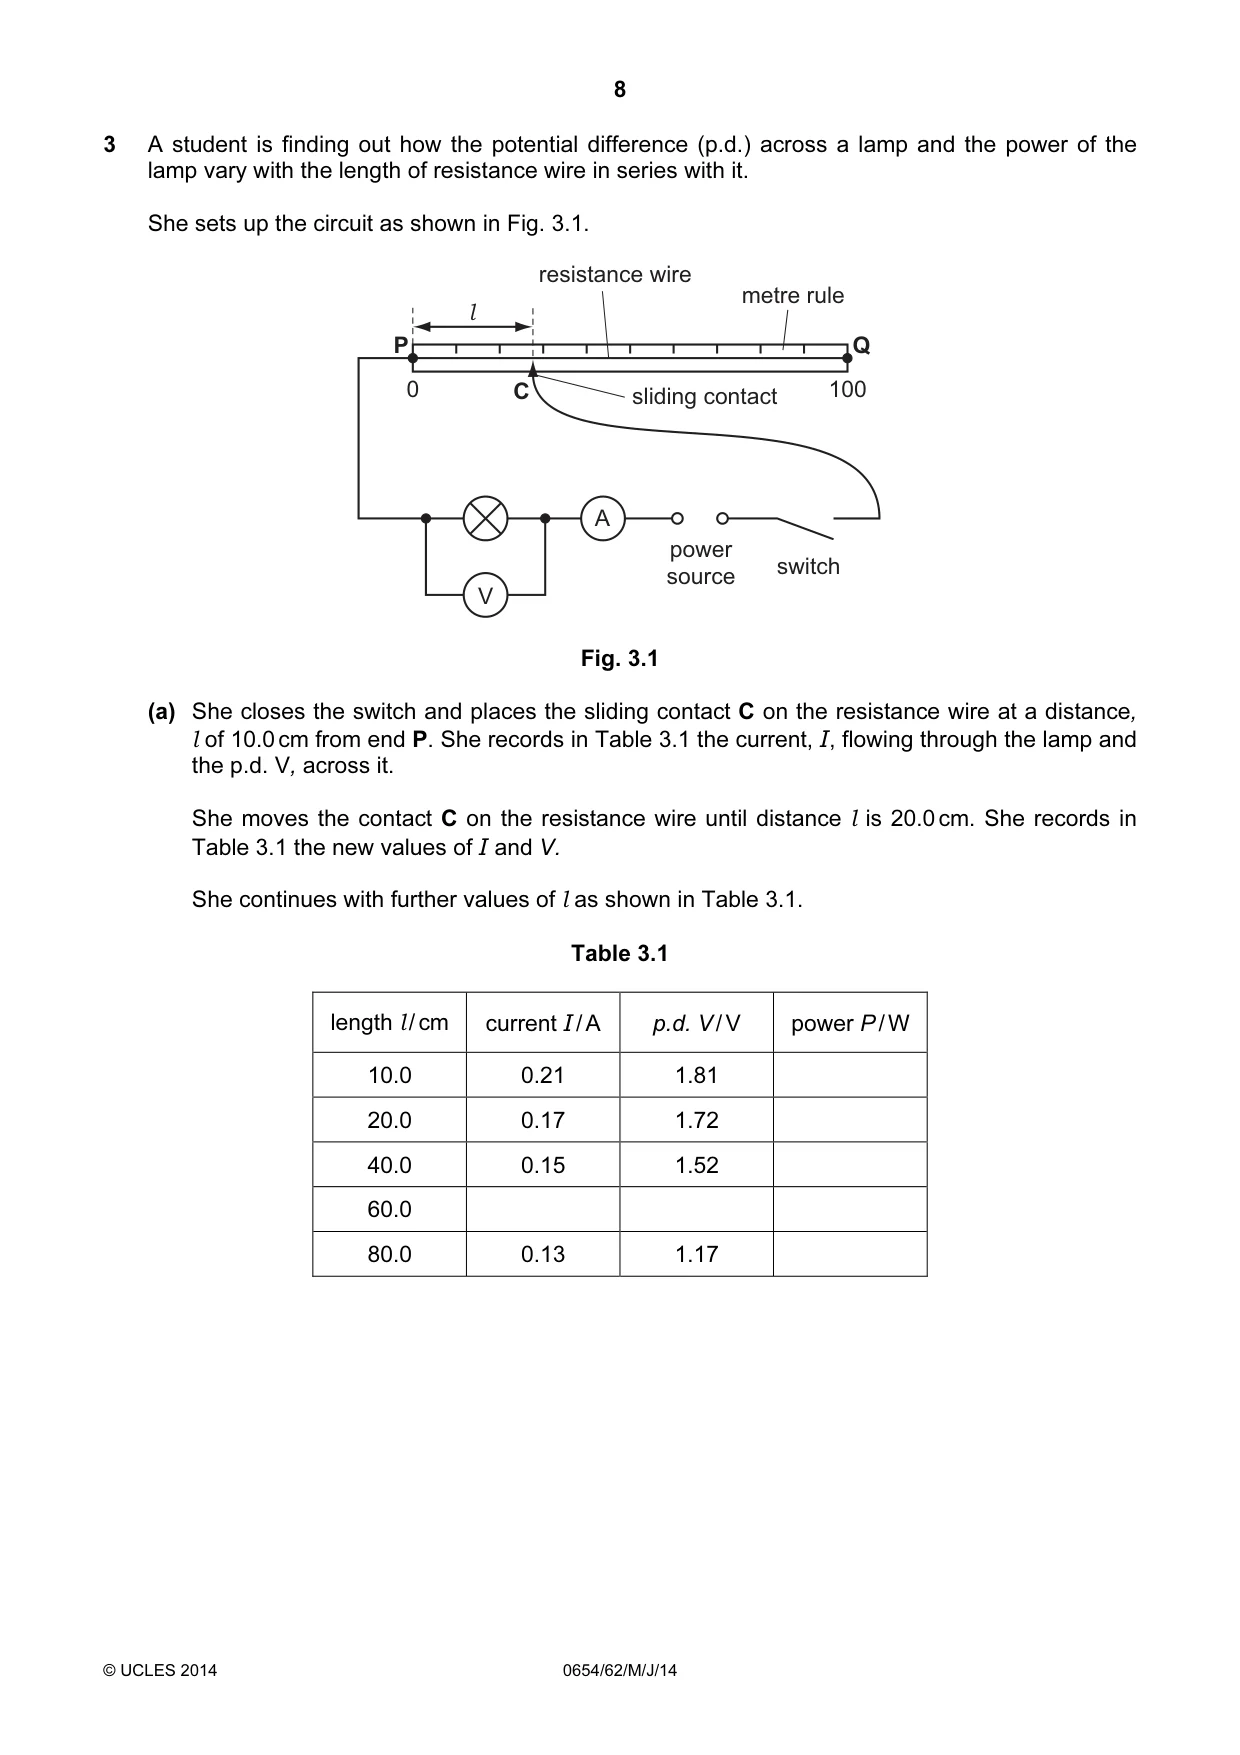
8 © UCLES 2014 0654/62/M/J/14 3 A student is finding out how the potential difference (p.d.) across a lamp and the power of the lamp vary with the length of resistance wire in series with it. She sets up the circuit as shown in Fig. 3.1. V A power source switch 0 100 P Q sliding contact metre rule resistance wire l C Fig. 3.1 (a) She closes the switch and places the sliding contact C on the resistance wire at a distance, l of 10.0 cm from end P. She records in Table 3.1 the current, I, flowing through the lamp and the p.d. V, across it. She moves the contact C on the resistance wire until distance l is 20.0 cm. She records in Table 3.1 the new values of I and V. She continues with further values of l as shown in Table 3.1. Table 3.1 length l / cm current I / A p.d. V / V power P / W 10.0 0.21 1.81 20.0 0.17 1.72 40.0 0.15 1.52 60.0 80.0 0.13 1.17
Question paper, page 9
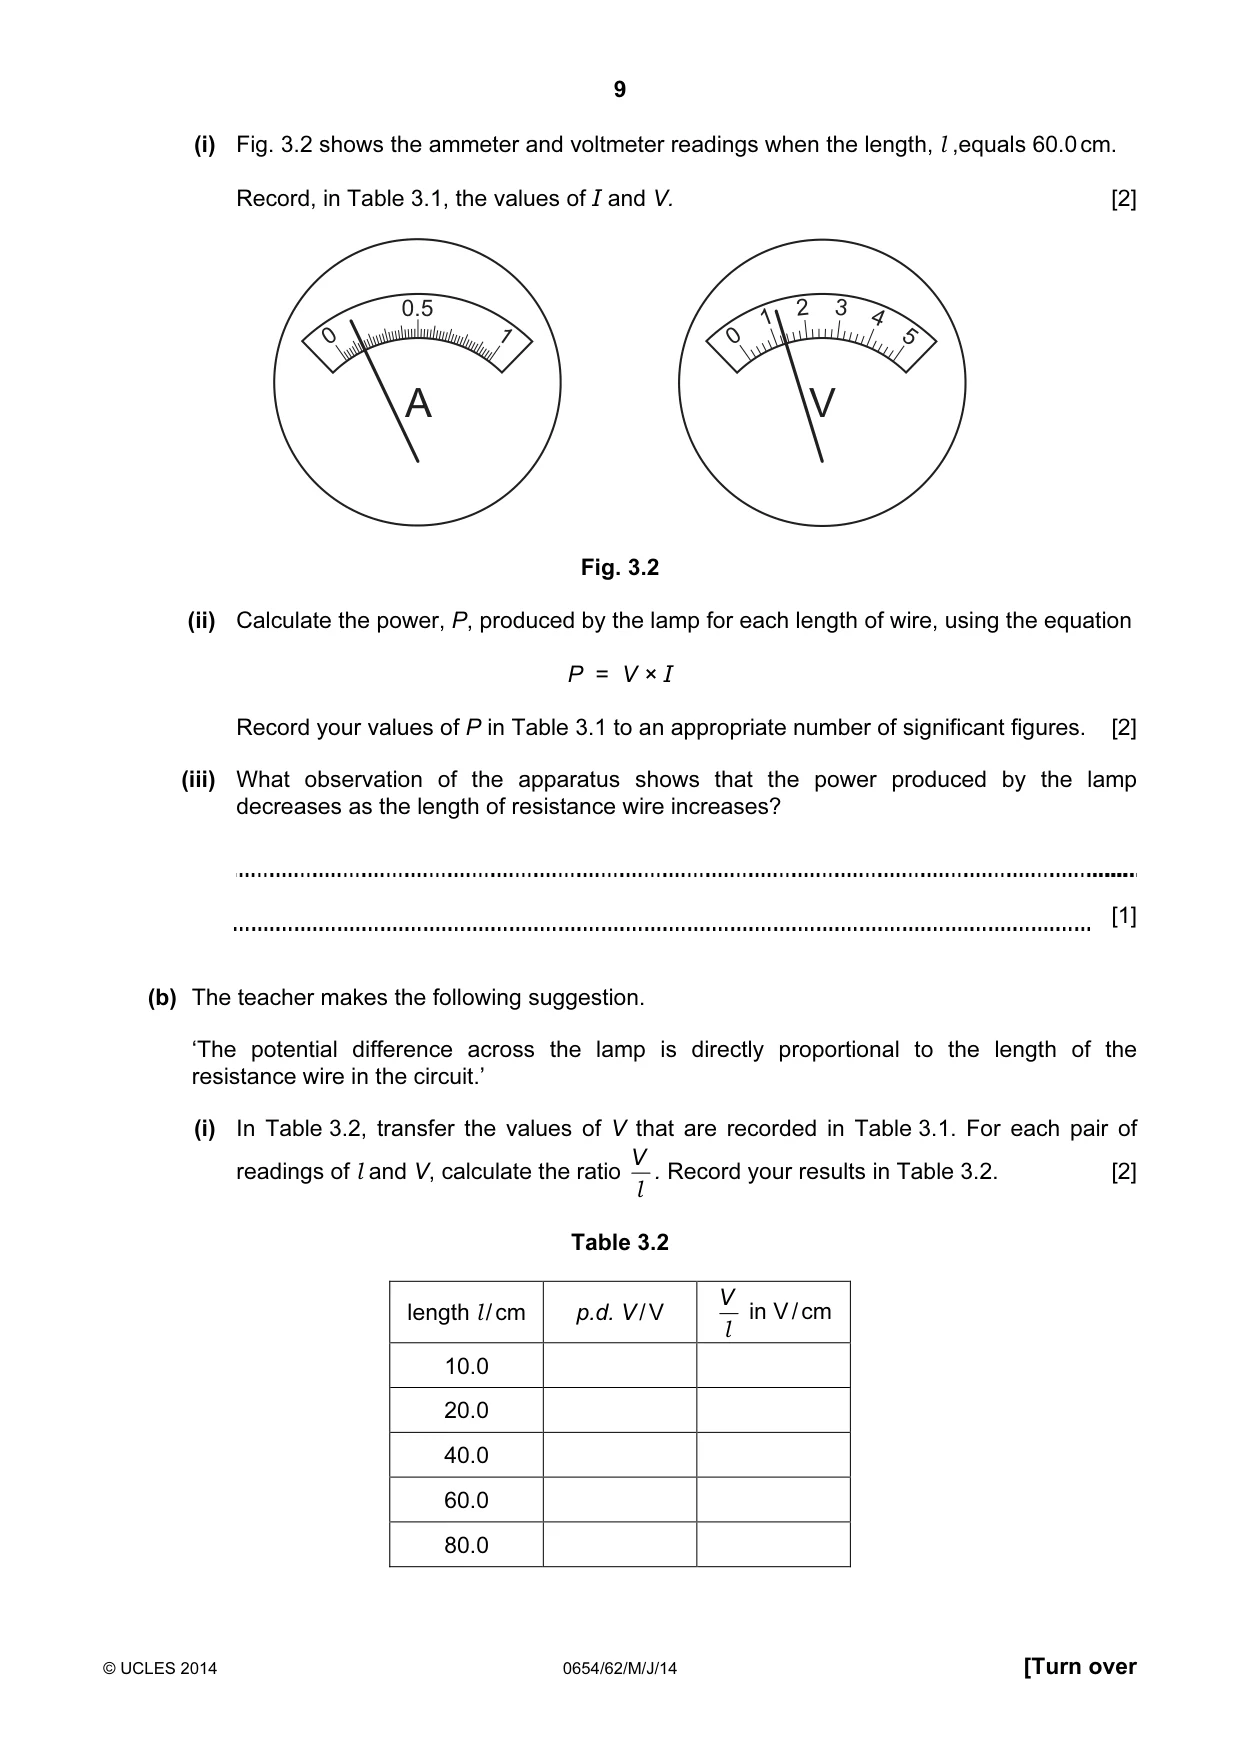
9 © UCLES 2014 0654/62/M/J/14 [Turn over (i) Fig. 3.2 shows the ammeter and voltmeter readings when the length, l ,equals 60.0 cm. Record, in Table 3.1, the values of I and V. [2] A 0.5 1 0 5 0 1 2 3 4 V Fig. 3.2 (ii) Calculate the power, P, produced by the lamp for each length of wire, using the equation P = V × I Record your values of P in Table 3.1 to an appropriate number of significant figures. [2] (iii) What observation of the apparatus shows that the power produced by the lamp decreases as the length of resistance wire increases? [1] (b) The teacher makes the following suggestion. ‘The potential difference across the lamp is directly proportional to the length of the resistance wire in the circuit.’ (i) In Table 3.2, transfer the values of V that are recorded in Table 3.1. For each pair of readings of l and V, calculate the ratio l V . Record your results in Table 3.2. [2] Table 3.2 length l / cm p.d. V / V l V in V / cm 10.0 20.0 40.0 60.0 80.0
Question paper, page 10
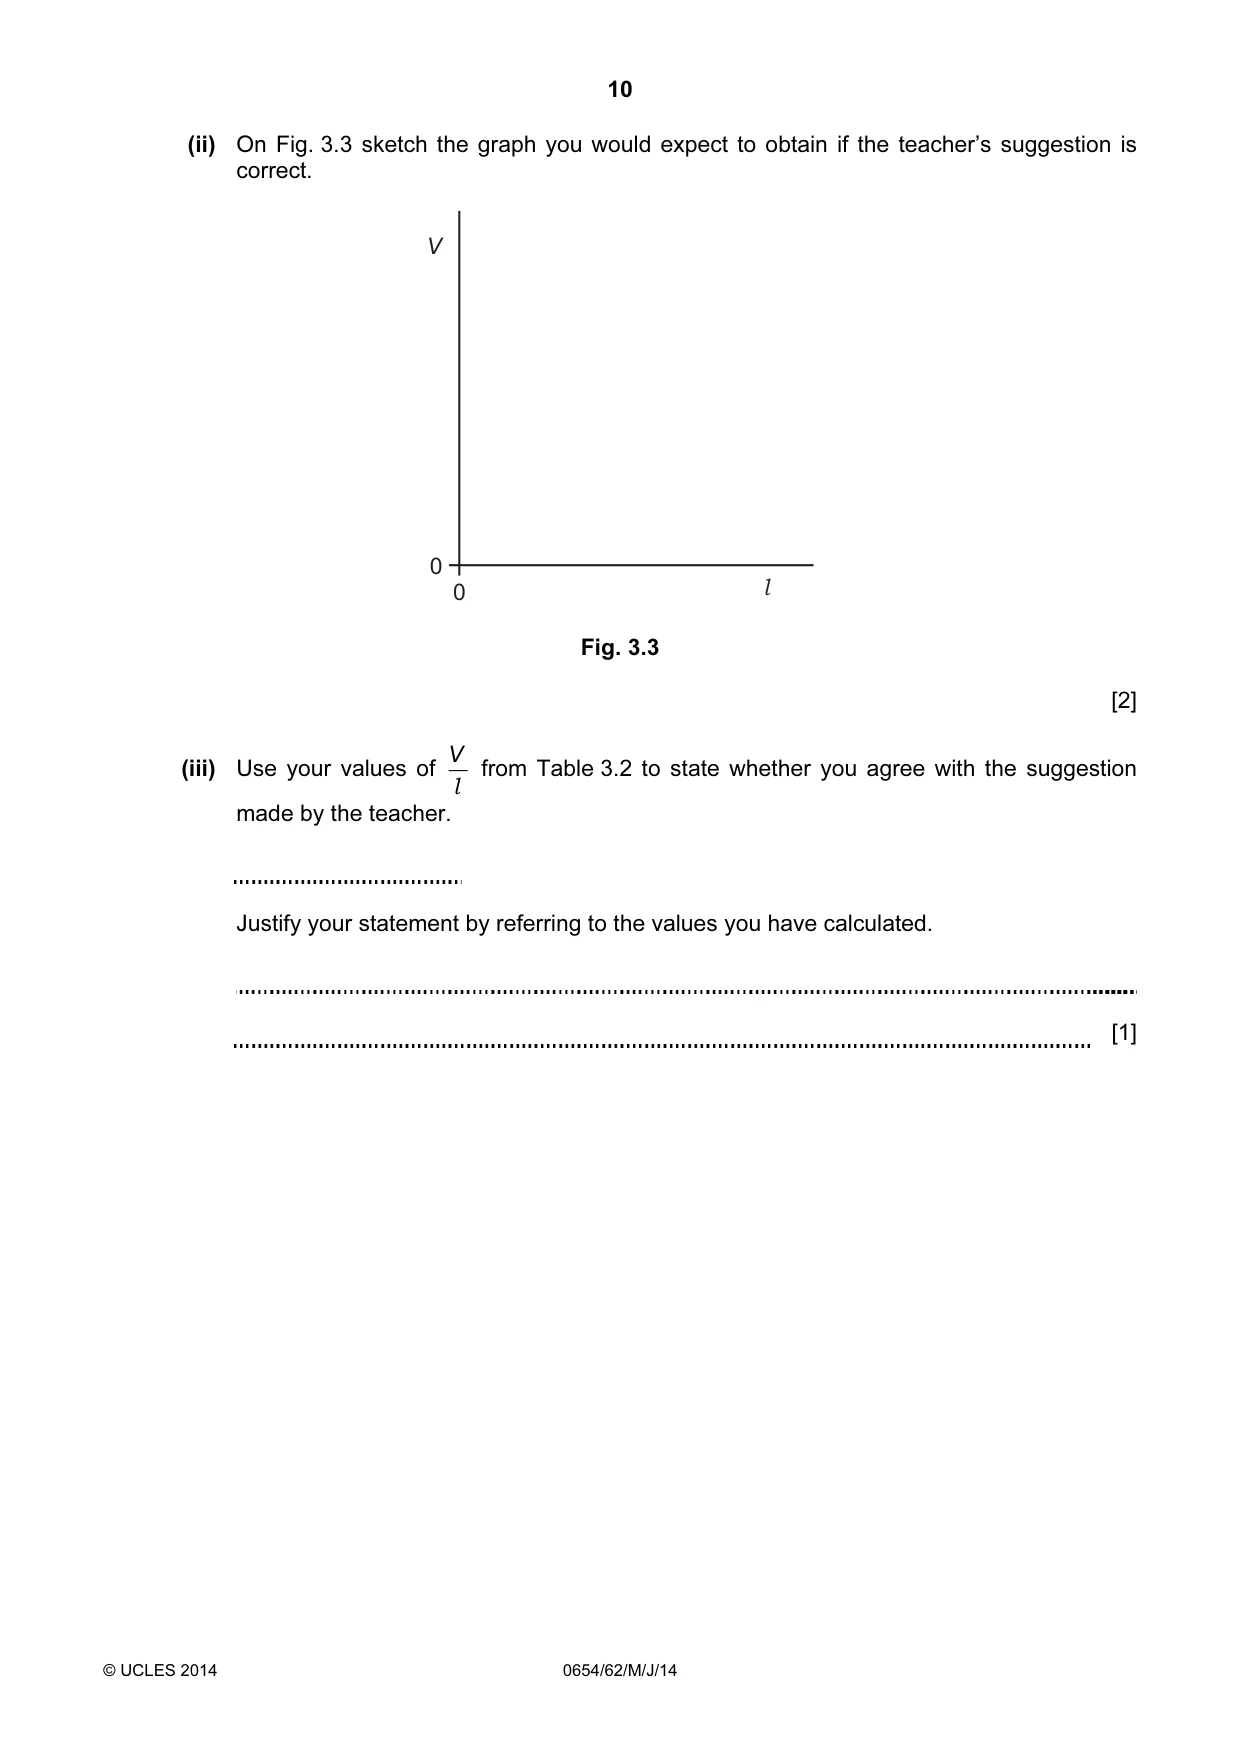
10 © UCLES 2014 0654/62/M/J/14 (ii) On Fig. 3.3 sketch the graph you would expect to obtain if the teacher’s suggestion is correct. 0 0 V l Fig. 3.3 [2] (iii) Use your values of l V from Table 3.2 to state whether you agree with the suggestion made by the teacher. Justify your statement by referring to the values you have calculated. [1]
Question paper, page 11
11 © UCLES 2014 0654/62/M/J/14 [Turn over Please turn over for Question 4.
Question paper, page 12
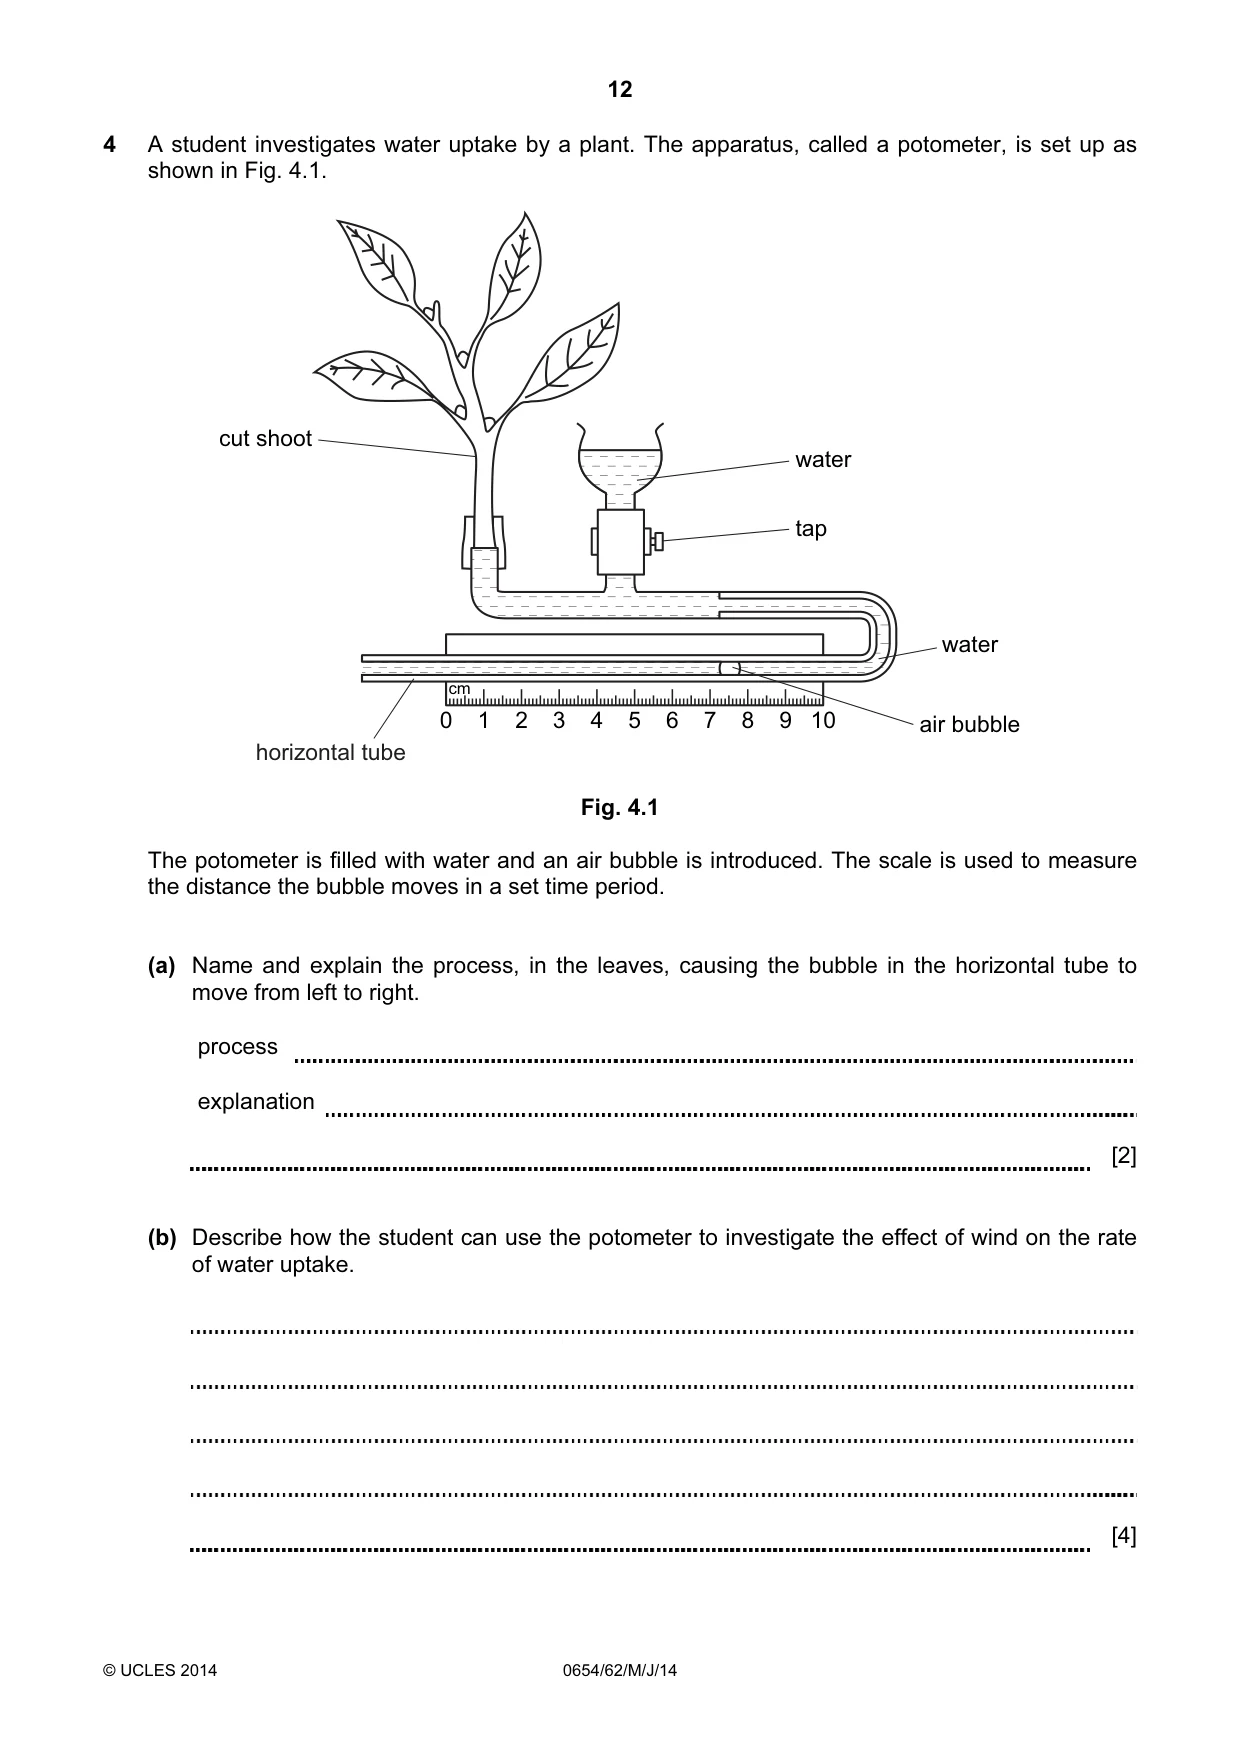
12 © UCLES 2014 0654/62/M/J/14 4 A student investigates water uptake by a plant. The apparatus, called a potometer, is set up as shown in Fig. 4.1. 0 2 4 6 8 10 1 3 5 7 9 water air bubble water tap cut shoot cm horizontal tube Fig. 4.1 The potometer is filled with water and an air bubble is introduced. The scale is used to measure the distance the bubble moves in a set time period. (a) Name and explain the process, in the leaves, causing the bubble in the horizontal tube to move from left to right. process explanation [2] (b) Describe how the student can use the potometer to investigate the effect of wind on the rate of water uptake. [4]
Question paper, page 13
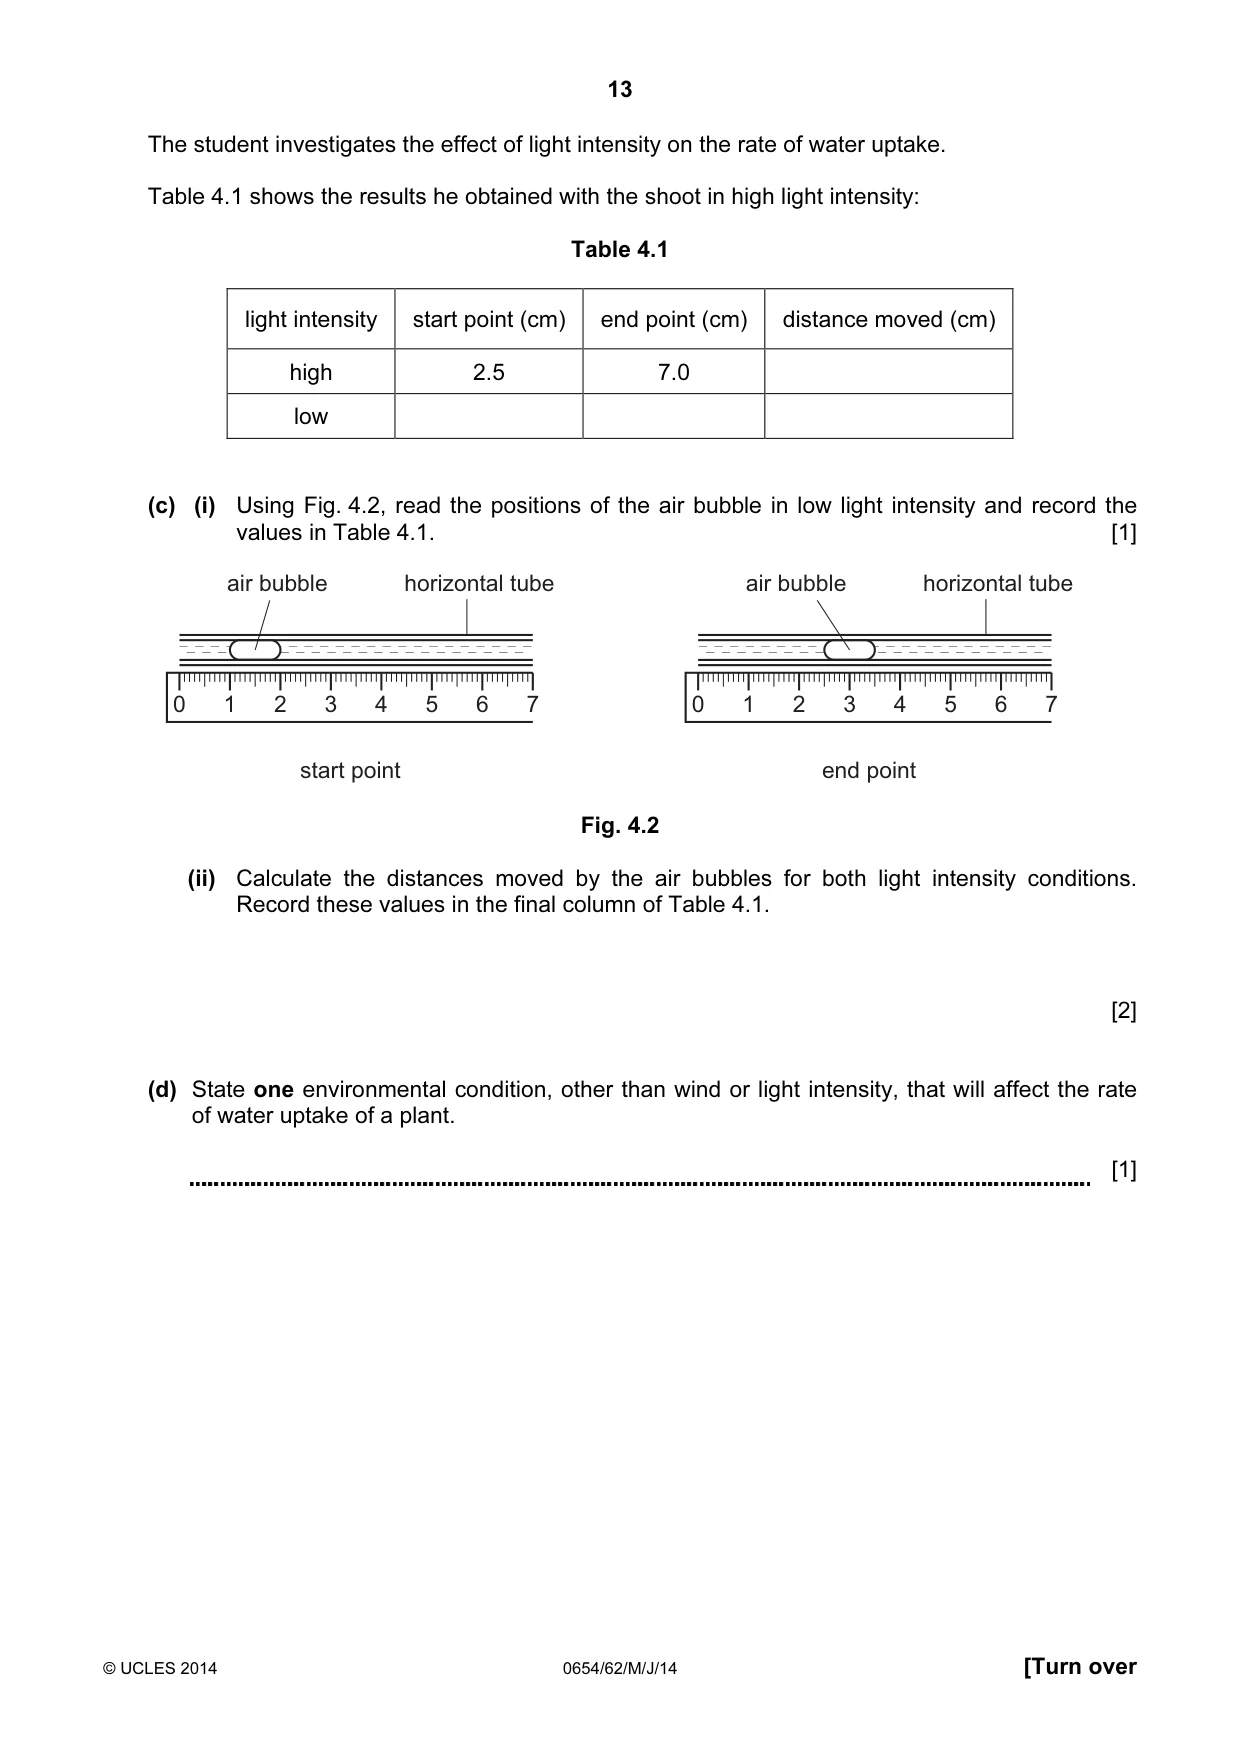
13 © UCLES 2014 0654/62/M/J/14 [Turn over The student investigates the effect of light intensity on the rate of water uptake. Table 4.1 shows the results he obtained with the shoot in high light intensity: Table 4.1 light intensity start point (cm) end point (cm) distance moved (cm) high 2.5 7.0 low (c) (i) Using Fig. 4.2, read the positions of the air bubble in low light intensity and record the values in Table 4.1. [1] 0 1 2 3 4 5 6 7 air bubble horizontal tube start point 0 1 2 3 4 5 6 7 air bubble horizontal tube end point Fig. 4.2 (ii) Calculate the distances moved by the air bubbles for both light intensity conditions. Record these values in the final column of Table 4.1. [2] (d) State one environmental condition, other than wind or light intensity, that will affect the rate of water uptake of a plant. [1]
Question paper, page 14
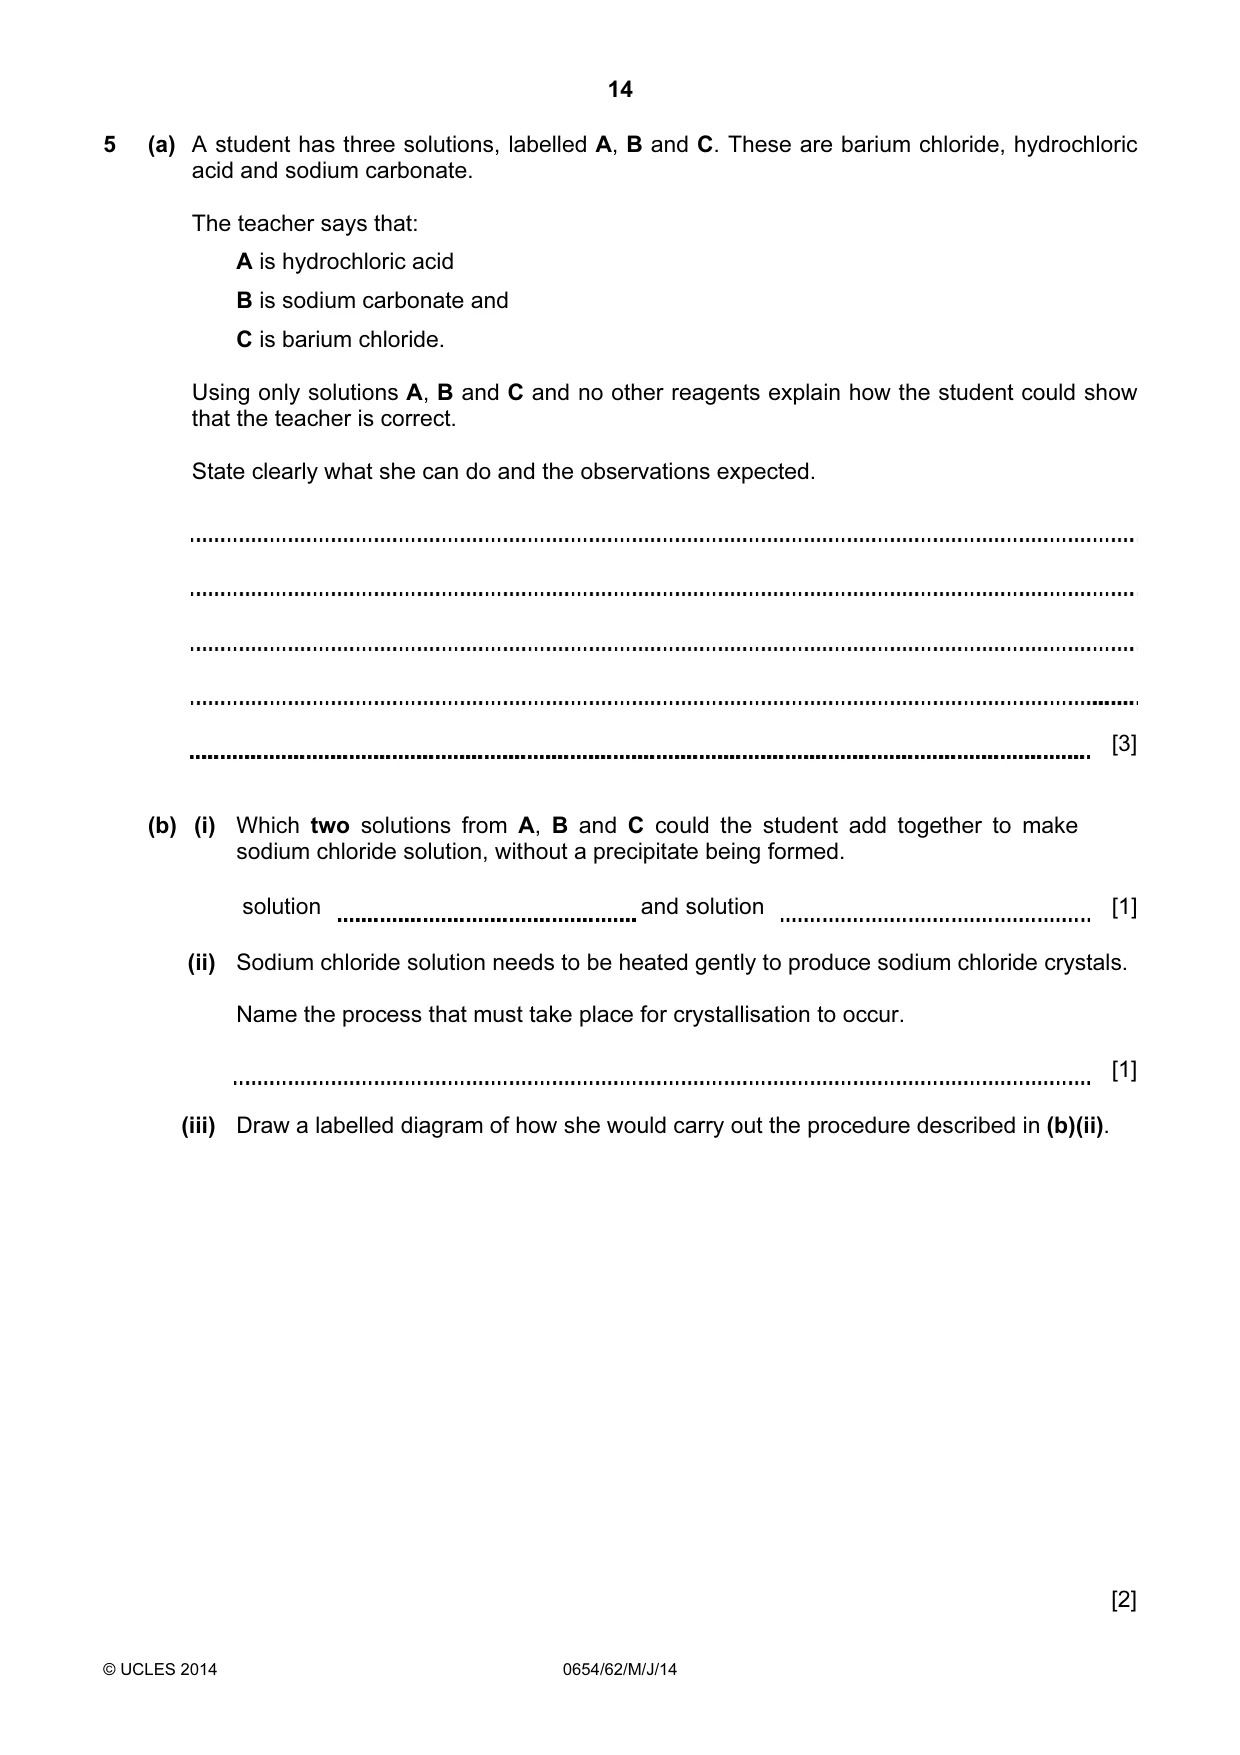
14 © UCLES 2014 0654/62/M/J/14 5 (a) A student has three solutions, labelled A, B and C. These are barium chloride, hydrochloric acid and sodium carbonate. The teacher says that: A is hydrochloric acid B is sodium carbonate and C is barium chloride. Using only solutions A, B and C and no other reagents explain how the student could show that the teacher is correct. State clearly what she can do and the observations expected. [3] (b) (i) Which two solutions from A, B and C could the student add together to make sodium chloride solution, without a precipitate being formed. solution and solution [1] (ii) Sodium chloride solution needs to be heated gently to produce sodium chloride crystals. Name the process that must take place for crystallisation to occur. [1] (iii) Draw a labelled diagram of how she would carry out the procedure described in (b)(ii). [2]
Question paper, page 15
15 © UCLES 2014 0654/62/M/J/14 [Turn over (c) The teacher provides the student with another solution, labelled D. Describe a test and state the result that shows it contains a zinc cation. [3]
Question paper, page 16
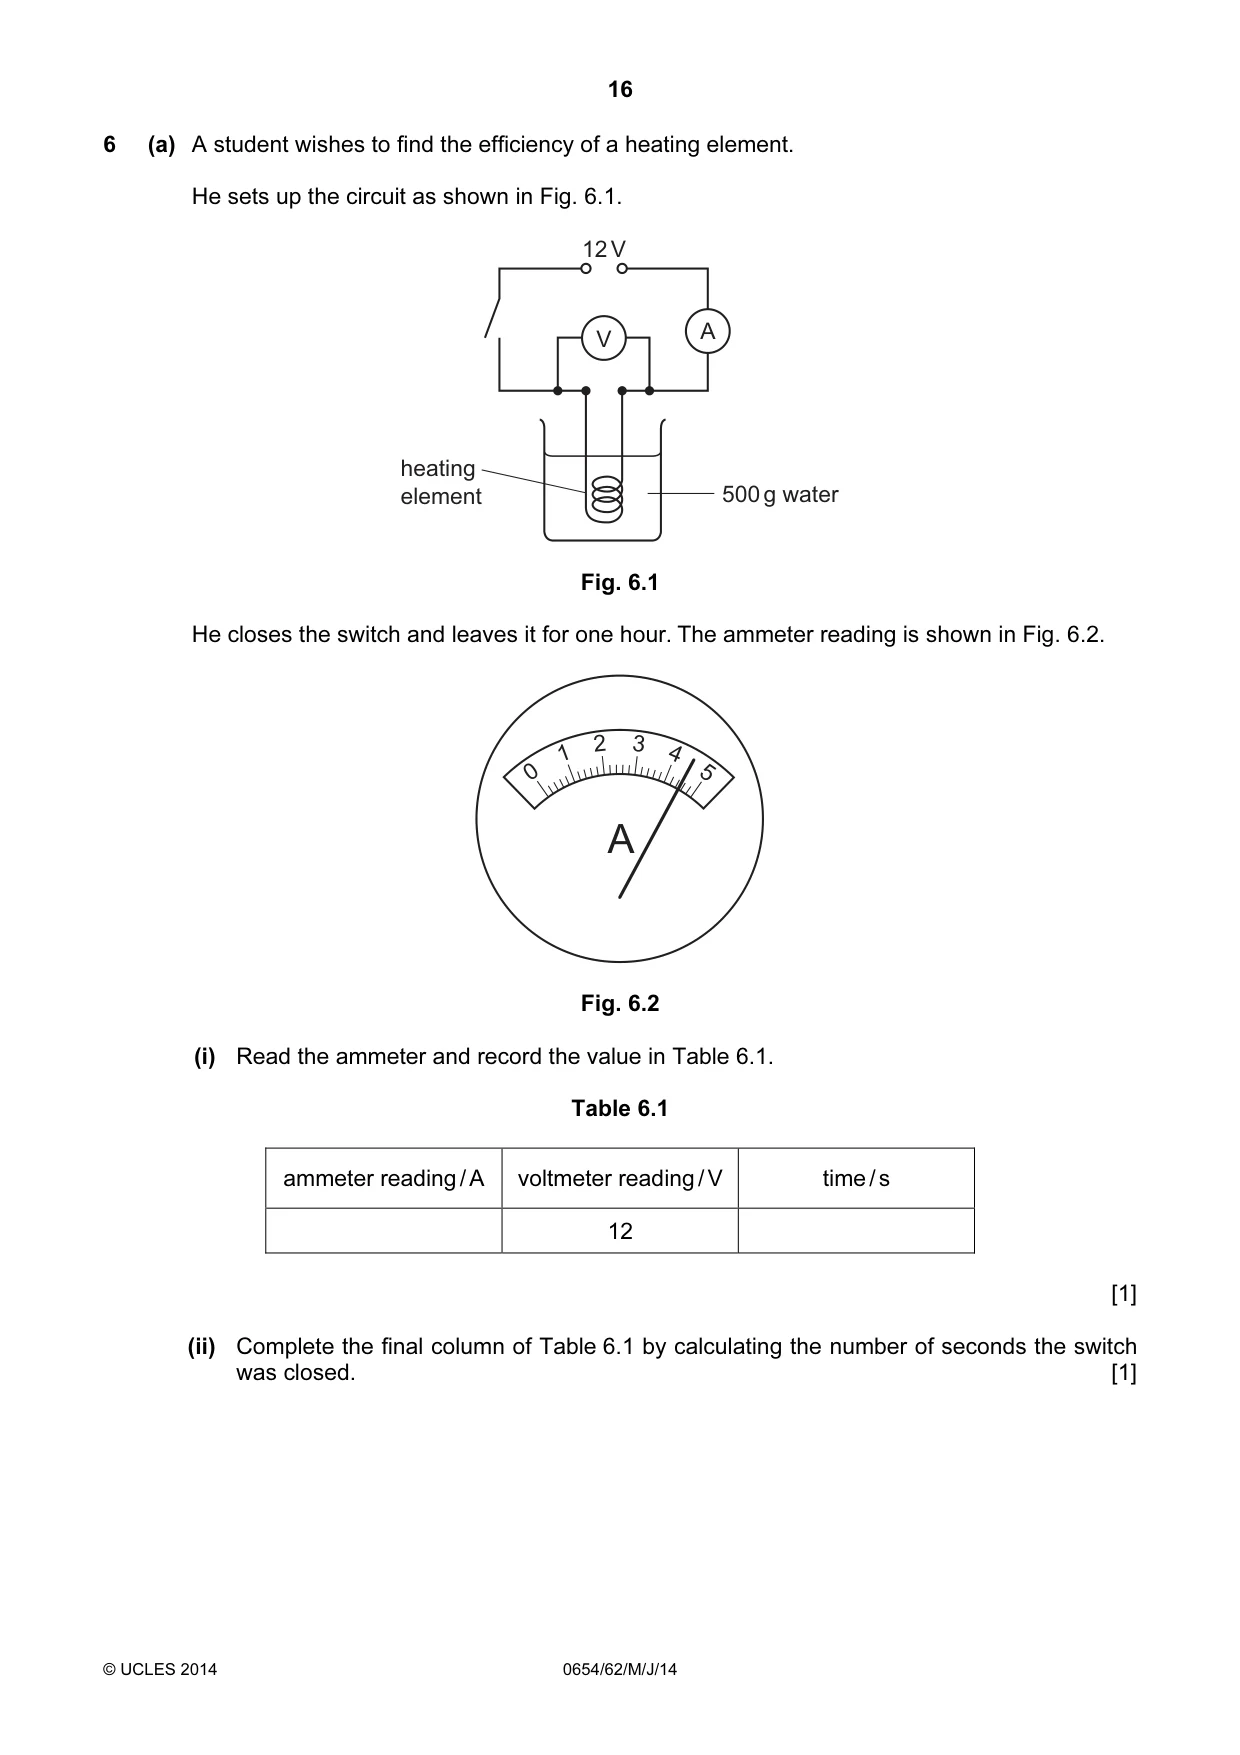
16 © UCLES 2014 0654/62/M/J/14 6 (a) A student wishes to find the efficiency of a heating element. He sets up the circuit as shown in Fig. 6.1. V A 12 V heating element 500 g water Fig. 6.1 He closes the switch and leaves it for one hour. The ammeter reading is shown in Fig. 6.2. 5 0 1 2 3 4 A Fig. 6.2 (i) Read the ammeter and record the value in Table 6.1. Table 6.1 ammeter reading / A voltmeter reading / V time / s 12 [1] (ii) Complete the final column of Table 6.1 by calculating the number of seconds the switch was closed. [1]
Question paper, page 17
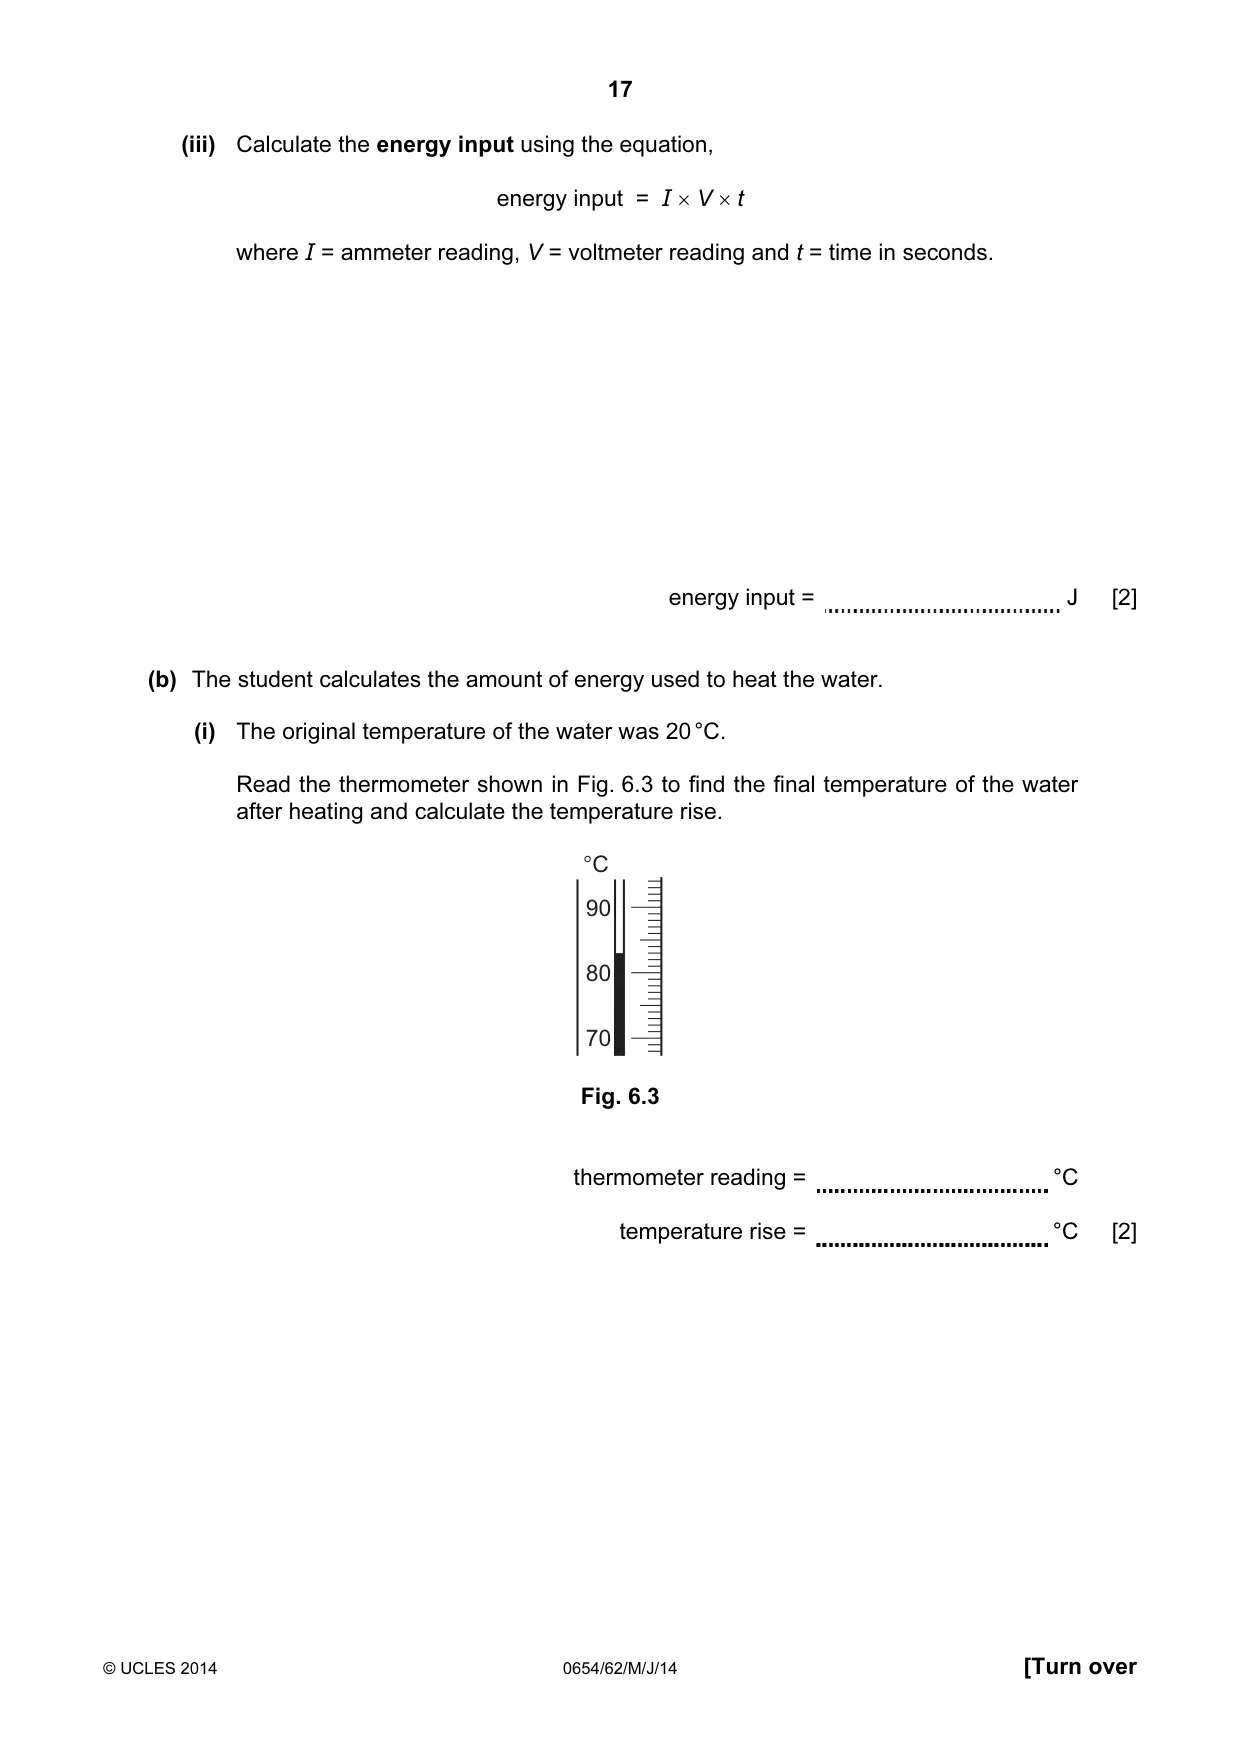
17 © UCLES 2014 0654/62/M/J/14 [Turn over (iii) Calculate the energy input using the equation, energy input = I × V × t where I = ammeter reading, V = voltmeter reading and t = time in seconds. energy input = J [2] (b) The student calculates the amount of energy used to heat the water. (i) The original temperature of the water was 20 °C. Read the thermometer shown in Fig. 6.3 to find the final temperature of the water after heating and calculate the temperature rise. 90 80 70 °C Fig. 6.3 thermometer reading = °C temperature rise = °C [2]
Question paper, page 18
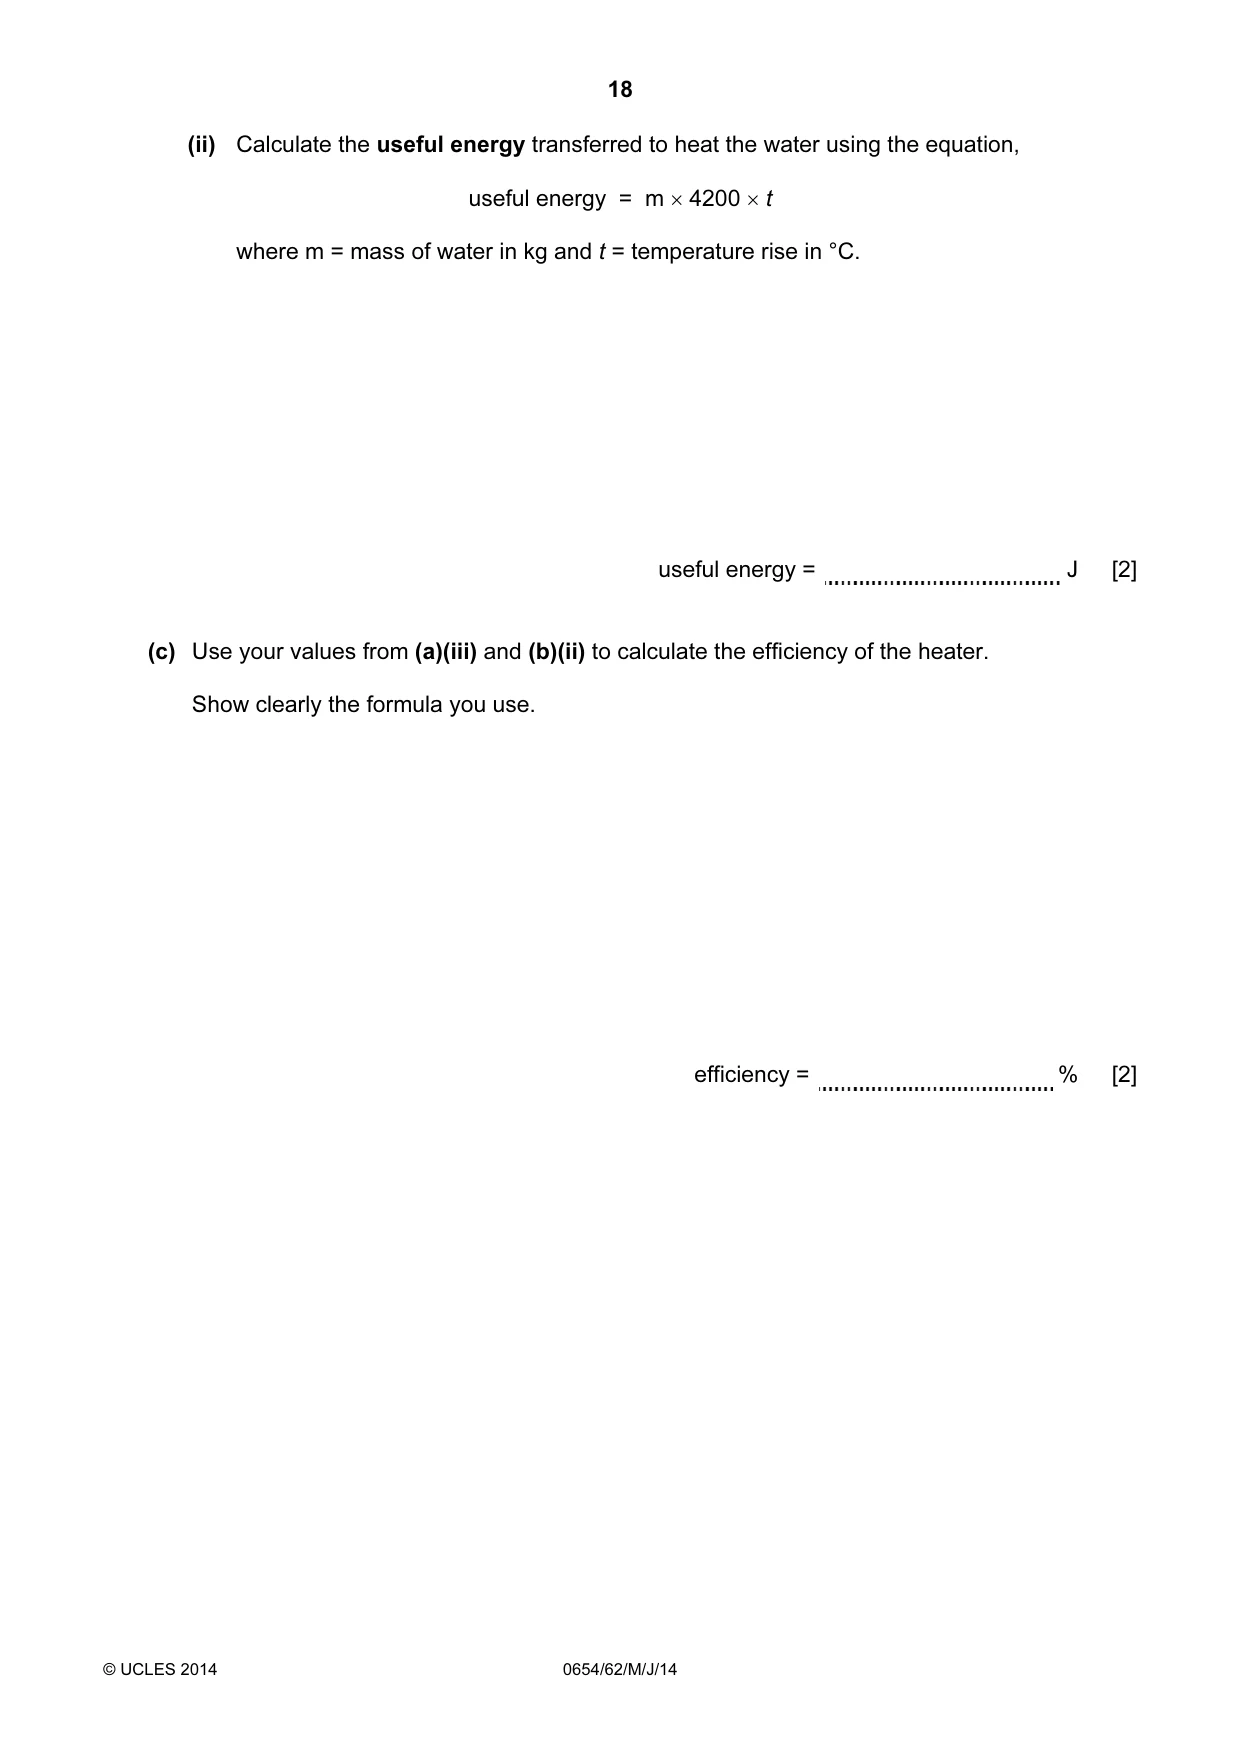
18 © UCLES 2014 0654/62/M/J/14 (ii) Calculate the useful energy transferred to heat the water using the equation, useful energy = m × 4200 × t where m = mass of water in kg and t = temperature rise in °C. useful energy = J [2] (c) Use your values from (a)(iii) and (b)(ii) to calculate the efficiency of the heater. Show clearly the formula you use. efficiency = % [2]
Question paper, page 19
19 © UCLES 2014 0654/62/M/J/14 BLANK PAGE
Question paper, page 20
20 Permission to reproduce items where third-party owned material protected by copyright is included has been sought and cleared where possible. Every reasonable effort has been made by the publisher (UCLES) to trace copyright holders, but if any items requiring clearance have unwittingly been included, the publisher will be pleased to make amends at the earliest possible opportunity. Cambridge International Examinations is part of the Cambridge Assessment Group. Cambridge Assessment is the brand name of University of Cambridge Local Examinations Syndicate (UCLES), which is itself a department of the University of Cambridge. © UCLES 2014 0654/62/M/J/14 BLANK PAGE
Mark scheme, page 1
CAMBRIDGE INTERNATIONAL EXAMINATIONS International General Certificate of Secondary Education MARK SCHEME for the May/June 2014 series 0654 CO-ORDINATED SCIENCES 0654/62 Paper 6 (Alternative to Practical), maximum raw mark 60 This mark scheme is published as an aid to teachers and candidates, to indicate the requirements of the examination. It shows the basis on which Examiners were instructed to award marks. It does not indicate the details of the discussions that took place at an Examiners’ meeting before marking began, which would have considered the acceptability of alternative answers. Mark schemes should be read in conjunction with the question paper and the Principal Examiner Report for Teachers. Cambridge will not enter into discussions about these mark schemes. Cambridge is publishing the mark schemes for the May/June 2014 series for most IGCSE, GCE Advanced Level and Advanced Subsidiary Level components and some Ordinary Level components.
Mark scheme, page 2
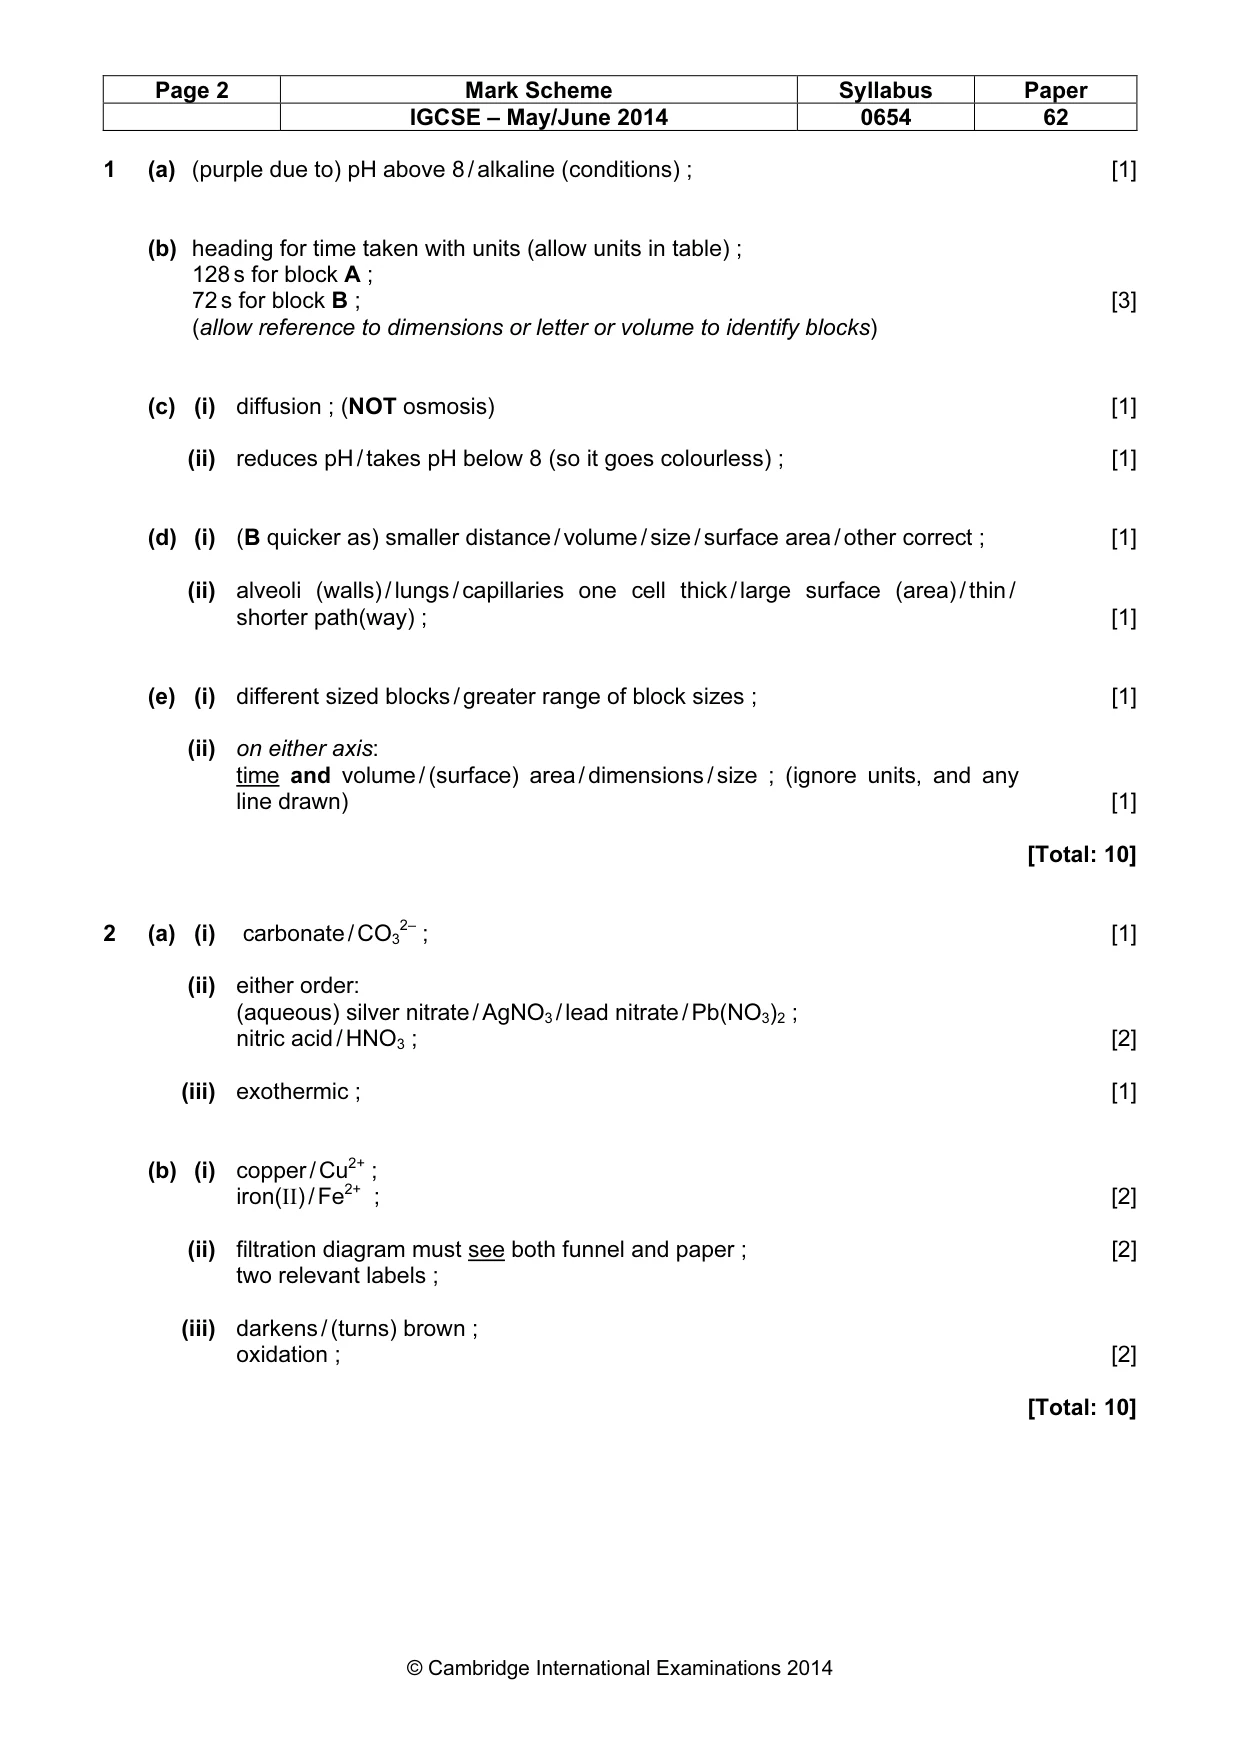
Page 2 Mark Scheme Syllabus Paper IGCSE – May/June 2014 0654 62 © Cambridge International Examinations 2014 1 (a) (purple due to) pH above 8 / alkaline (conditions) ; [1] (b) heading for time taken with units (allow units in table) ; 128 s for block A ; 72 s for block B ; [3] (allow reference to dimensions or letter or volume to identify blocks) (c) (i) diffusion ; (NOT osmosis) [1] (ii) reduces pH / takes pH below 8 (so it goes colourless) ; [1] (d) (i) (B quicker as) smaller distance / volume / size / surface area / other correct ; [1] (ii) alveoli (walls) / lungs / capillaries one cell thick / large surface (area) / thin / shorter path(way) ; [1] (e) (i) different sized blocks / greater range of block sizes ; [1] (ii) on either axis: time and volume / (surface) area / dimensions / size ; (ignore units, and any line drawn) [1] [Total: 10] 2 (a) (i) carbonate / CO3 2– ; [1] (ii) either order: (aqueous) silver nitrate / AgNO3 / lead nitrate / Pb(NO3)2 ; nitric acid / HNO3 ; [2] (iii) exothermic ; [1] (b) (i) copper / Cu2+ ; iron(II) / Fe2+ ; [2] (ii) filtration diagram must see both funnel and paper ; [2] two relevant labels ; (iii) darkens / (turns) brown ; oxidation ; [2] [Total: 10]
Mark scheme, page 3
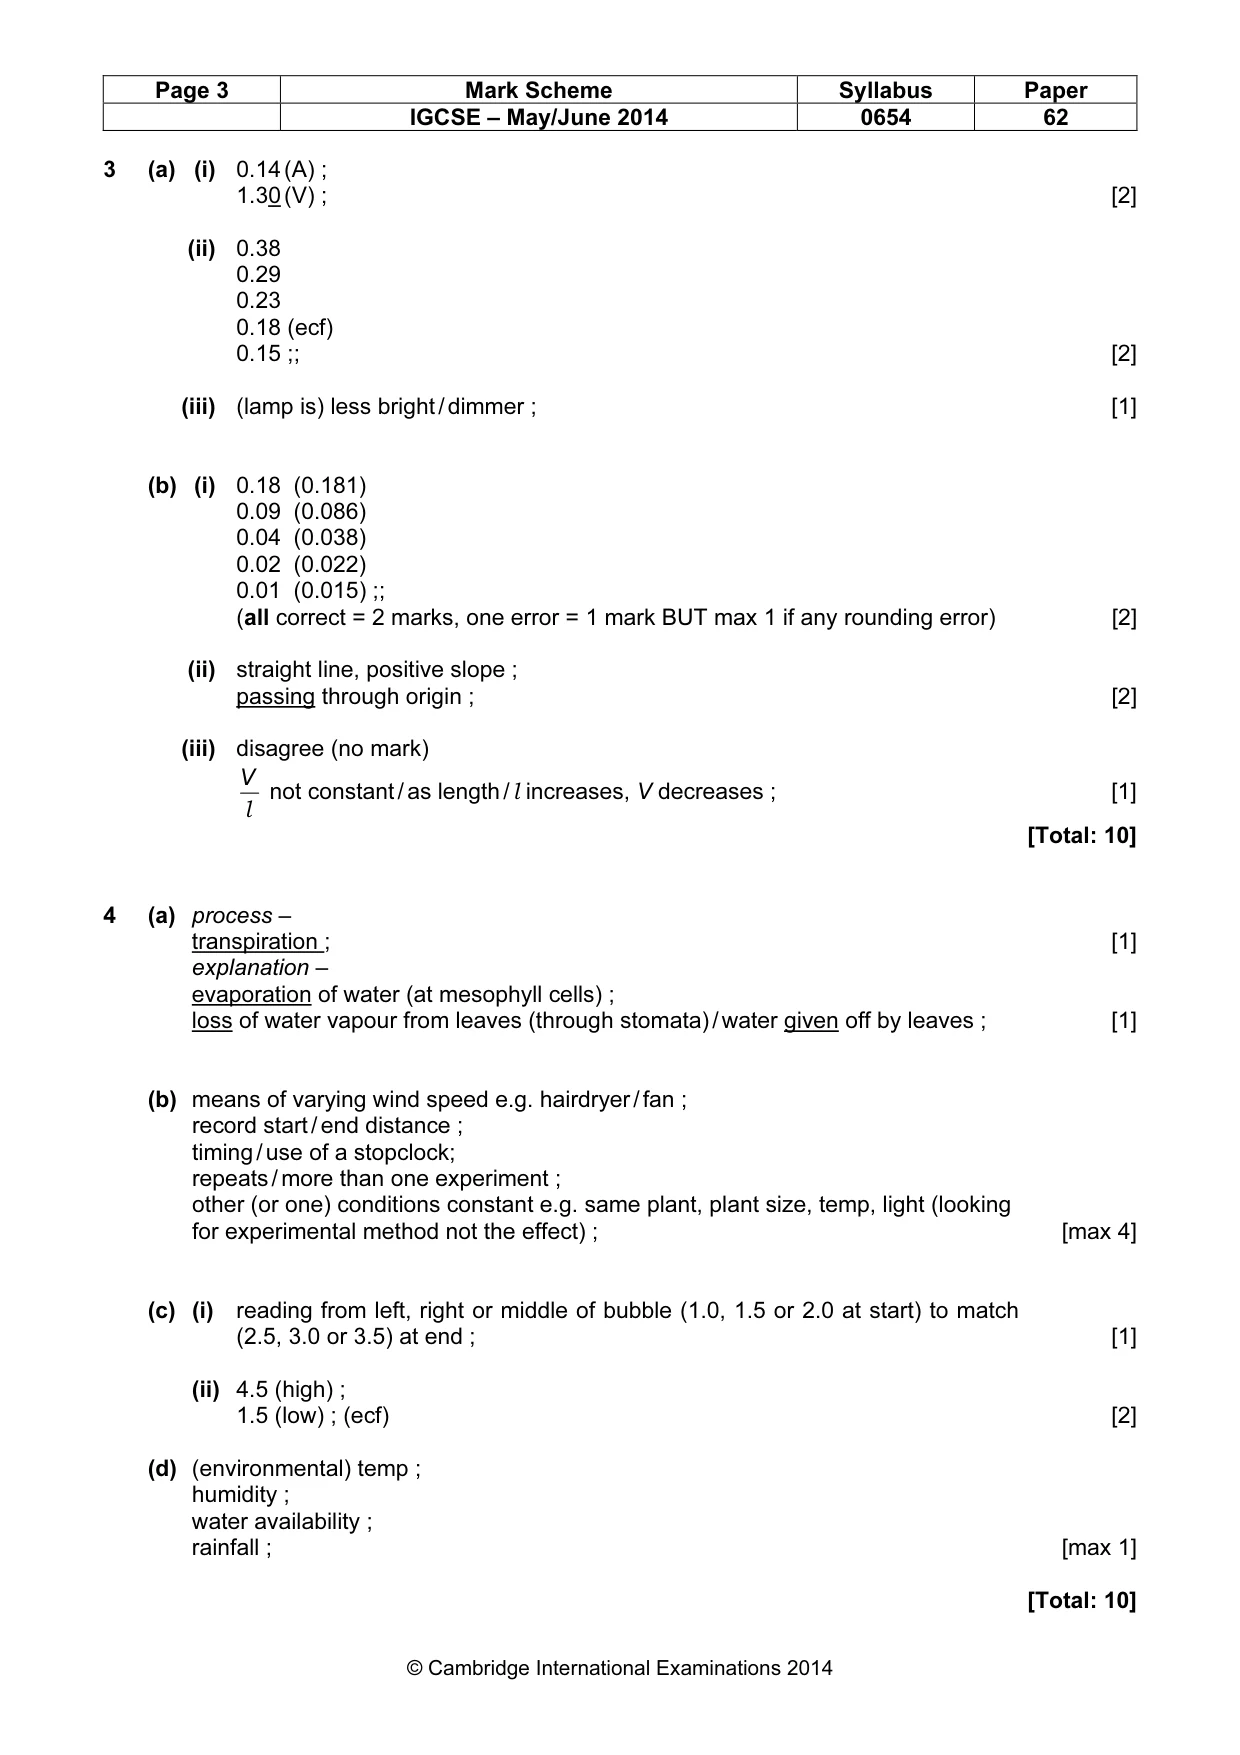
Page 3 Mark Scheme Syllabus Paper IGCSE – May/June 2014 0654 62 © Cambridge International Examinations 2014 3 (a) (i) 0.14 (A) ; 1.30 (V) ; [2] (ii) 0.38 0.29 0.23 0.18 (ecf) 0.15 ;; [2] (iii) (lamp is) less bright / dimmer ; [1] (b) (i) 0.18 (0.181) 0.09 (0.086) 0.04 (0.038) 0.02 (0.022) 0.01 (0.015) ;; (all correct = 2 marks, one error = 1 mark BUT max 1 if any rounding error) [2] (ii) straight line, positive slope ; passing through origin ; [2] (iii) disagree (no mark) l V not constant / as length / l increases, V decreases ; [1] [Total: 10] 4 (a) process – transpiration ; [1] explanation – evaporation of water (at mesophyll cells) ; loss of water vapour from leaves (through stomata) / water given off by leaves ; [1] (b) means of varying wind speed e.g. hairdryer / fan ; record start / end distance ; timing / use of a stopclock; repeats / more than one experiment ; other (or one) conditions constant e.g. same plant, plant size, temp, light (looking for experimental method not the effect) ; [max 4] (c) (i) reading from left, right or middle of bubble (1.0, 1.5 or 2.0 at start) to match (2.5, 3.0 or 3.5) at end ; [1] (ii) 4.5 (high) ; 1.5 (low) ; (ecf) [2] (d) (environmental) temp ; humidity ; water availability ; rainfall ; [max 1] [Total: 10]
Mark scheme, page 4
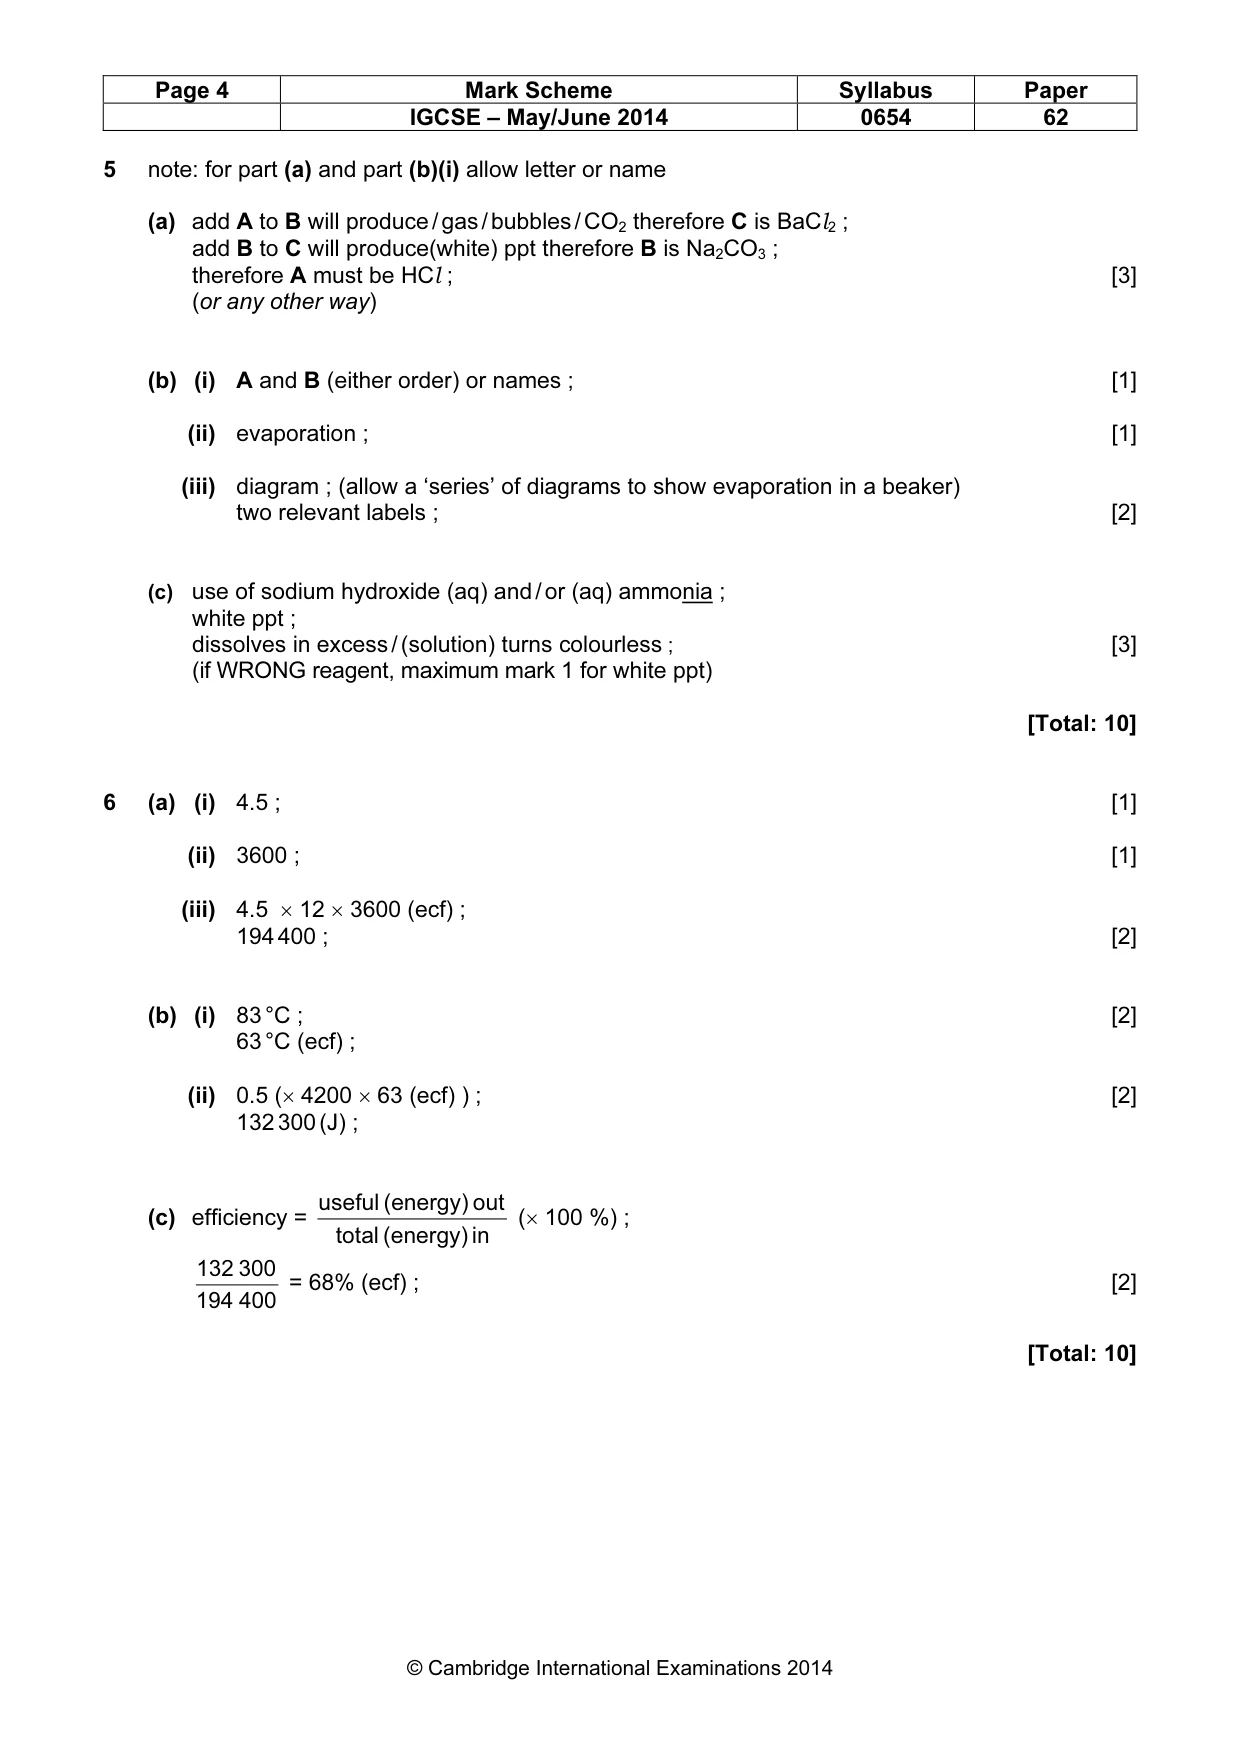
Page 4 Mark Scheme Syllabus Paper IGCSE – May/June 2014 0654 62 © Cambridge International Examinations 2014 5 note: for part (a) and part (b)(i) allow letter or name (a) add A to B will produce / gas / bubbles / CO2 therefore C is BaCl2 ; add B to C will produce(white) ppt therefore B is Na2CO3 ; therefore A must be HCl ; [3] (or any other way) (b) (i) A and B (either order) or names ; [1] (ii) evaporation ; [1] (iii) diagram ; (allow a ‘series’ of diagrams to show evaporation in a beaker) two relevant labels ; [2] (c) use of sodium hydroxide (aq) and / or (aq) ammonia ; white ppt ; dissolves in excess / (solution) turns colourless ; [3] (if WRONG reagent, maximum mark 1 for white ppt) [Total: 10] 6 (a) (i) 4.5 ; [1] (ii) 3600 ; [1] (iii) 4.5 × 12 × 3600 (ecf) ; 194 400 ; [2] (b) (i) 83 °C ; [2] 63 °C (ecf) ; (ii) 0.5 (× 4200 × 63 (ecf) ) ; [2] 132 300 (J) ; (c) efficiency = in (energy) total out (energy) useful (× 100 %) ; 400 194 300 132 = 68% (ecf) ; [2] [Total: 10]
What you needed in this session
Cambridge’s own grade thresholds for 2014 May/June, Paper 6 · Variant 2. A higher threshold means an easier paper — the bar moves with how the cohort did.