Cambridge IGCSE Sciences - Co-ordinated (Double) 0654 — 2011 Oct/Nov Paper 6 · Variant 2
0654/62/O/N/11 · 60 marks · ≈68 min
The question paper and its mark scheme, free to read here and free to download. This is Cambridge’s own paper, exactly as it was sat.
Question paper20 pages
Mark scheme4 pages
Answers below. Sit the paper first if you are practising.
Paper as text
Question paper, page 1
This document consists of 18 printed pages and 2 blank pages. IB11 11_0654_62/FP © UCLES 2011 [Turn over *6608480670* For Examiner's Use 1 2 3 4 5 6 Total UNIVERSITY OF CAMBRIDGE INTERNATIONAL EXAMINATIONS International General Certificate of Secondary Education CO-ORDINATED SCIENCES 0654/62 Paper 6 Alternative to Practical October/November 2011 1 hour Candidates answer on the Question paper No Additional Materials are required. READ THESE INSTRUCTIONS FIRST Write your Centre number, candidate number and name on all the work you hand in. Write in dark blue or black pen. You may use a soft pencil for any diagrams, graphs, tables or rough working. Do not use staples, paper clips, highlighters, glue or correction fluid. DO NOT WRITE IN ANY BARCODES. Answer all questions. At the end of the examination, fasten all your work securely together. The number of marks is given in brackets [ ] at the end of each question or part question. www.XtremePapers.com
Question paper, page 2
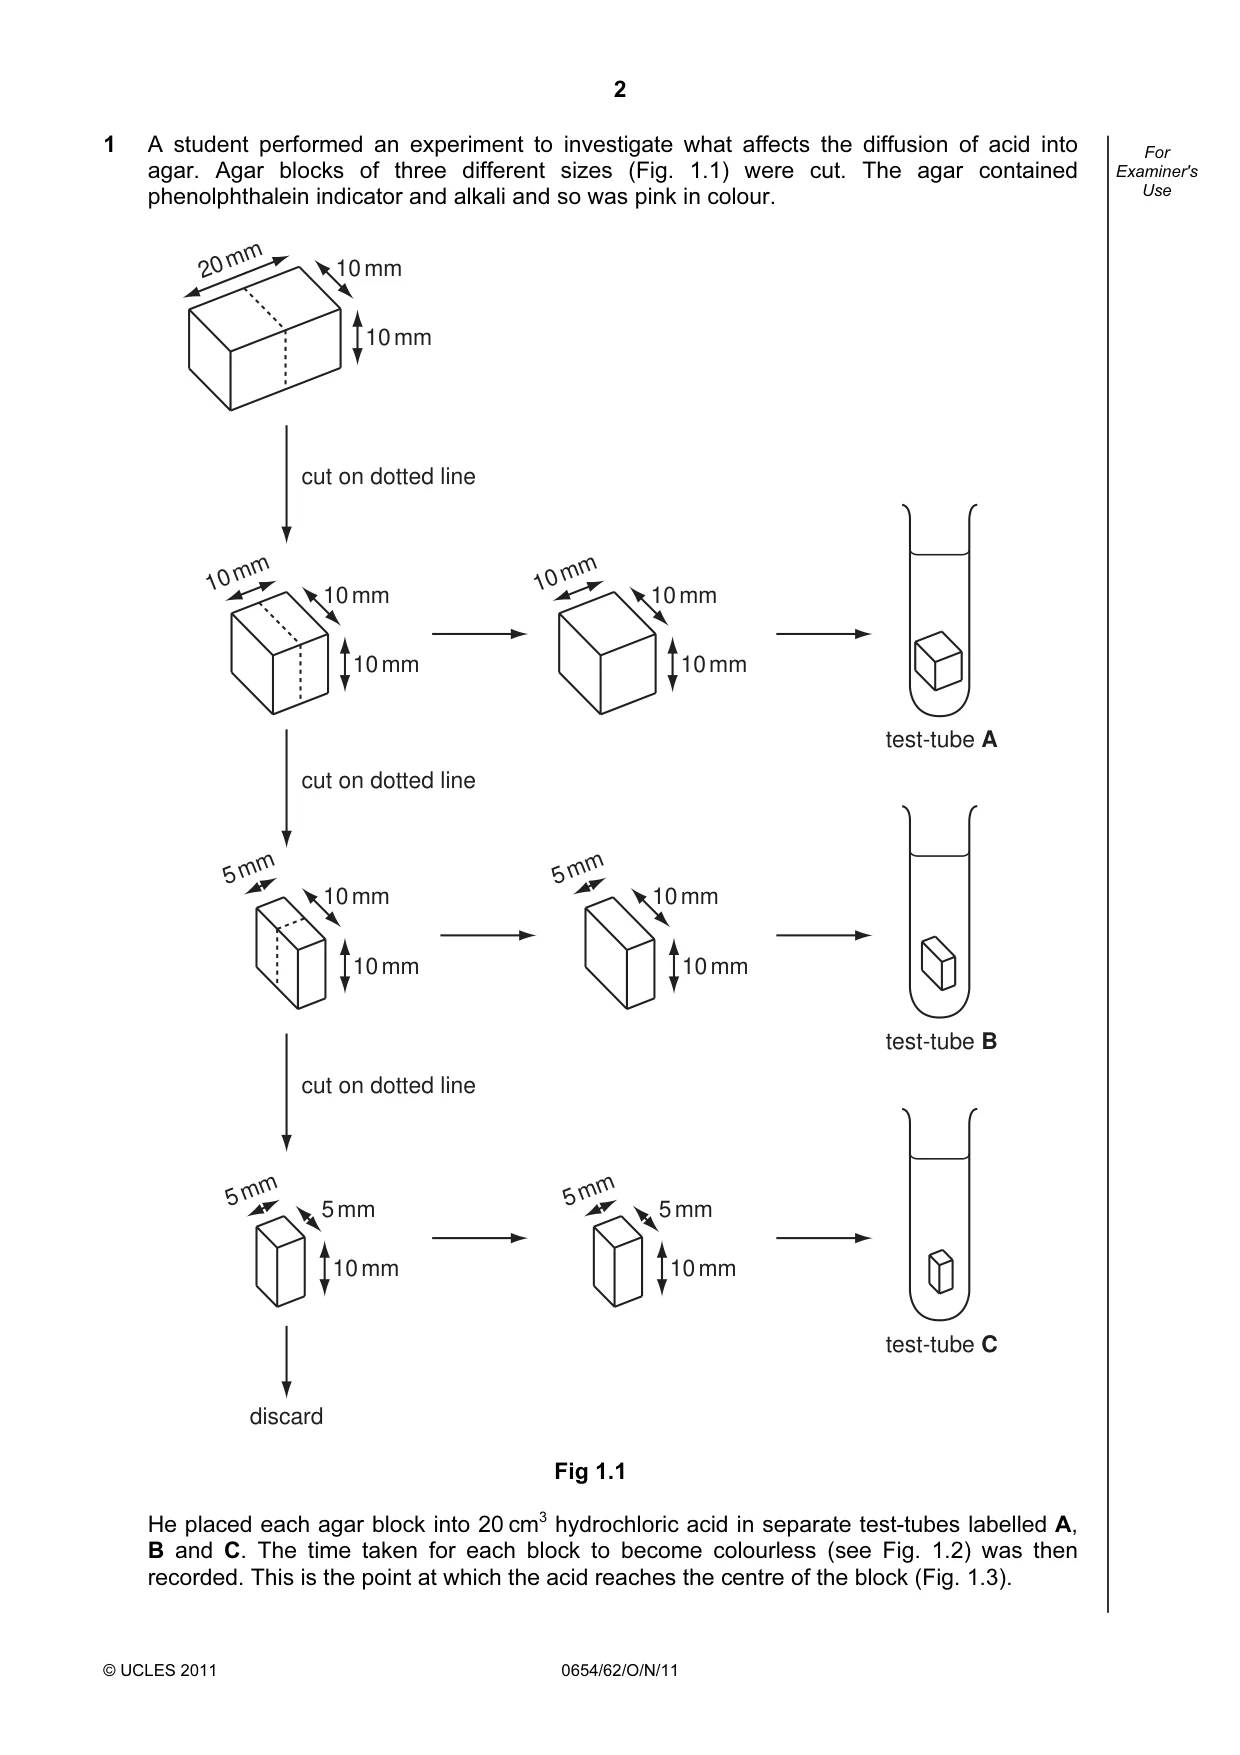
2 © UCLES 2011 0654/62/O/N/11 For Examiner's Use 1 A student performed an experiment to investigate what affects the diffusion of acid into agar. Agar blocks of three different sizes (Fig. 1.1) were cut. The agar contained phenolphthalein indicator and alkali and so was pink in colour. 20 mm 10 mm 10 mm 10 mm 10 mm 10 mm 10 mm 10 mm 10 mm cut on dotted line cut on dotted line cut on dotted line test-tube A 5 mm 10 mm 10 mm 5 mm 5 mm 10 mm 5 mm 5 mm 10 mm 5 mm 10 mm 10 mm test-tube B test-tube C discard Fig 1.1 He placed each agar block into 20 cm3 hydrochloric acid in separate test-tubes labelled A, B and C. The time taken for each block to become colourless (see Fig. 1.2) was then recorded. This is the point at which the acid reaches the centre of the block (Fig. 1.3).
Question paper, page 3
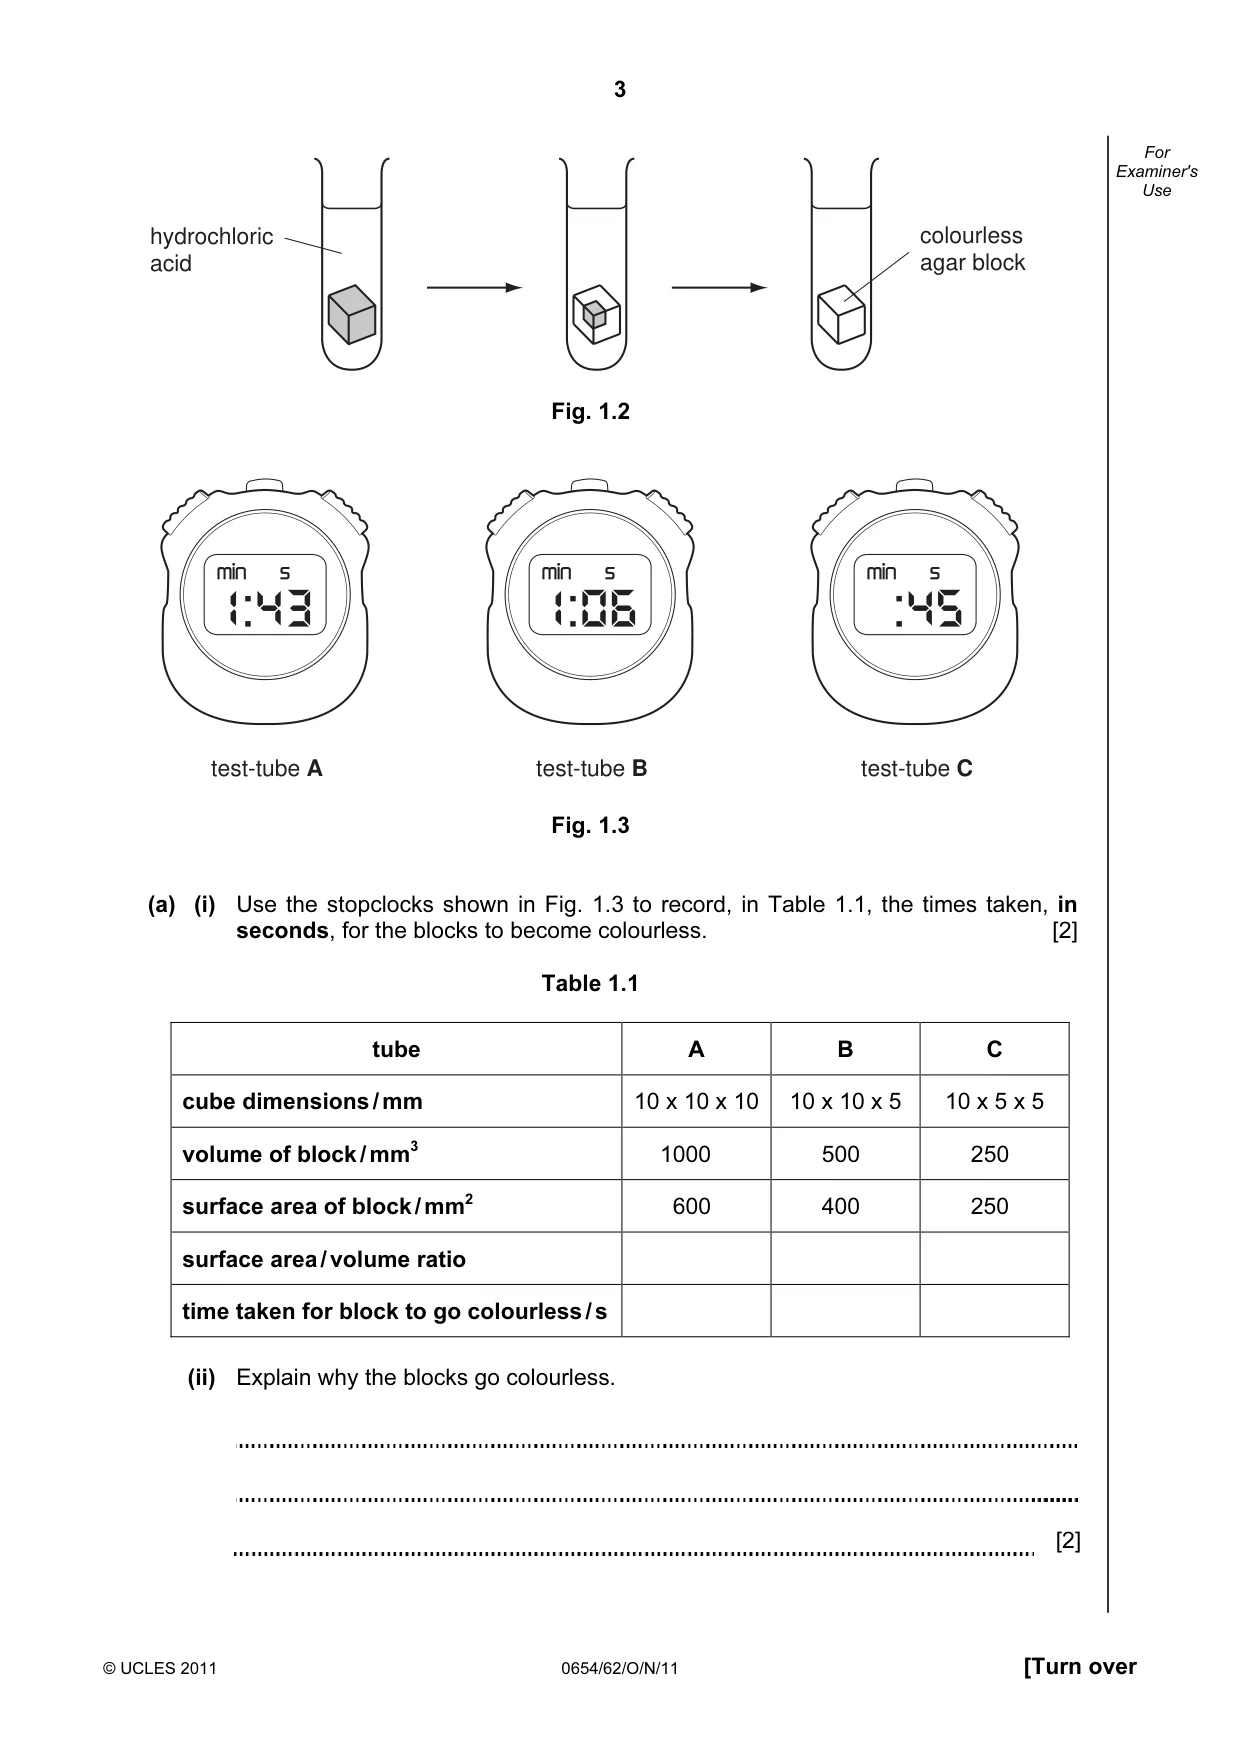
3 © UCLES 2011 0654/62/O/N/11 [Turn over For Examiner's Use hydrochloric acid colourless agar block Fig. 1.2 test-tube A test-tube B test-tube C Fig. 1.3 (a) (i) Use the stopclocks shown in Fig. 1.3 to record, in Table 1.1, the times taken, in seconds, for the blocks to become colourless. [2] Table 1.1 tube A B C cube dimensions / mm 10 x 10 x 10 10 x 10 x 5 10 x 5 x 5 volume of block / mm3 1000 500 250 surface area of block / mm2 600 400 250 surface area / volume ratio time taken for block to go colourless / s (ii) Explain why the blocks go colourless. [2]
Question paper, page 4
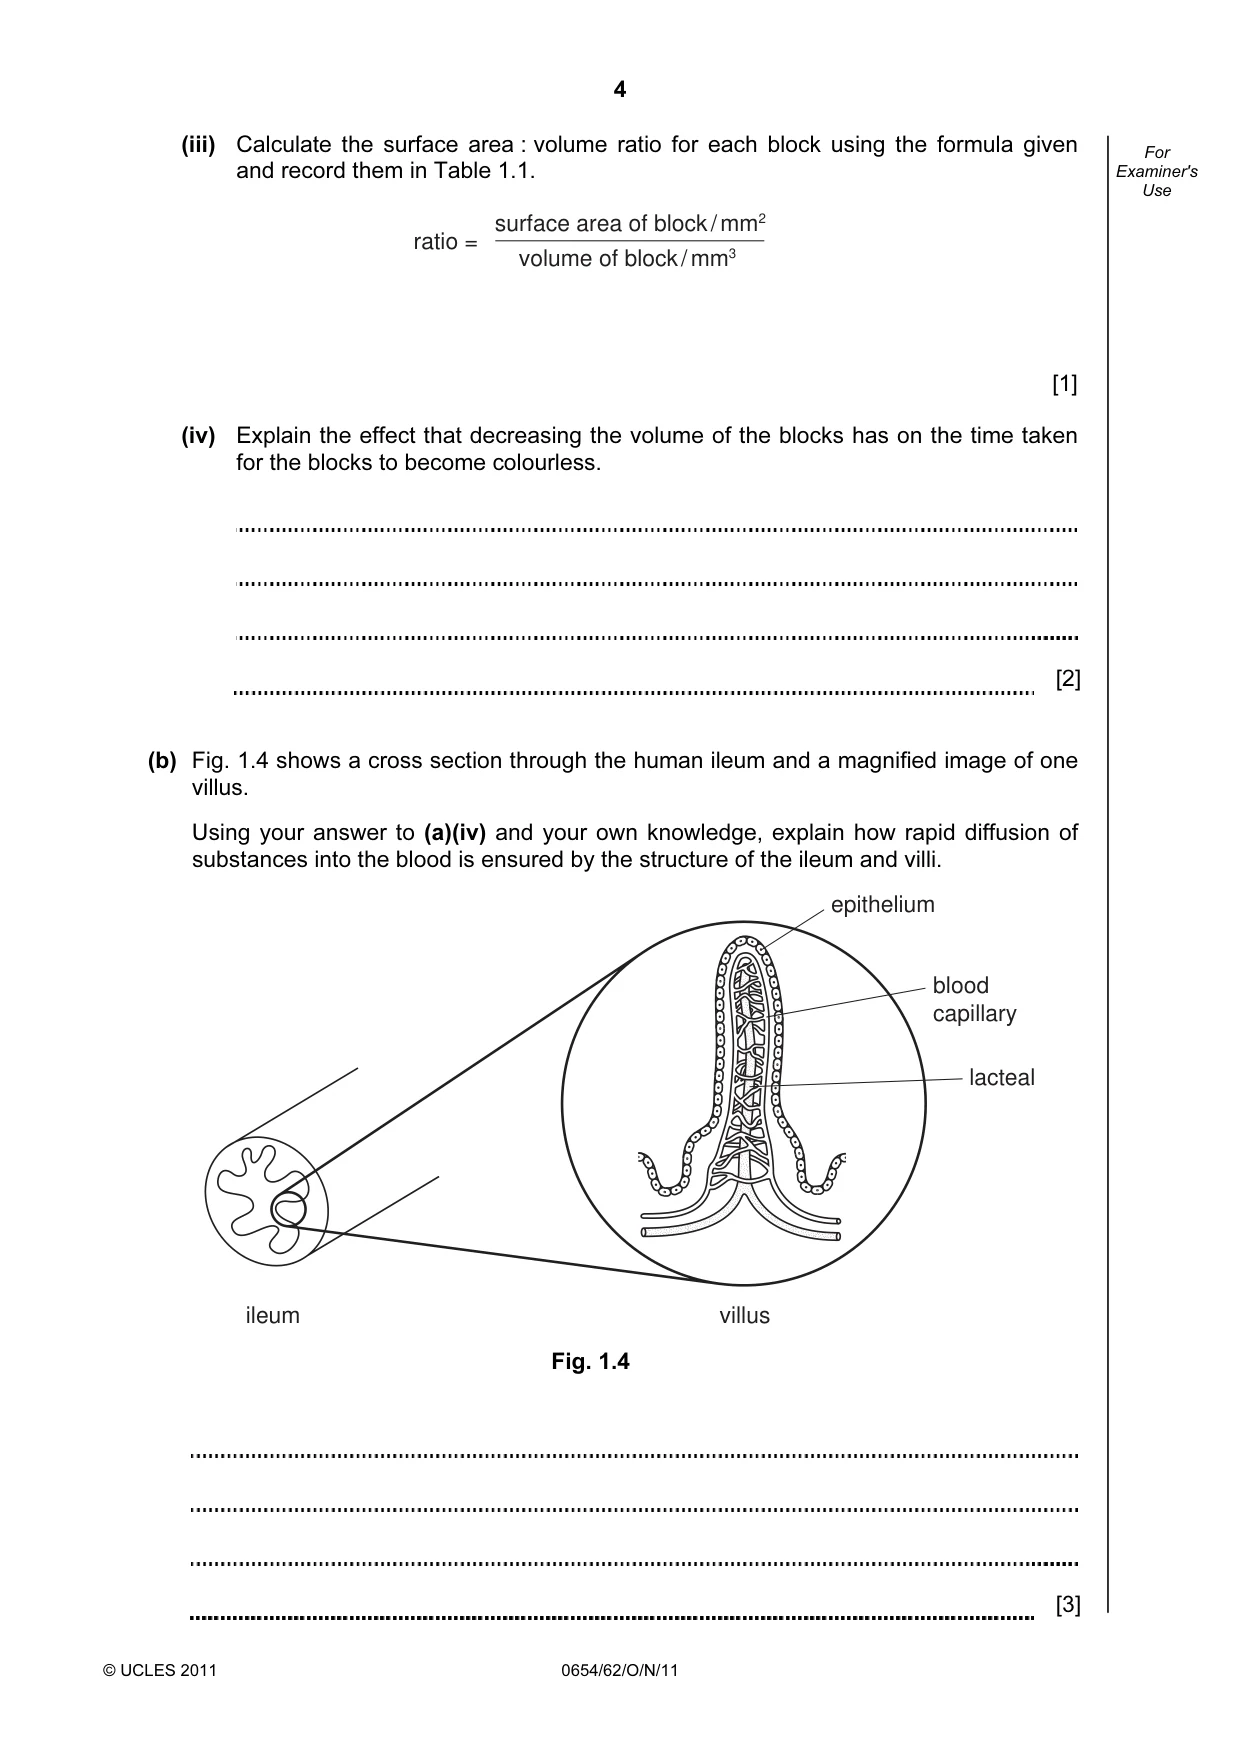
4 © UCLES 2011 0654/62/O/N/11 For Examiner's Use (iii) Calculate the surface area : volume ratio for each block using the formula given and record them in Table 1.1. volume of block / mm3 surface area of block / mm2 ratio = [1] (iv) Explain the effect that decreasing the volume of the blocks has on the time taken for the blocks to become colourless. [2] (b) Fig. 1.4 shows a cross section through the human ileum and a magnified image of one villus. Using your answer to (a)(iv) and your own knowledge, explain how rapid diffusion of substances into the blood is ensured by the structure of the ileum and villi. epithelium blood capillary lacteal villus ileum Fig. 1.4 [3]
Question paper, page 5
5 © UCLES 2011 0654/62/O/N/11 [Turn over BLANK PAGE Please turn over for Question 2.
Question paper, page 6
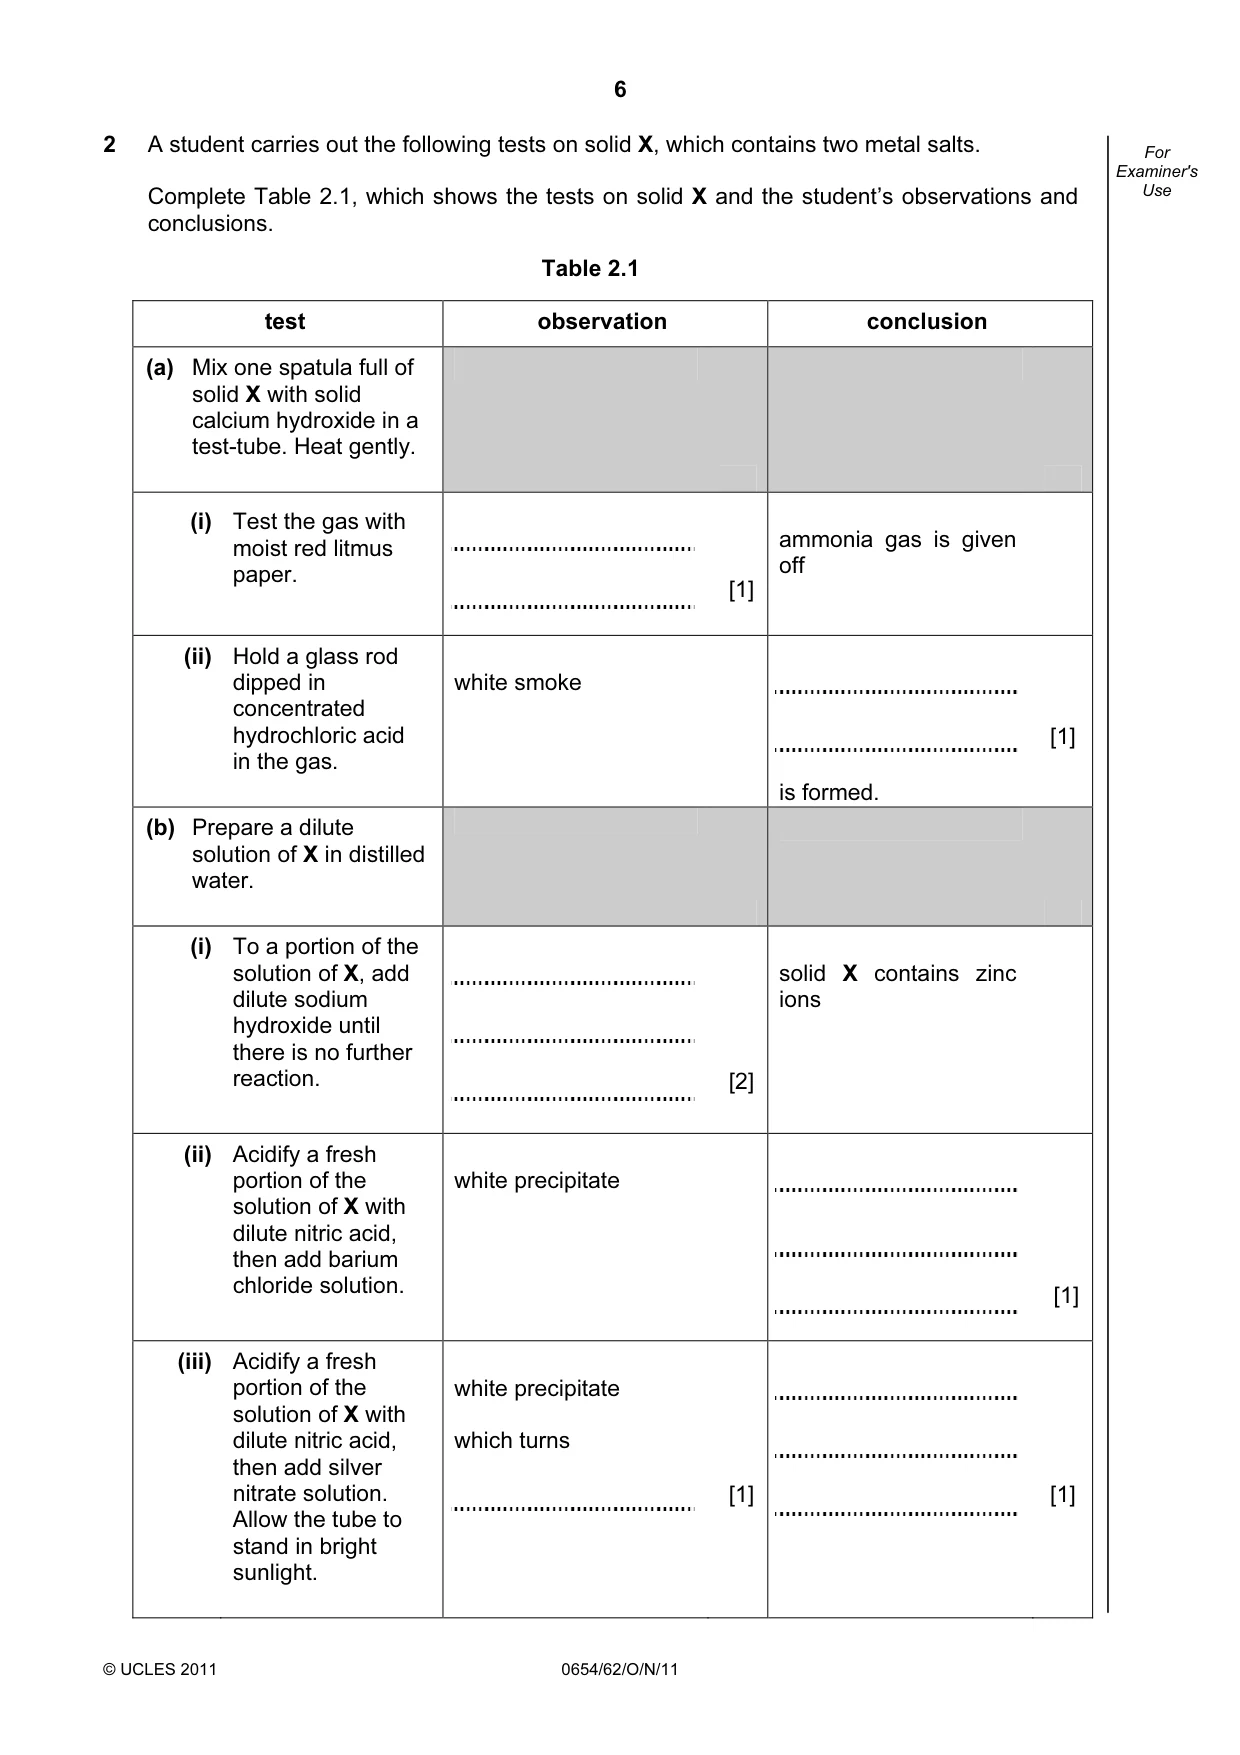
6 © UCLES 2011 0654/62/O/N/11 For Examiner's Use 2 A student carries out the following tests on solid X, which contains two metal salts. Complete Table 2.1, which shows the tests on solid X and the student’s observations and conclusions. Table 2.1 test observation conclusion (a) Mix one spatula full of solid X with solid calcium hydroxide in a test-tube. Heat gently. (i) Test the gas with moist red litmus paper. [1] ammonia gas is given off (ii) Hold a glass rod dipped in concentrated hydrochloric acid in the gas. white smoke is formed. [1] (b) Prepare a dilute solution of X in distilled water. (i) To a portion of the solution of X, add dilute sodium hydroxide until there is no further reaction. [2] solid X contains zinc ions (ii) Acidify a fresh portion of the solution of X with dilute nitric acid, then add barium chloride solution. white precipitate [1] (iii) Acidify a fresh portion of the solution of X with dilute nitric acid, then add silver nitrate solution. Allow the tube to stand in bright sunlight. white precipitate which turns [1] [1]
Question paper, page 7
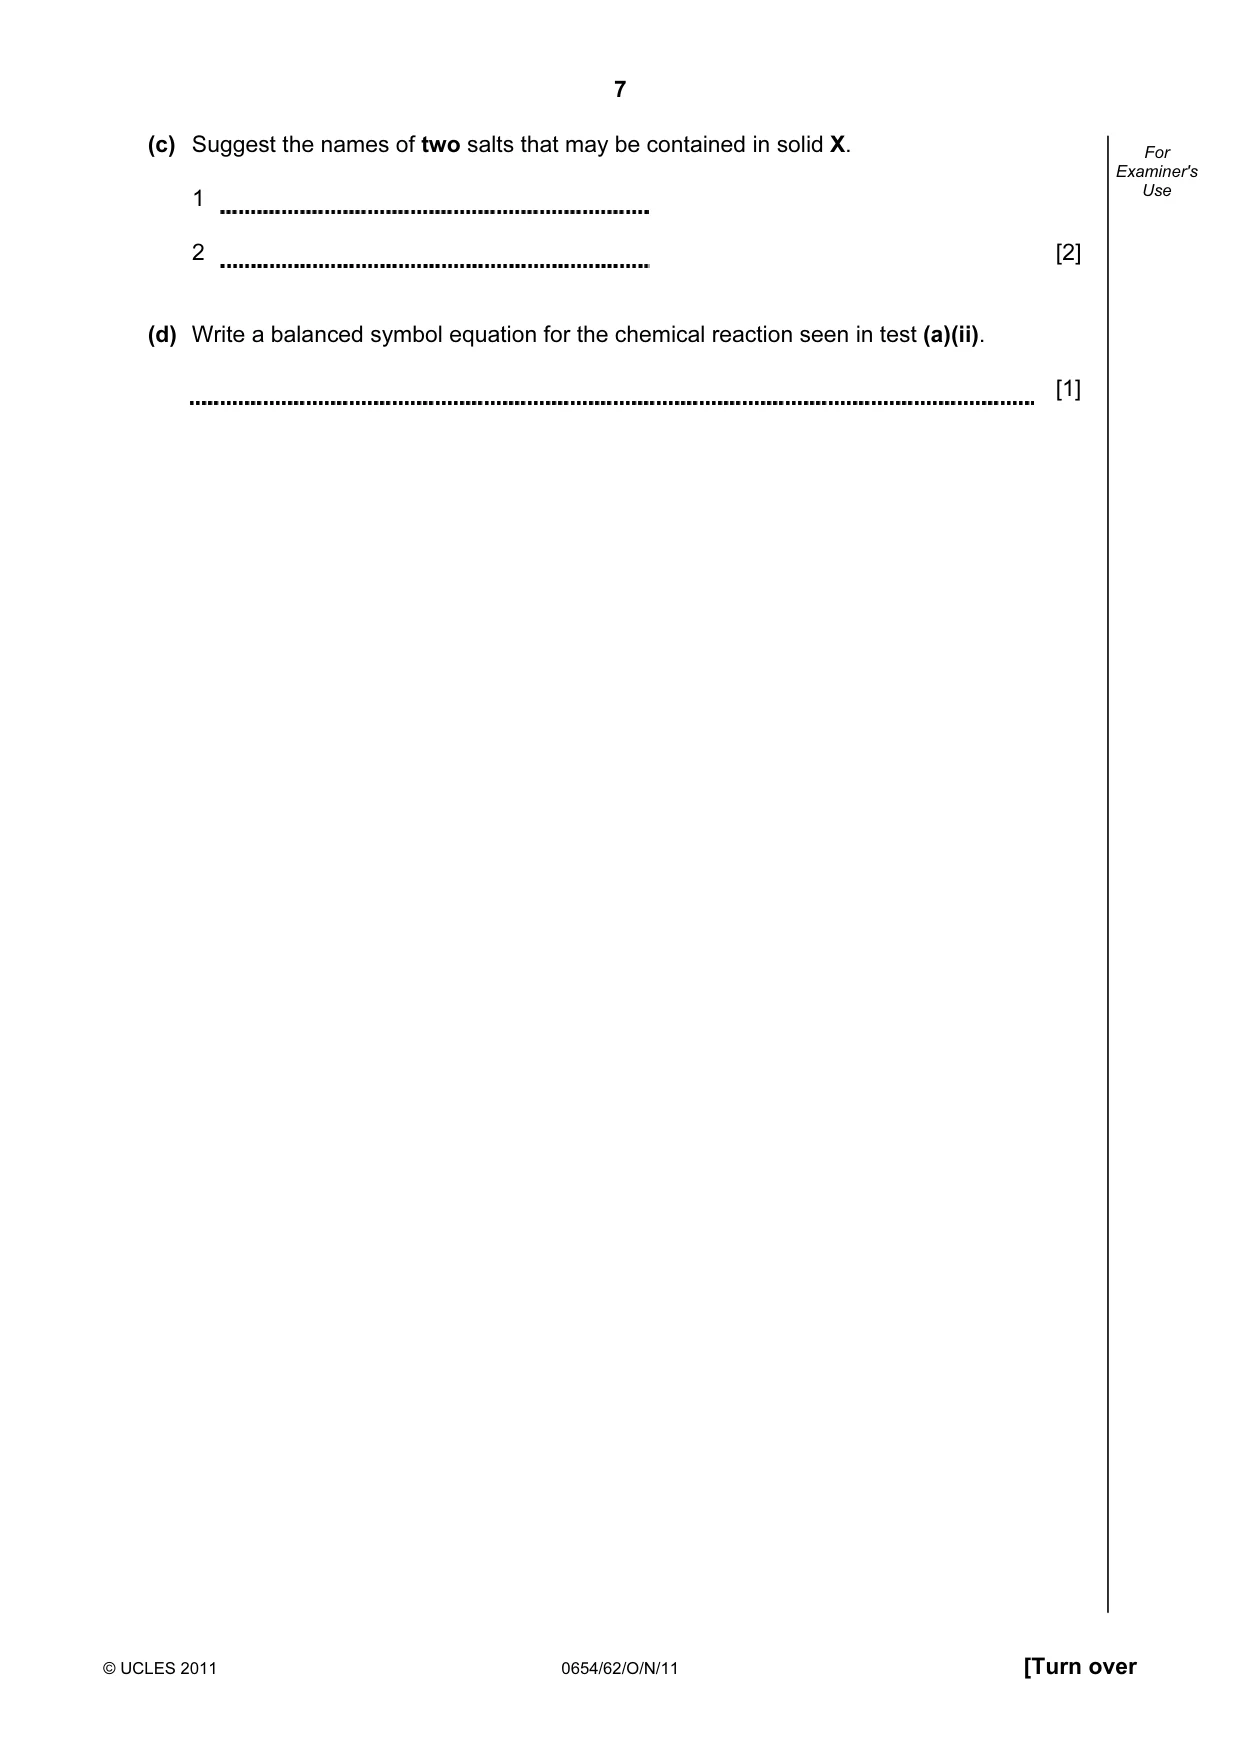
7 © UCLES 2011 0654/62/O/N/11 [Turn over For Examiner's Use (c) Suggest the names of two salts that may be contained in solid X. 1 2 [2] (d) Write a balanced symbol equation for the chemical reaction seen in test (a)(ii). [1]
Question paper, page 8
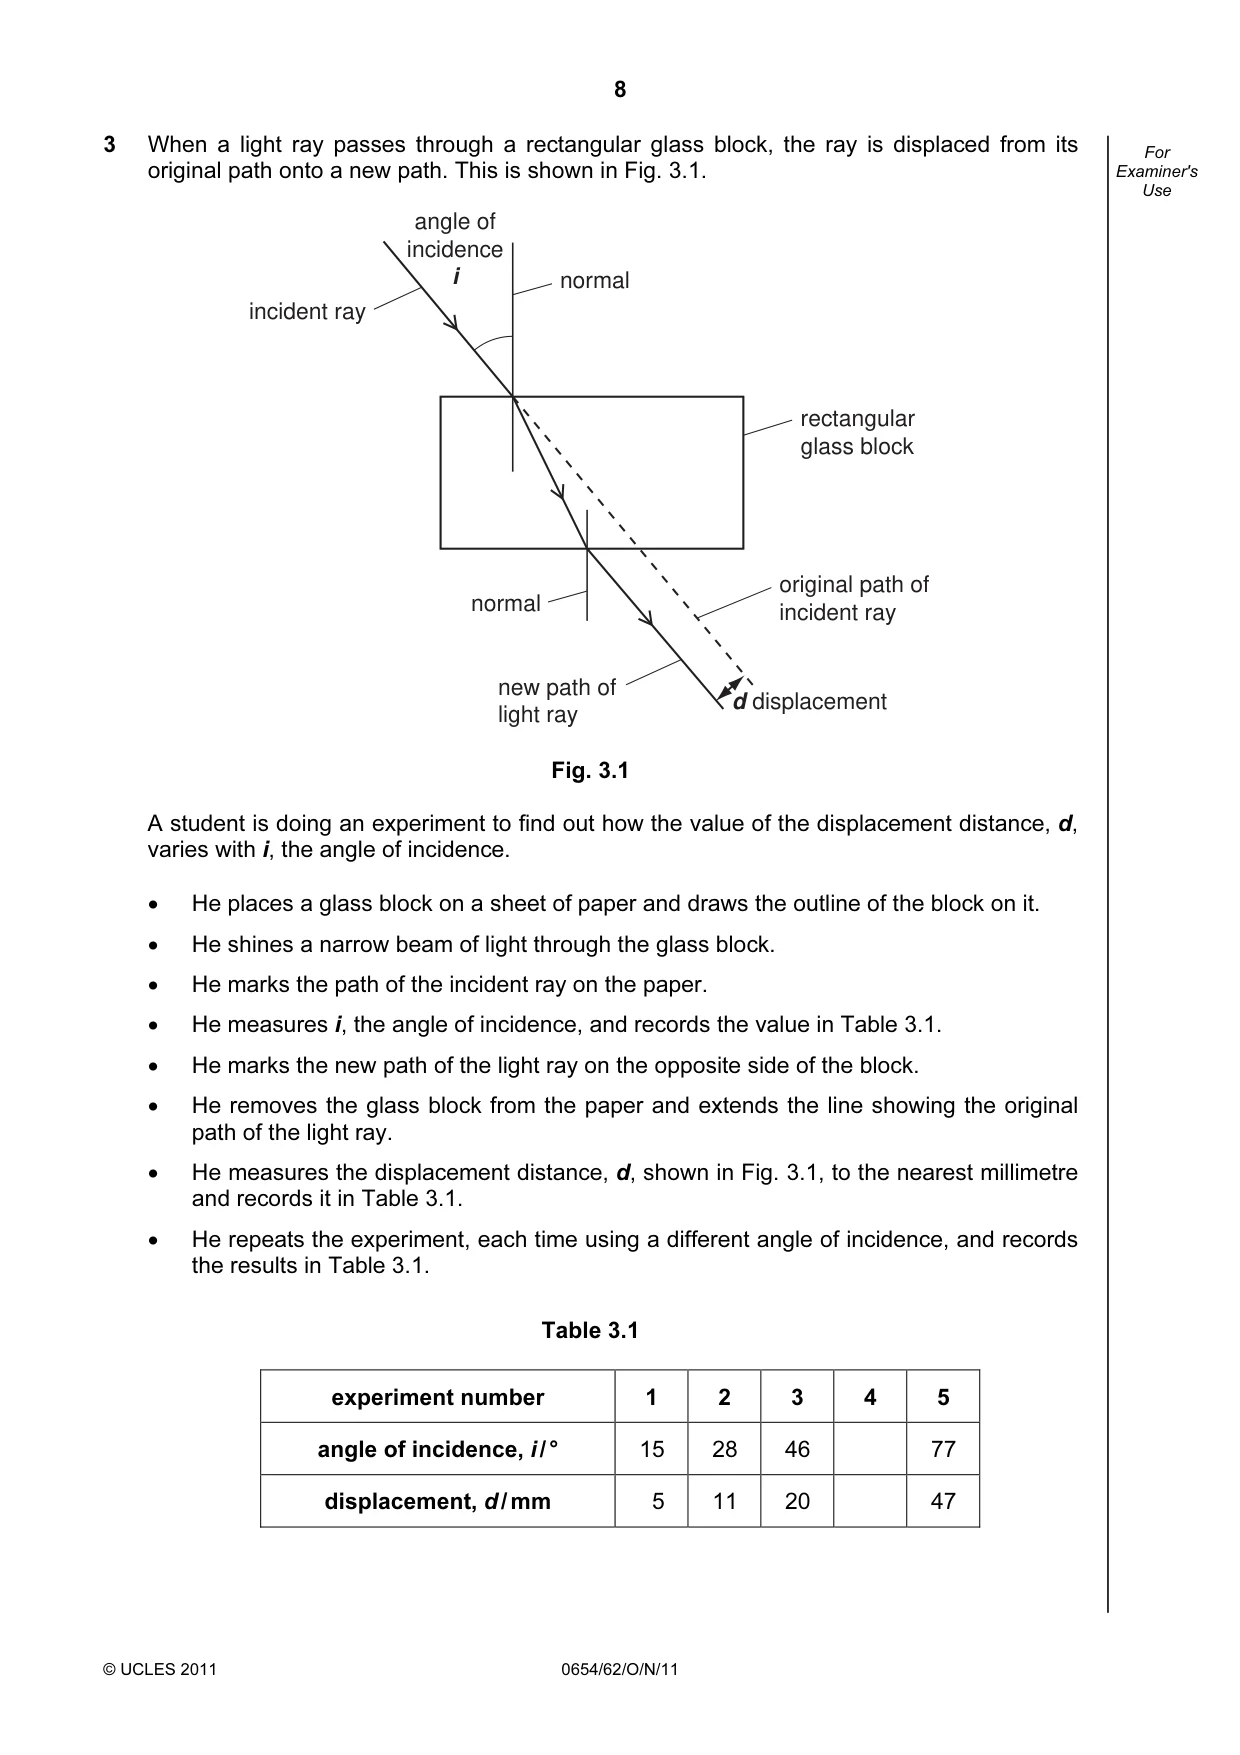
8 © UCLES 2011 0654/62/O/N/11 For Examiner's Use 3 When a light ray passes through a rectangular glass block, the ray is displaced from its original path onto a new path. This is shown in Fig. 3.1. normal normal incident ray angle of incidence i rectangular glass block original path of incident ray d displacement new path of light ray Fig. 3.1 A student is doing an experiment to find out how the value of the displacement distance, d, varies with i, the angle of incidence. • He places a glass block on a sheet of paper and draws the outline of the block on it. • He shines a narrow beam of light through the glass block. • He marks the path of the incident ray on the paper. • He measures i, the angle of incidence, and records the value in Table 3.1. • He marks the new path of the light ray on the opposite side of the block. • He removes the glass block from the paper and extends the line showing the original path of the light ray. • He measures the displacement distance, d, shown in Fig. 3.1, to the nearest millimetre and records it in Table 3.1. • He repeats the experiment, each time using a different angle of incidence, and records the results in Table 3.1. Table 3.1 experiment number 1 2 3 4 5 angle of incidence, i / ° 15 28 46 77 displacement, d / mm 5 11 20 47
Question paper, page 9
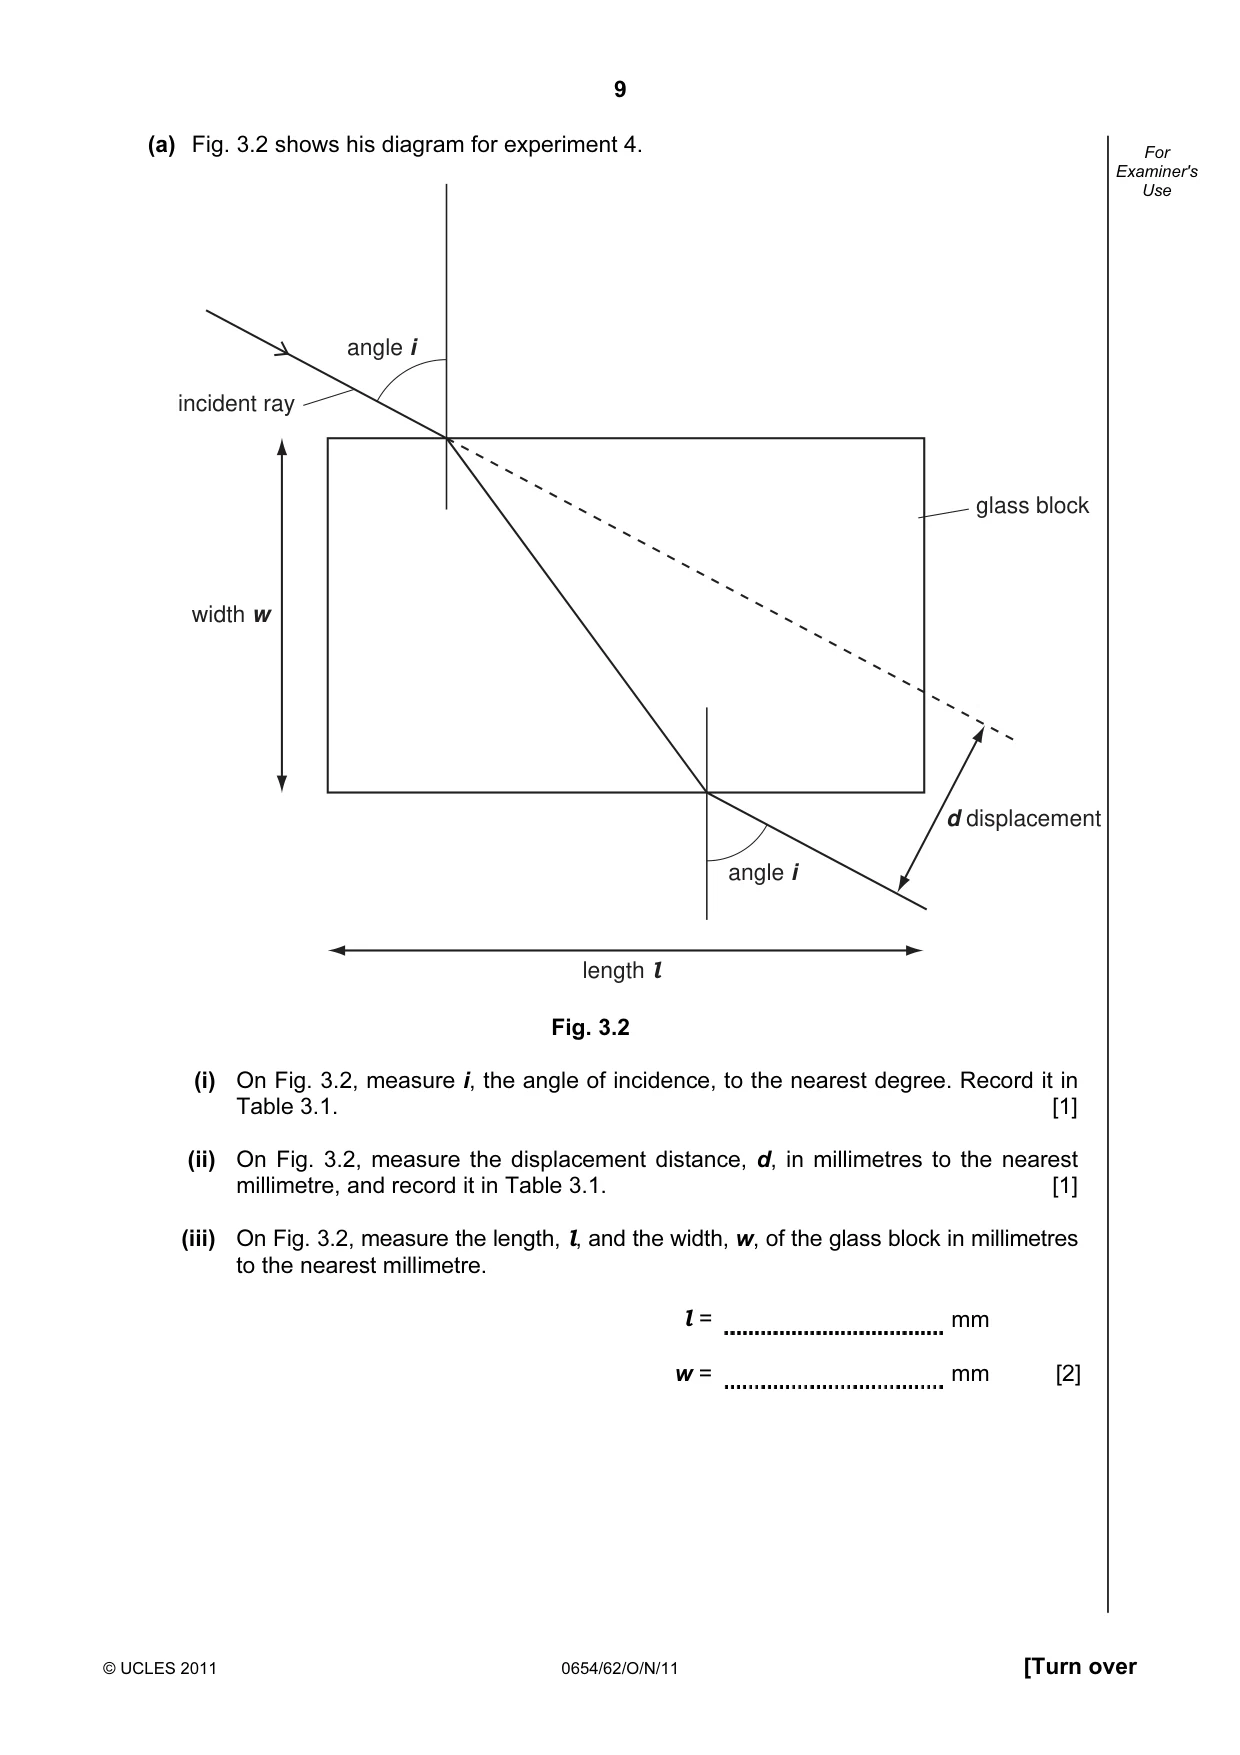
9 © UCLES 2011 0654/62/O/N/11 [Turn over For Examiner's Use (a) Fig. 3.2 shows his diagram for experiment 4. angle i angle i width w glass block d displacement length l incident ray Fig. 3.2 (i) On Fig. 3.2, measure i, the angle of incidence, to the nearest degree. Record it in Table 3.1. [1] (ii) On Fig. 3.2, measure the displacement distance, d, in millimetres to the nearest millimetre, and record it in Table 3.1. [1] (iii) On Fig. 3.2, measure the length, l, and the width, w, of the glass block in millimetres to the nearest millimetre. l = mm w = mm [2]
Question paper, page 10
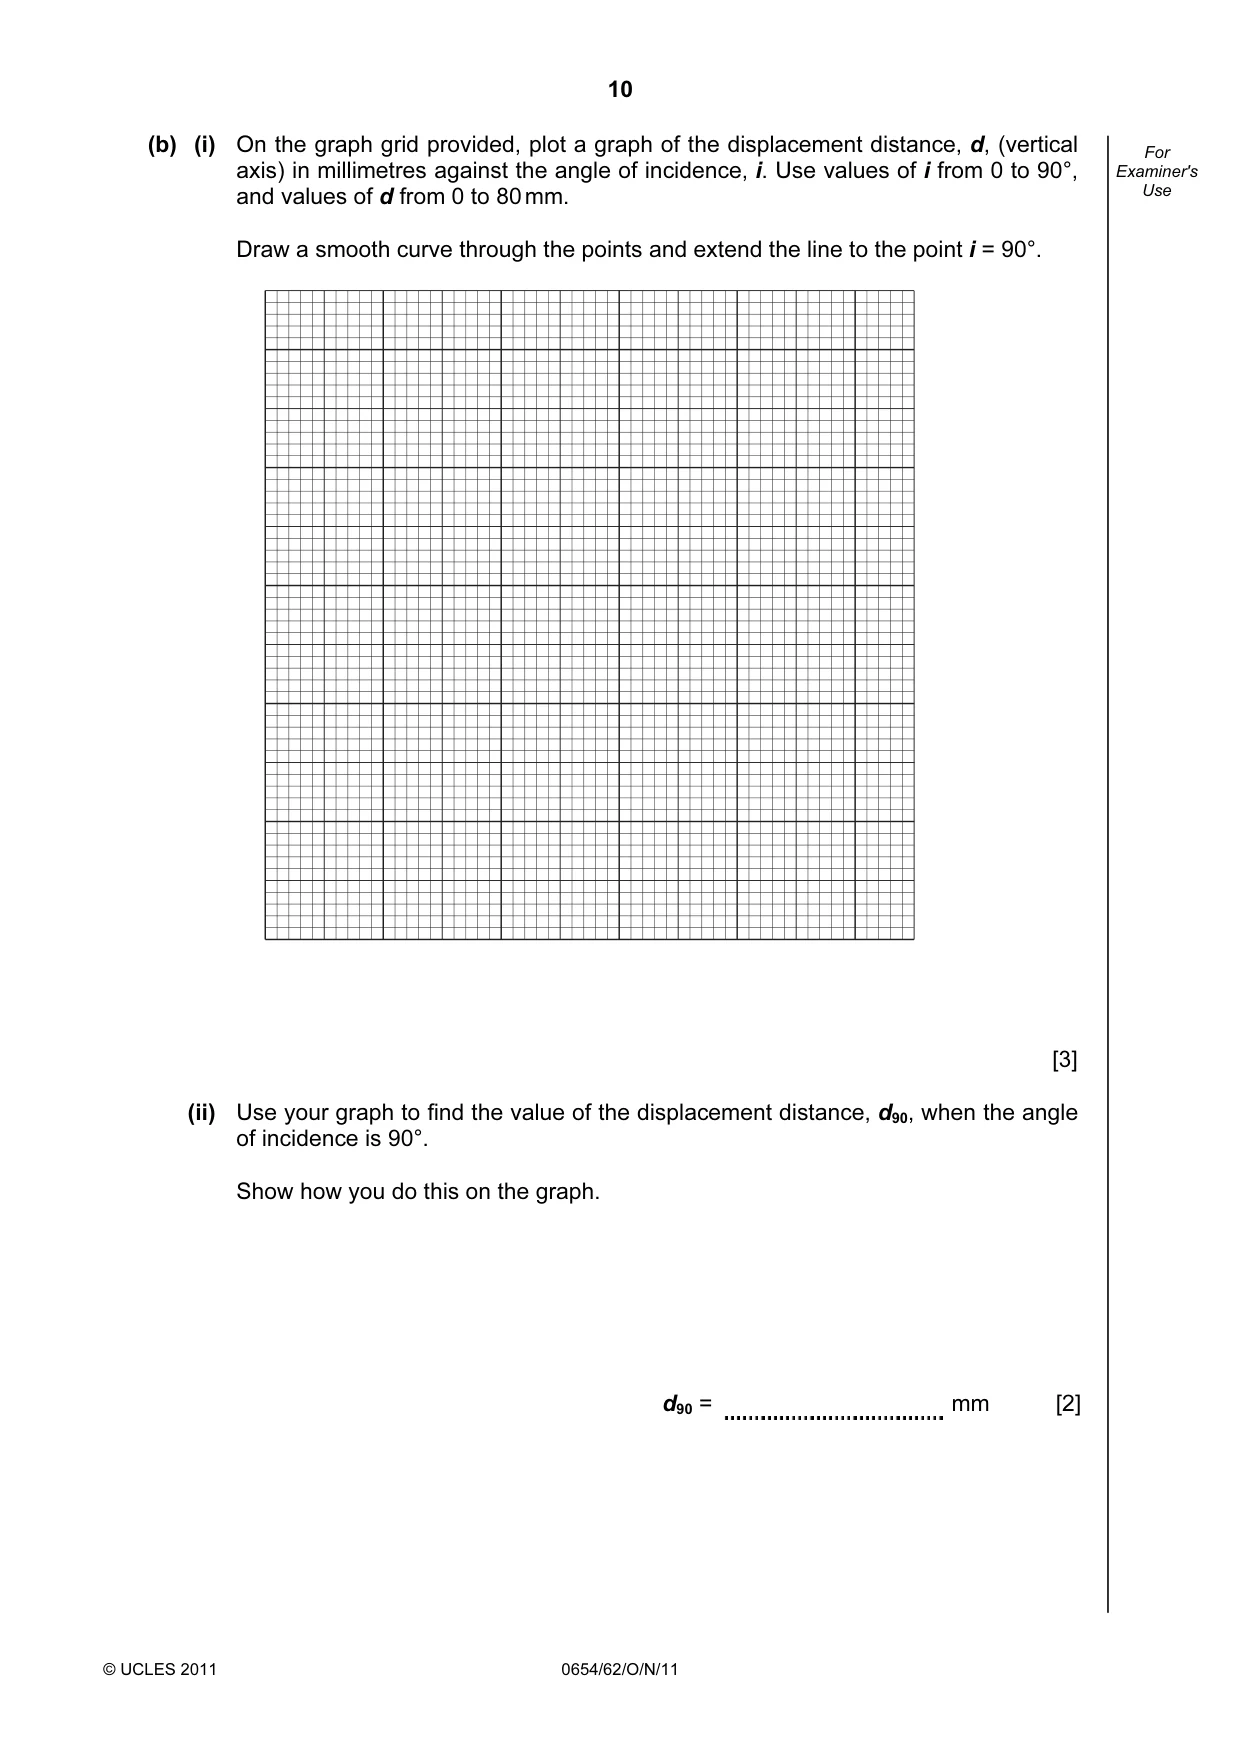
10 © UCLES 2011 0654/62/O/N/11 For Examiner's Use (b) (i) On the graph grid provided, plot a graph of the displacement distance, d, (vertical axis) in millimetres against the angle of incidence, i. Use values of i from 0 to 90°, and values of d from 0 to 80 mm. Draw a smooth curve through the points and extend the line to the point i = 90°. [3] (ii) Use your graph to find the value of the displacement distance, d90, when the angle of incidence is 90°. Show how you do this on the graph. d90 = mm [2]
Question paper, page 11
11 © UCLES 2011 0654/62/O/N/11 [Turn over For Examiner's Use (c) Compare your answers to parts (a)(iii) and (b)(ii). Complete this sentence. “In theory, if the angle of incidence of a light ray passing through a rectangular glass block is equal to 90 degrees, the displacement distance is equal to the of the block.” [1]
Question paper, page 12
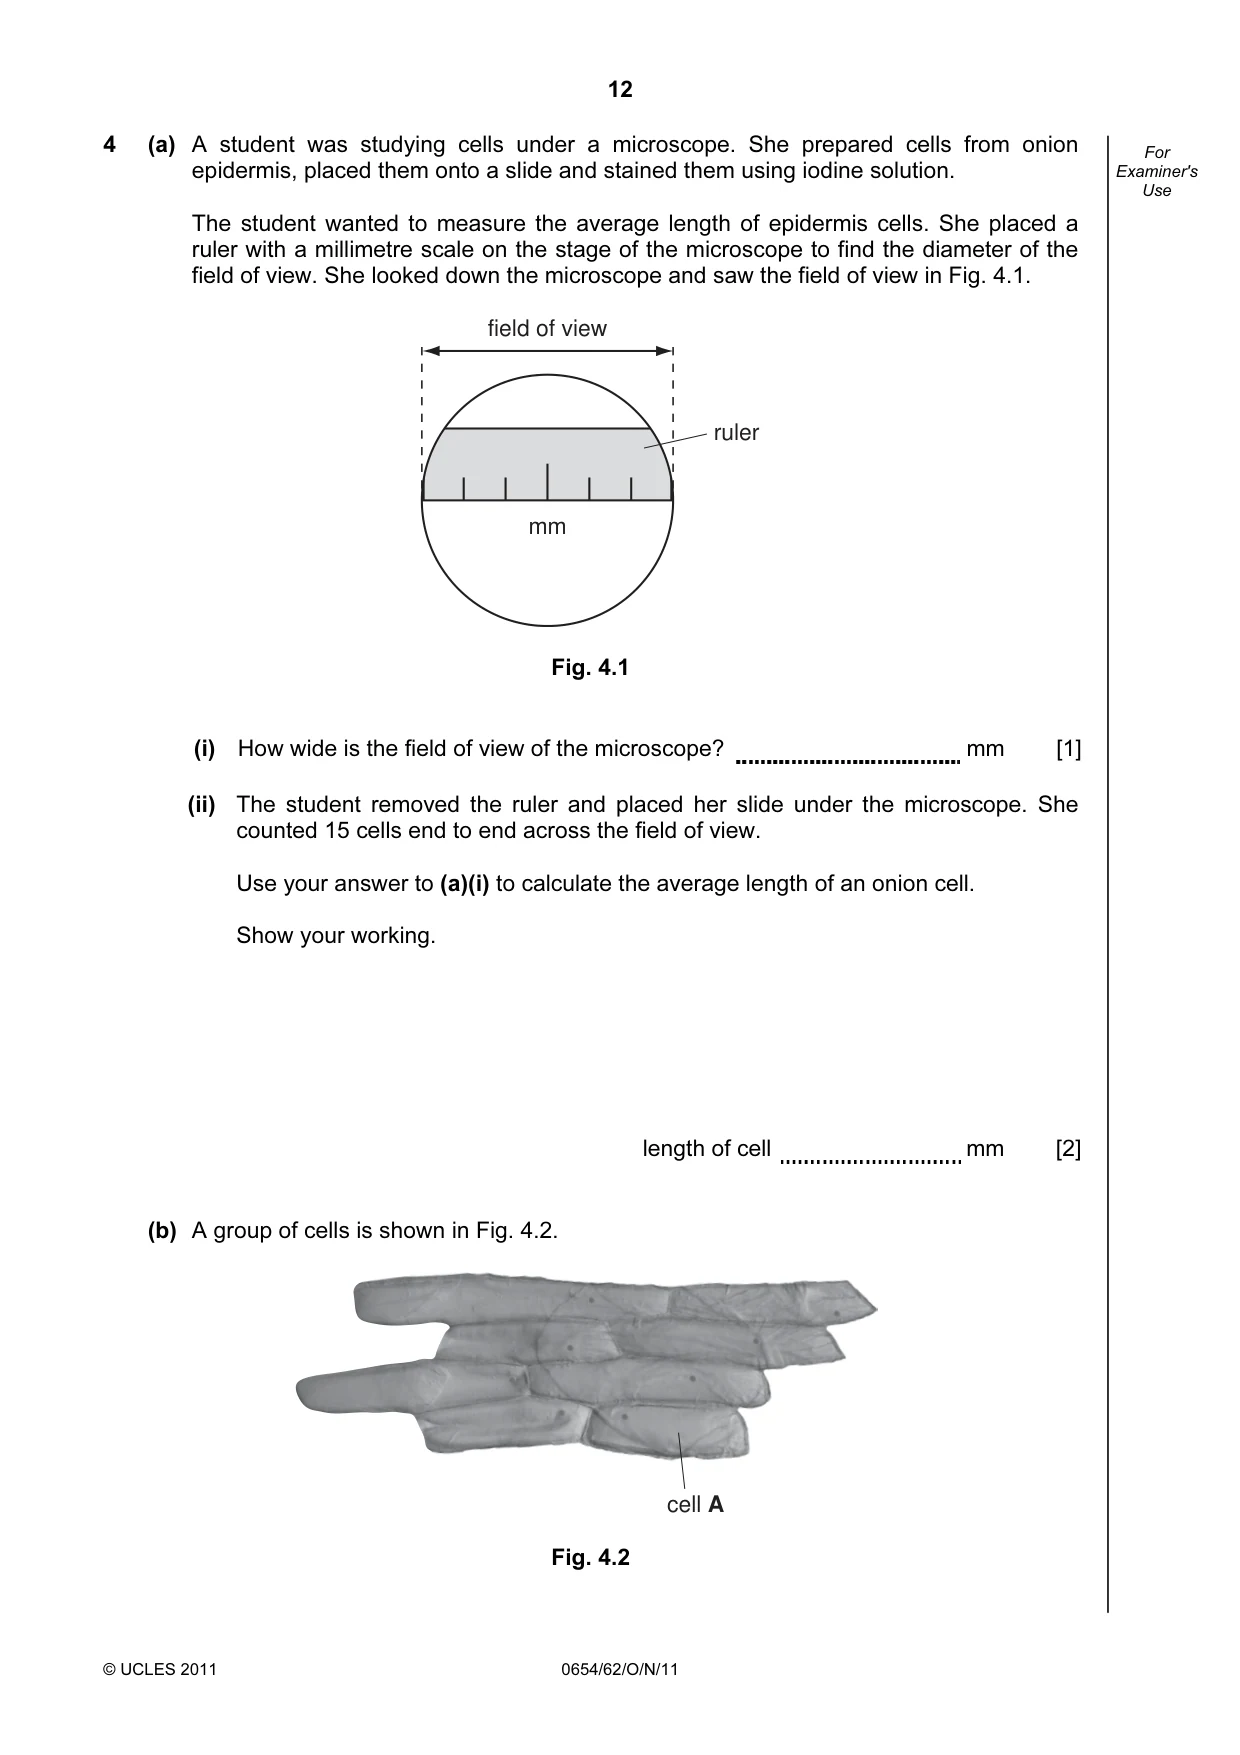
12 © UCLES 2011 0654/62/O/N/11 For Examiner's Use 4 (a) A student was studying cells under a microscope. She prepared cells from onion epidermis, placed them onto a slide and stained them using iodine solution. The student wanted to measure the average length of epidermis cells. She placed a ruler with a millimetre scale on the stage of the microscope to find the diameter of the field of view. She looked down the microscope and saw the field of view in Fig. 4.1. mm field of view ruler Fig. 4.1 (i) How wide is the field of view of the microscope? mm [1] (ii) The student removed the ruler and placed her slide under the microscope. She counted 15 cells end to end across the field of view. Use your answer to (a)(i) to calculate the average length of an onion cell. Show your working. length of cell mm [2] (b) A group of cells is shown in Fig. 4.2. cell A Fig. 4.2
Question paper, page 13
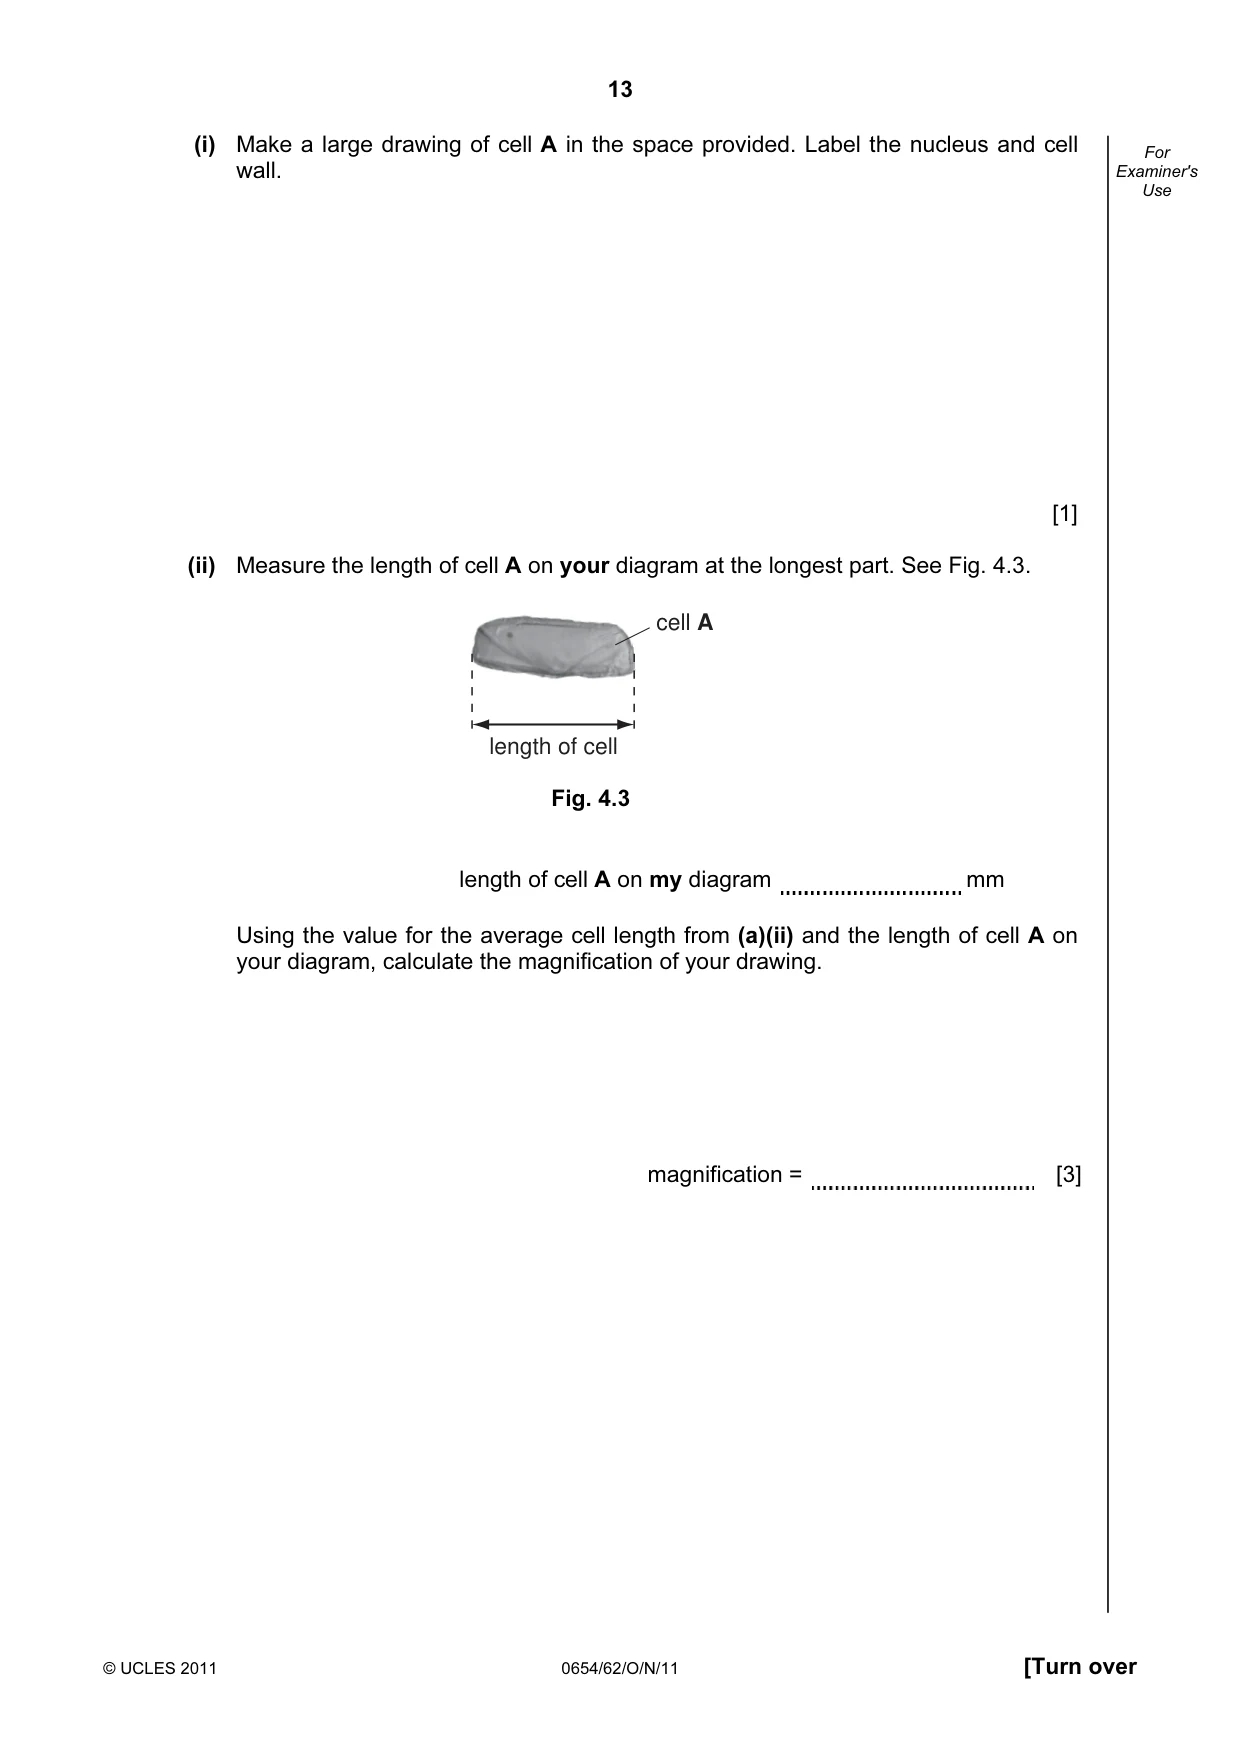
13 © UCLES 2011 0654/62/O/N/11 [Turn over For Examiner's Use (i) Make a large drawing of cell A in the space provided. Label the nucleus and cell wall. [1] (ii) Measure the length of cell A on your diagram at the longest part. See Fig. 4.3. length of cell cell A Fig. 4.3 length of cell A on my diagram mm Using the value for the average cell length from (a)(ii) and the length of cell A on your diagram, calculate the magnification of your drawing. magnification = [3]
Question paper, page 14
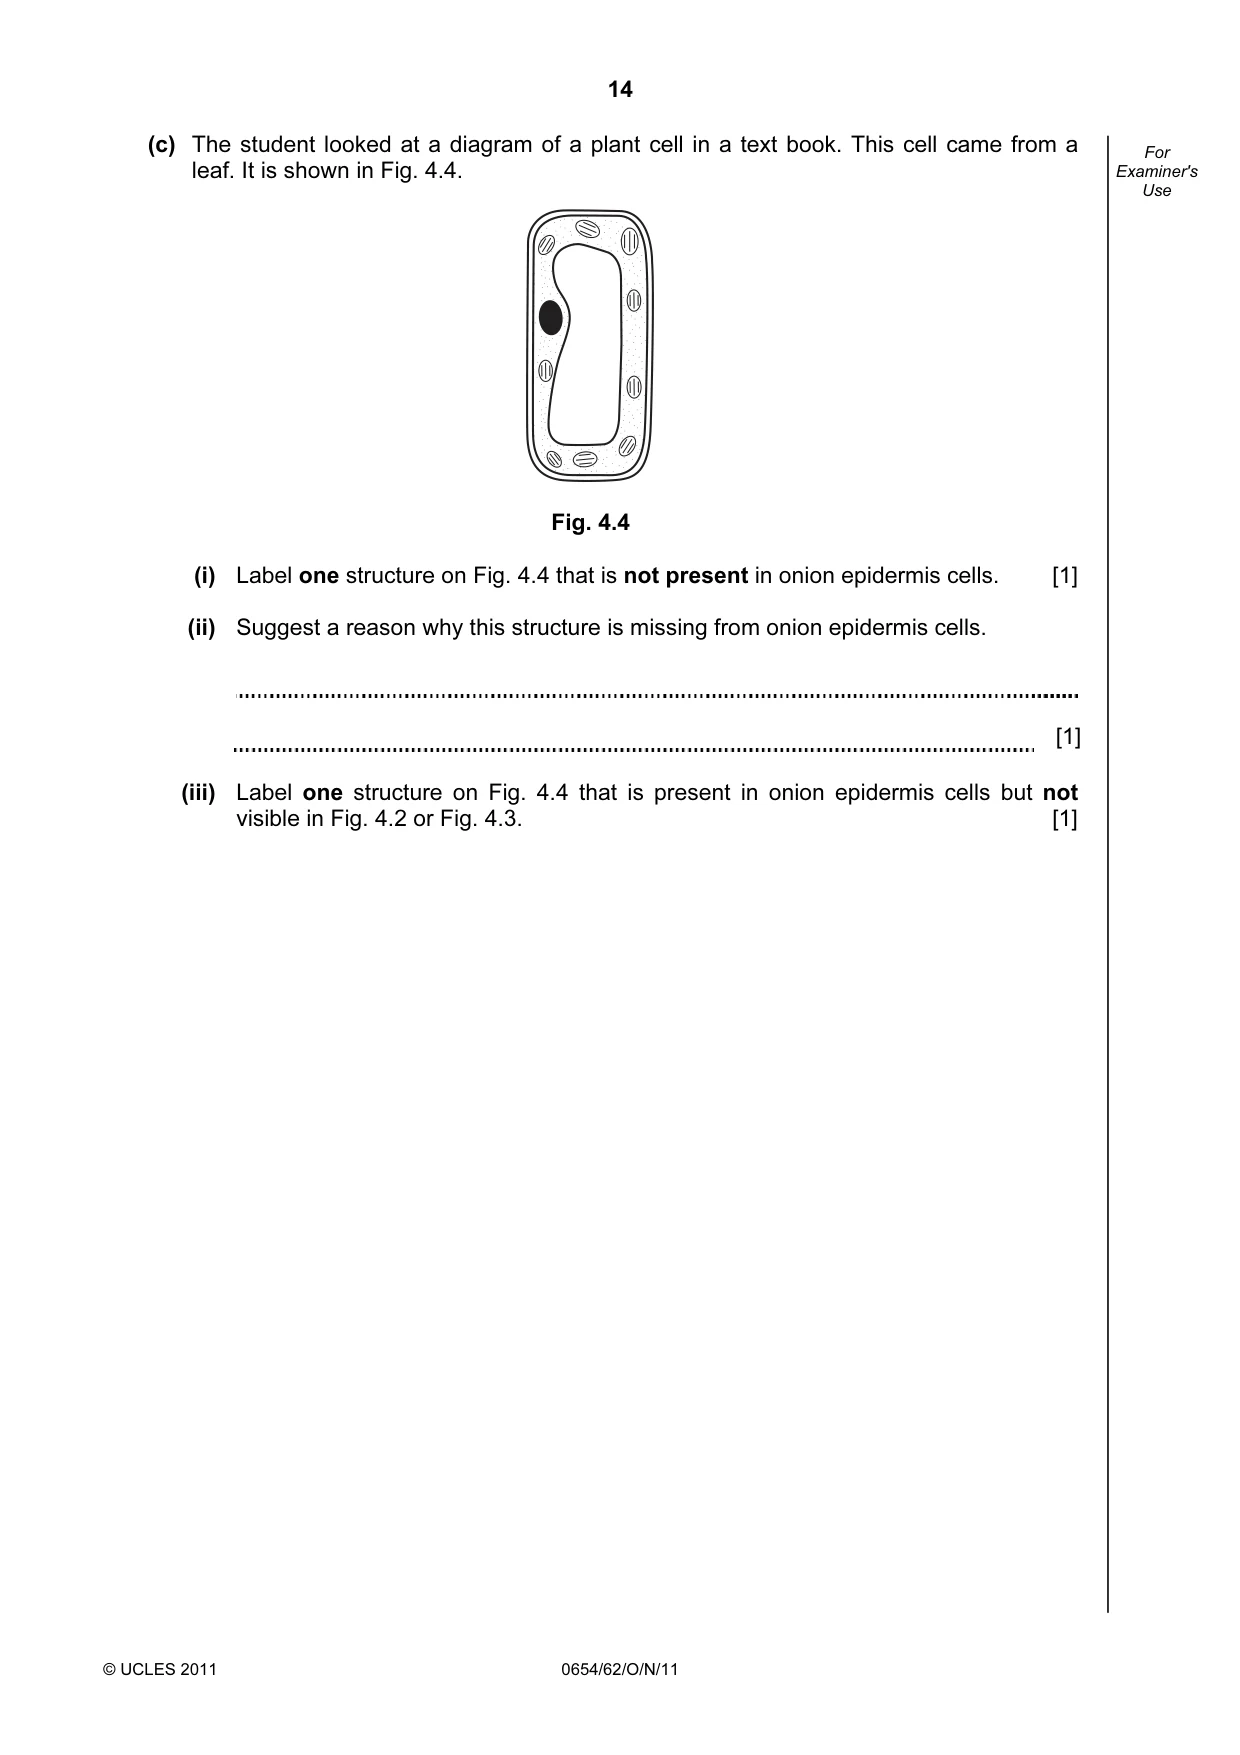
14 © UCLES 2011 0654/62/O/N/11 For Examiner's Use (c) The student looked at a diagram of a plant cell in a text book. This cell came from a leaf. It is shown in Fig. 4.4. Fig. 4.4 (i) Label one structure on Fig. 4.4 that is not present in onion epidermis cells. [1] (ii) Suggest a reason why this structure is missing from onion epidermis cells. [1] (iii) Label one structure on Fig. 4.4 that is present in onion epidermis cells but not visible in Fig. 4.2 or Fig. 4.3. [1]
Question paper, page 15
15 © UCLES 2011 0654/62/O/N/11 [Turn over BLANK PAGE Please turn over for Question 5.
Question paper, page 16
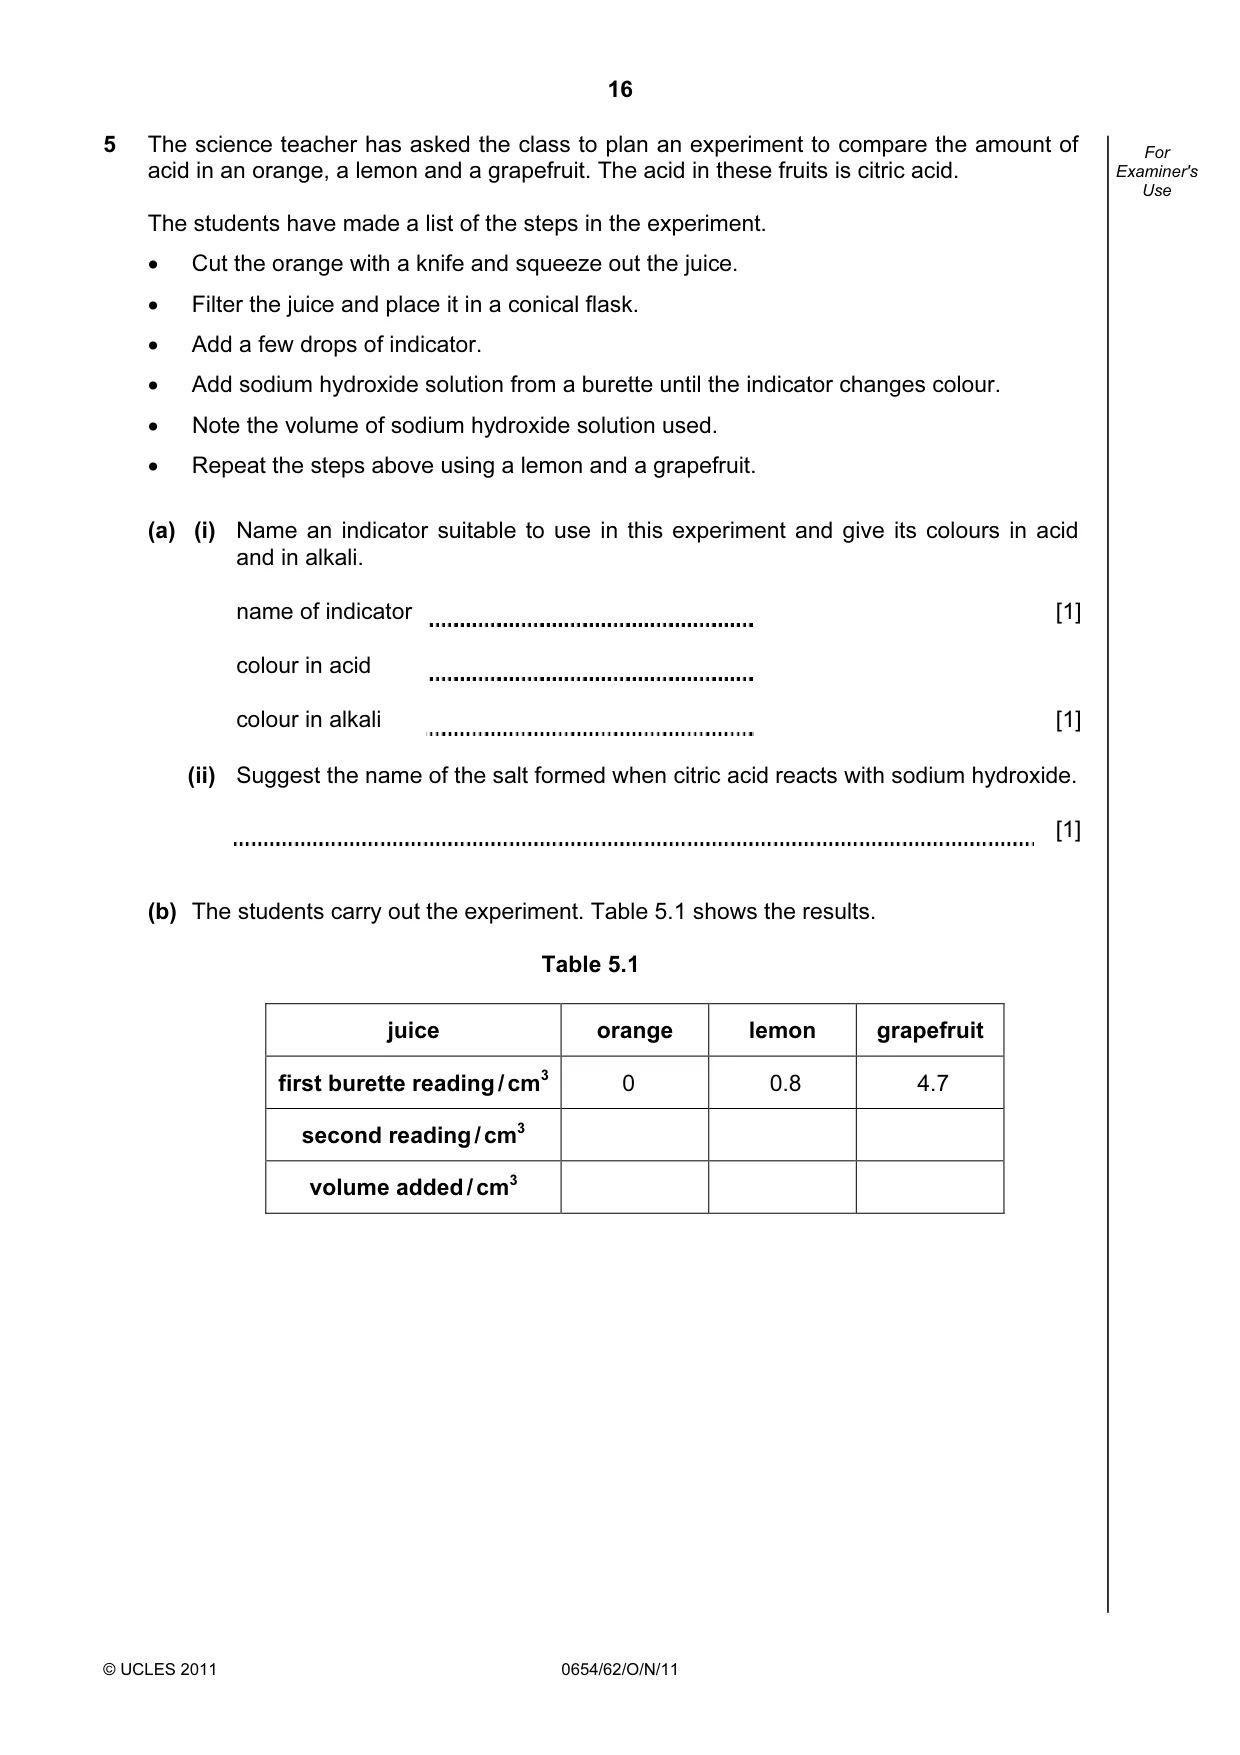
16 © UCLES 2011 0654/62/O/N/11 For Examiner's Use 5 The science teacher has asked the class to plan an experiment to compare the amount of acid in an orange, a lemon and a grapefruit. The acid in these fruits is citric acid. The students have made a list of the steps in the experiment. • Cut the orange with a knife and squeeze out the juice. • Filter the juice and place it in a conical flask. • Add a few drops of indicator. • Add sodium hydroxide solution from a burette until the indicator changes colour. • Note the volume of sodium hydroxide solution used. • Repeat the steps above using a lemon and a grapefruit. (a) (i) Name an indicator suitable to use in this experiment and give its colours in acid and in alkali. name of indicator [1] colour in acid colour in alkali [1] (ii) Suggest the name of the salt formed when citric acid reacts with sodium hydroxide. [1] (b) The students carry out the experiment. Table 5.1 shows the results. Table 5.1 juice orange lemon grapefruit first burette reading / cm3 0 0.8 4.7 second reading / cm3 volume added / cm3
Question paper, page 17
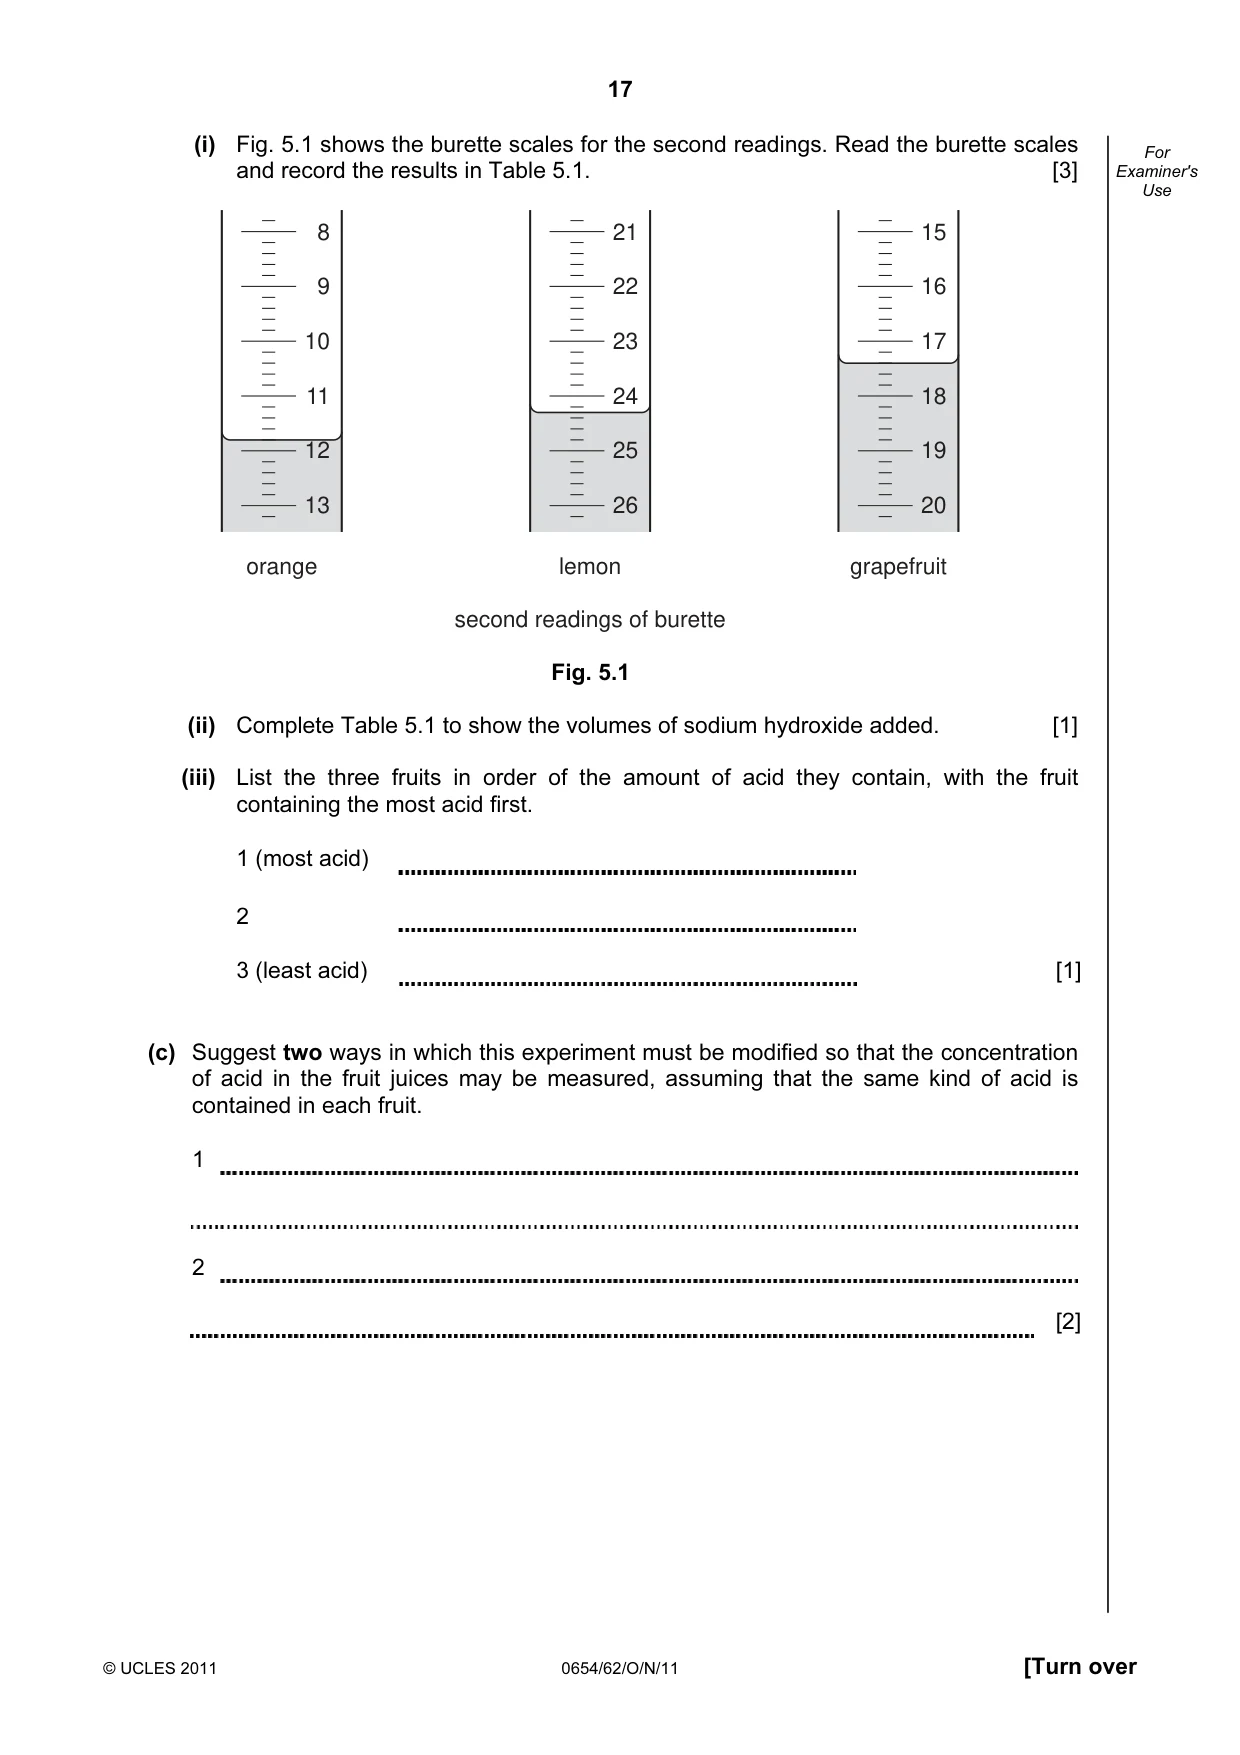
17 © UCLES 2011 0654/62/O/N/11 [Turn over For Examiner's Use (i) Fig. 5.1 shows the burette scales for the second readings. Read the burette scales and record the results in Table 5.1. [3] 8 9 10 11 12 13 orange 21 22 23 24 25 26 lemon second readings of burette 15 16 17 18 19 20 grapefruit Fig. 5.1 (ii) Complete Table 5.1 to show the volumes of sodium hydroxide added. [1] (iii) List the three fruits in order of the amount of acid they contain, with the fruit containing the most acid first. 1 (most acid) 2 3 (least acid) [1] (c) Suggest two ways in which this experiment must be modified so that the concentration of acid in the fruit juices may be measured, assuming that the same kind of acid is contained in each fruit. 1 2 [2]
Question paper, page 18
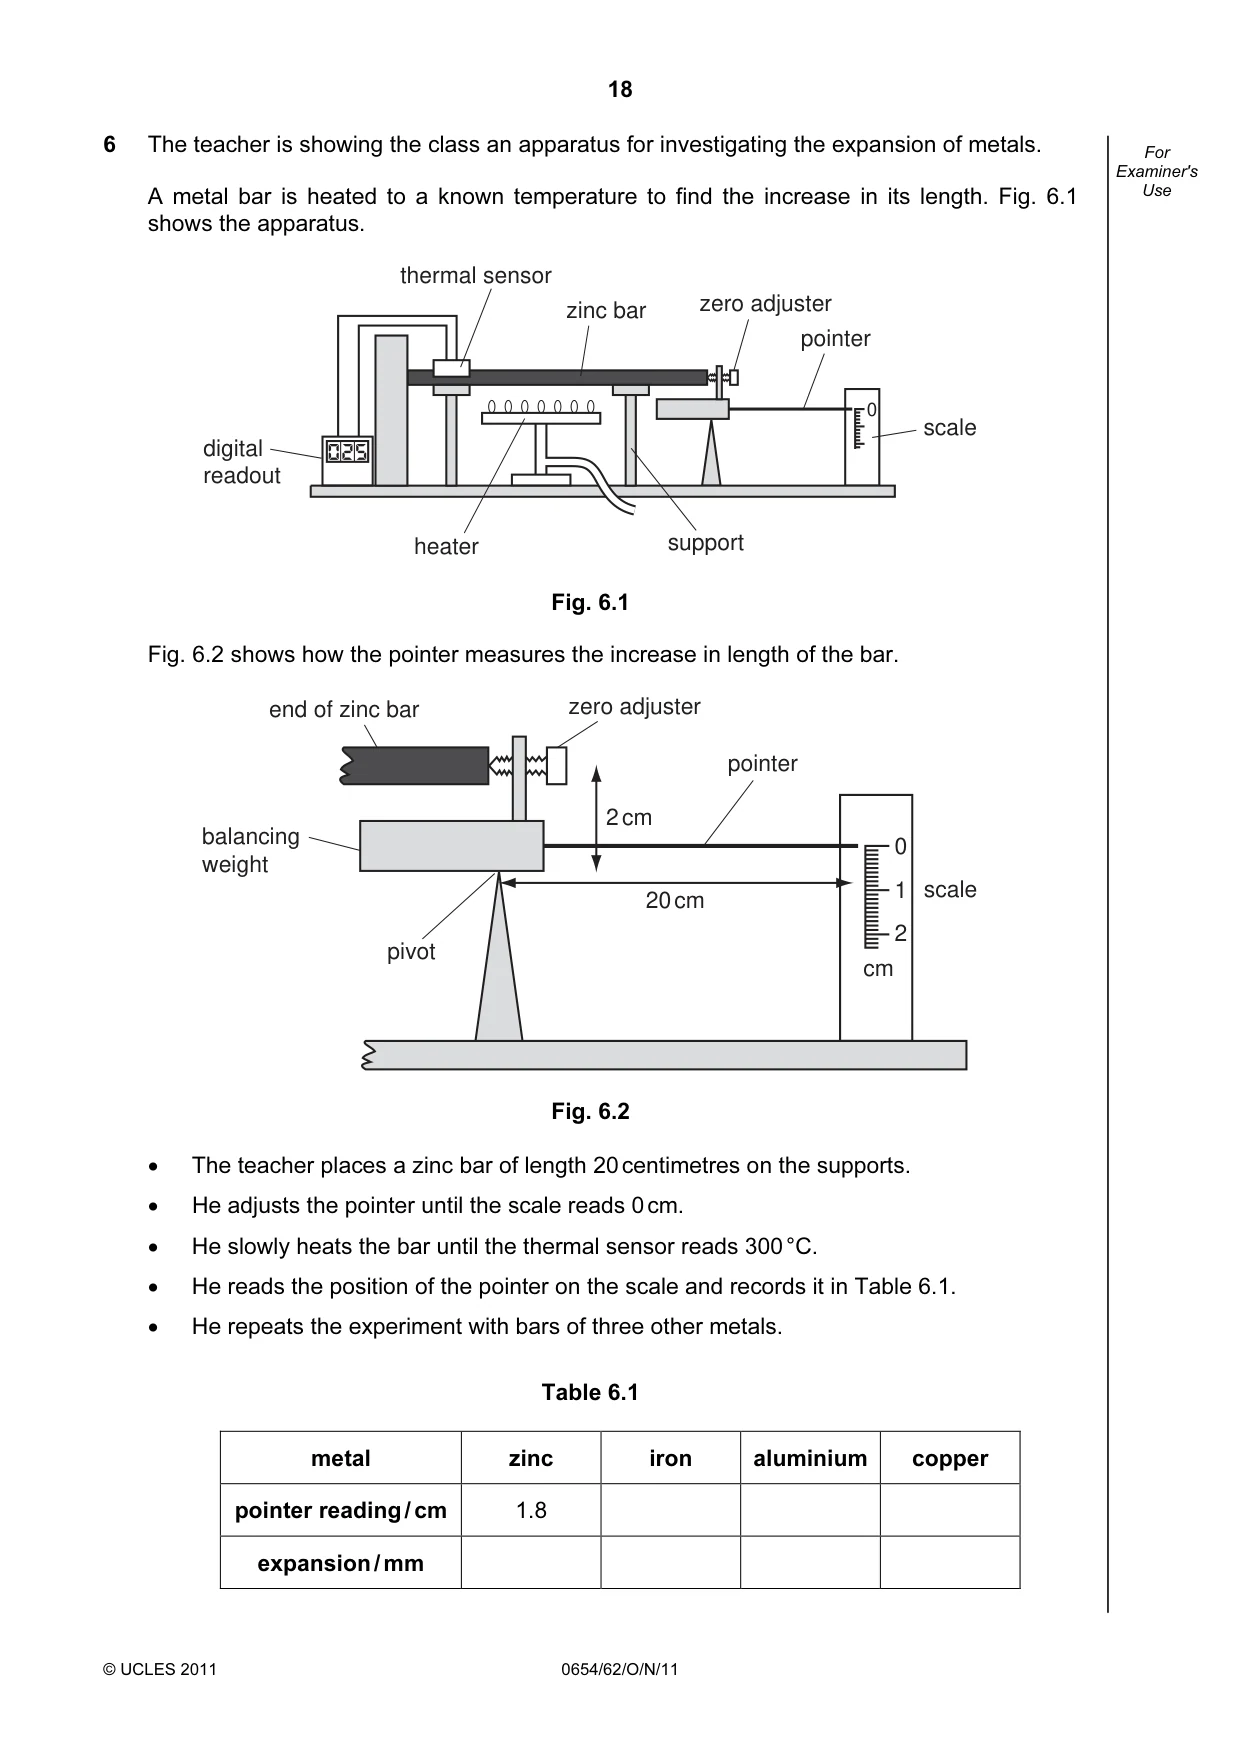
18 © UCLES 2011 0654/62/O/N/11 For Examiner's Use 6 The teacher is showing the class an apparatus for investigating the expansion of metals. A metal bar is heated to a known temperature to find the increase in its length. Fig. 6.1 shows the apparatus. 0 thermal sensor digital readout heater support zero adjuster pointer scale zinc bar Fig. 6.1 Fig. 6.2 shows how the pointer measures the increase in length of the bar. 0 1 2 cm scale 20 cm 2 cm pointer zero adjuster pivot balancing weight end of zinc bar Fig. 6.2 • The teacher places a zinc bar of length 20 centimetres on the supports. • He adjusts the pointer until the scale reads 0 cm. • He slowly heats the bar until the thermal sensor reads 300 °C. • He reads the position of the pointer on the scale and records it in Table 6.1. • He repeats the experiment with bars of three other metals. Table 6.1 metal zinc iron aluminium copper pointer reading / cm 1.8 expansion / mm
Question paper, page 19
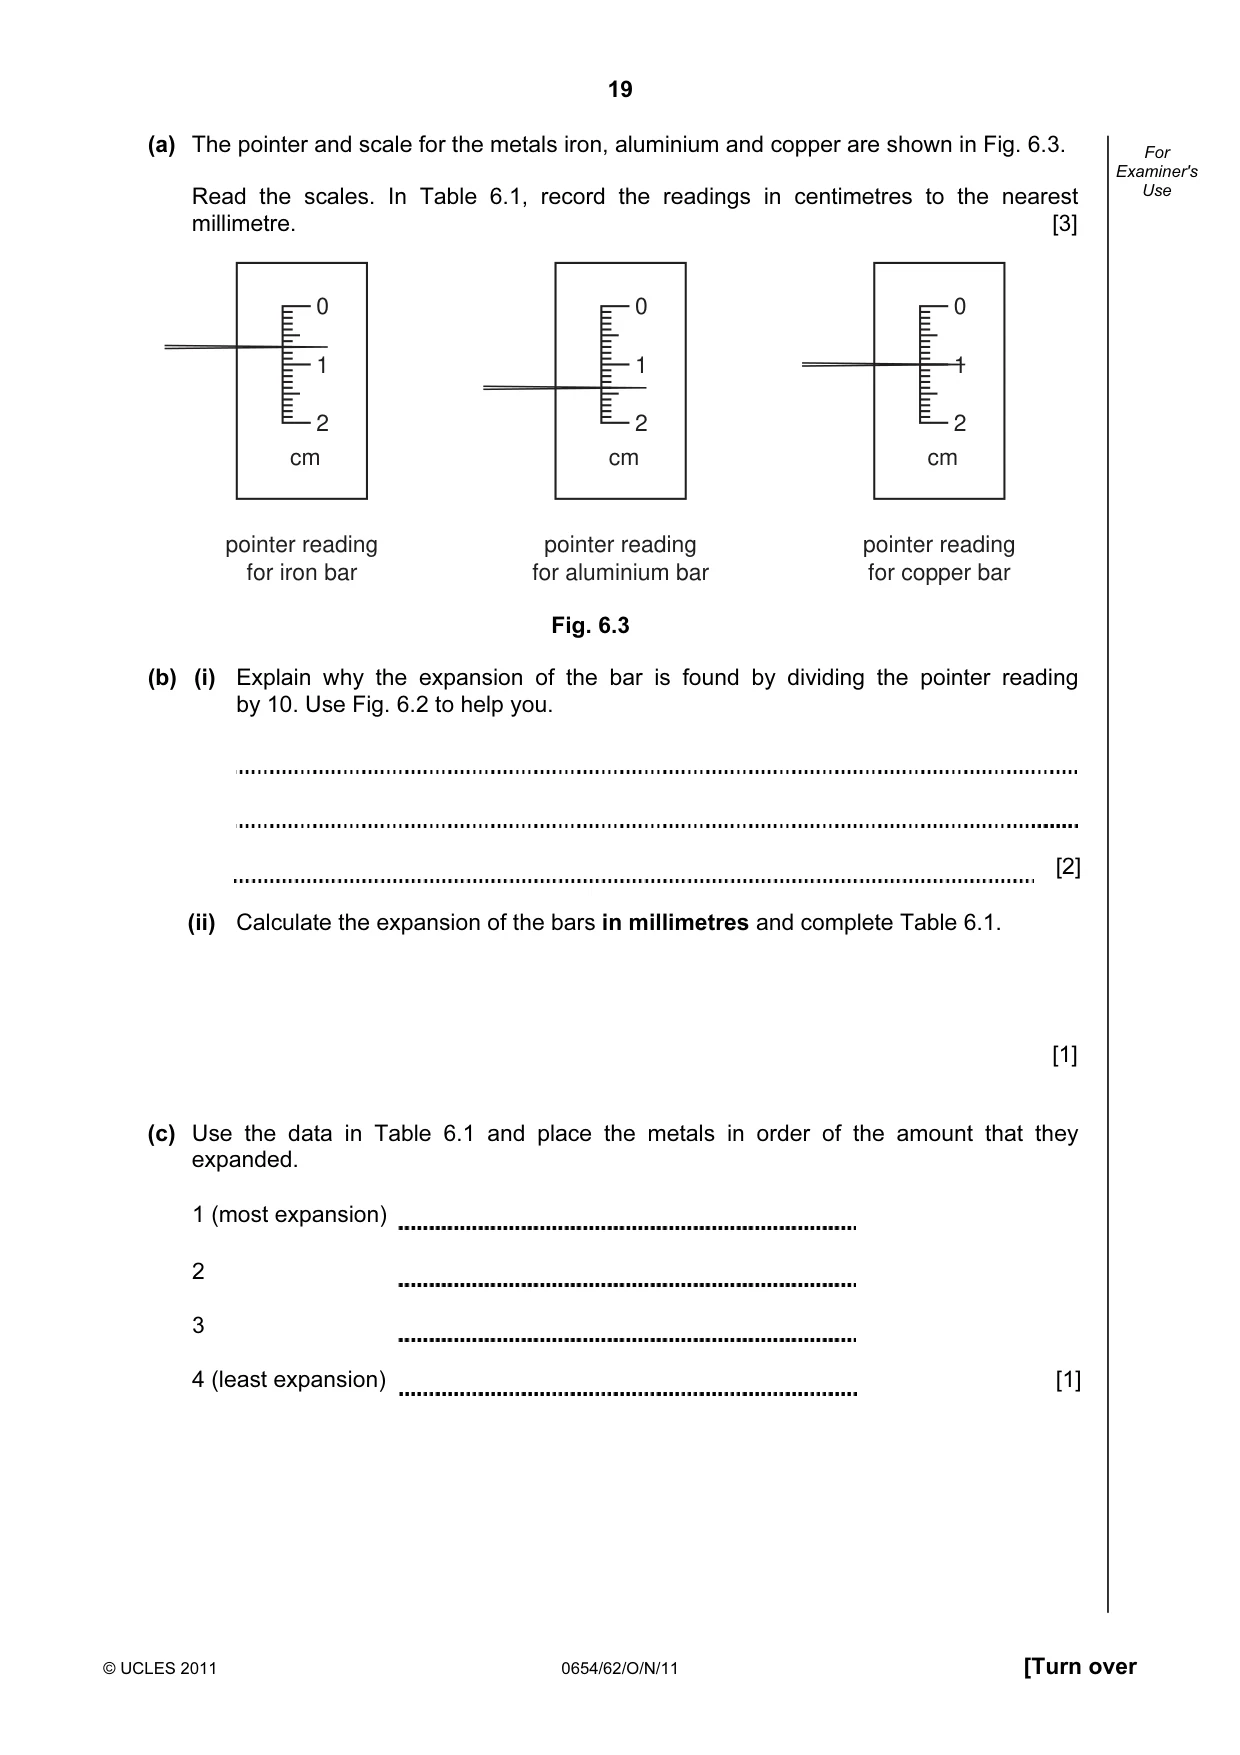
19 © UCLES 2011 0654/62/O/N/11 [Turn over For Examiner's Use (a) The pointer and scale for the metals iron, aluminium and copper are shown in Fig. 6.3. Read the scales. In Table 6.1, record the readings in centimetres to the nearest millimetre. [3] 0 1 2 cm pointer reading for iron bar 0 1 2 cm pointer reading for aluminium bar 0 1 2 cm pointer reading for copper bar Fig. 6.3 (b) (i) Explain why the expansion of the bar is found by dividing the pointer reading by 10. Use Fig. 6.2 to help you. [2] (ii) Calculate the expansion of the bars in millimetres and complete Table 6.1. [1] (c) Use the data in Table 6.1 and place the metals in order of the amount that they expanded. 1 (most expansion) 2 3 4 (least expansion) [1]
Question paper, page 20
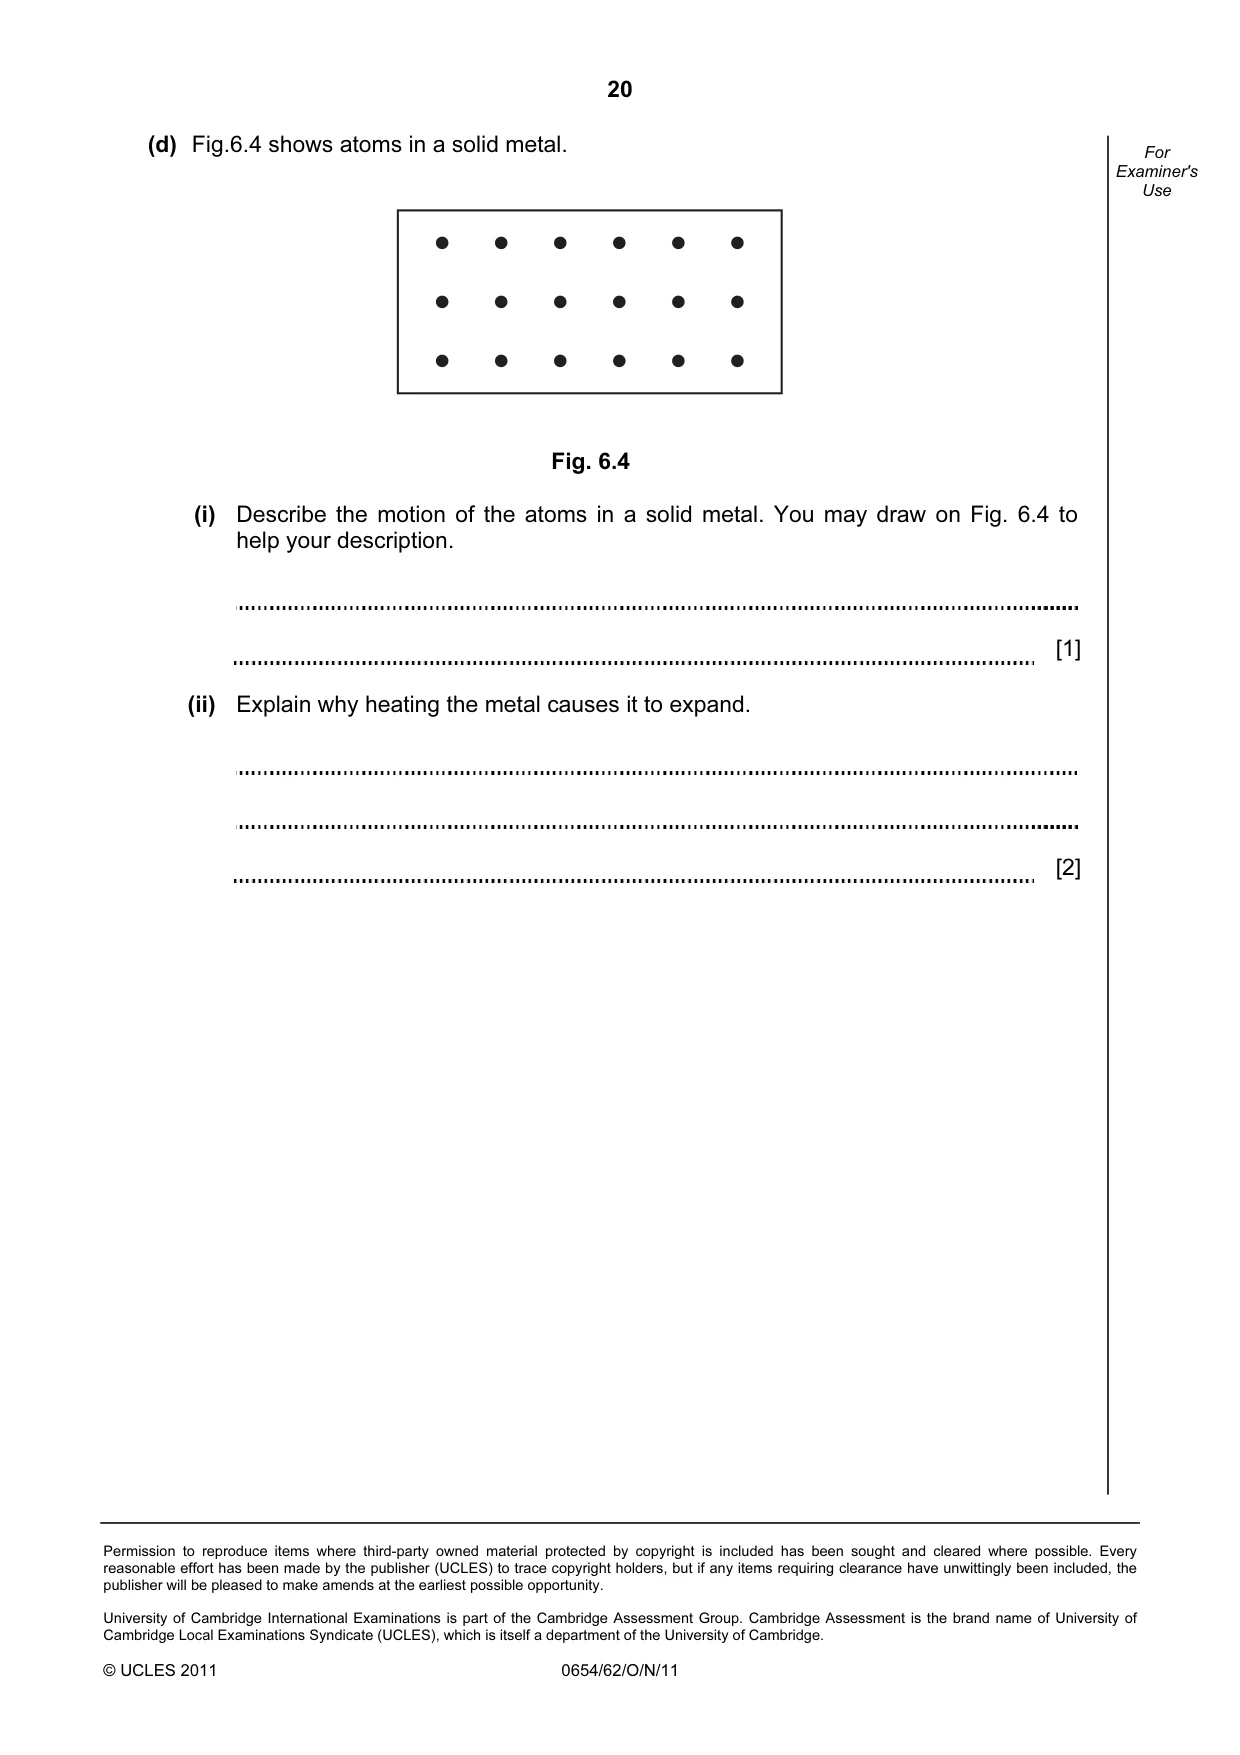
20 Permission to reproduce items where third-party owned material protected by copyright is included has been sought and cleared where possible. Every reasonable effort has been made by the publisher (UCLES) to trace copyright holders, but if any items requiring clearance have unwittingly been included, the publisher will be pleased to make amends at the earliest possible opportunity. University of Cambridge International Examinations is part of the Cambridge Assessment Group. Cambridge Assessment is the brand name of University of Cambridge Local Examinations Syndicate (UCLES), which is itself a department of the University of Cambridge. © UCLES 2011 0654/62/O/N/11 For Examiner's Use (d) Fig.6.4 shows atoms in a solid metal. Fig. 6.4 (i) Describe the motion of the atoms in a solid metal. You may draw on Fig. 6.4 to help your description. [1] (ii) Explain why heating the metal causes it to expand. [2]
Mark scheme, page 1
UNIVERSITY OF CAMBRIDGE INTERNATIONAL EXAMINATIONS International General Certificate of Secondary Education MARK SCHEME for the October/November 2011 question paper for the guidance of teachers 0654 CO-ORDINATED SCIENCES 0654/62 Paper 6 (Alternative to Practical), maximum raw mark 60 This mark scheme is published as an aid to teachers and candidates, to indicate the requirements of the examination. It shows the basis on which Examiners were instructed to award marks. It does not indicate the details of the discussions that took place at an Examiners’ meeting before marking began, which would have considered the acceptability of alternative answers. Mark schemes must be read in conjunction with the question papers and the report on the examination. • Cambridge will not enter into discussions or correspondence in connection with these mark schemes. Cambridge is publishing the mark schemes for the October/November 2011 question papers for most IGCSE, GCE Advanced Level and Advanced Subsidiary Level syllabuses and some Ordinary Level syllabuses. www.XtremePapers.com
Mark scheme, page 2
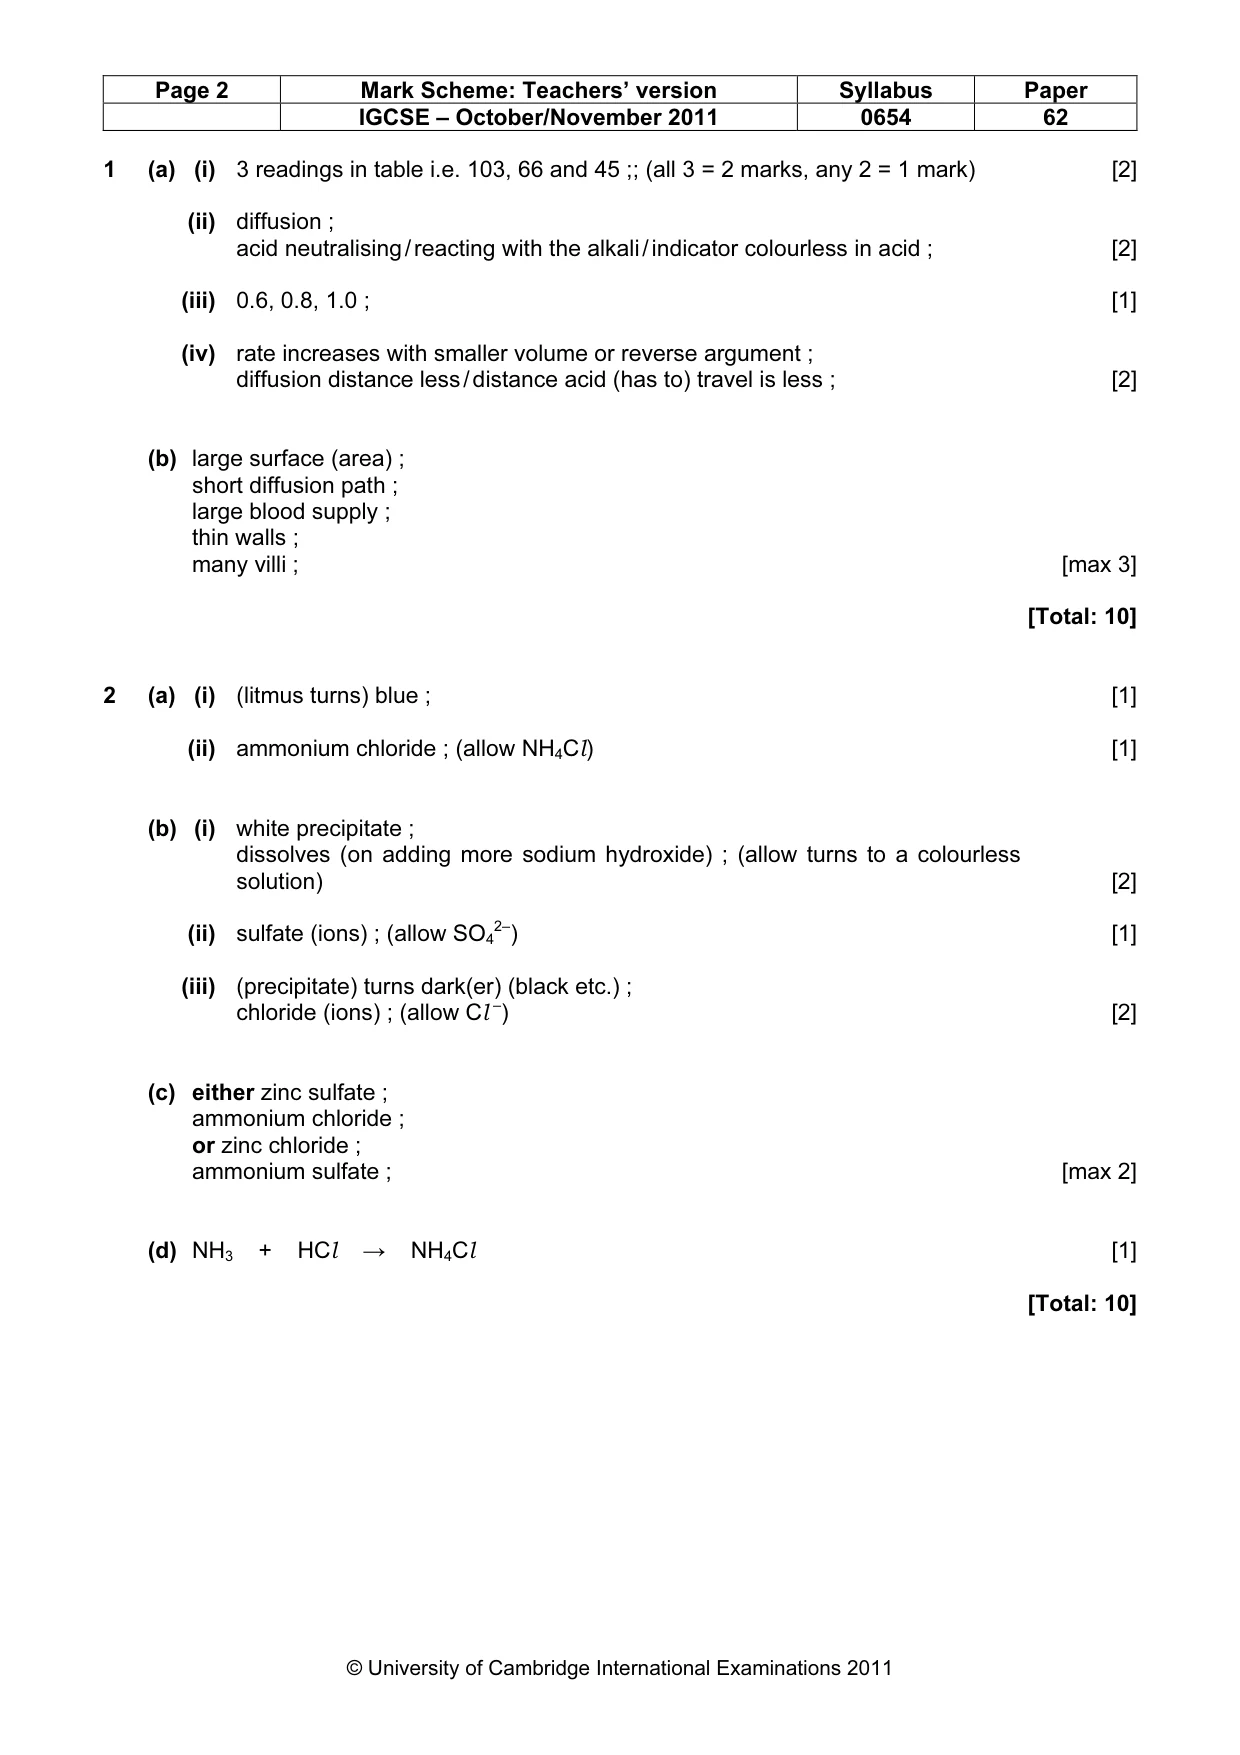
Page 2 Mark Scheme: Teachers’ version Syllabus Paper IGCSE – October/November 2011 0654 62 © University of Cambridge International Examinations 2011 1 (a) (i) 3 readings in table i.e. 103, 66 and 45 ;; (all 3 = 2 marks, any 2 = 1 mark) [2] (ii) diffusion ; acid neutralising / reacting with the alkali / indicator colourless in acid ; [2] (iii) 0.6, 0.8, 1.0 ; [1] (iv) rate increases with smaller volume or reverse argument ; diffusion distance less / distance acid (has to) travel is less ; [2] (b) large surface (area) ; short diffusion path ; large blood supply ; thin walls ; many villi ; [max 3] [Total: 10] 2 (a) (i) (litmus turns) blue ; [1] (ii) ammonium chloride ; (allow NH4Cl) [1] (b) (i) white precipitate ; dissolves (on adding more sodium hydroxide) ; (allow turns to a colourless solution) [2] (ii) sulfate (ions) ; (allow SO4 2–) [1] (iii) (precipitate) turns dark(er) (black etc.) ; chloride (ions) ; (allow Cl –) [2] (c) either zinc sulfate ; ammonium chloride ; or zinc chloride ; ammonium sulfate ; [max 2] (d) NH3 + HCl → NH4Cl [1] [Total: 10]
Mark scheme, page 3
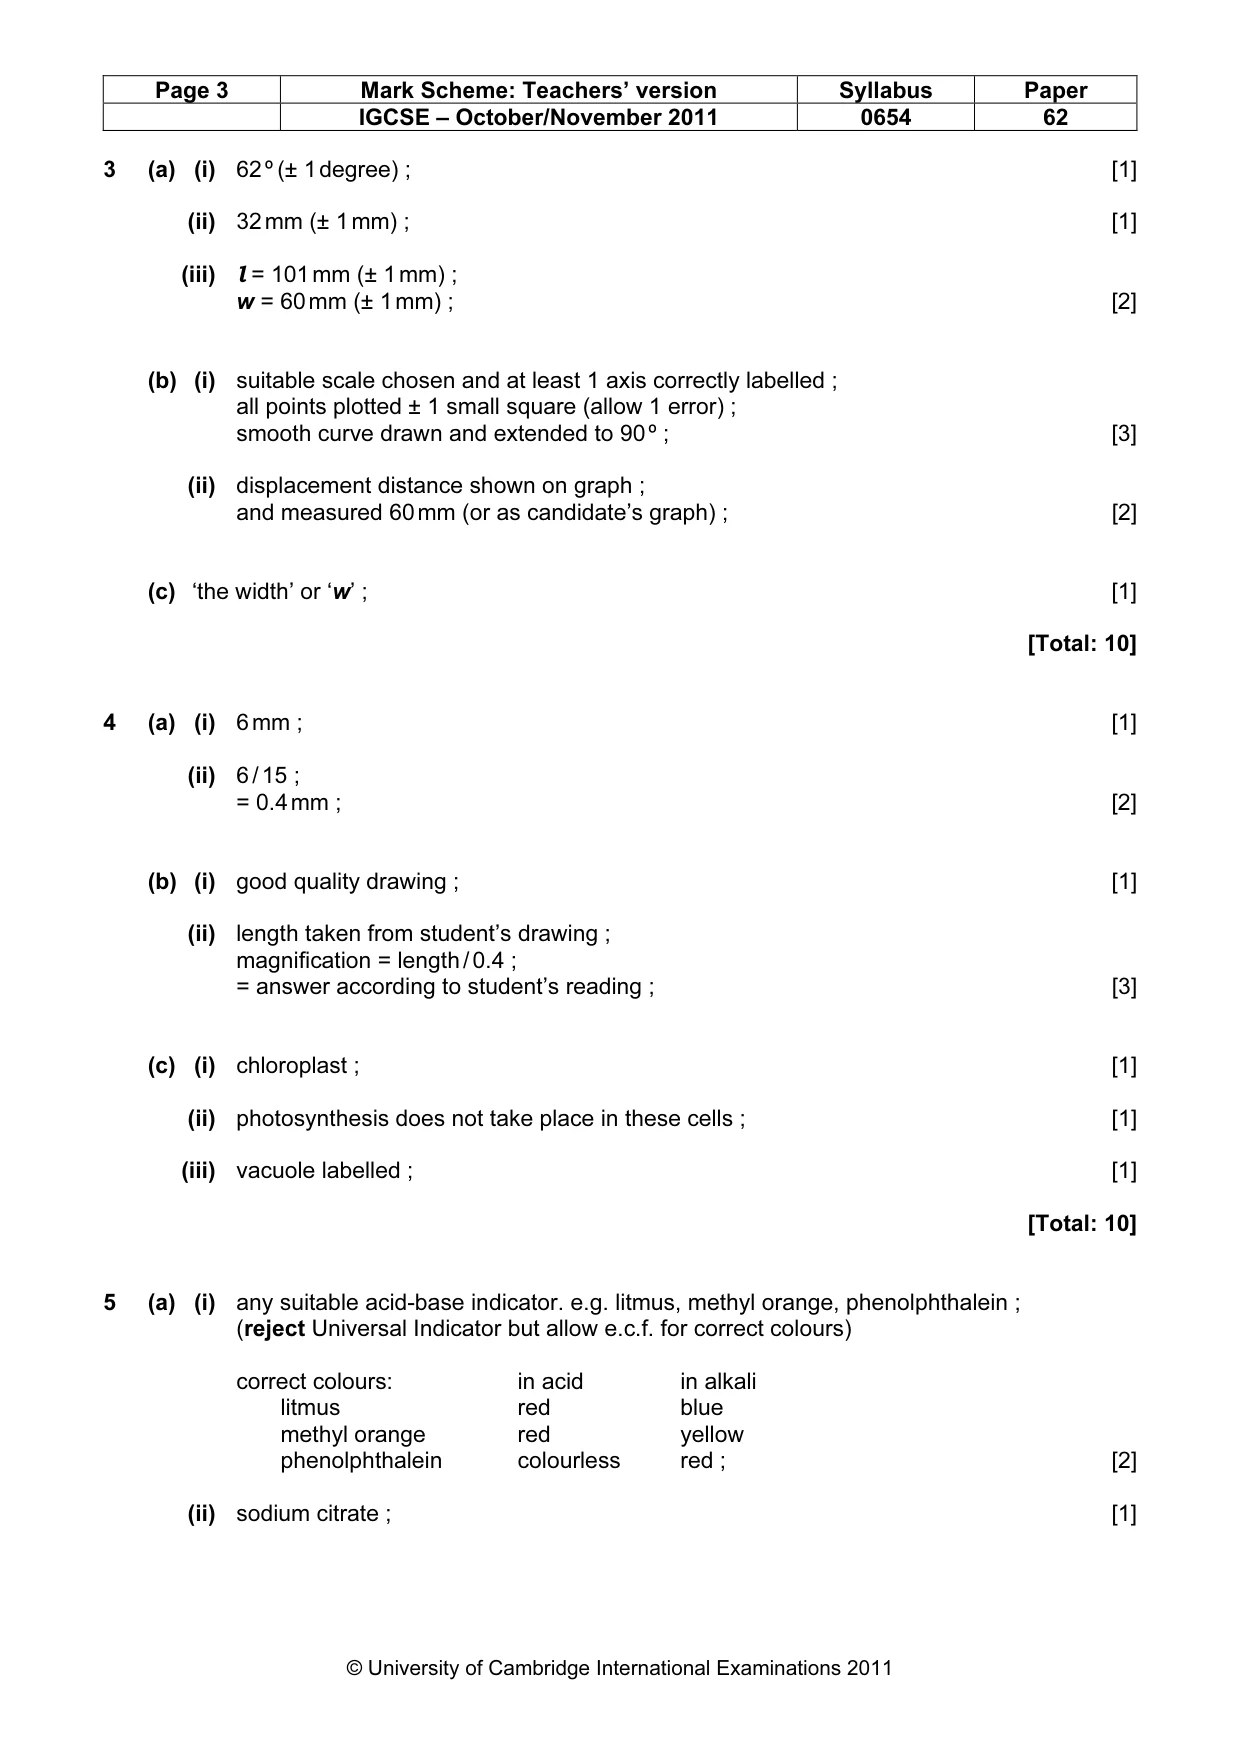
Page 3 Mark Scheme: Teachers’ version Syllabus Paper IGCSE – October/November 2011 0654 62 © University of Cambridge International Examinations 2011 3 (a) (i) 62 º (± 1 degree) ; [1] (ii) 32 mm (± 1 mm) ; [1] (iii) l = 101 mm (± 1 mm) ; w = 60 mm (± 1 mm) ; [2] (b) (i) suitable scale chosen and at least 1 axis correctly labelled ; all points plotted ± 1 small square (allow 1 error) ; smooth curve drawn and extended to 90 º ; [3] (ii) displacement distance shown on graph ; and measured 60 mm (or as candidate’s graph) ; [2] (c) ‘the width’ or ‘w’ ; [1] [Total: 10] 4 (a) (i) 6 mm ; [1] (ii) 6 / 15 ; = 0.4 mm ; [2] (b) (i) good quality drawing ; [1] (ii) length taken from student’s drawing ; magnification = length / 0.4 ; = answer according to student’s reading ; [3] (c) (i) chloroplast ; [1] (ii) photosynthesis does not take place in these cells ; [1] (iii) vacuole labelled ; [1] [Total: 10] 5 (a) (i) any suitable acid-base indicator. e.g. litmus, methyl orange, phenolphthalein ; (reject Universal Indicator but allow e.c.f. for correct colours) correct colours: in acid in alkali litmus red blue methyl orange red yellow phenolphthalein colourless red ; [2] (ii) sodium citrate ; [1]
Mark scheme, page 4
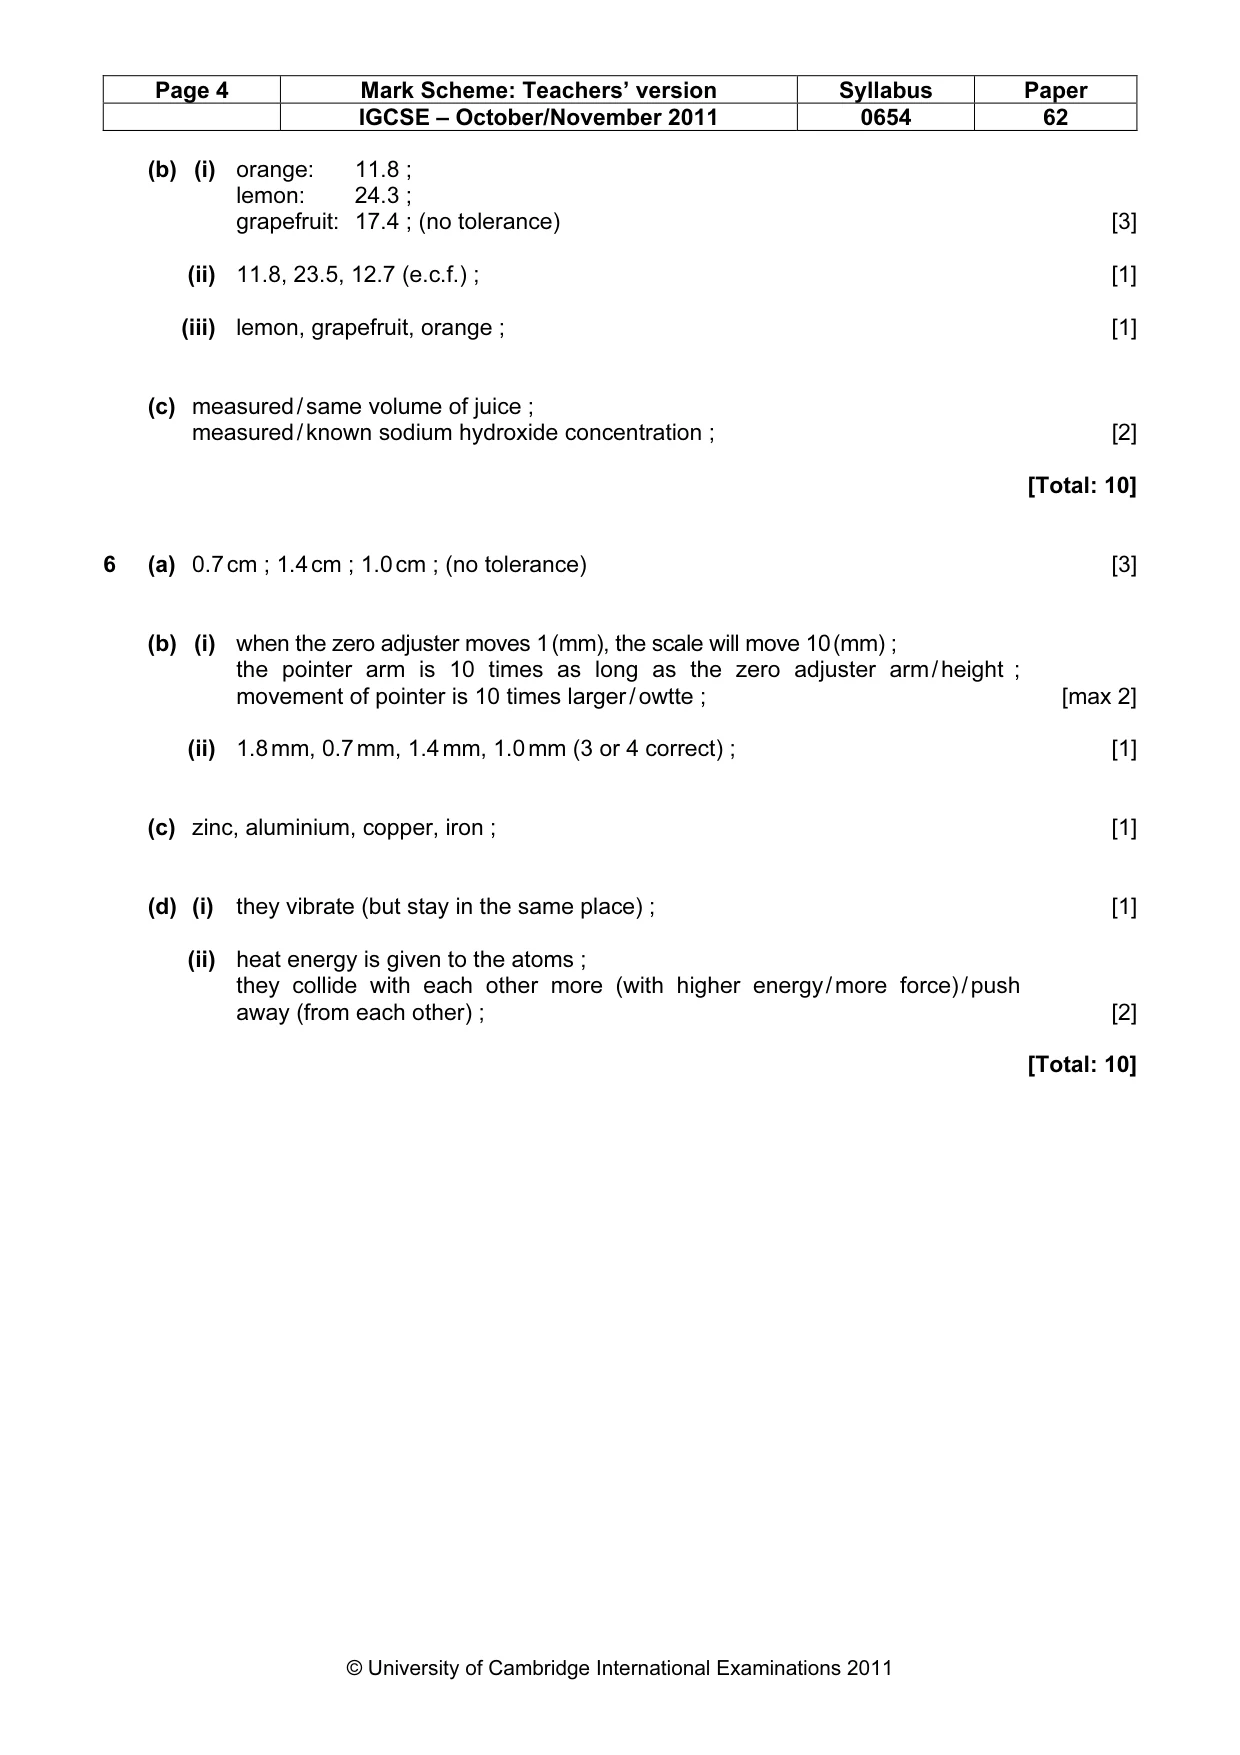
Page 4 Mark Scheme: Teachers’ version Syllabus Paper IGCSE – October/November 2011 0654 62 © University of Cambridge International Examinations 2011 (b) (i) orange: 11.8 ; lemon: 24.3 ; grapefruit: 17.4 ; (no tolerance) [3] (ii) 11.8, 23.5, 12.7 (e.c.f.) ; [1] (iii) lemon, grapefruit, orange ; [1] (c) measured / same volume of juice ; measured / known sodium hydroxide concentration ; [2] [Total: 10] 6 (a) 0.7 cm ; 1.4 cm ; 1.0 cm ; (no tolerance) [3] (b) (i) when the zero adjuster moves 1 (mm), the scale will move 10 (mm) ; the pointer arm is 10 times as long as the zero adjuster arm / height ; movement of pointer is 10 times larger / owtte ; [max 2] (ii) 1.8 mm, 0.7 mm, 1.4 mm, 1.0 mm (3 or 4 correct) ; [1] (c) zinc, aluminium, copper, iron ; [1] (d) (i) they vibrate (but stay in the same place) ; [1] (ii) heat energy is given to the atoms ; they collide with each other more (with higher energy / more force) / push away (from each other) ; [2] [Total: 10]
What you needed in this session
Cambridge’s own grade thresholds for 2011 Oct/Nov, Paper 6 · Variant 2. A higher threshold means an easier paper — the bar moves with how the cohort did.