Cambridge IGCSE Science - Combined 0653 — 2019 Oct/Nov Paper 5 · Variant 1
0653/51/O/N/19 · 4 questions · 40 marks · ≈45 min
The question paper and its mark scheme, free to read here and free to download. This is Cambridge’s own paper, exactly as it was sat.
Question paper12 pages


Mark scheme7 pages
Answers below. Sit the paper first if you are practising.
Questions as text
Q1 · You are going to investigate the effect of the concentration of a salt solution on the…
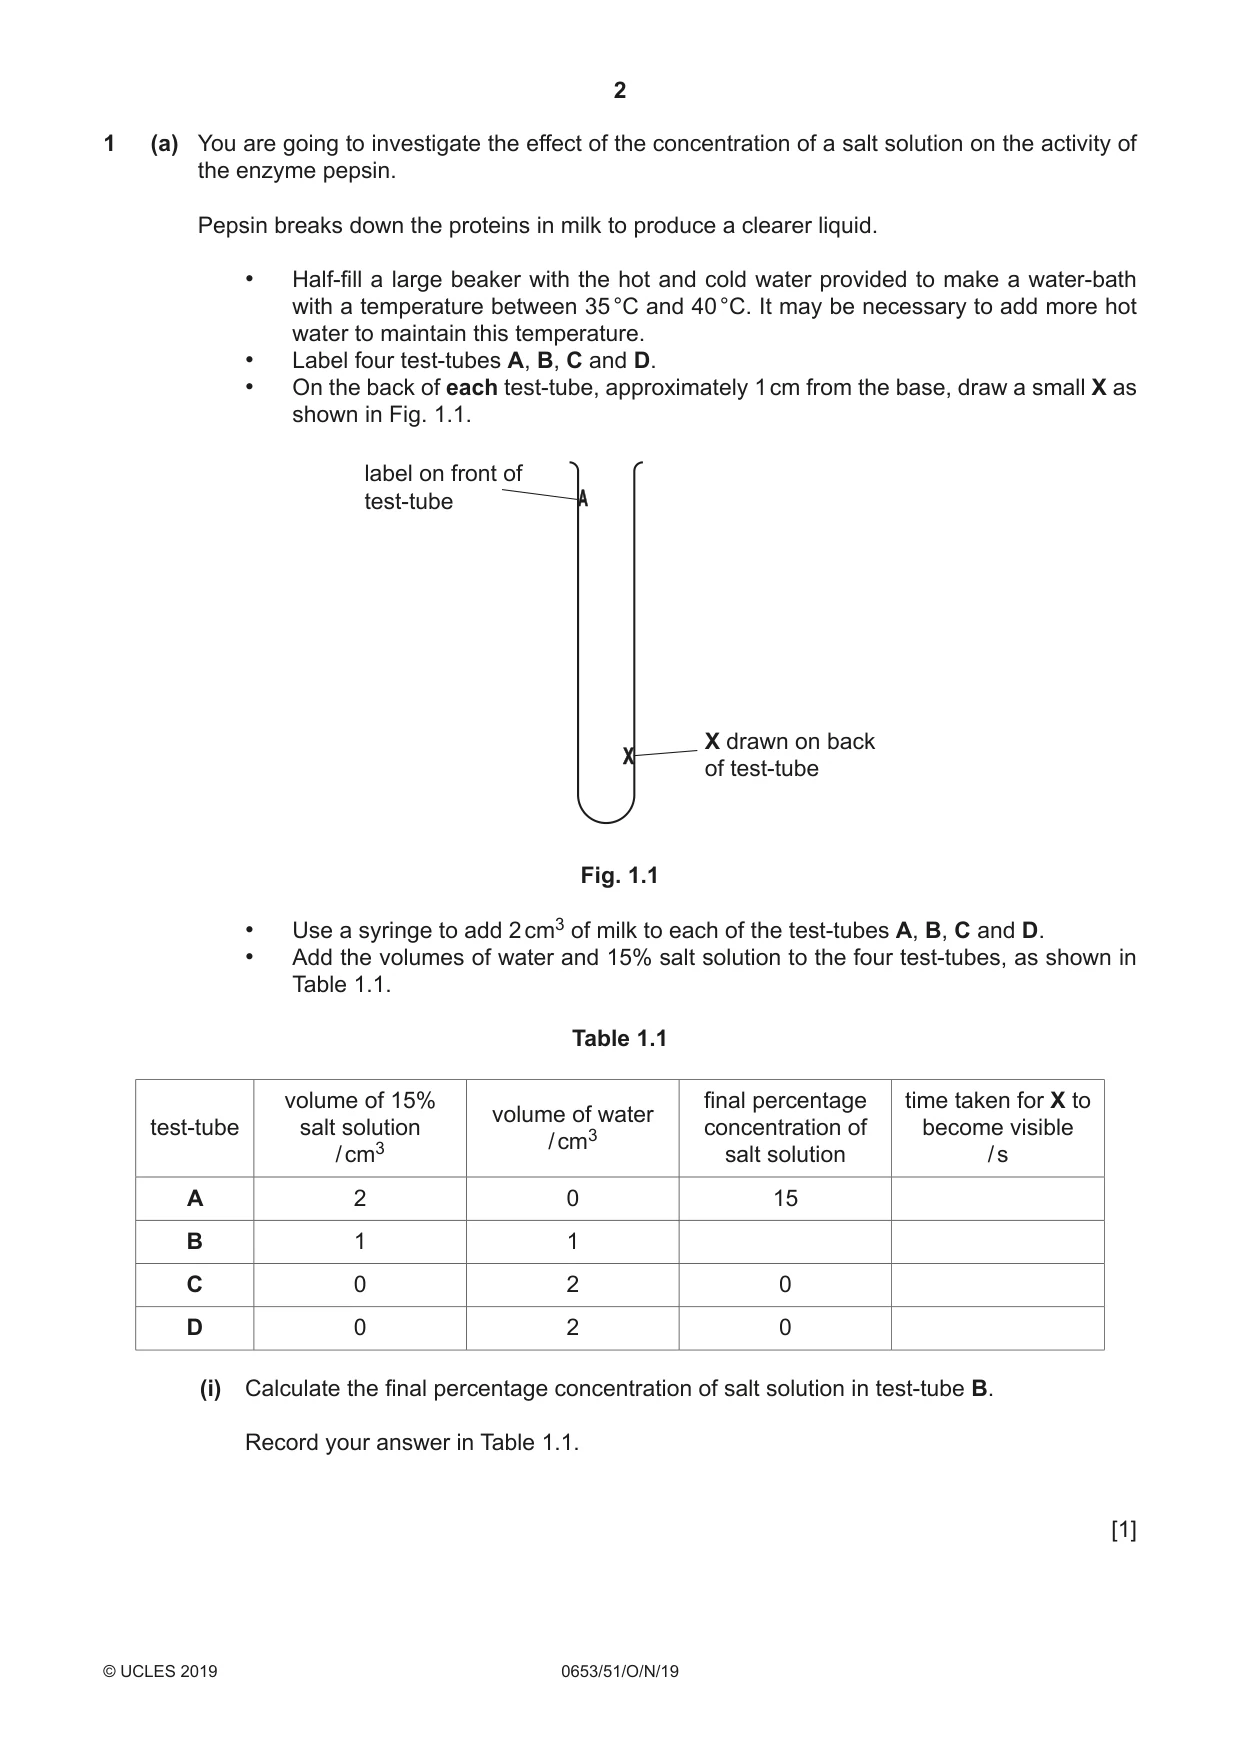
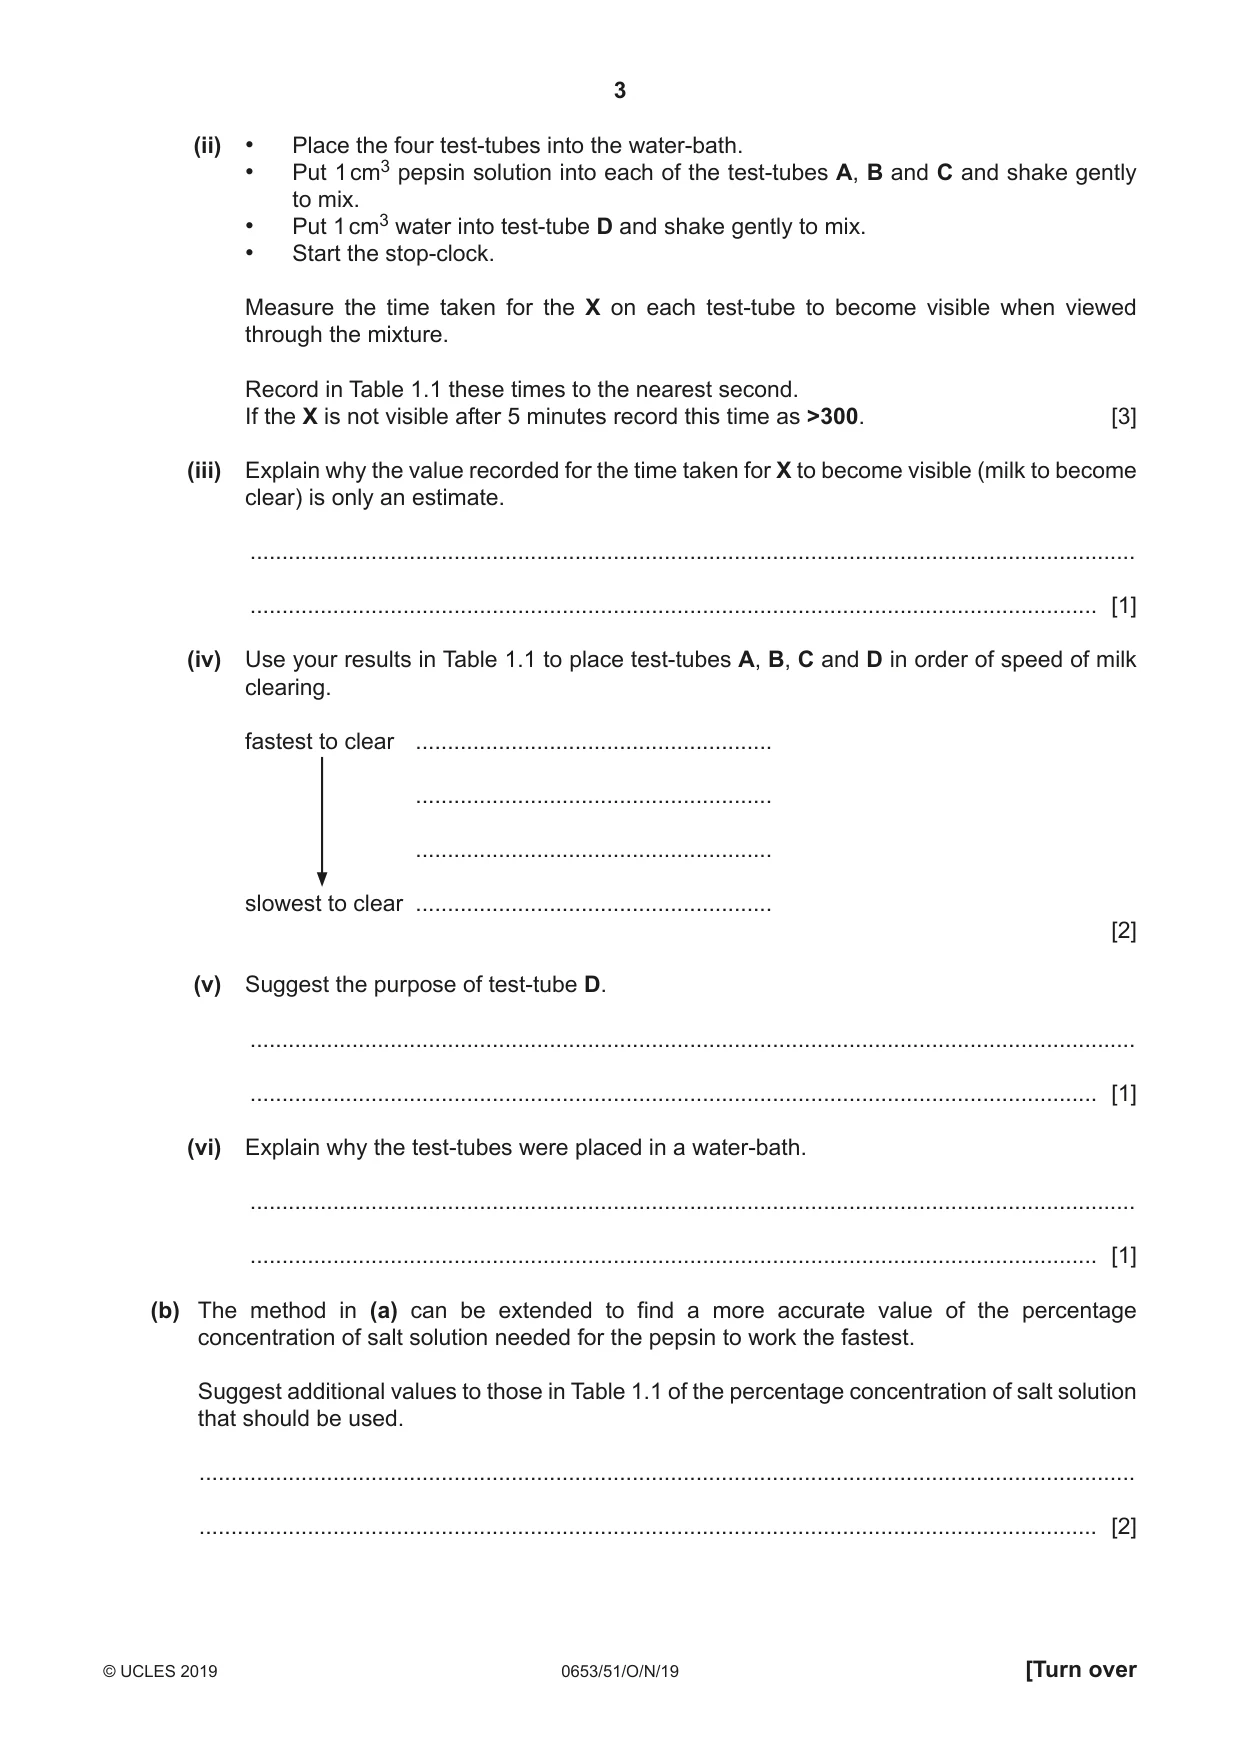
1 (a) You are going to investigate the effect of the concentration of a salt solution on the activity of the enzyme pepsin. Pepsin breaks down the proteins in milk to produce a clearer liquid. • Half-fill a large beaker with the hot and cold water provided to make a water-bath with a temperature between 35 °C and 40 °C. It may be necessary to add more hot water to maintain this temperature. • Label four test-tubes A, B, C and D. • On the back of each test-tube, approximately 1 cm from the base, draw a small X as shown in Fig. 1.1. label on front of test-tube A X drawn on back X of test-tube Fig. 1.1 • Use a syringe to add 2 cm3 of milk to each of the test-tubes A, B, C and D. • Add the volumes of water and 15% salt solution to the four test-tubes, as shown in Table 1.1. Table 1.1 volume of 15% final percentage time taken for X to volume of water test-tube salt solution concentration of become visible / cm3 / cm3 salt solution / s A 2 0 15 B 1 1 C 0 2 0 D 0 2 0 (i) Calculate the final percentage concentration of salt solution in test-tube B. Record your answer in Table 1.1. [1] (ii) • Place the four test-tubes into the water-bath. • Put 1 cm3 pepsin solution into each of the test-tubes A, B and C and shake gently to mix. • Put 1 cm3 water into test-tube D and shake gently to mix. • Start the stop-clock. Measure the time taken for the X on each test-tube to become visible when viewed through the mixture. Record in Table 1.1 these times to the nearest second. If the X is not visible after 5 minutes record this time as >300. [3] (iii) Explain why the value recorded for the time taken for X to become visible (milk to become clear) is only an estimate. ........................................................................................................................................... ..................................................................................................................................... [1] (iv) Use your results in Table 1.1 to place test-tubes A, B, C and D in order of speed of milk clearing. fastest to clear ........................................................ ........................................................ ........................................................ slowest to clear ........................................................ [2] (v) Suggest the purpose of test-tube D. ........................................................................................................................................... ..................................................................................................................................... [1] (vi) Explain why the test-tubes were placed in a water-bath. ........................................................................................................................................... ..................................................................................................................................... [1] (b) The method in (a) can be extended to find a more accurate value of the percentage concentration of salt solution needed for the pepsin to work the fastest. Suggest additional values to those in Table 1.1 of the percentage concentration of salt solution that should be used. ................................................................................................................................................... ............................................................................................................................................. [2] (c) State how you could test the milk to confirm it contains protein. Include the result for a positive test. test ............................................................................................................................................ positive test result ..................................................................................................................... [2] [Total: 13]
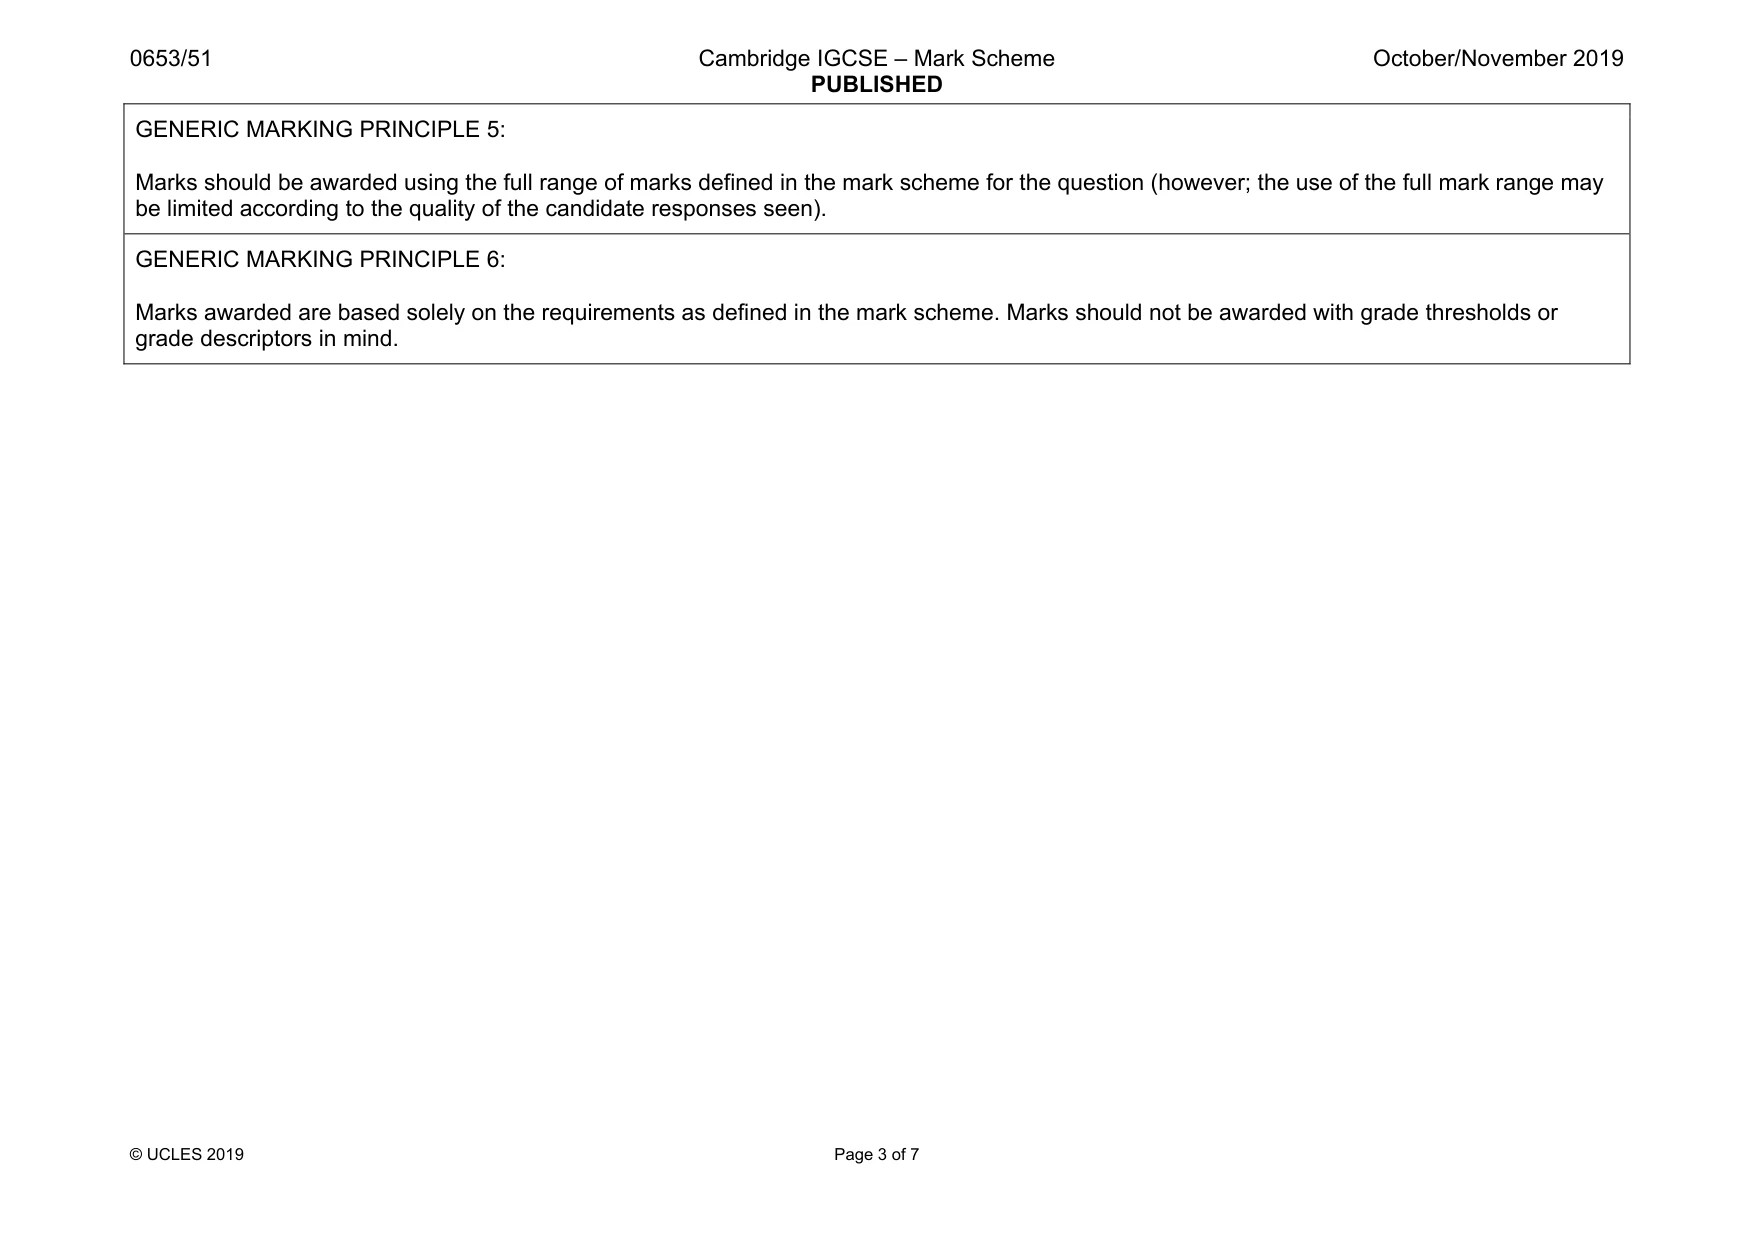
Mark scheme: 1(a)(i) 7.5 / 8 (%) ; 1 1(a)(ii) all results recorded ; all recorded times in whole seconds ; use of >300 as necessary ; 3 1(a)(iii) end point is subjective / difficult to determine / not all started at same time ; 1 1(a)(iv) (from candidate’s results) fastest at top / slowest at bottom ; full correct order ; 2 1(a)(v) as a control / to find out what happens with only water / to find out what happens with no pepsin / to show that pepsin has an effect / to show that pepsin acts as a catalyst ; 1 1(a)(vi) to maintain constant temperature / to maintain optimum temperature for enzymes / to keep at 40 °C ; 1 1(b) one additional value given to test for peak ; two values given ; 2 1(c) biuret ; lilac / purple / violet / mauve ; 2
Q2 · E and F are two different colourless aqueous solutions
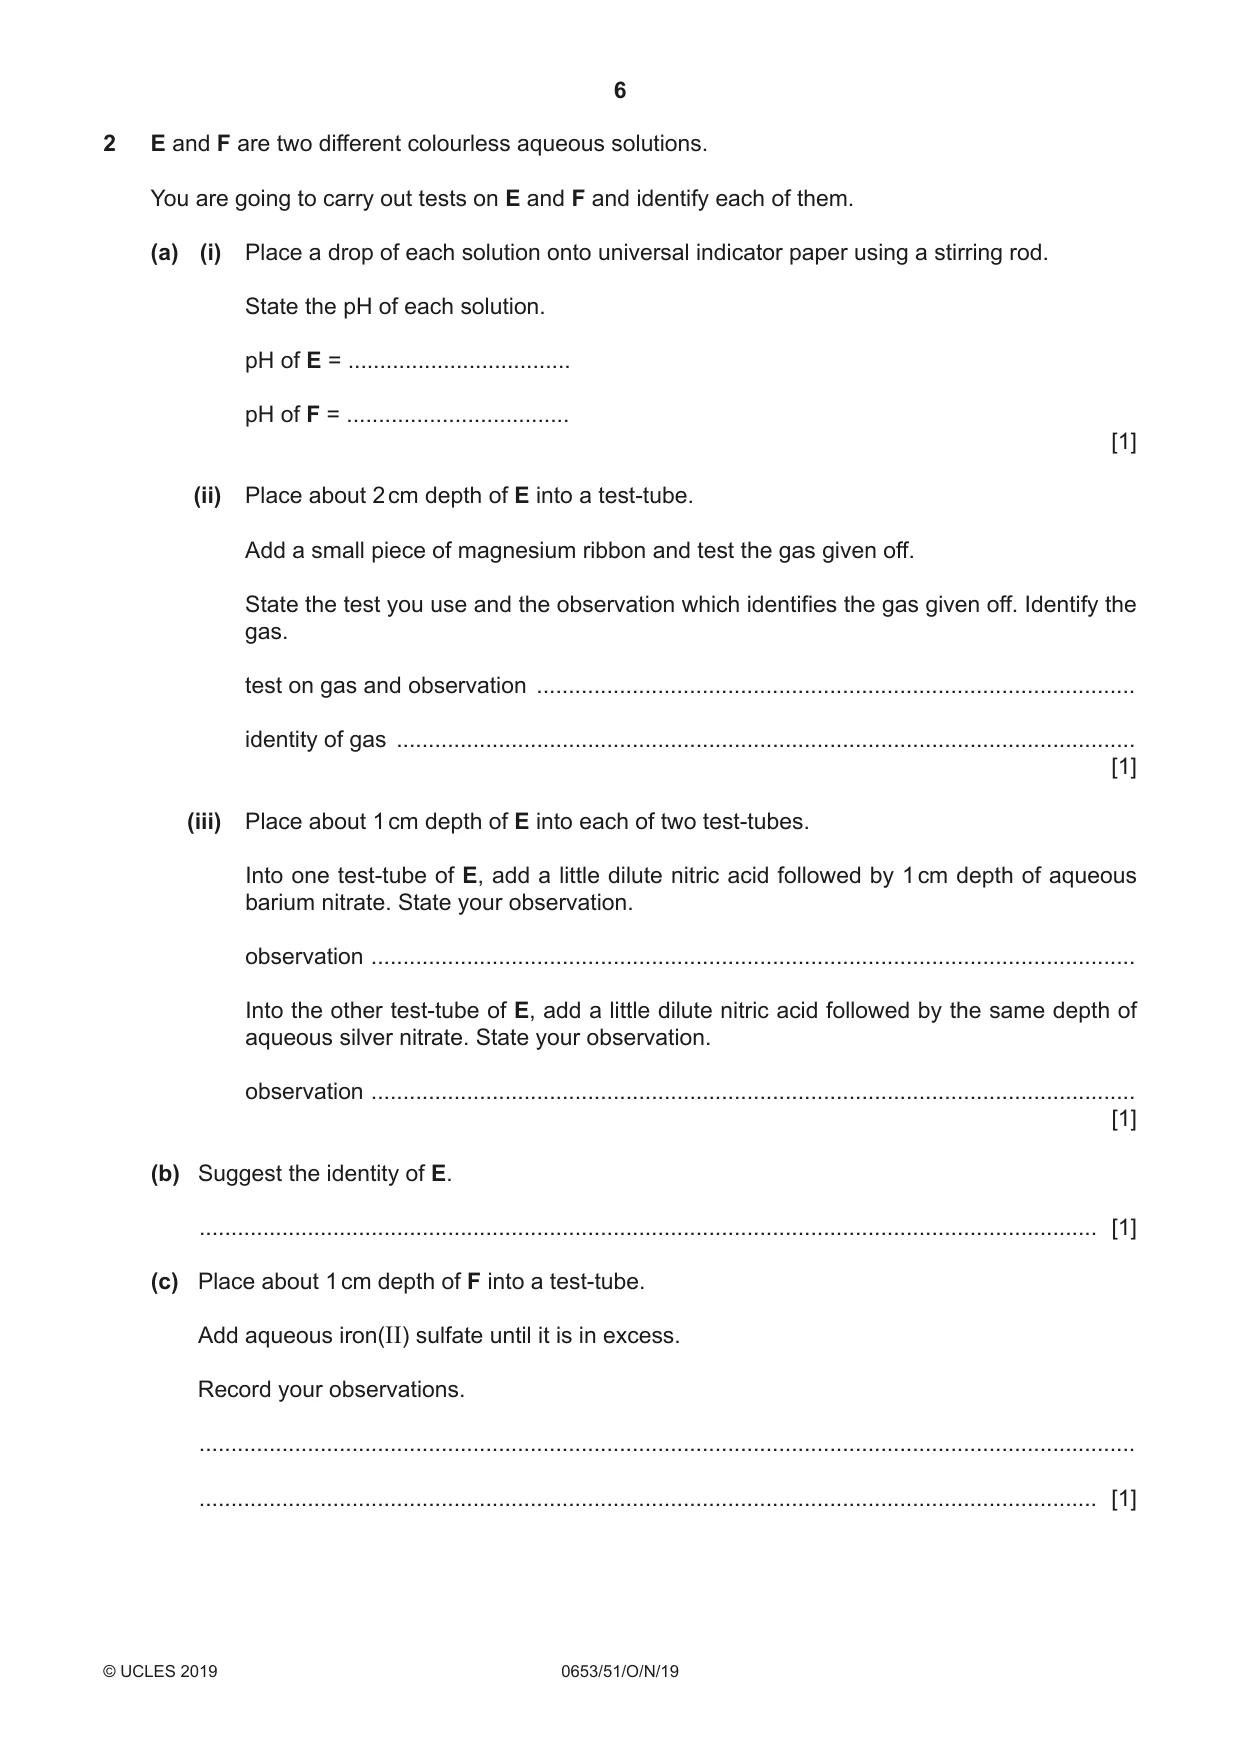
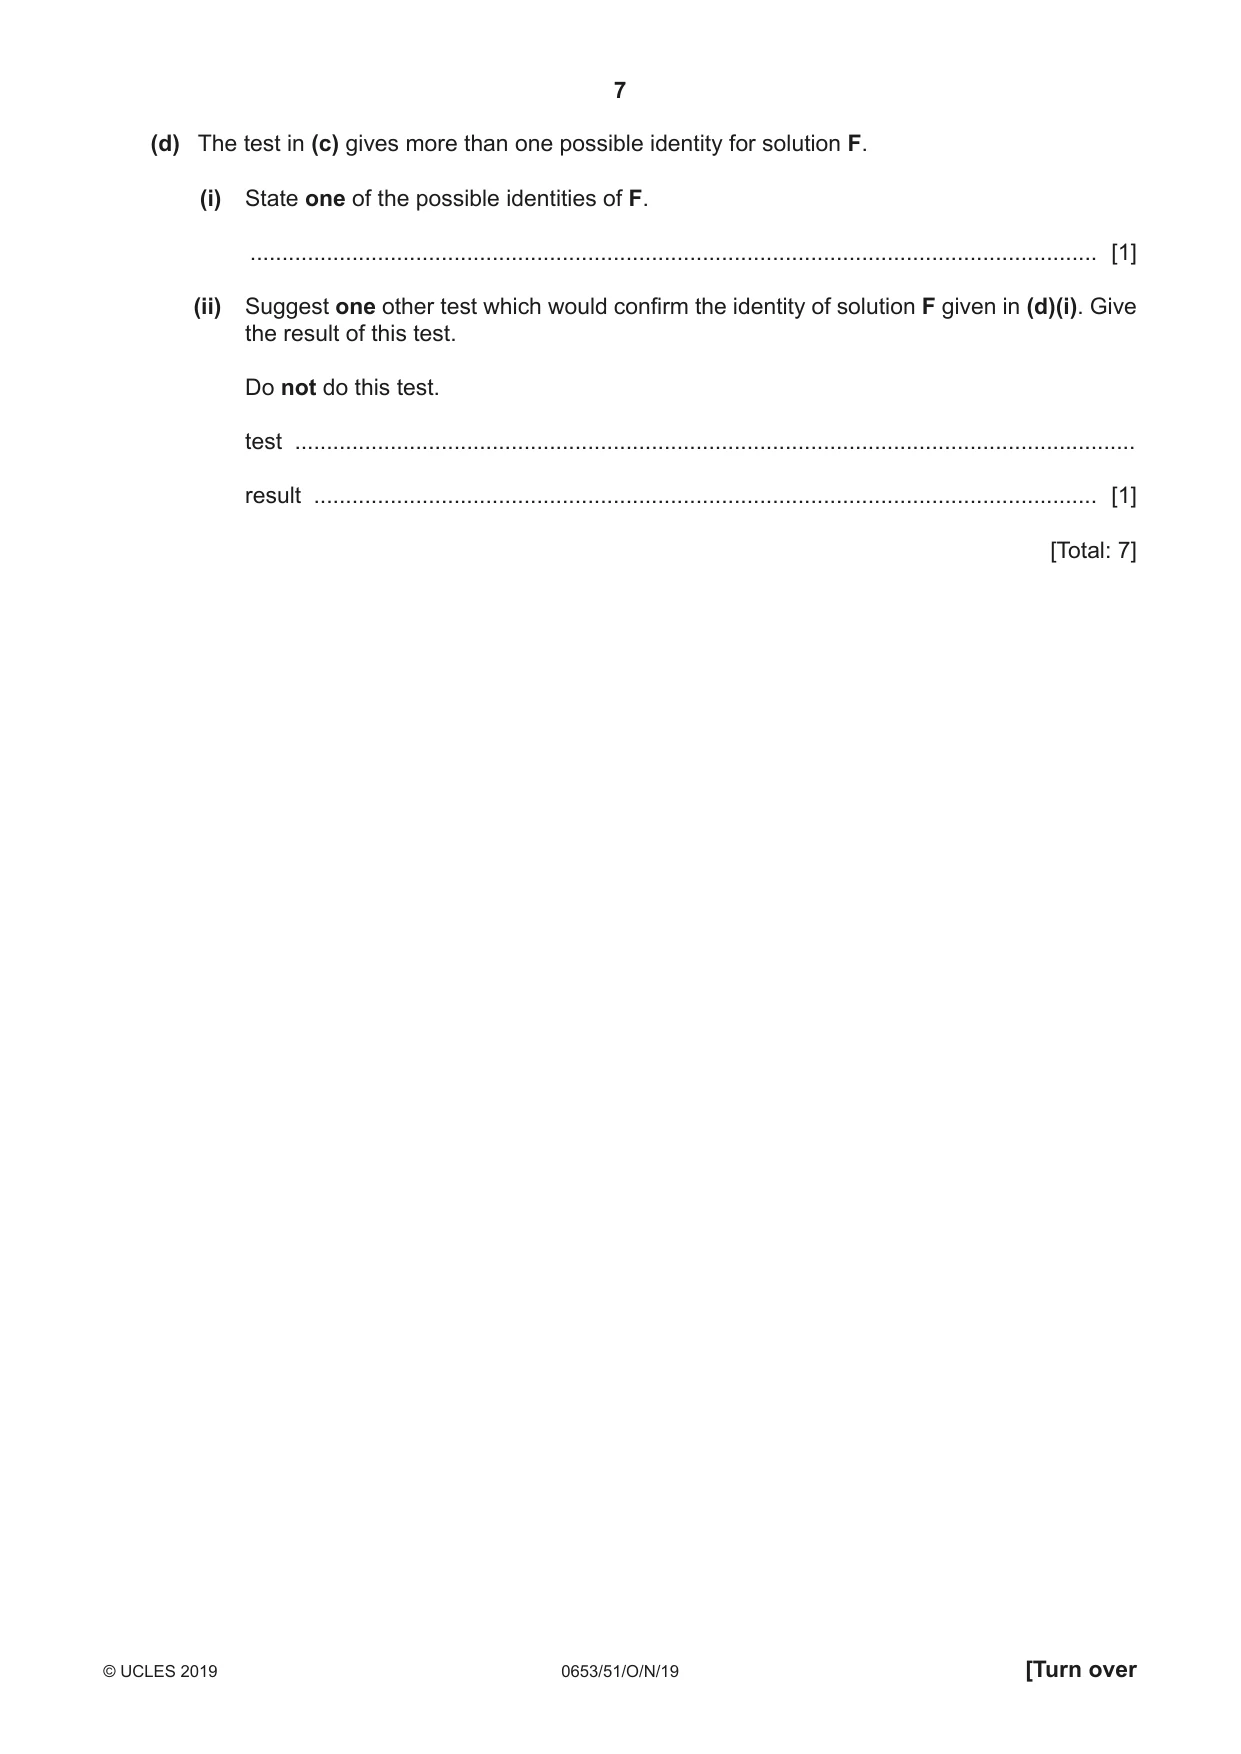
2 E and F are two different colourless aqueous solutions. You are going to carry out tests on E and F and identify each of them. (a) (i) Place a drop of each solution onto universal indicator paper using a stirring rod. State the pH of each solution. pH of E = ................................... pH of F = ................................... [1] (ii) Place about 2 cm depth of E into a test-tube. Add a small piece of magnesium ribbon and test the gas given off. State the test you use and the observation which identifies the gas given off. Identify the gas. test on gas and observation .............................................................................................. identity of gas .................................................................................................................... [1] (iii) Place about 1 cm depth of E into each of two test-tubes. Into one test-tube of E, add a little dilute nitric acid followed by 1 cm depth of aqueous barium nitrate. State your observation. observation ........................................................................................................................ Into the other test-tube of E, add a little dilute nitric acid followed by the same depth of aqueous silver nitrate. State your observation. observation ........................................................................................................................ [1] (b) Suggest the identity of E. ............................................................................................................................................. [1] (c) Place about 1 cm depth of F into a test-tube. Add aqueous iron(II) sulfate until it is in excess. Record your observations. ................................................................................................................................................... ............................................................................................................................................. [1] (d) The test in (c) gives more than one possible identity for solution F. (i) State one of the possible identities of F. ..................................................................................................................................... [1] (ii) Suggest one other test which would confirm the identity of solution F given in (d)(i). Give the result of this test. Do not do this test. test .................................................................................................................................... result ........................................................................................................................... [1] [Total: 7]
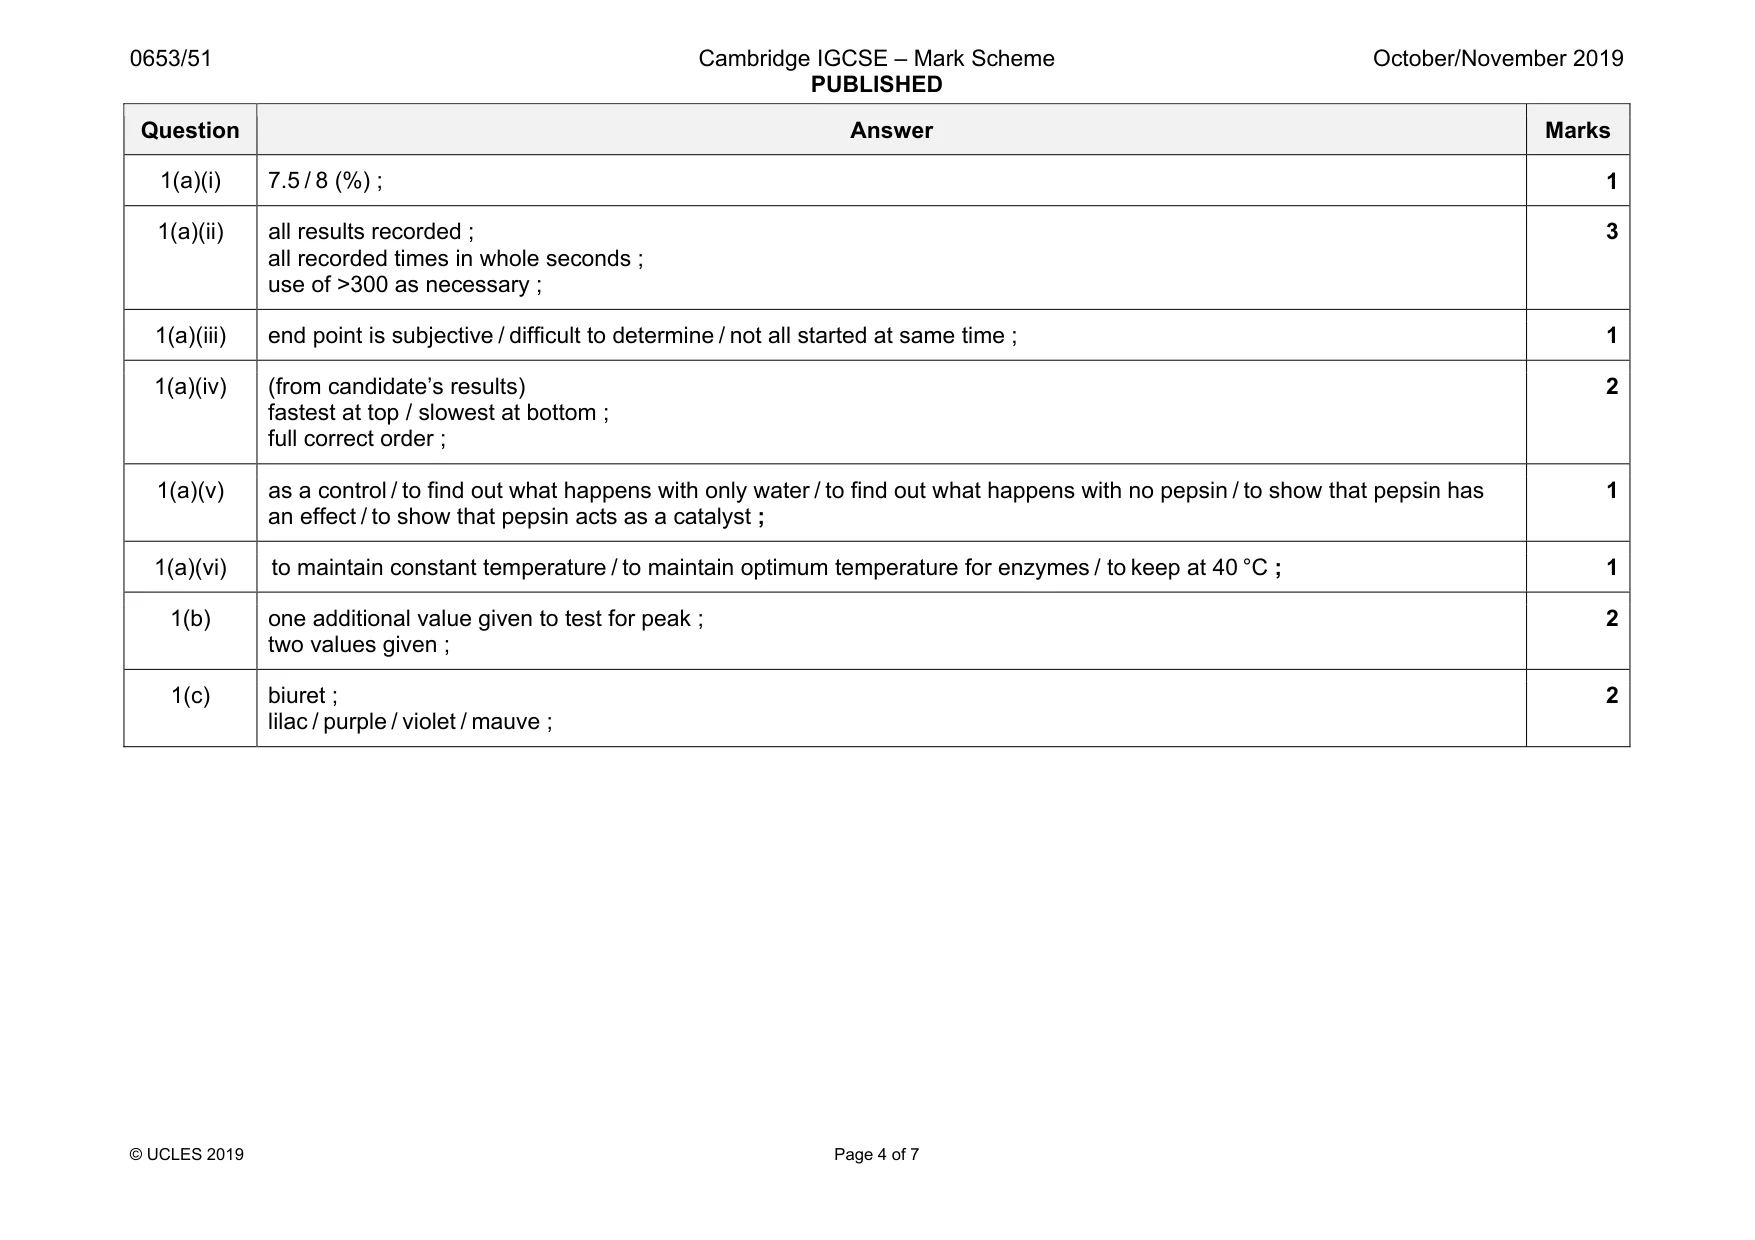
Mark scheme: 2(a)(i) E 1–2 and F 12–14 ; 1 2(a)(ii) lighted splint pops and hydrogen ; 1 2(a)(iii) white precipitate and no precipitate / colourless solution ; 1 2(b) E sulfuric acid ; 1 2(c) green precipitate ; 1 2(d)(i) F ammonia solution / sodium hydroxide ; 1 2(d)(ii) copper(II) and (ammonia =) blue ppt and dark blue solution or (sodium hydroxide =) pale blue ppt ; 1
Q3 · Sea water contains a number of dissolved salts such as sodium chloride
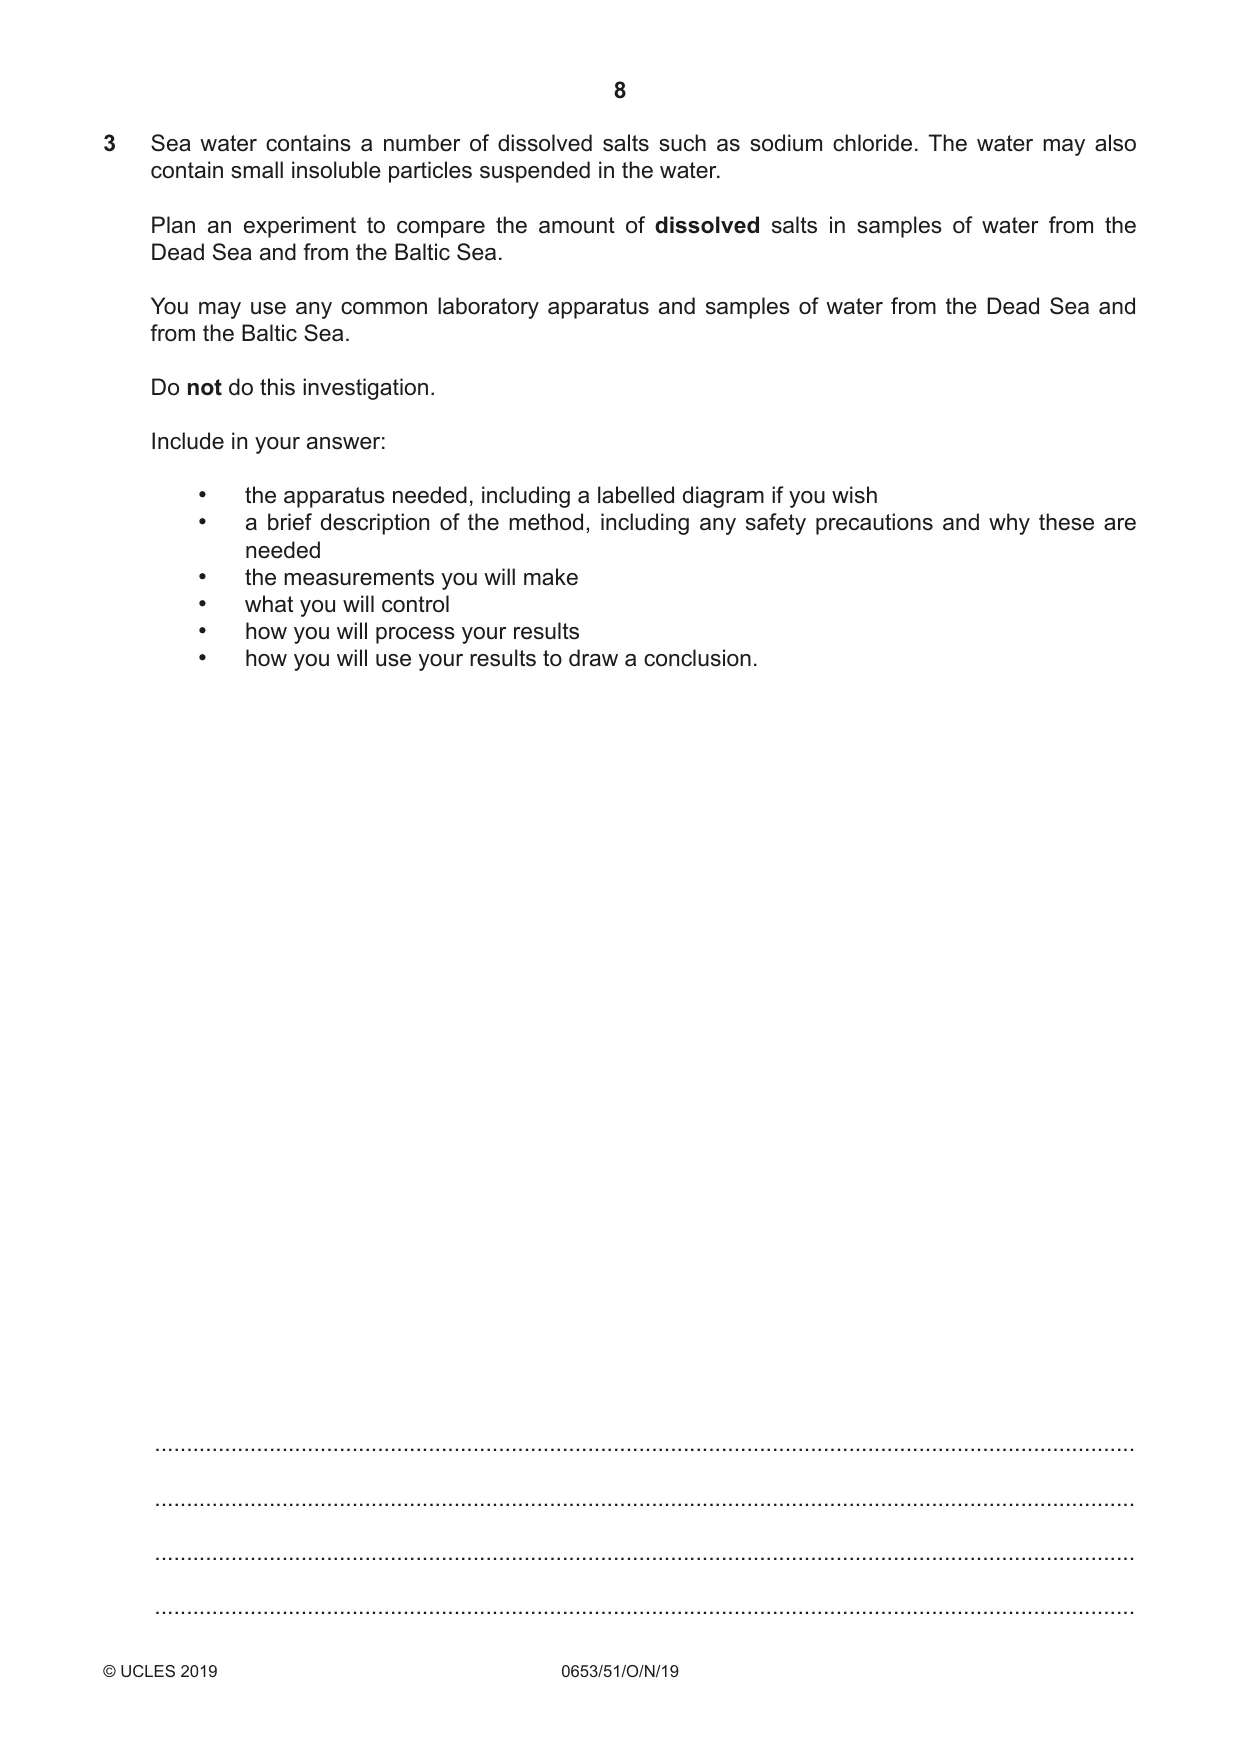
3 Sea water contains a number of dissolved salts such as sodium chloride. The water may also contain small insoluble particles suspended in the water. Plan an experiment to compare the amount of dissolved salts in samples of water from the Dead Sea and from the Baltic Sea. You may use any common laboratory apparatus and samples of water from the Dead Sea and from the Baltic Sea. Do not do this investigation. Include in your answer: • the apparatus needed, including a labelled diagram if you wish • a brief description of the method, including any safety precautions and why these are needed • the measurements you will make • what you will control • how you will process your results • how you will use your results to draw a conclusion. .......................................................................................................................................................... .......................................................................................................................................................... .......................................................................................................................................................... .......................................................................................................................................................... .......................................................................................................................................................... .......................................................................................................................................................... .......................................................................................................................................................... .......................................................................................................................................................... .......................................................................................................................................................... .......................................................................................................................................................... .......................................................................................................................................................... .......................................................................................................................................................... .......................................................................................................................................................... .......................................................................................................................................................... .......................................................................................................................................................... .......................................................................................................................................................... .......................................................................................................................................................... .......................................................................................................................................................... .......................................................................................................................................................... .......................................................................................................................................................... .................................................................................................................................................... [7]
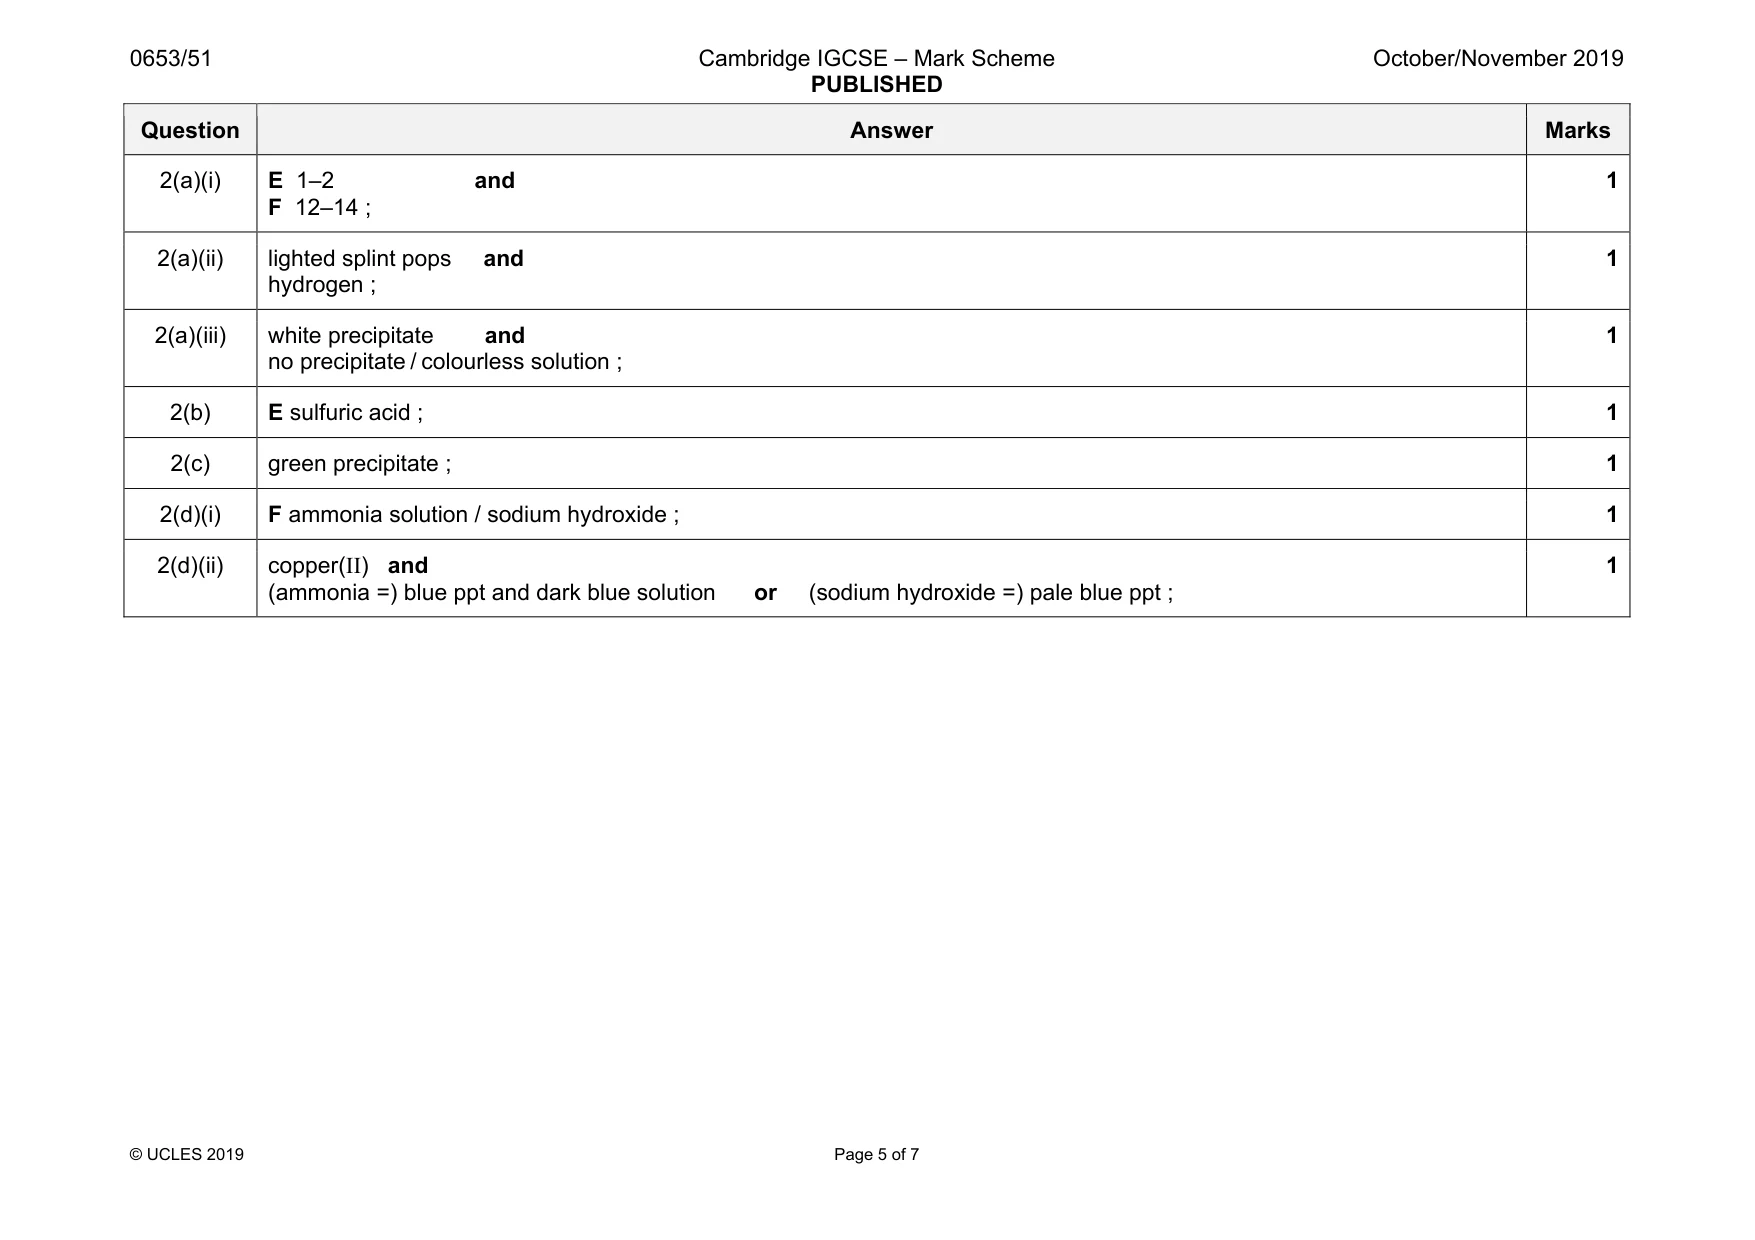
Mark scheme: 3 one mark from each section and then any other 3 marks from: 1. apparatus (allow from a labelled diagram) sea water in a suitable container and use of heating device / Bunsen burner ; measuring cylinder ; filter funnel and filter paper (may be from a diagram if the funnel clearly contains a filter paper) ; weighing scales ; 2. method filter to remove insoluble particles (before heating) ; heat / leave so that (all) water evaporates ; repeat for same type of seawater ; wear goggles when heating / wear goggles to prevent solution or salt from going into eyes / wear gloves so salt water does not touch skin / take precaution against hot apparatus e.g. use tongs, wait for apparatus to cool before touching ; 3. measurements and control idea of weighing empty evaporating basin / container ; same amount of water used / quotes volume of water used / measures volume or mass of water used ; measure mass / weigh salts after evaporation ; 4. processing and use of results calculate average mass of salts for each type of sea-water (if measurements repeated) ; calculate percentage mass or mass of salts in fixed volume of water ; compare mass of salts (if same volume used) / states that a larger mass has more dissolved salts ; 7
Q4 · You are going to investigate the cooling of water in a drinks cup
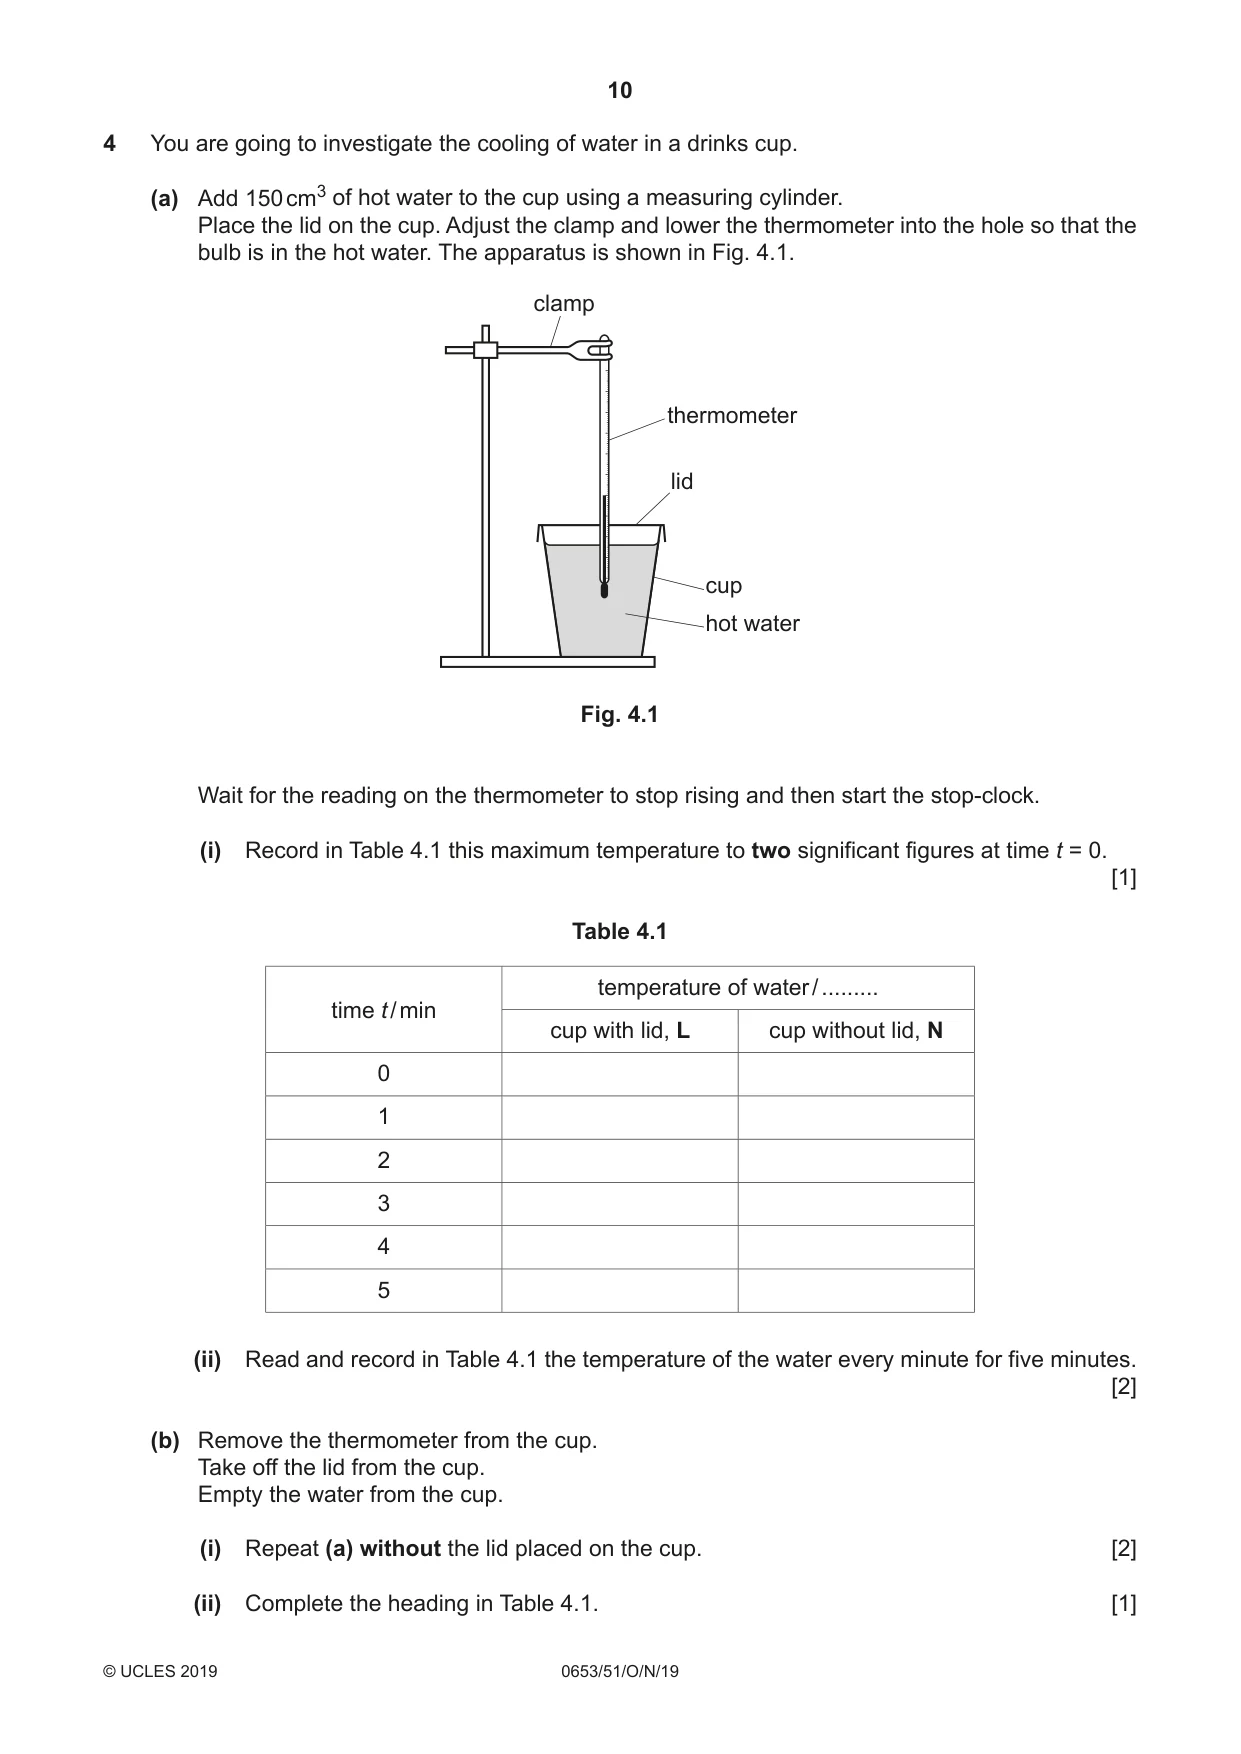
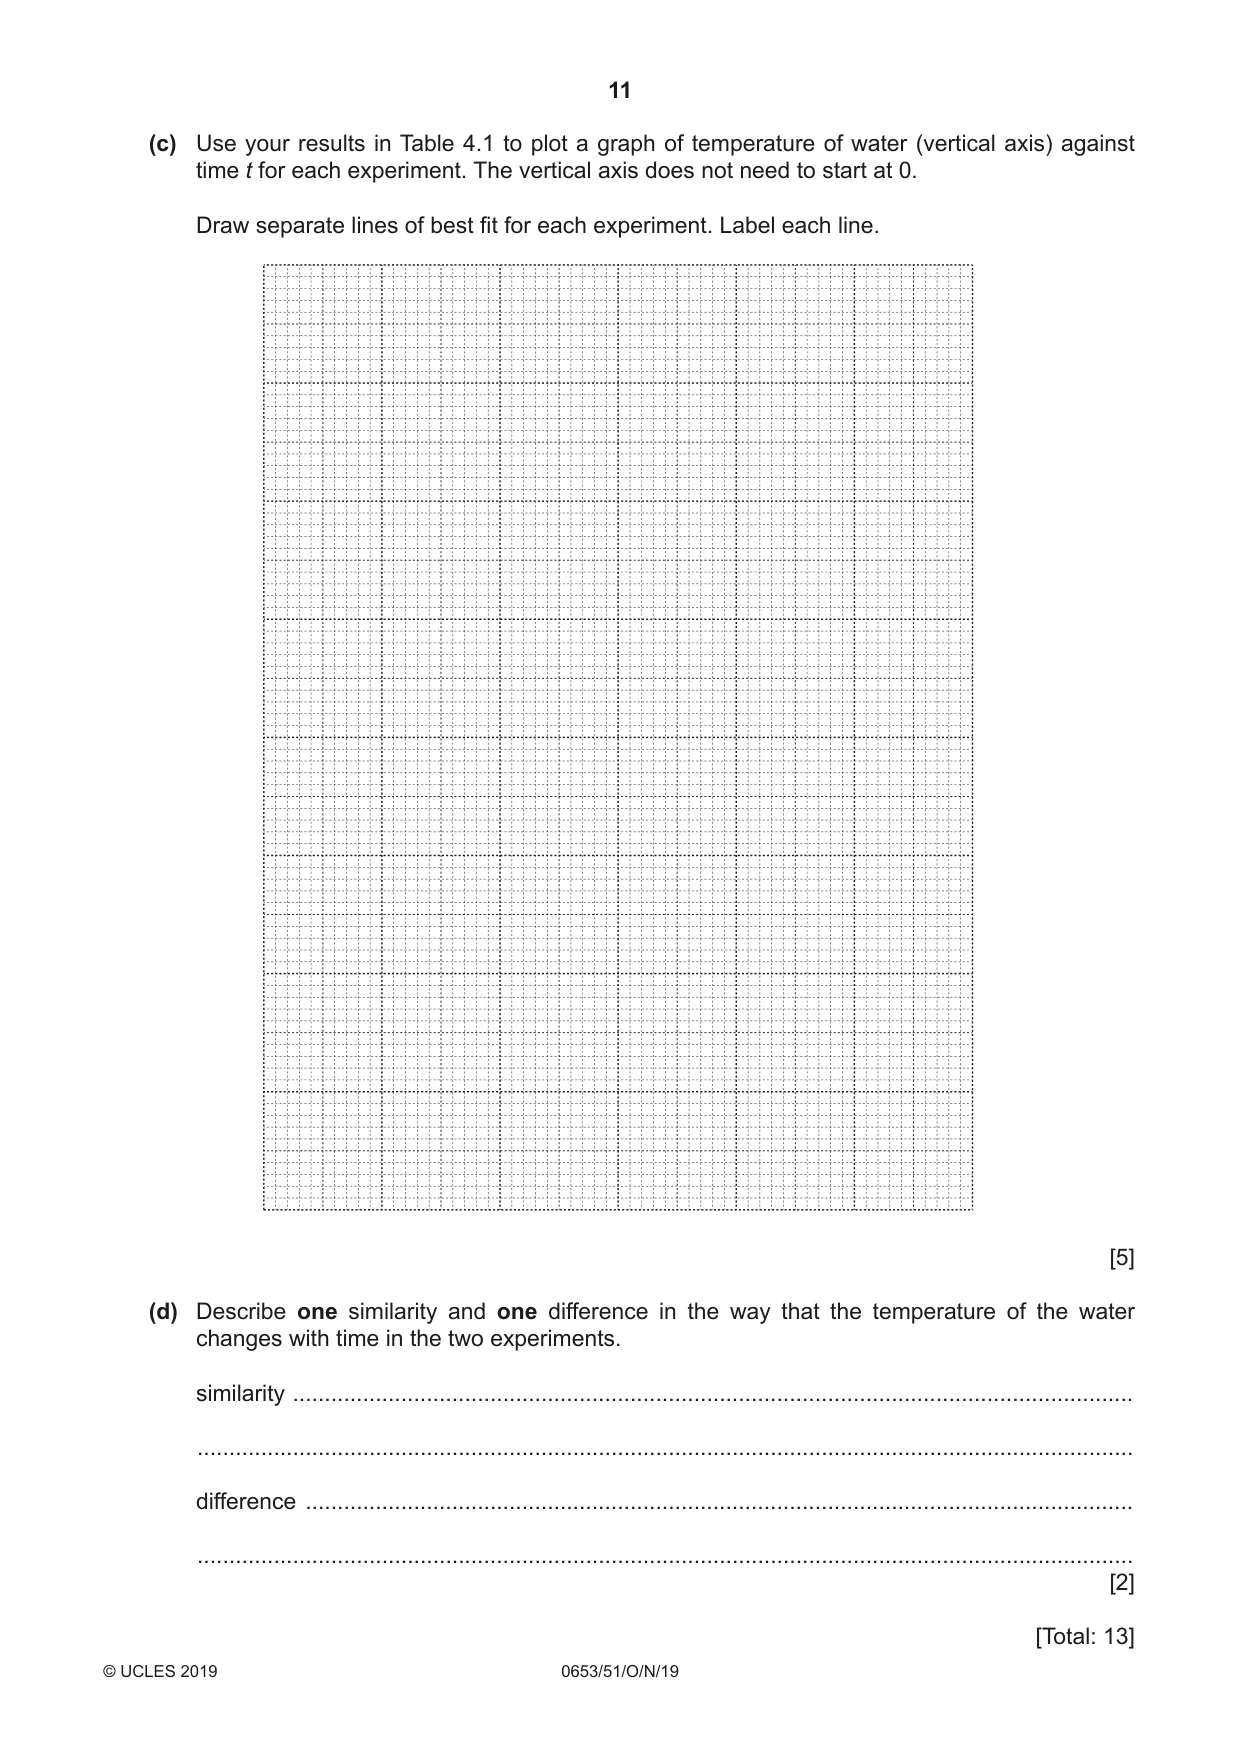
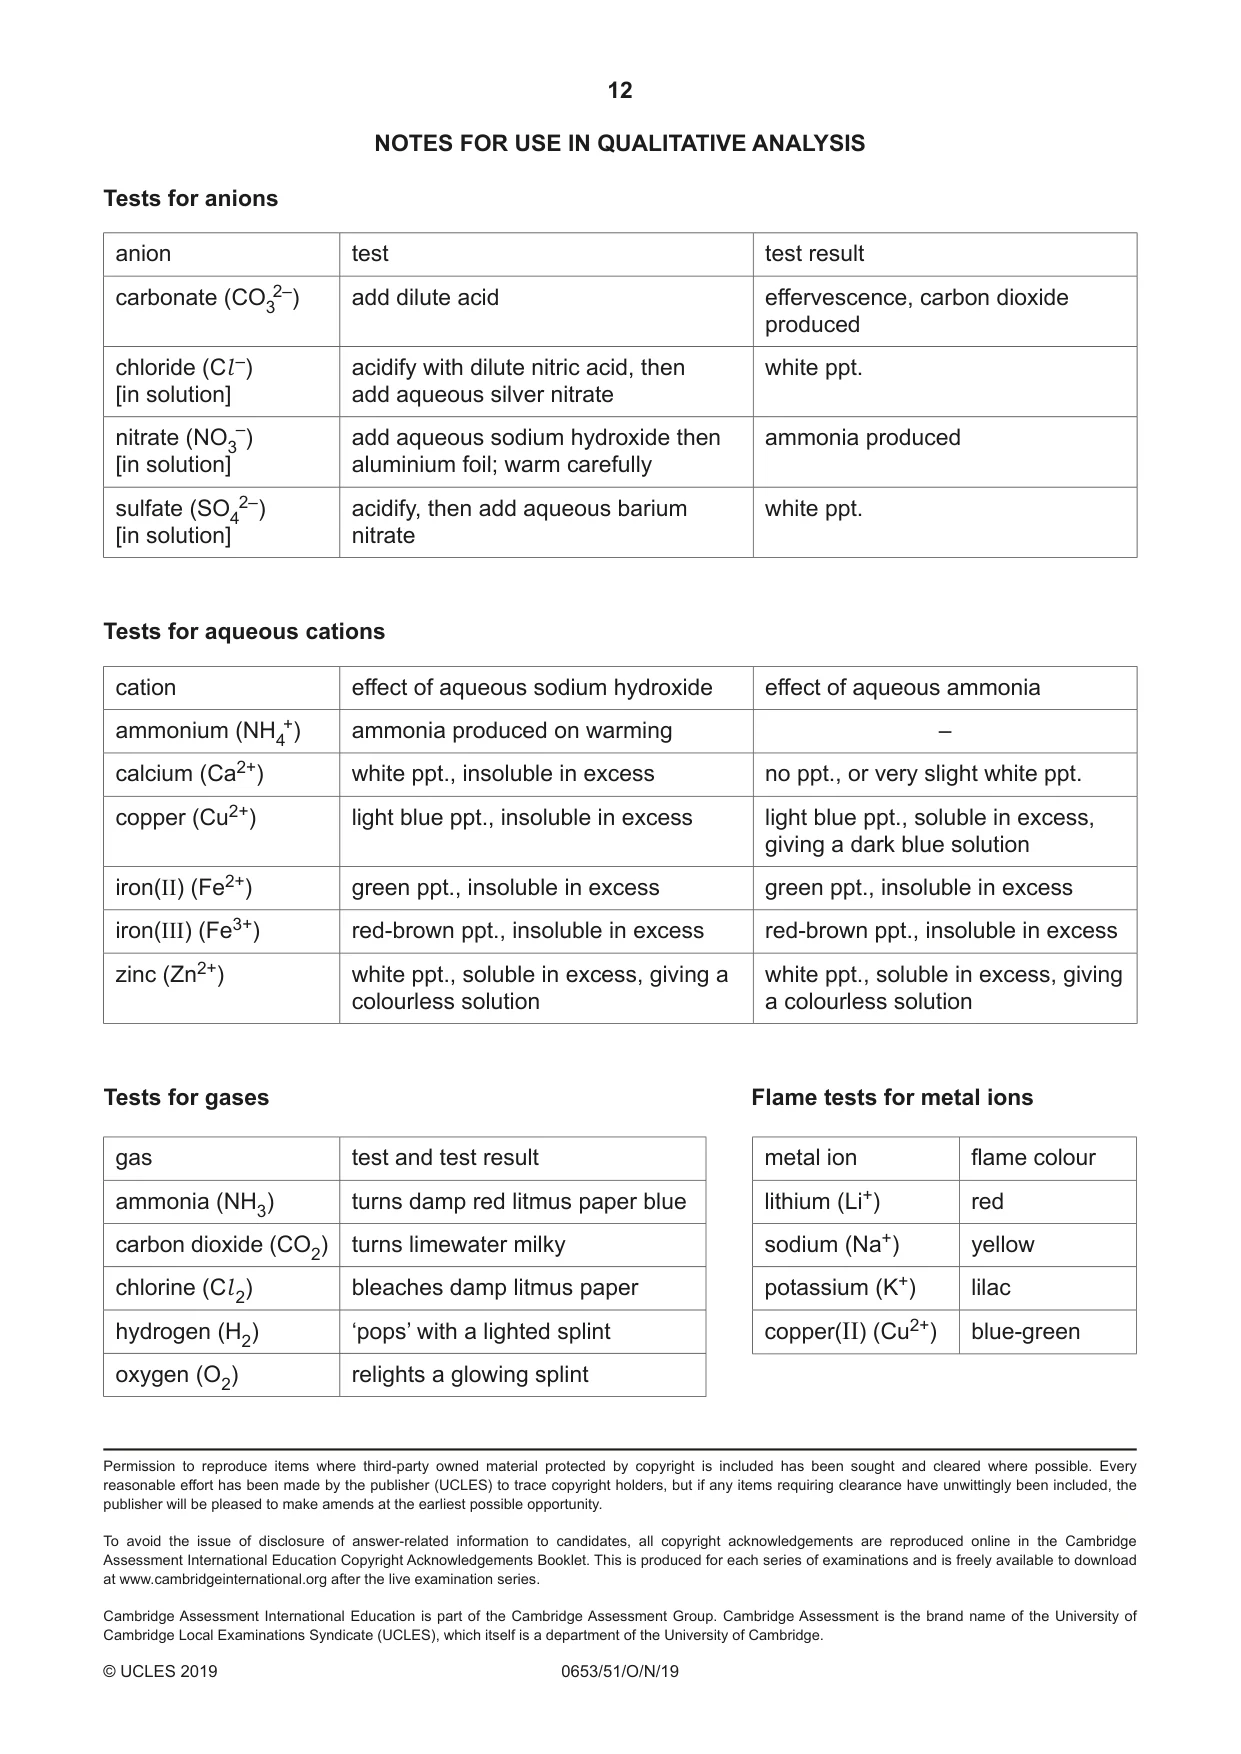
4 You are going to investigate the cooling of water in a drinks cup. (a) Add 150 cm3 of hot water to the cup using a measuring cylinder. Place the lid on the cup. Adjust the clamp and lower the thermometer into the hole so that the bulb is in the hot water. The apparatus is shown in Fig. 4.1. clamp thermometer lid cup hot water Fig. 4.1 Wait for the reading on the thermometer to stop rising and then start the stop-clock. (i) Record in Table 4.1 this maximum temperature to two significant figures at time t = 0. [1] Table 4.1 temperature of water / ......... time t / min cup with lid, L cup without lid, N 0 1 2 3 4 5 (ii) Read and record in Table 4.1 the temperature of the water every minute for five minutes. [2] (b) Remove the thermometer from the cup. Take off the lid from the cup. Empty the water from the cup. (i) Repeat (a) without the lid placed on the cup. [2] (ii) Complete the heading in Table 4.1. [1] (c) Use your results in Table 4.1 to plot a graph of temperature of water (vertical axis) against time t for each experiment. The vertical axis does not need to start at 0. Draw separate lines of best fit for each experiment. Label each line. [5] (d) Describe one similarity and one difference in the way that the temperature of the water changes with time in the two experiments. similarity .................................................................................................................................... ................................................................................................................................................... difference .................................................................................................................................. ................................................................................................................................................... [2] [Total: 13] NOTES FOR USE IN QUALITATIVE ANALYSIS Tests for anions anion test test result carbonate (CO32–) add dilute acid effervescence, carbon dioxide produced chloride (Cl –) acidify with dilute nitric acid, then white ppt. [in solution] add aqueous silver nitrate nitrate (NO3–) add aqueous sodium hydroxide then ammonia produced [in solution] aluminium foil; warm carefully sulfate (SO42–) acidify, then add aqueous barium white ppt. [in solution] nitrate Tests for aqueous cations cation effect of aqueous sodium hydroxide effect of aqueous ammonia ammonium (NH4+) ammonia produced on warming – calcium (Ca2+) white ppt., insoluble in excess no ppt., or very slight white ppt. copper (Cu2+) light blue ppt., insoluble in excess light blue ppt., soluble in excess, giving a dark blue solution iron(II) (Fe2+) green ppt., insoluble in excess green ppt., insoluble in excess iron(III) (Fe3+) red-brown ppt., insoluble in excess red-brown ppt., insoluble in excess zinc (Zn2+) white ppt., soluble in excess, giving a white ppt., soluble in excess, giving colourless solution a colourless solution Tests for gases Flame tests for metal ions gas test and test result metal ion flame colour ammonia (NH3) turns damp red litmus paper blue lithium (Li+) red carbon dioxide (CO2) turns limewater milky sodium (Na+) yellow chlorine (Cl 2) bleaches damp litmus paper potassium (K+) lilac hydrogen (H2) ‘pops’ with a lighted splint copper(II) (Cu2+) blue-green oxygen (O2) relights a glowing splint
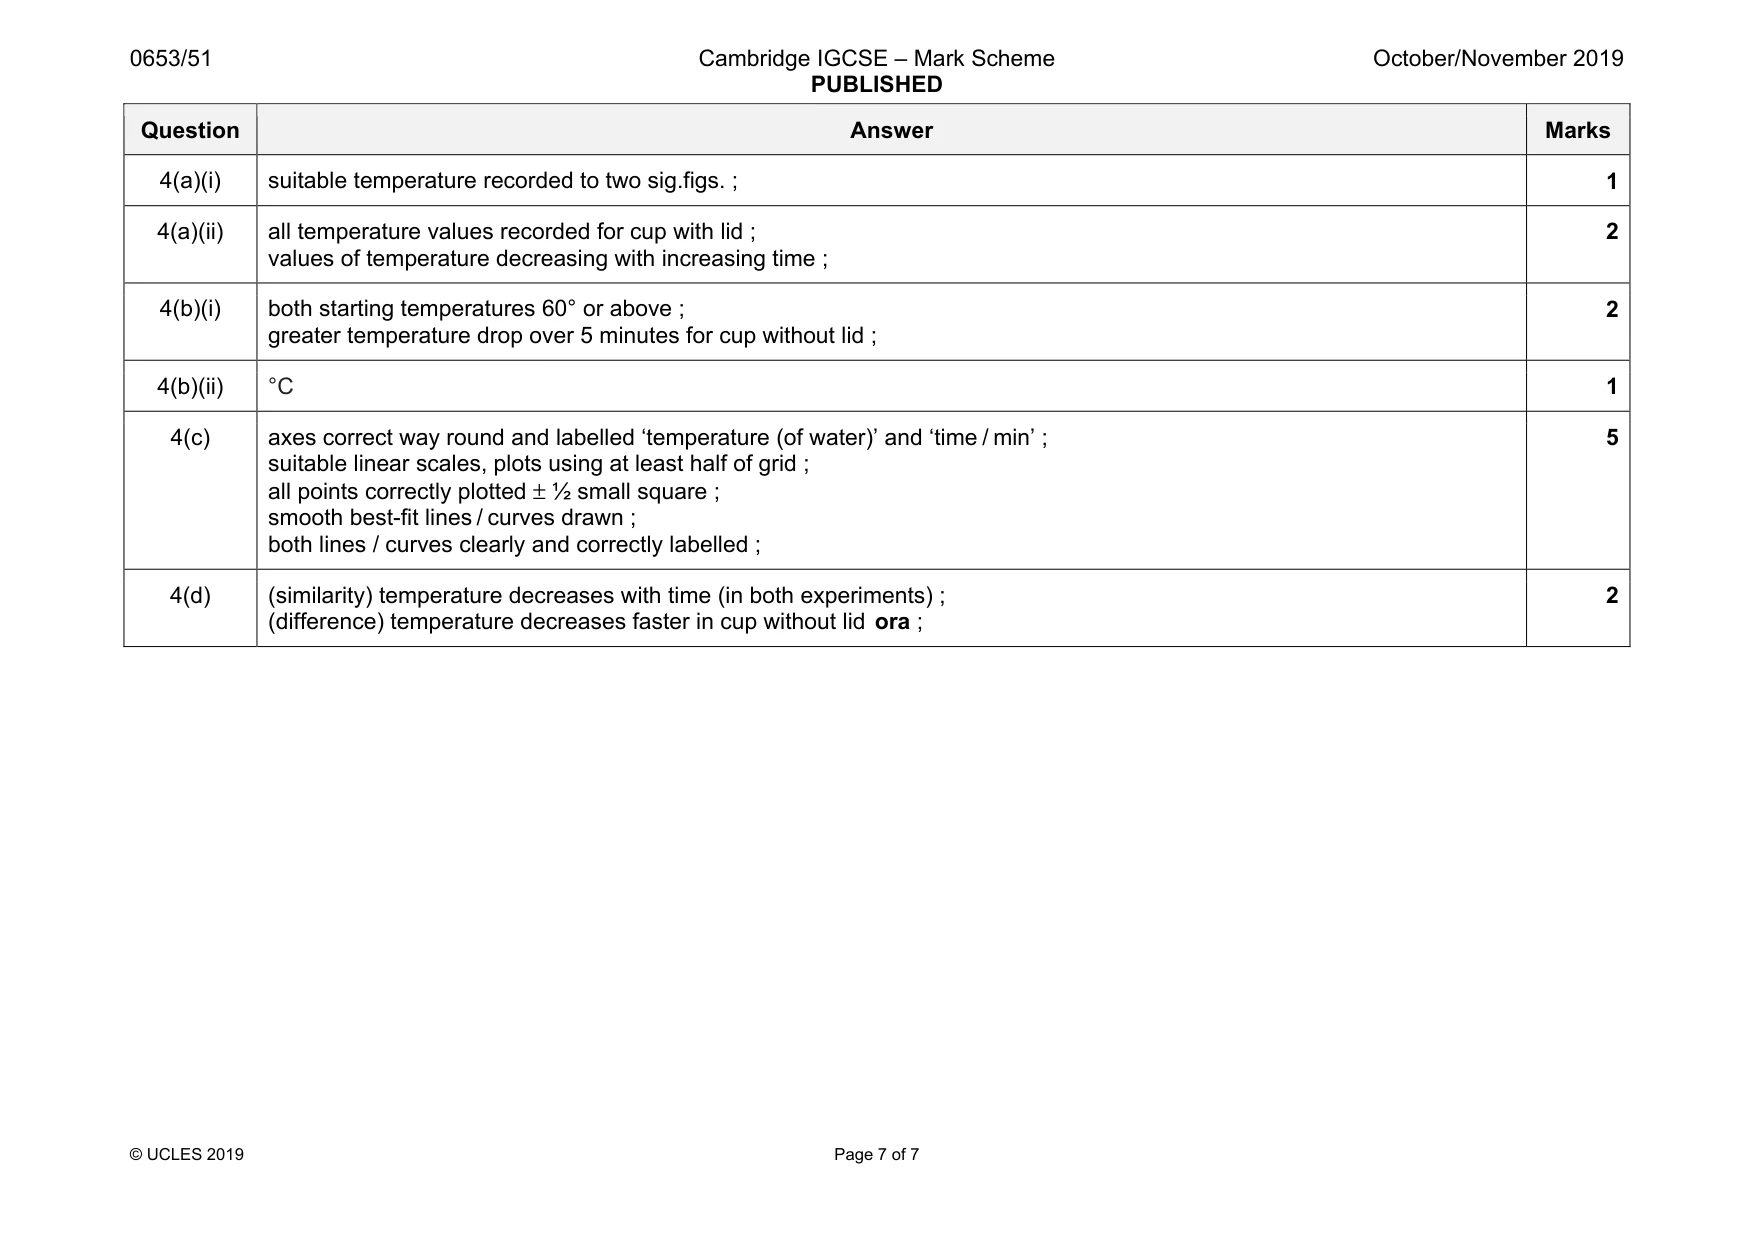
Mark scheme: 4(a)(i) suitable temperature recorded to two sig.figs. ; 1 4(a)(ii) all temperature values recorded for cup with lid ; values of temperature decreasing with increasing time ; 2 4(b)(i) both starting temperatures 60° or above ; greater temperature drop over 5 minutes for cup without lid ; 2 4(b)(ii) °C 1 4(c) axes correct way round and labelled ‘temperature (of water)’ and ‘time / min’ ; suitable linear scales, plots using at least half of grid ; all points correctly plotted ± ½ small square ; smooth best-fit lines / curves drawn ; both lines / curves clearly and correctly labelled ; 5 4(d) (similarity) temperature decreases with time (in both experiments) ; (difference) temperature decreases faster in cup without lid ora ; 2
What was in this paper
The subtopics covered by these 4 questions, and how many questions each got. Open one in a new tab to see every Cambridge question on it.
What you needed in this session
Cambridge’s own grade thresholds for 2019 Oct/Nov, Paper 5 · Variant 1. A higher threshold means an easier paper — the bar moves with how the cohort did.