Cambridge IGCSE Science - Combined 0653 — 2019 Oct/Nov Paper 5 · Variant 2
0653/52/O/N/19 · 4 questions · 40 marks · ≈45 min
The question paper and its mark scheme, free to read here and free to download. This is Cambridge’s own paper, exactly as it was sat.
Question paper12 pages



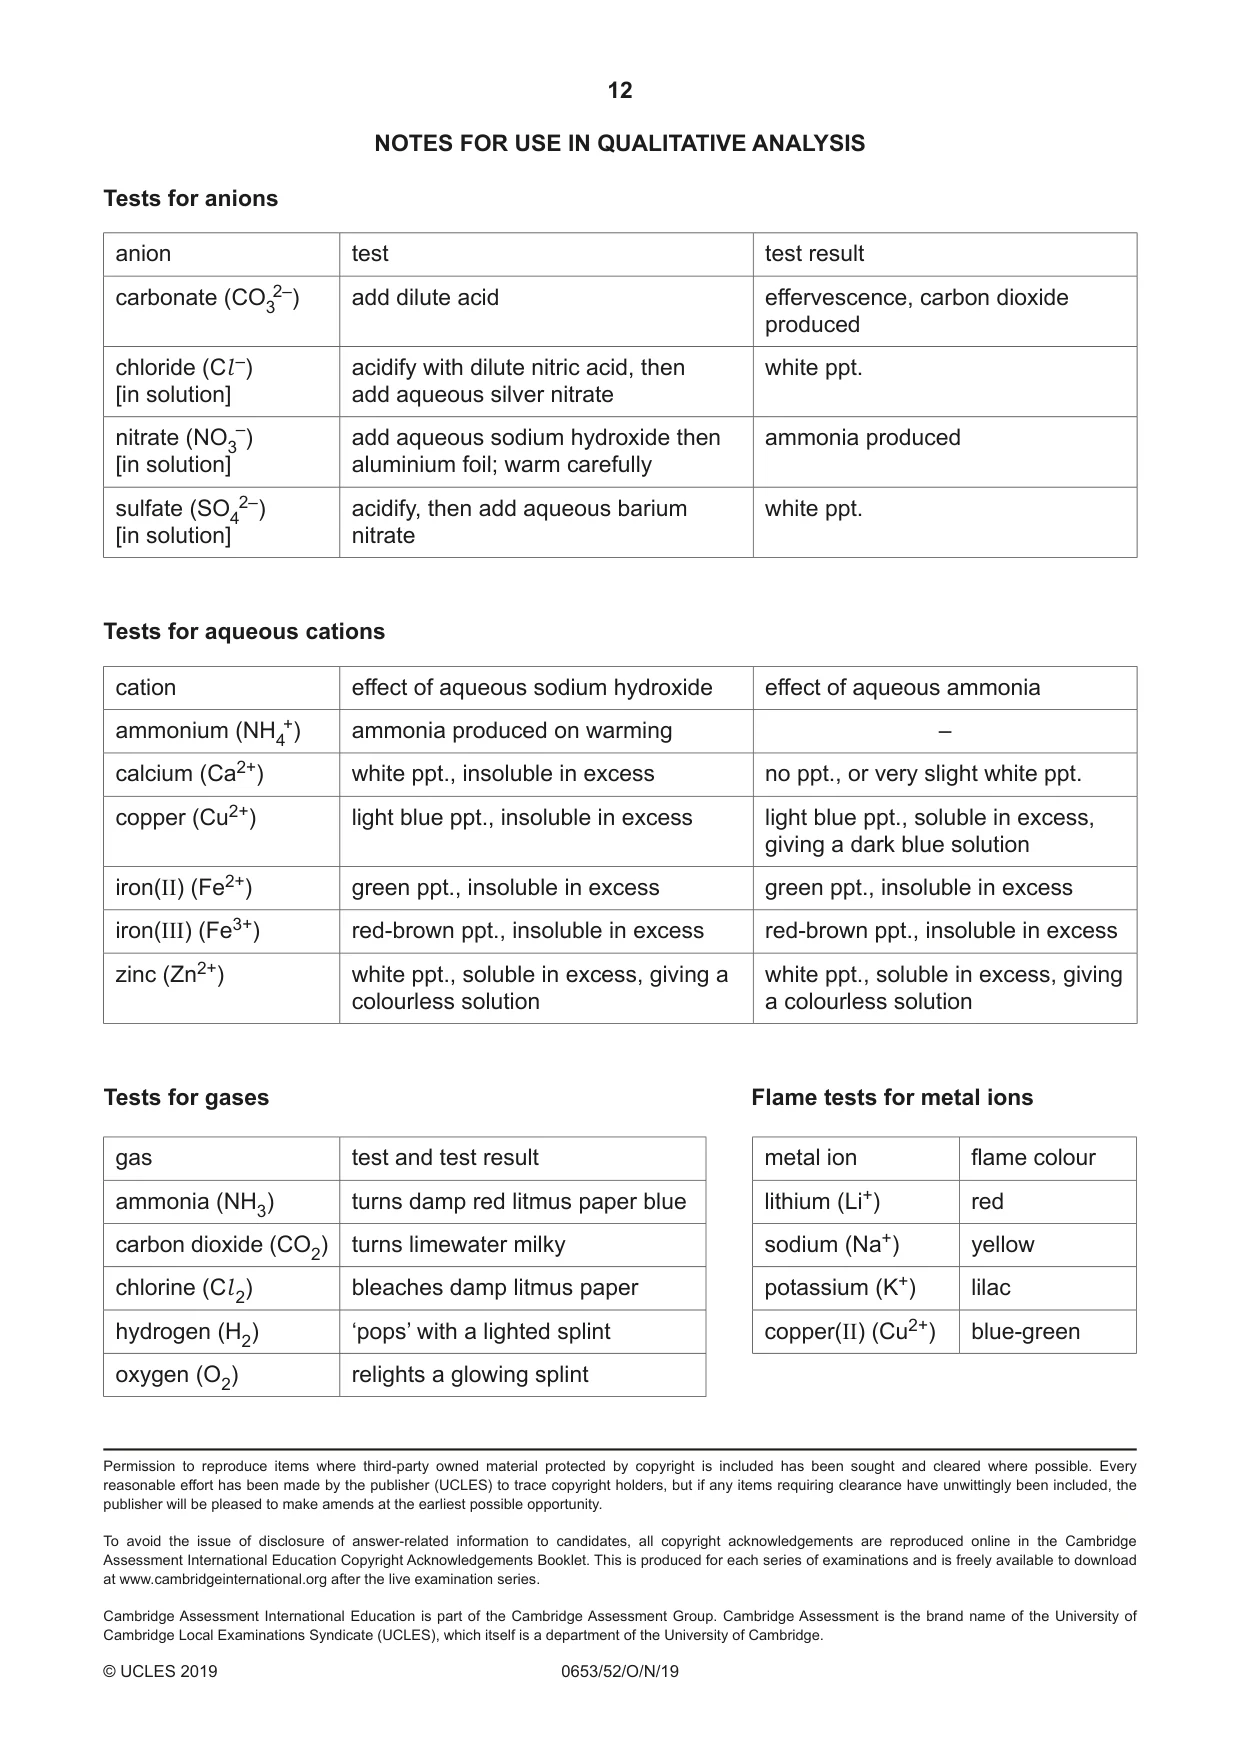
Mark scheme7 pages
Answers below. Sit the paper first if you are practising.
Questions as text
Q1 · You are going to find the concentration of vitamin C in two samples of fruit juice, A and…
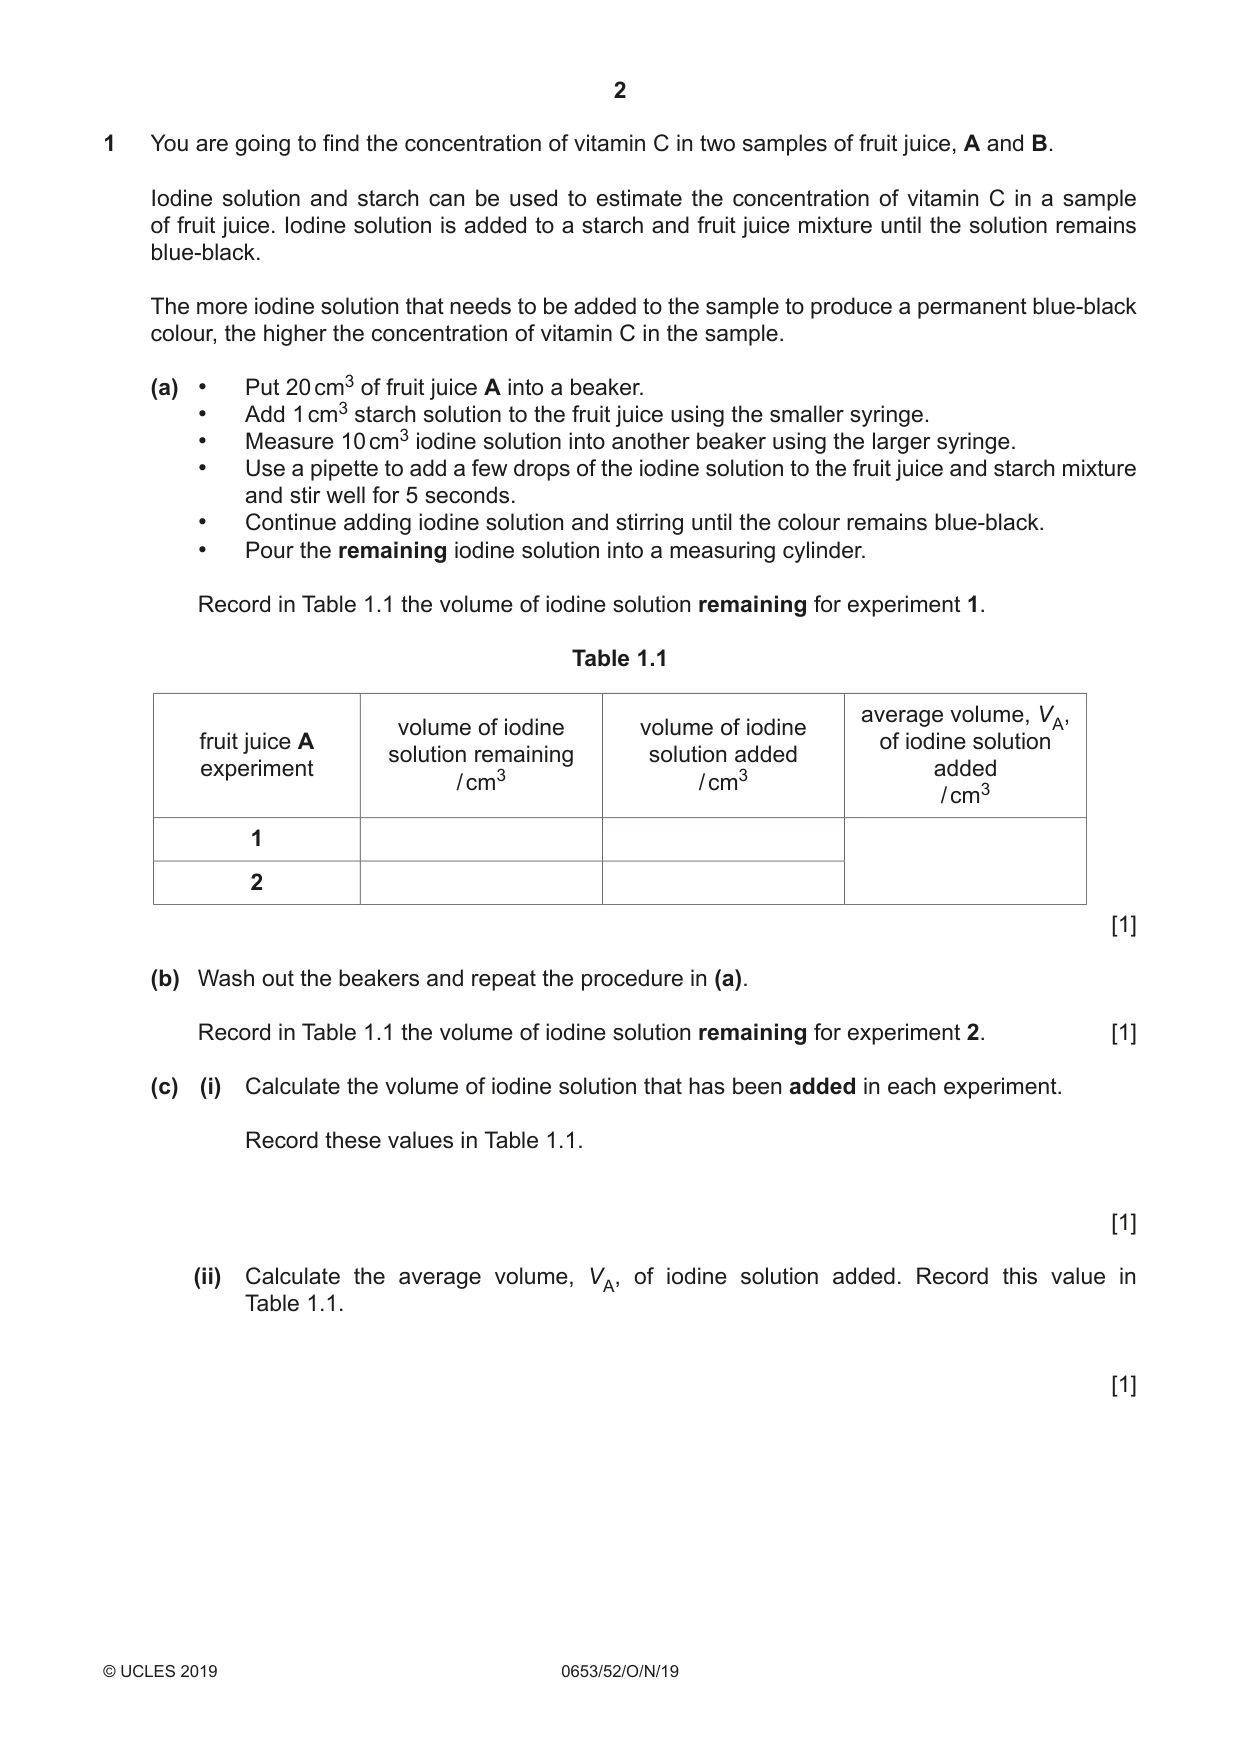
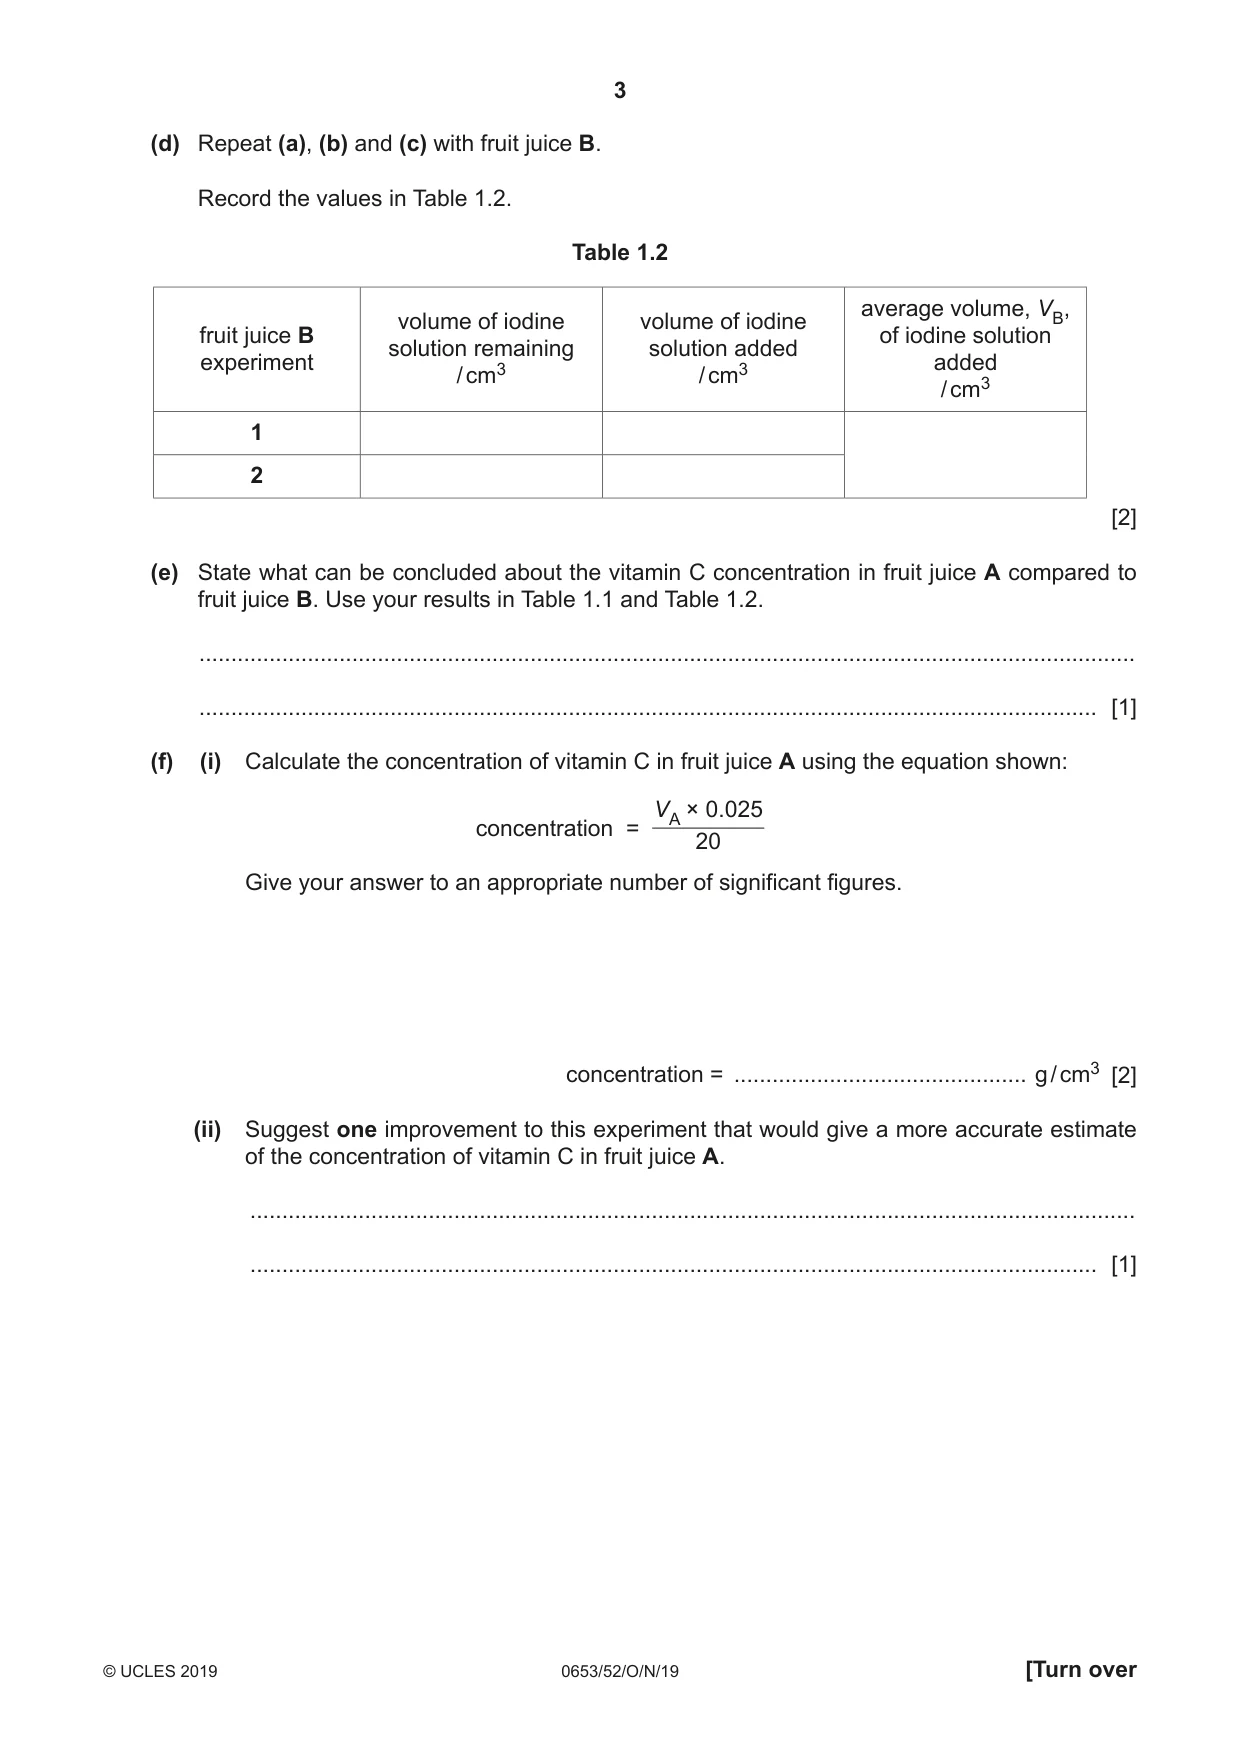
1 You are going to find the concentration of vitamin C in two samples of fruit juice, A and B. Iodine solution and starch can be used to estimate the concentration of vitamin C in a sample of fruit juice. Iodine solution is added to a starch and fruit juice mixture until the solution remains blue-black. The more iodine solution that needs to be added to the sample to produce a permanent blue-black colour, the higher the concentration of vitamin C in the sample. (a) • Put 20 cm3 of fruit juice A into a beaker. • Add 1 cm3 starch solution to the fruit juice using the smaller syringe. • Measure 10 cm3 iodine solution into another beaker using the larger syringe. • Use a pipette to add a few drops of the iodine solution to the fruit juice and starch mixture and stir well for 5 seconds. • Continue adding iodine solution and stirring until the colour remains blue-black. • Pour the remaining iodine solution into a measuring cylinder. Record in Table 1.1 the volume of iodine solution remaining for experiment 1. Table 1.1 average volume, VA, volume of iodine volume of iodine fruit juice A of iodine solution solution remaining solution added experiment added / cm3 / cm3 / cm3 1 2 [1] (b) Wash out the beakers and repeat the procedure in (a). Record in Table 1.1 the volume of iodine solution remaining for experiment 2. [1] (c) (i) Calculate the volume of iodine solution that has been added in each experiment. Record these values in Table 1.1. [1] (ii) Calculate the average volume, VA, of iodine solution added. Record this value in Table 1.1. [1] (d) Repeat (a), (b) and (c) with fruit juice B. Record the values in Table 1.2. Table 1.2 average volume, VB, volume of iodine volume of iodine fruit juice B of iodine solution solution remaining solution added experiment added / cm3 / cm3 / cm3 1 2 [2] (e) State what can be concluded about the vitamin C concentration in fruit juice A compared to fruit juice B. Use your results in Table 1.1 and Table 1.2. ................................................................................................................................................... ............................................................................................................................................. [1] (f) (i) Calculate the concentration of vitamin C in fruit juice A using the equation shown: VA × 0.025 concentration = 20 Give your answer to an appropriate number of significant figures. concentration = .............................................. g / cm3 [2] (ii) Suggest one improvement to this experiment that would give a more accurate estimate of the concentration of vitamin C in fruit juice A. ........................................................................................................................................... ..................................................................................................................................... [1] (g) You are provided with half of a fruit that contains vitamin C. In the box below, make a large detailed drawing of the cut surface of the fruit. [3] [Total: 13]
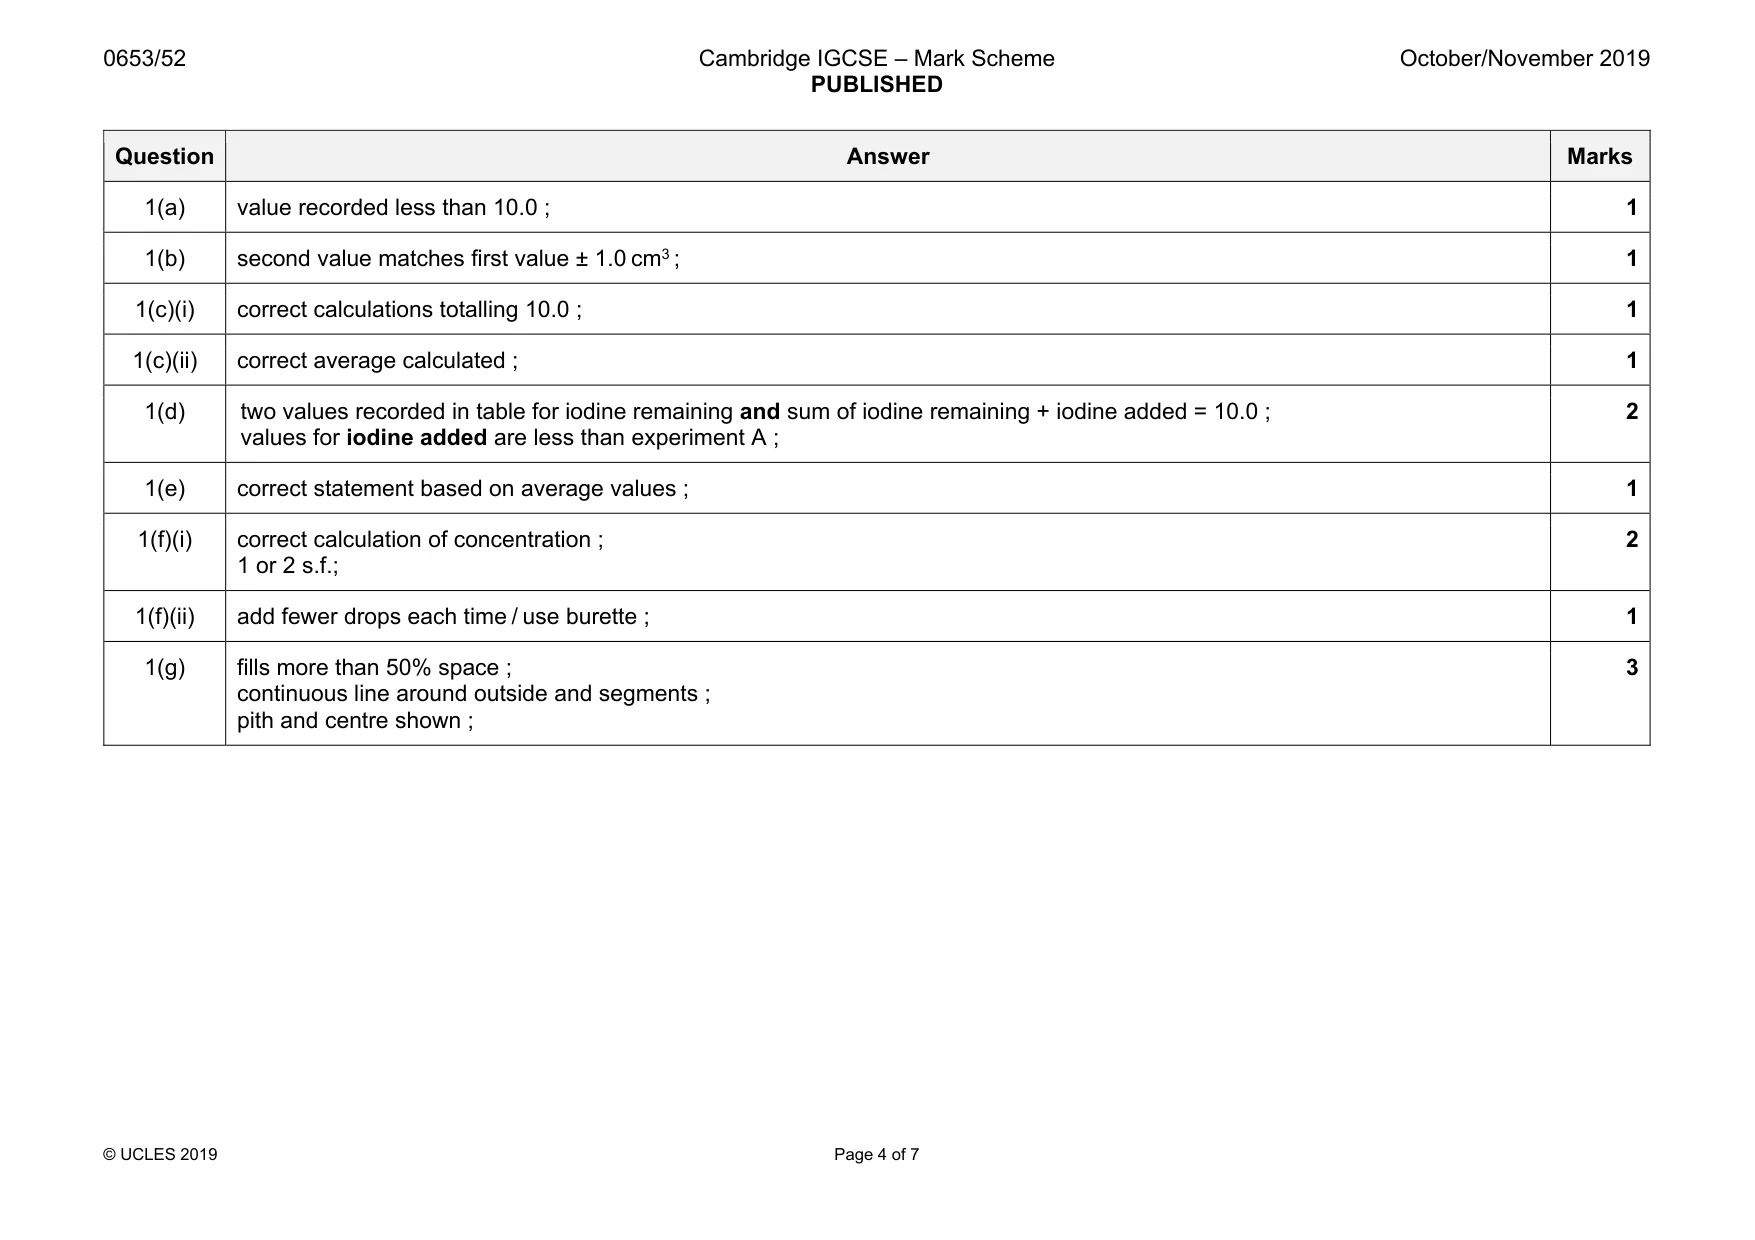
Mark scheme: 1(a) value recorded less than 10.0 ; 1 1(b) second value matches first value ± 1.0 cm3 ; 1 1(c)(i) correct calculations totalling 10.0 ; 1 1(c)(ii) correct average calculated ; 1 1(d) two values recorded in table for iodine remaining and sum of iodine remaining + iodine added = 10.0 ; values for iodine added are less than experiment A ; 2 1(e) correct statement based on average values ; 1 1(f)(i) correct calculation of concentration ; 1 or 2 s.f.; 2 1(f)(ii) add fewer drops each time / use burette ; 1 1(g) fills more than 50% space ; continuous line around outside and segments ; pith and centre shown ; 3
Q2 · You are going to carry out tests on powder E to identify it
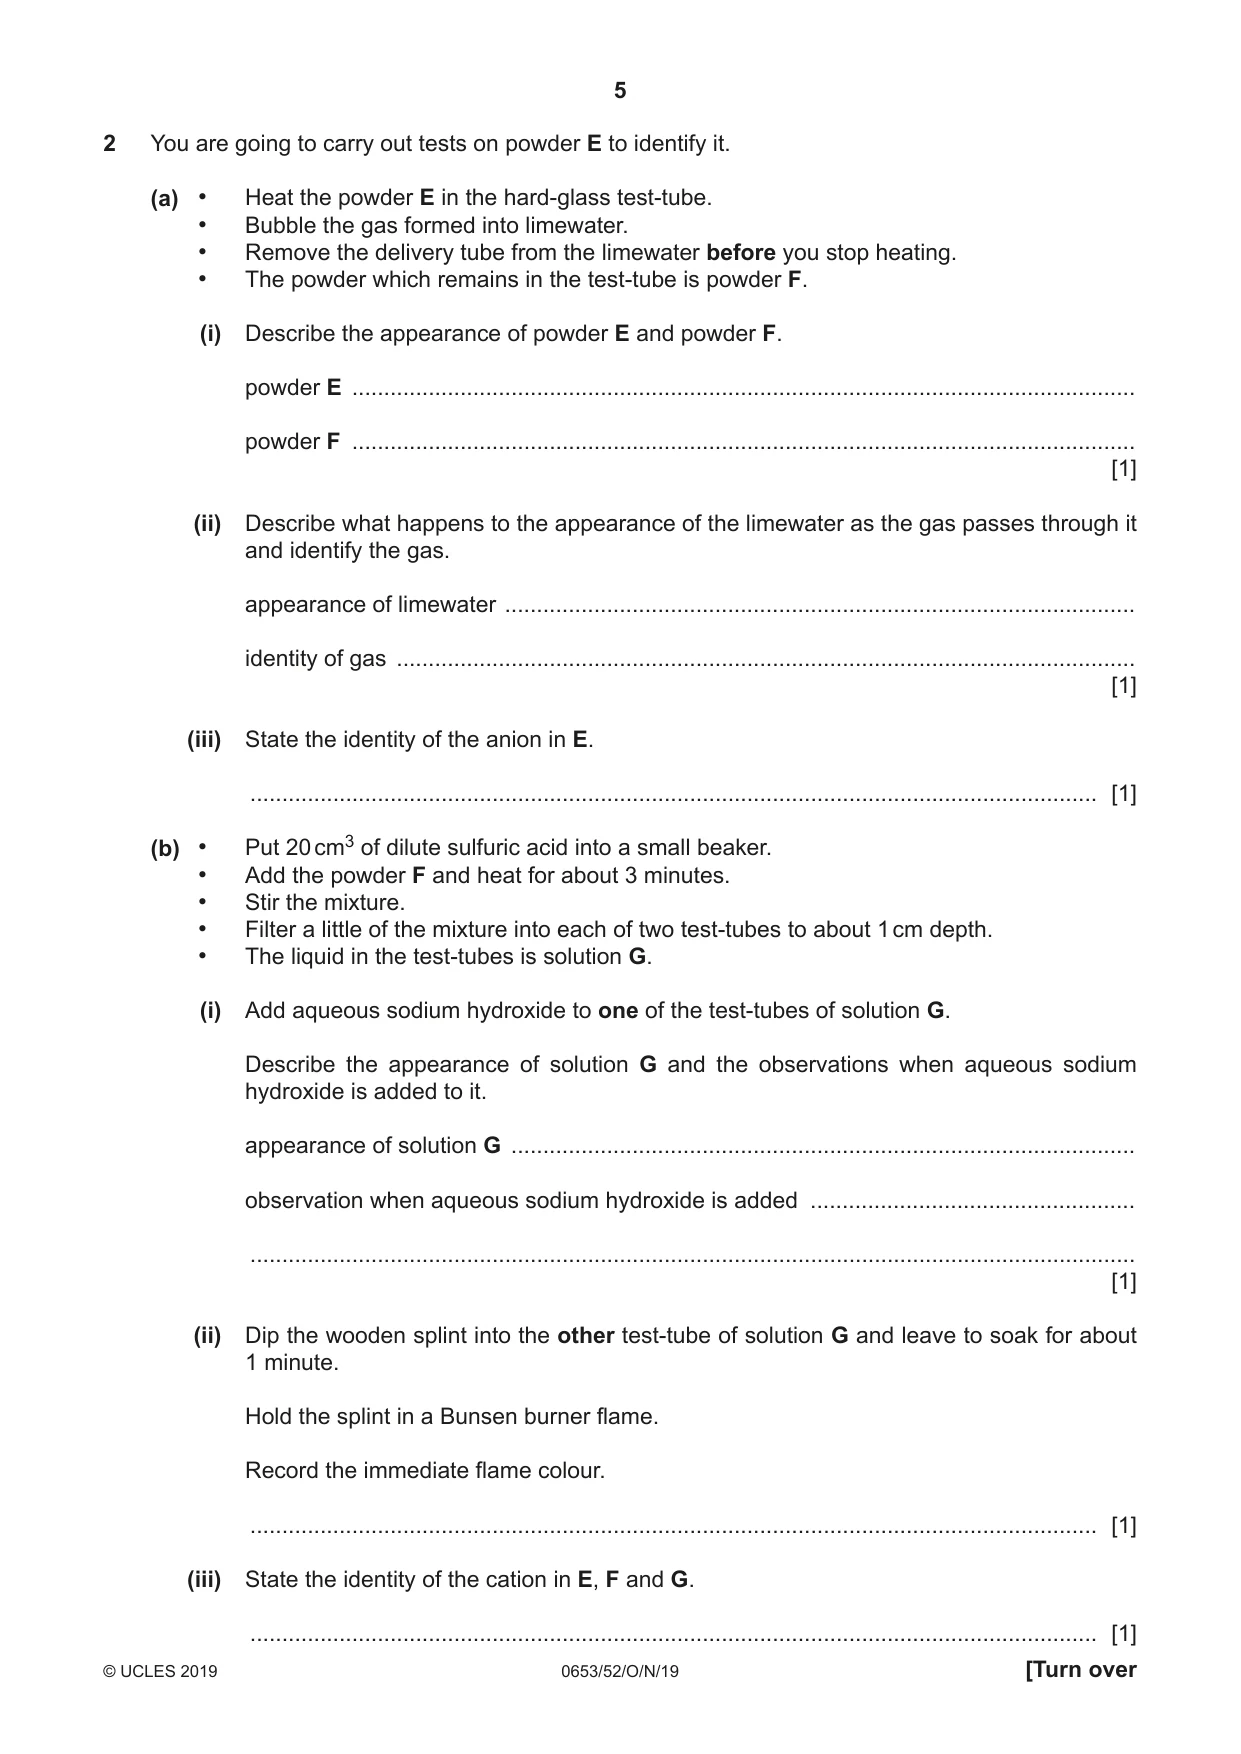
2 You are going to carry out tests on powder E to identify it. (a) • Heat the powder E in the hard-glass test-tube. • Bubble the gas formed into limewater. • Remove the delivery tube from the limewater before you stop heating. • The powder which remains in the test-tube is powder F. (i) Describe the appearance of powder E and powder F. powder E ........................................................................................................................... powder F ........................................................................................................................... [1] (ii) Describe what happens to the appearance of the limewater as the gas passes through it and identify the gas. appearance of limewater ................................................................................................... identity of gas .................................................................................................................... [1] (iii) State the identity of the anion in E. ..................................................................................................................................... [1] (b) • Put 20 cm3 of dilute sulfuric acid into a small beaker. • Add the powder F and heat for about 3 minutes. • Stir the mixture. • Filter a little of the mixture into each of two test-tubes to about 1 cm depth. • The liquid in the test-tubes is solution G. (i) Add aqueous sodium hydroxide to one of the test-tubes of solution G. Describe the appearance of solution G and the observations when aqueous sodium hydroxide is added to it. appearance of solution G .................................................................................................. observation when aqueous sodium hydroxide is added ................................................... ........................................................................................................................................... [1] (ii) Dip the wooden splint into the other test-tube of solution G and leave to soak for about 1 minute. Hold the splint in a Bunsen burner flame. Record the immediate flame colour. ..................................................................................................................................... [1] (iii) State the identity of the cation in E, F and G. ..................................................................................................................................... [1] (c) Describe an alternative test that you could use to identify the cation in solution G. State the observation for a positive result. Do not carry out this test. test ............................................................................................................................................ observation ............................................................................................................................... ................................................................................................................................................... [1] [Total: 7]
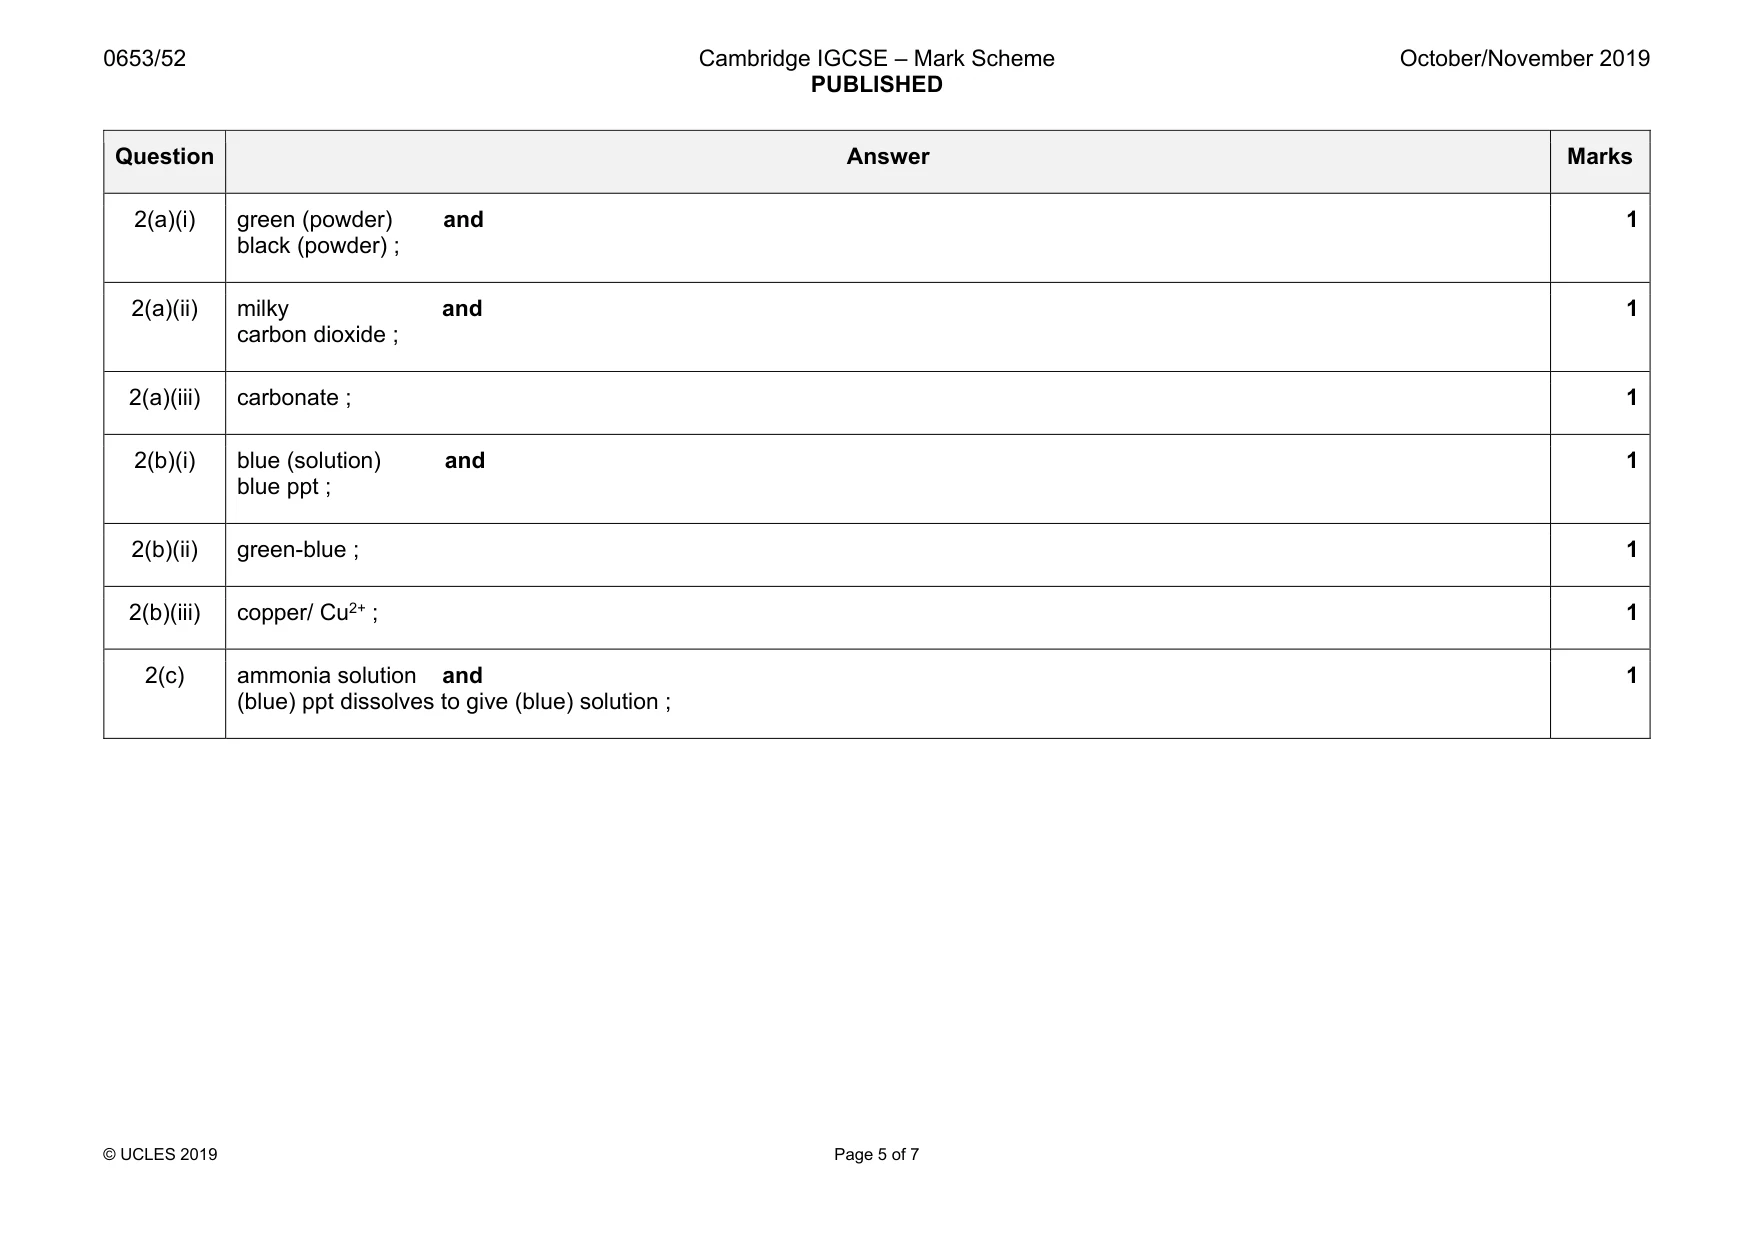
Mark scheme: 2(a)(i) green (powder) and black (powder) ; 1 2(a)(ii) milky and carbon dioxide ; 1 2(a)(iii) carbonate ; 1 2(b)(i) blue (solution) and blue ppt ; 1 2(b)(ii) green-blue ; 1 2(b)(iii) copper/ Cu2+ ; 1 2(c) ammonia solution and (blue) ppt dissolves to give (blue) solution ; 1
Q3 · Fizzy drinks are fizzy because they have carbon dioxide dissolved in them
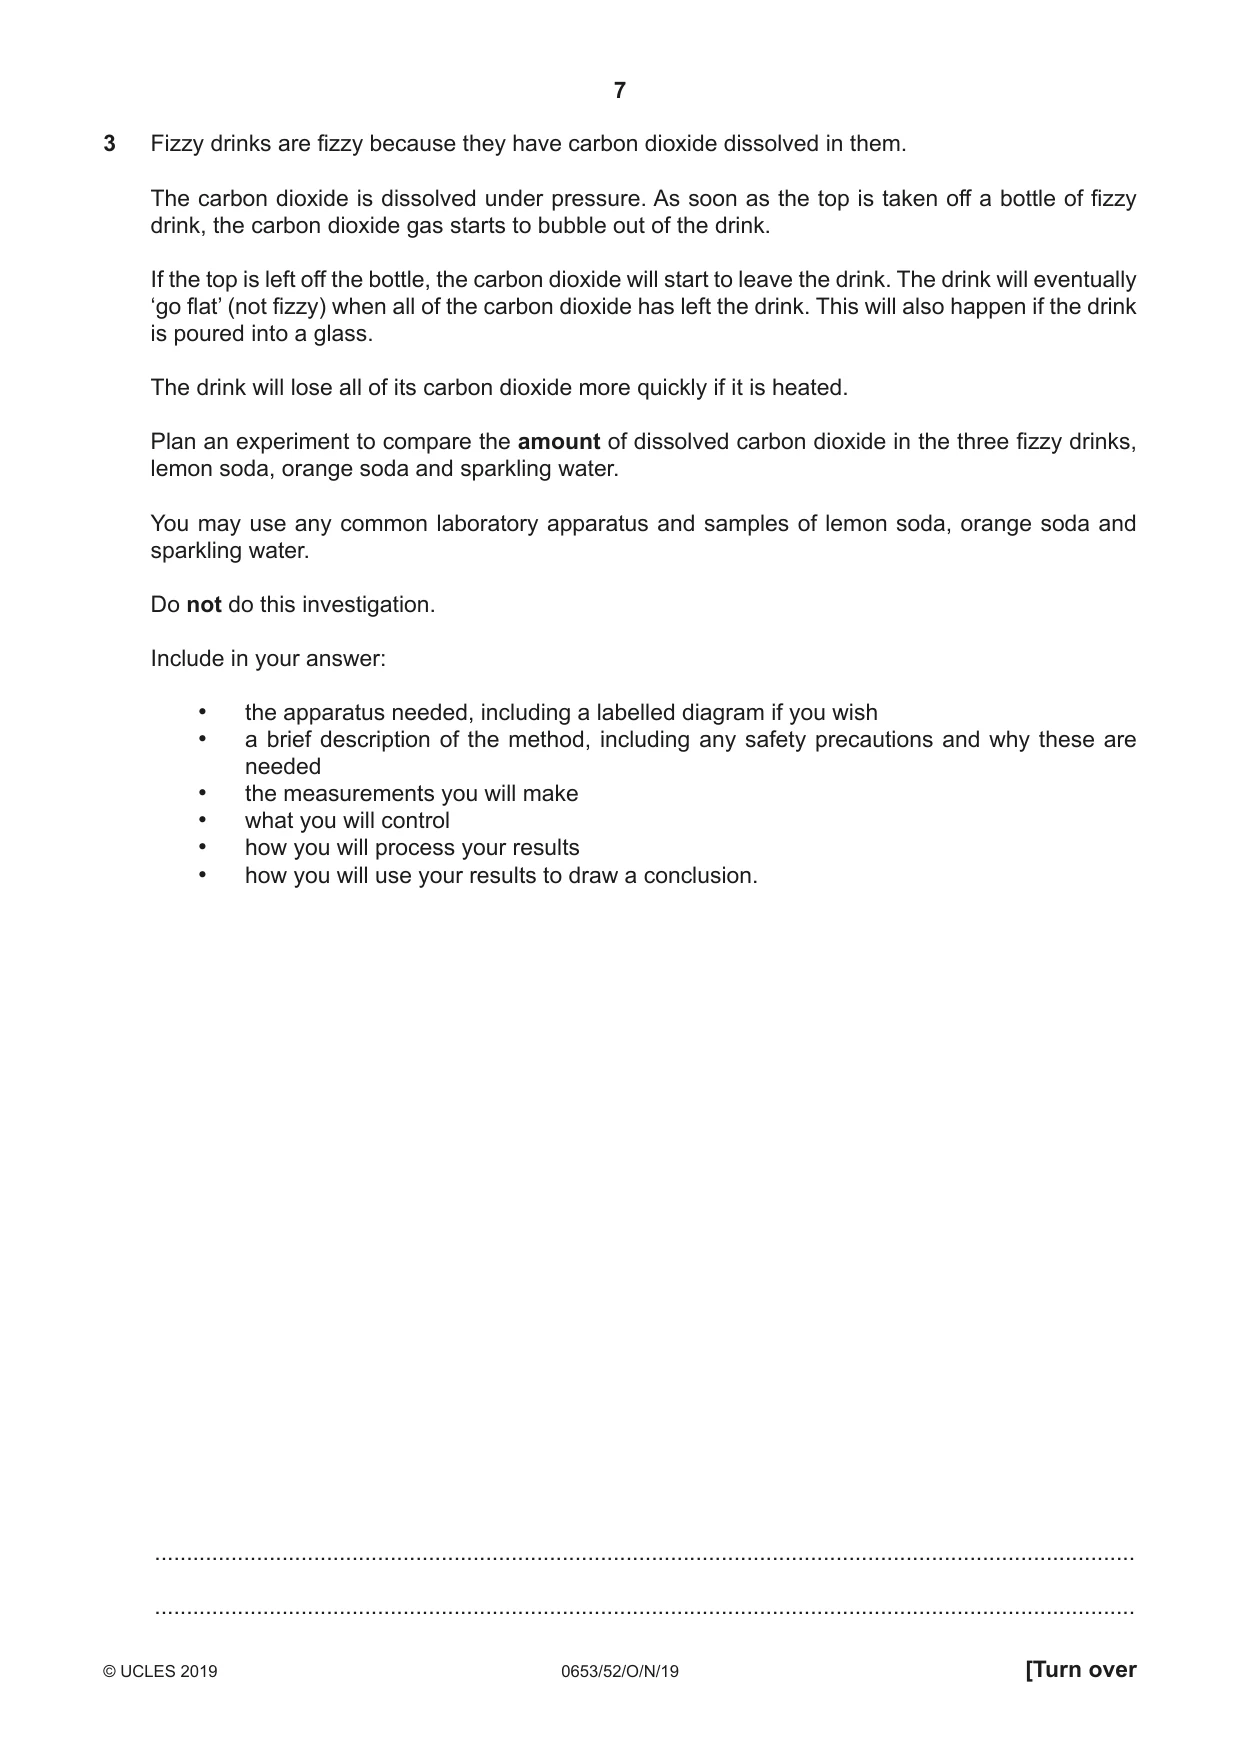
3 Fizzy drinks are fizzy because they have carbon dioxide dissolved in them. The carbon dioxide is dissolved under pressure. As soon as the top is taken off a bottle of fizzy drink, the carbon dioxide gas starts to bubble out of the drink. If the top is left off the bottle, the carbon dioxide will start to leave the drink. The drink will eventually ‘go flat’ (not fizzy) when all of the carbon dioxide has left the drink. This will also happen if the drink is poured into a glass. The drink will lose all of its carbon dioxide more quickly if it is heated. Plan an experiment to compare the amount of dissolved carbon dioxide in the three fizzy drinks, lemon soda, orange soda and sparkling water. You may use any common laboratory apparatus and samples of lemon soda, orange soda and sparkling water. Do not do this investigation. Include in your answer: • the apparatus needed, including a labelled diagram if you wish • a brief description of the method, including any safety precautions and why these are needed • the measurements you will make • what you will control • how you will process your results • how you will use your results to draw a conclusion. .......................................................................................................................................................... .......................................................................................................................................................... .......................................................................................................................................................... .......................................................................................................................................................... .......................................................................................................................................................... .......................................................................................................................................................... .......................................................................................................................................................... .......................................................................................................................................................... .......................................................................................................................................................... .......................................................................................................................................................... .......................................................................................................................................................... .......................................................................................................................................................... .......................................................................................................................................................... .......................................................................................................................................................... .......................................................................................................................................................... .......................................................................................................................................................... .......................................................................................................................................................... .......................................................................................................................................................... .......................................................................................................................................................... .......................................................................................................................................................... .......................................................................................................................................................... .......................................................................................................................................................... .................................................................................................................................................... [7]
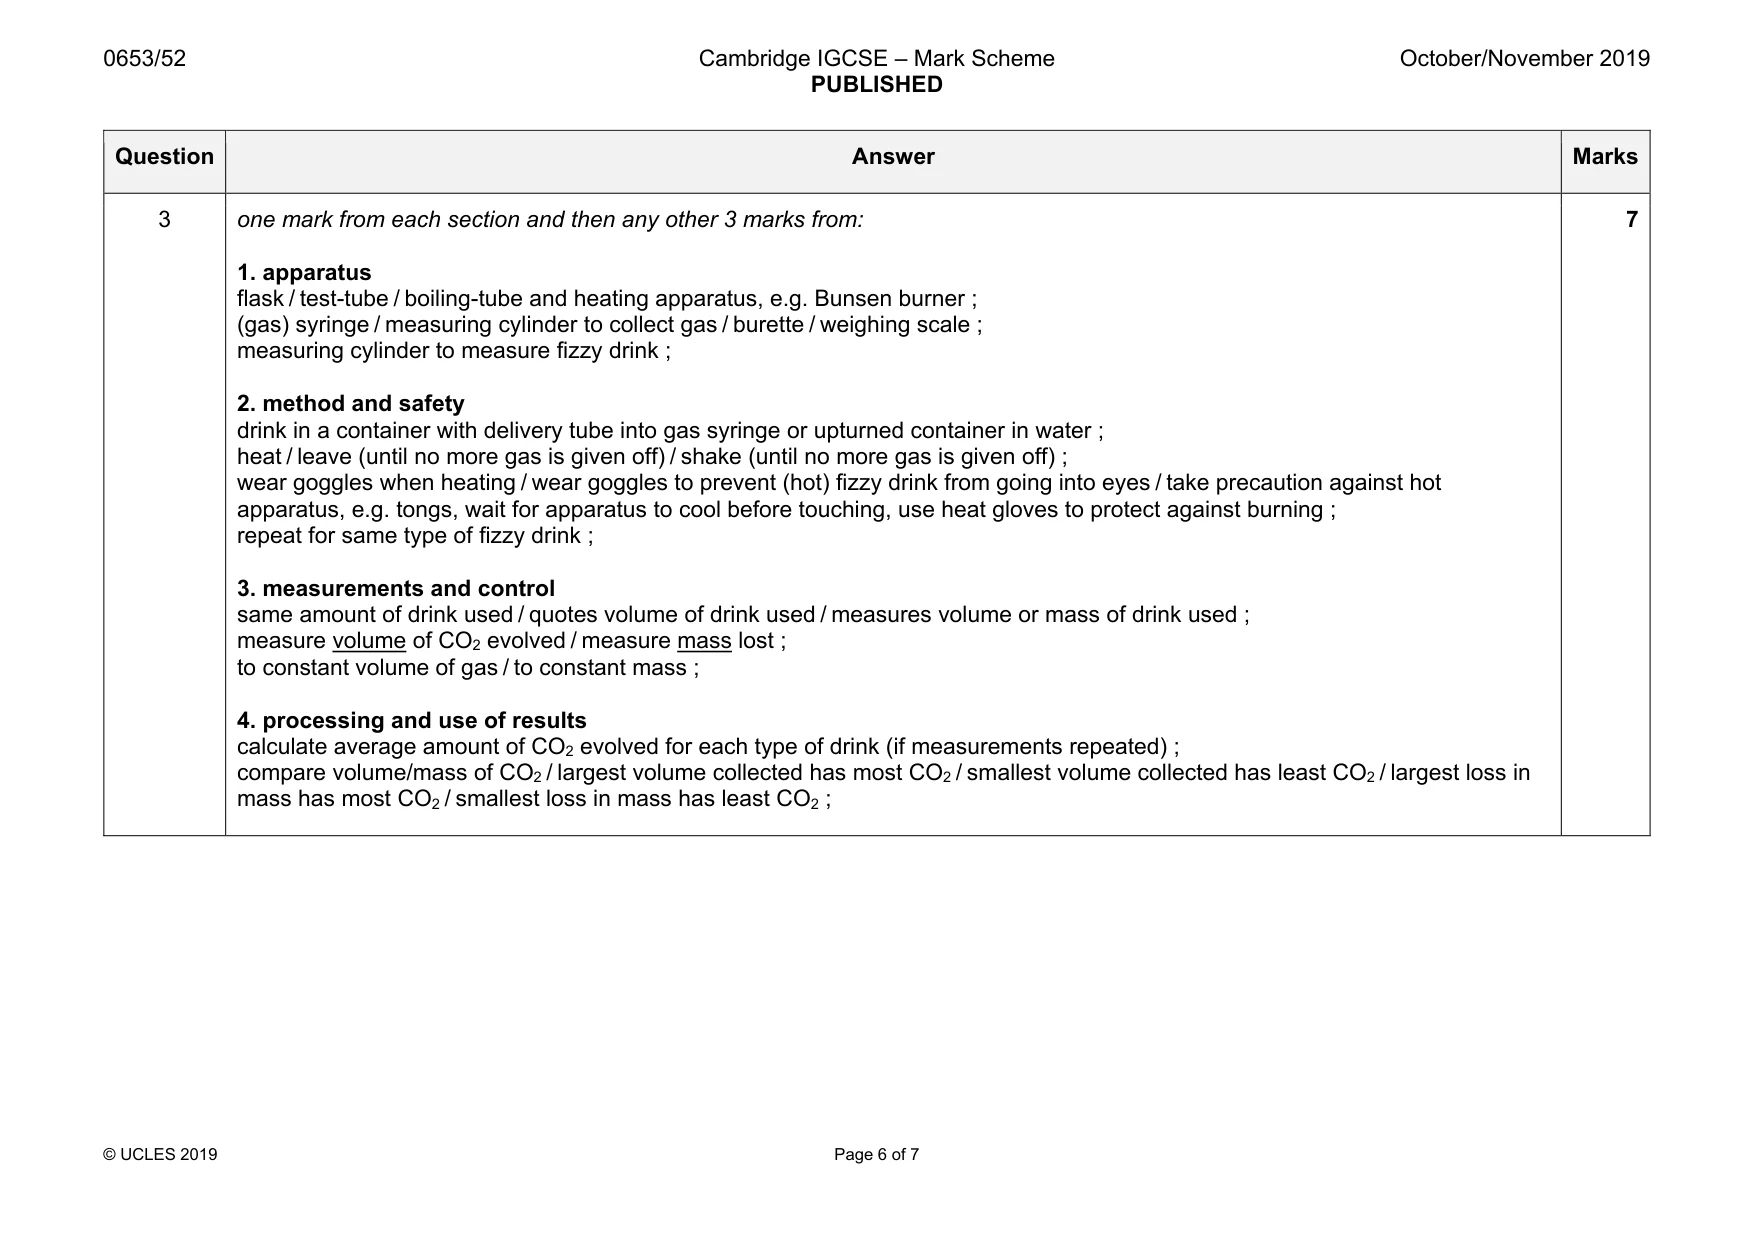
Mark scheme: 3 one mark from each section and then any other 3 marks from: 1. apparatus flask / test-tube / boiling-tube and heating apparatus, e.g. Bunsen burner ; (gas) syringe / measuring cylinder to collect gas / burette / weighing scale ; measuring cylinder to measure fizzy drink ; 2. method and safety drink in a container with delivery tube into gas syringe or upturned container in water ; heat / leave (until no more gas is given off) / shake (until no more gas is given off) ; wear goggles when heating / wear goggles to prevent (hot) fizzy drink from going into eyes / take precaution against hot apparatus, e.g. tongs, wait for apparatus to cool before touching, use heat gloves to protect against burning ; repeat for same type of fizzy drink ; 3. measurements and control same amount of drink used / quotes volume of drink used / measures volume or mass of drink used ; measure volume of CO2 evolved / measure mass lost ; to constant volume of gas / to constant mass ; 4. processing and use of results calculate average amount of CO2 evolved for each type of drink (if measurements repeated) ; compare volume/mass of CO2 / largest volume collected has most CO2 / smallest volume collected has least CO2 / largest loss in mass has most CO2 / smallest loss in mass has least CO2 ; 7
Q4 · You are going to investigate how the period of a simple pendulum changes as its length…
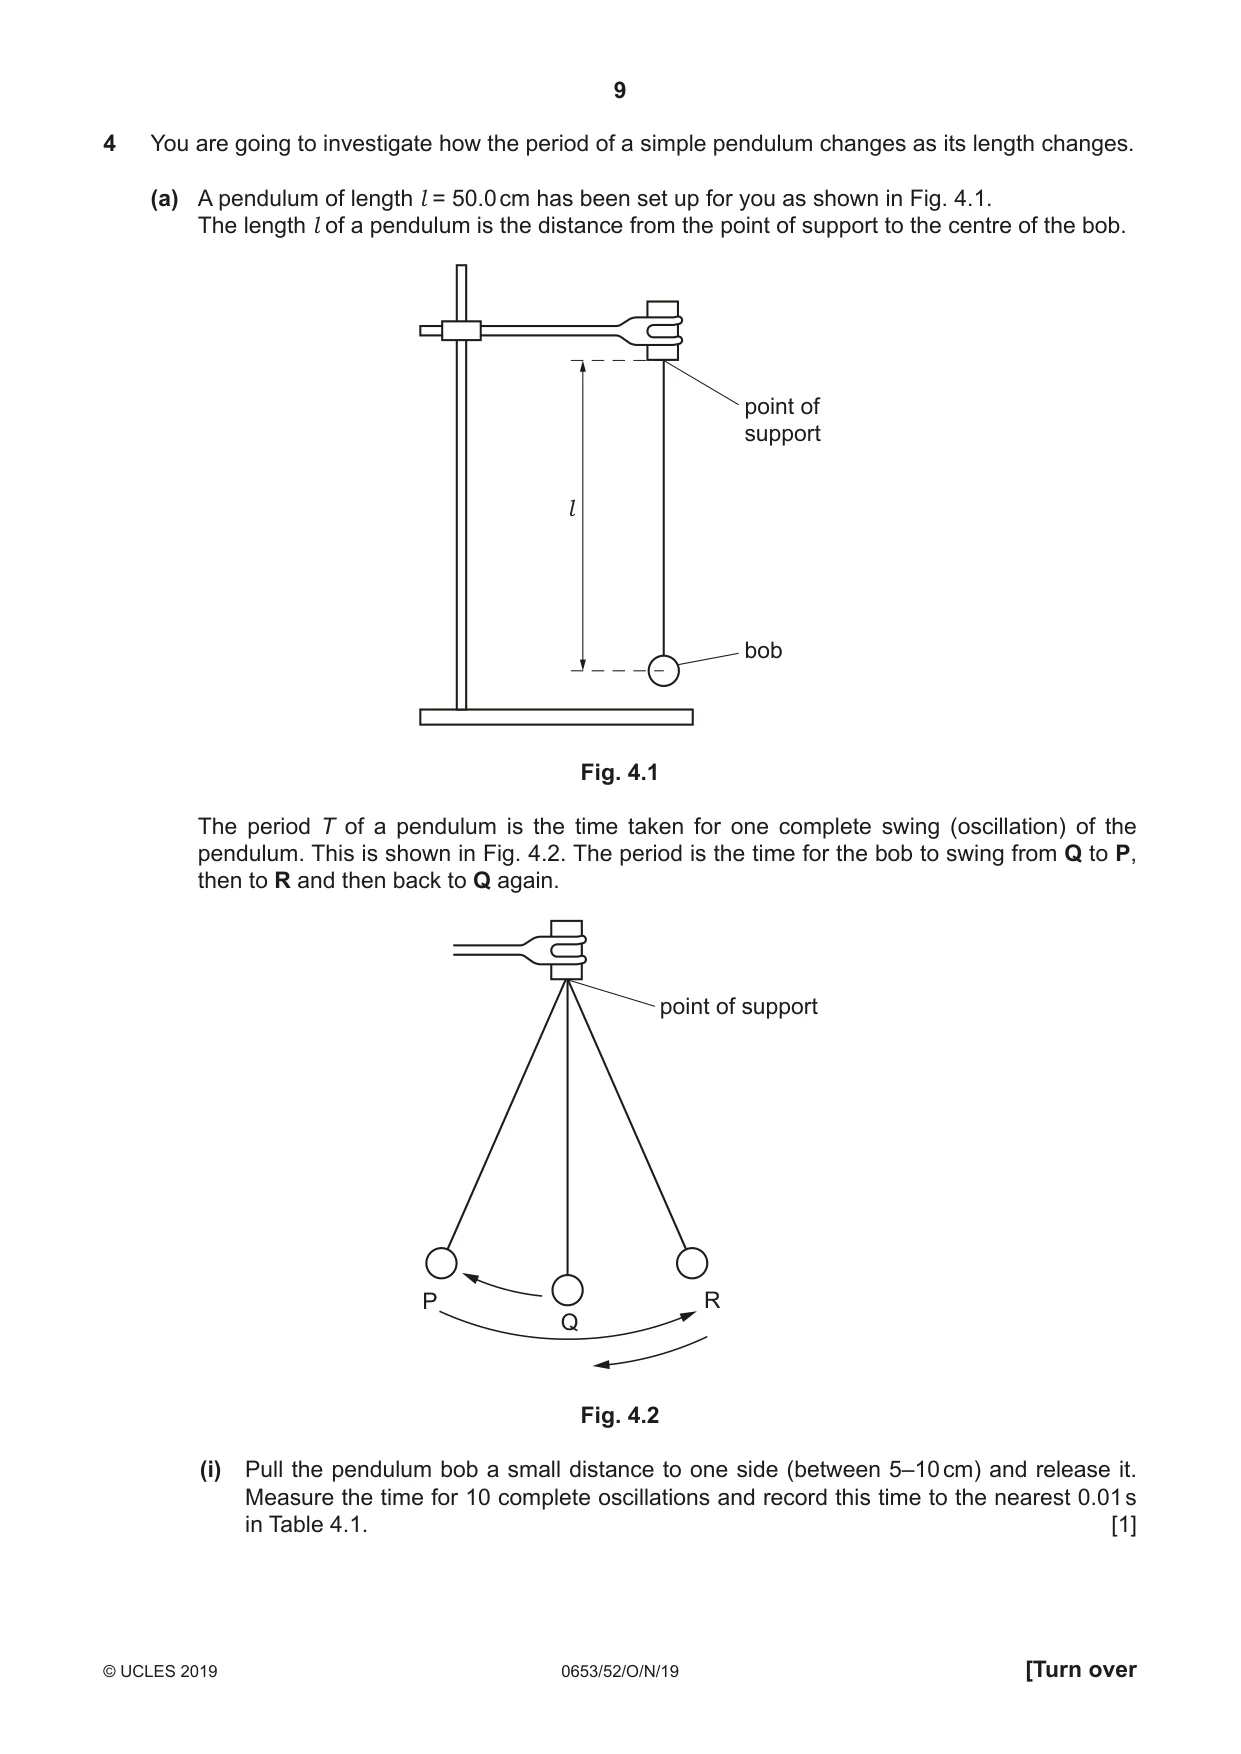
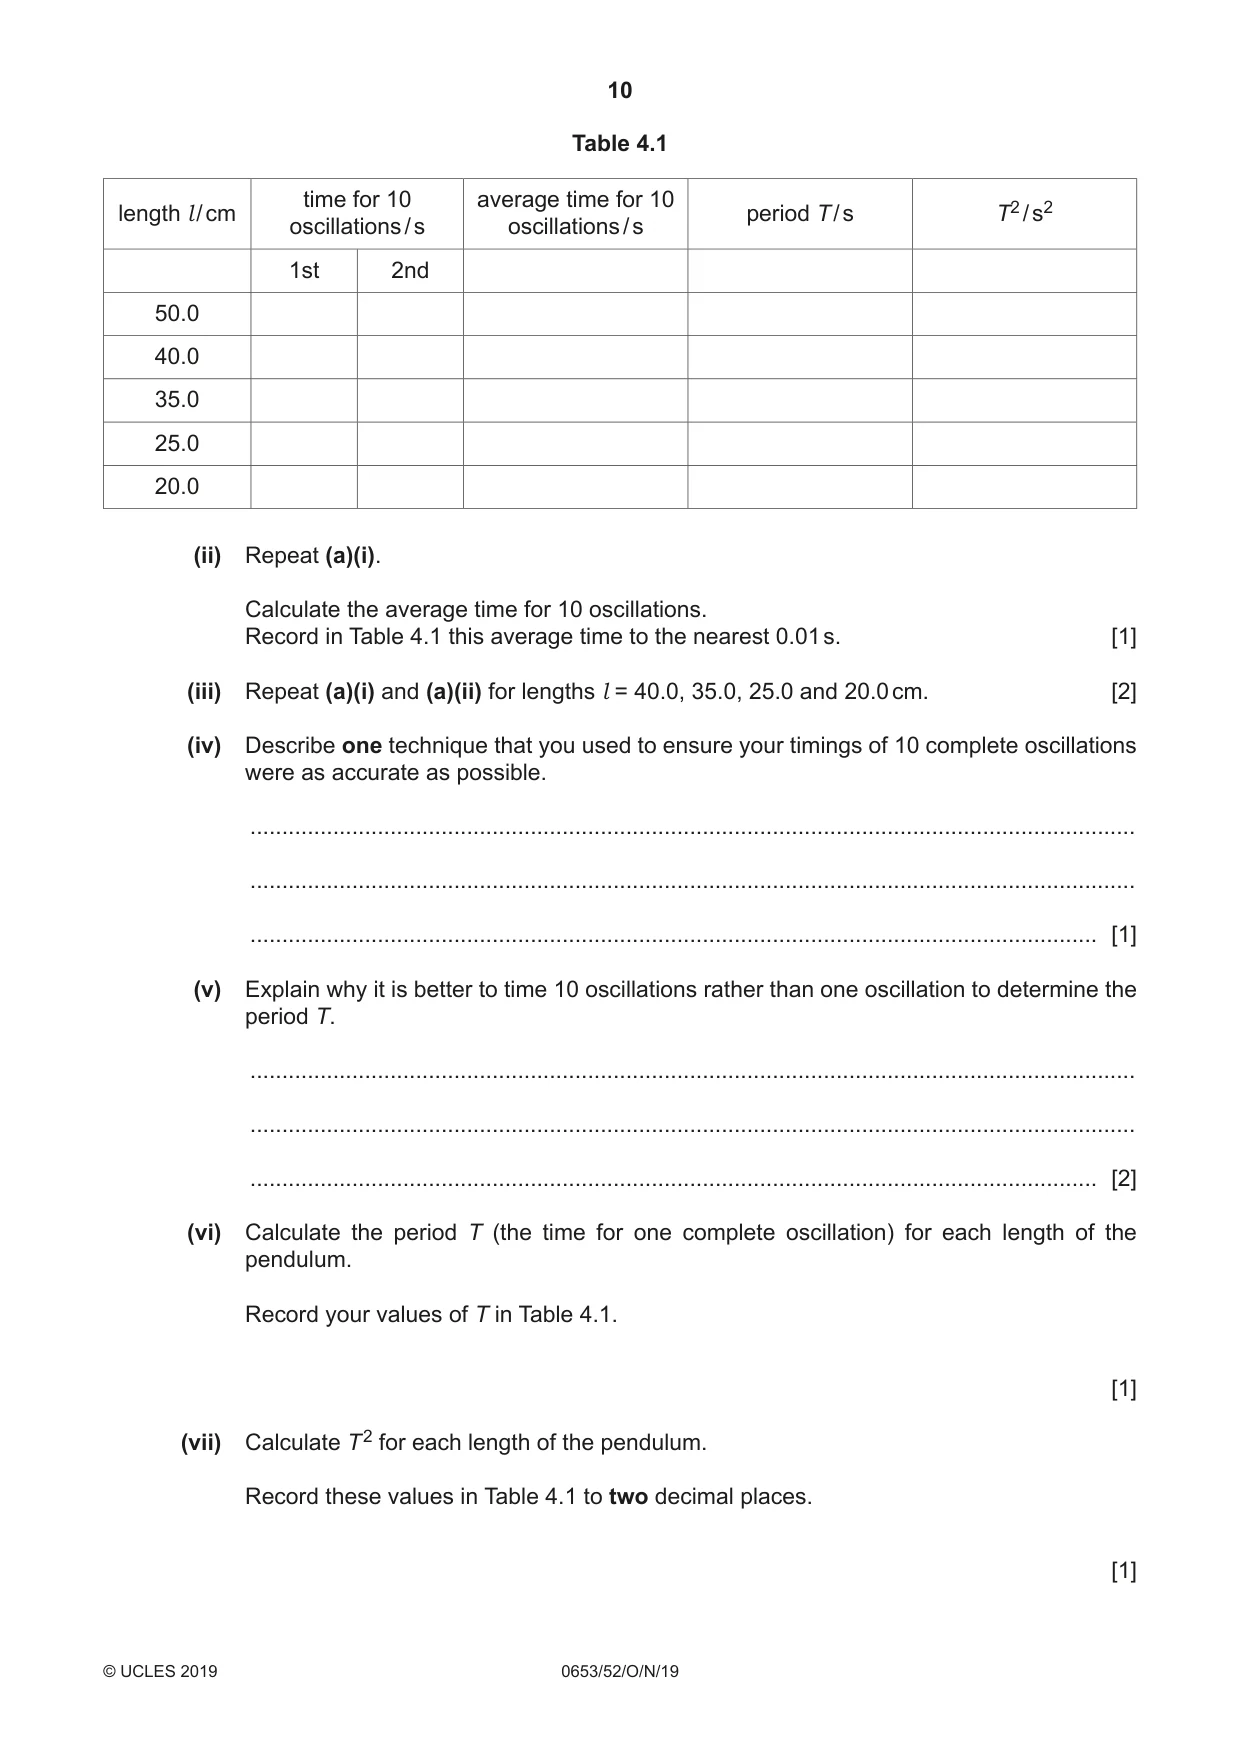
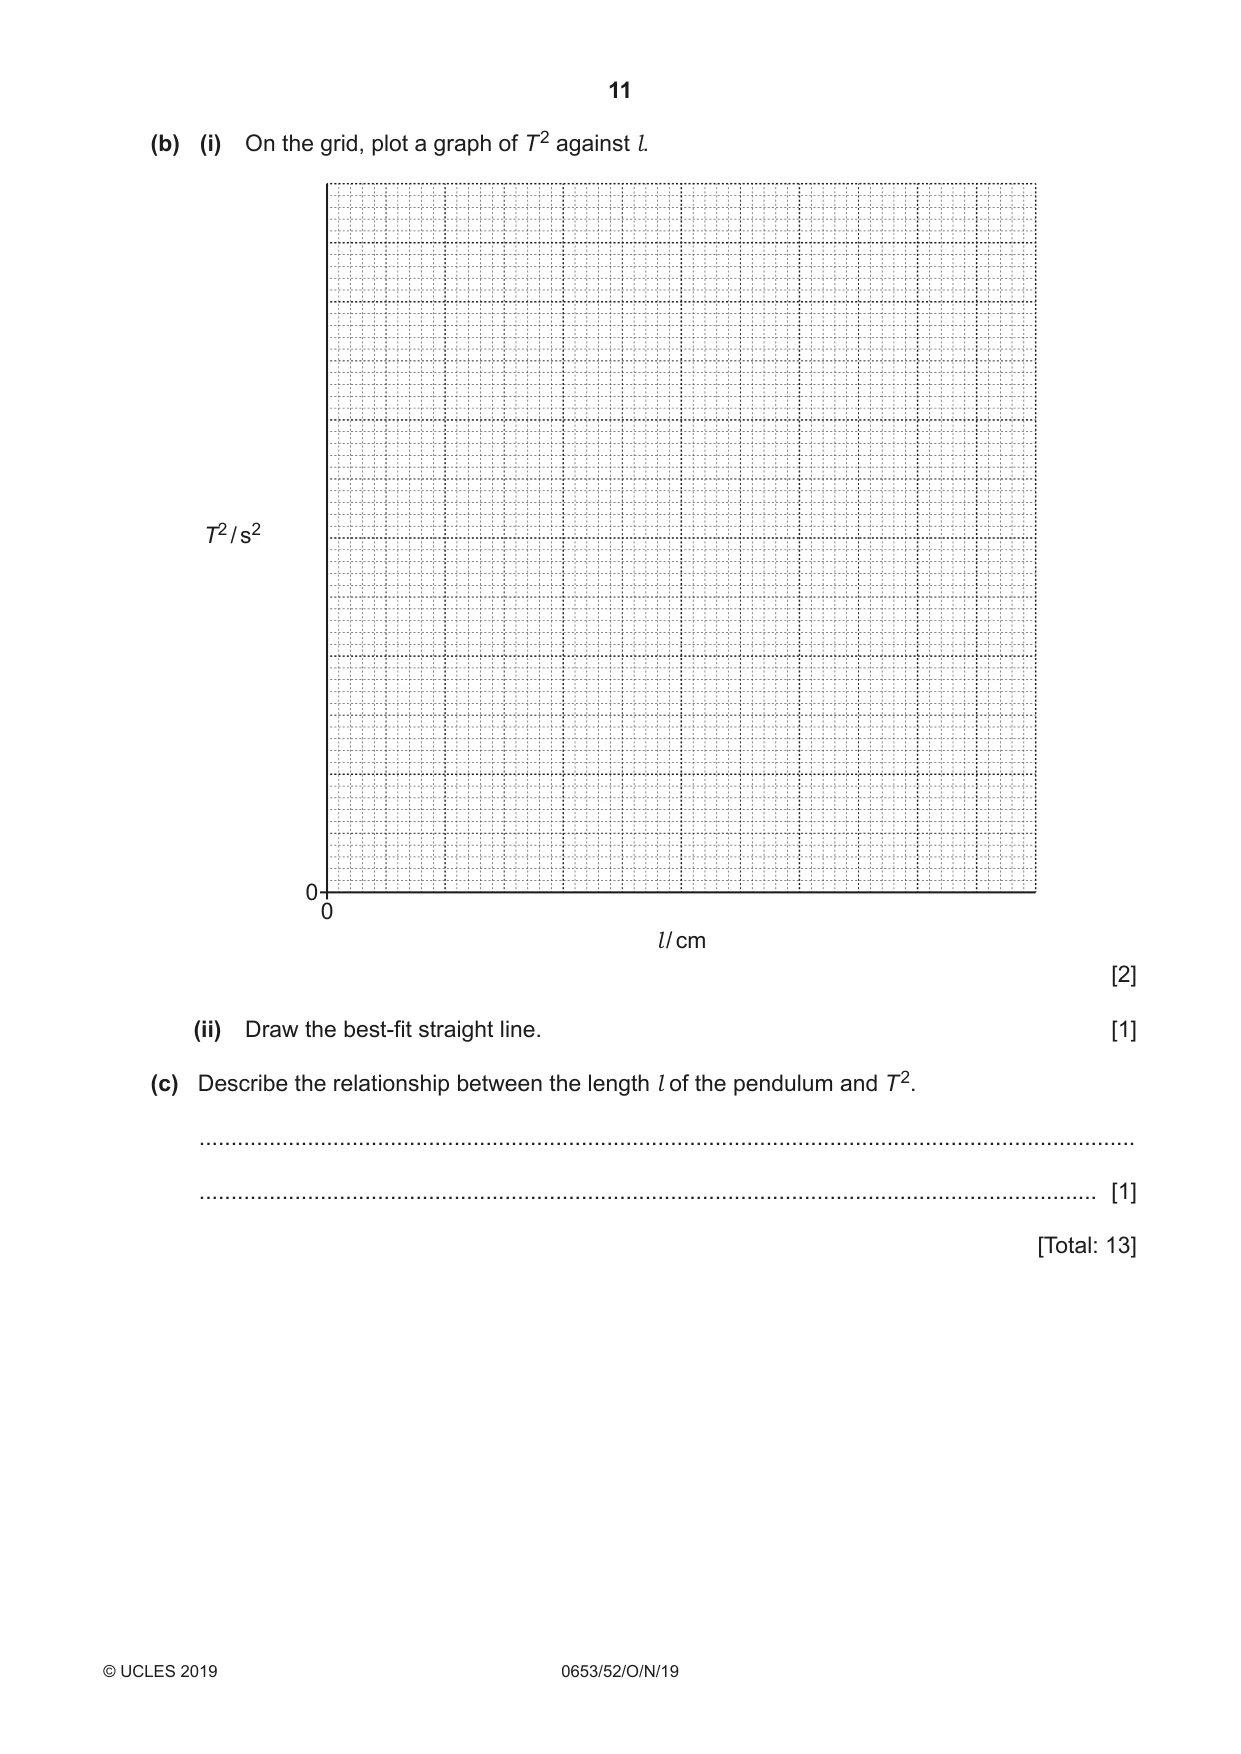
4 You are going to investigate how the period of a simple pendulum changes as its length changes. (a) A pendulum of length l = 50.0 cm has been set up for you as shown in Fig. 4.1. The length l of a pendulum is the distance from the point of support to the centre of the bob. point of support l bob Fig. 4.1 The period T of a pendulum is the time taken for one complete swing (oscillation) of the pendulum. This is shown in Fig. 4.2. The period is the time for the bob to swing from Q to P, then to R and then back to Q again. point of support P R Q Fig. 4.2 (i) Pull the pendulum bob a small distance to one side (between 5–10 cm) and release it. Measure the time for 10 complete oscillations and record this time to the nearest 0.01 s in Table 4.1. [1] Table 4.1 time for 10 average time for 10length l / cm period T / s T2 / s2 oscillations / s oscillations / s 1st 2nd 50.0 40.0 35.0 25.0 20.0 (ii) Repeat (a)(i). Calculate the average time for 10 oscillations. Record in Table 4.1 this average time to the nearest 0.01 s. [1] (iii) Repeat (a)(i) and (a)(ii) for lengths l = 40.0, 35.0, 25.0 and 20.0 cm. [2] (iv) Describe one technique that you used to ensure your timings of 10 complete oscillations were as accurate as possible. ........................................................................................................................................... ........................................................................................................................................... ..................................................................................................................................... [1] (v) Explain why it is better to time 10 oscillations rather than one oscillation to determine the period T. ........................................................................................................................................... ........................................................................................................................................... ..................................................................................................................................... [2] (vi) Calculate the period T (the time for one complete oscillation) for each length of the pendulum. Record your values of T in Table 4.1. [1] (vii) Calculate T 2 for each length of the pendulum. Record these values in Table 4.1 to two decimal places. [1] (b) (i) On the grid, plot a graph of T 2 against l. T2 / s2 0 0 l / cm [2] (ii) Draw the best-fit straight line. [1] (c) Describe the relationship between the length l of the pendulum and T 2. ................................................................................................................................................... ............................................................................................................................................. [1] [Total: 13]
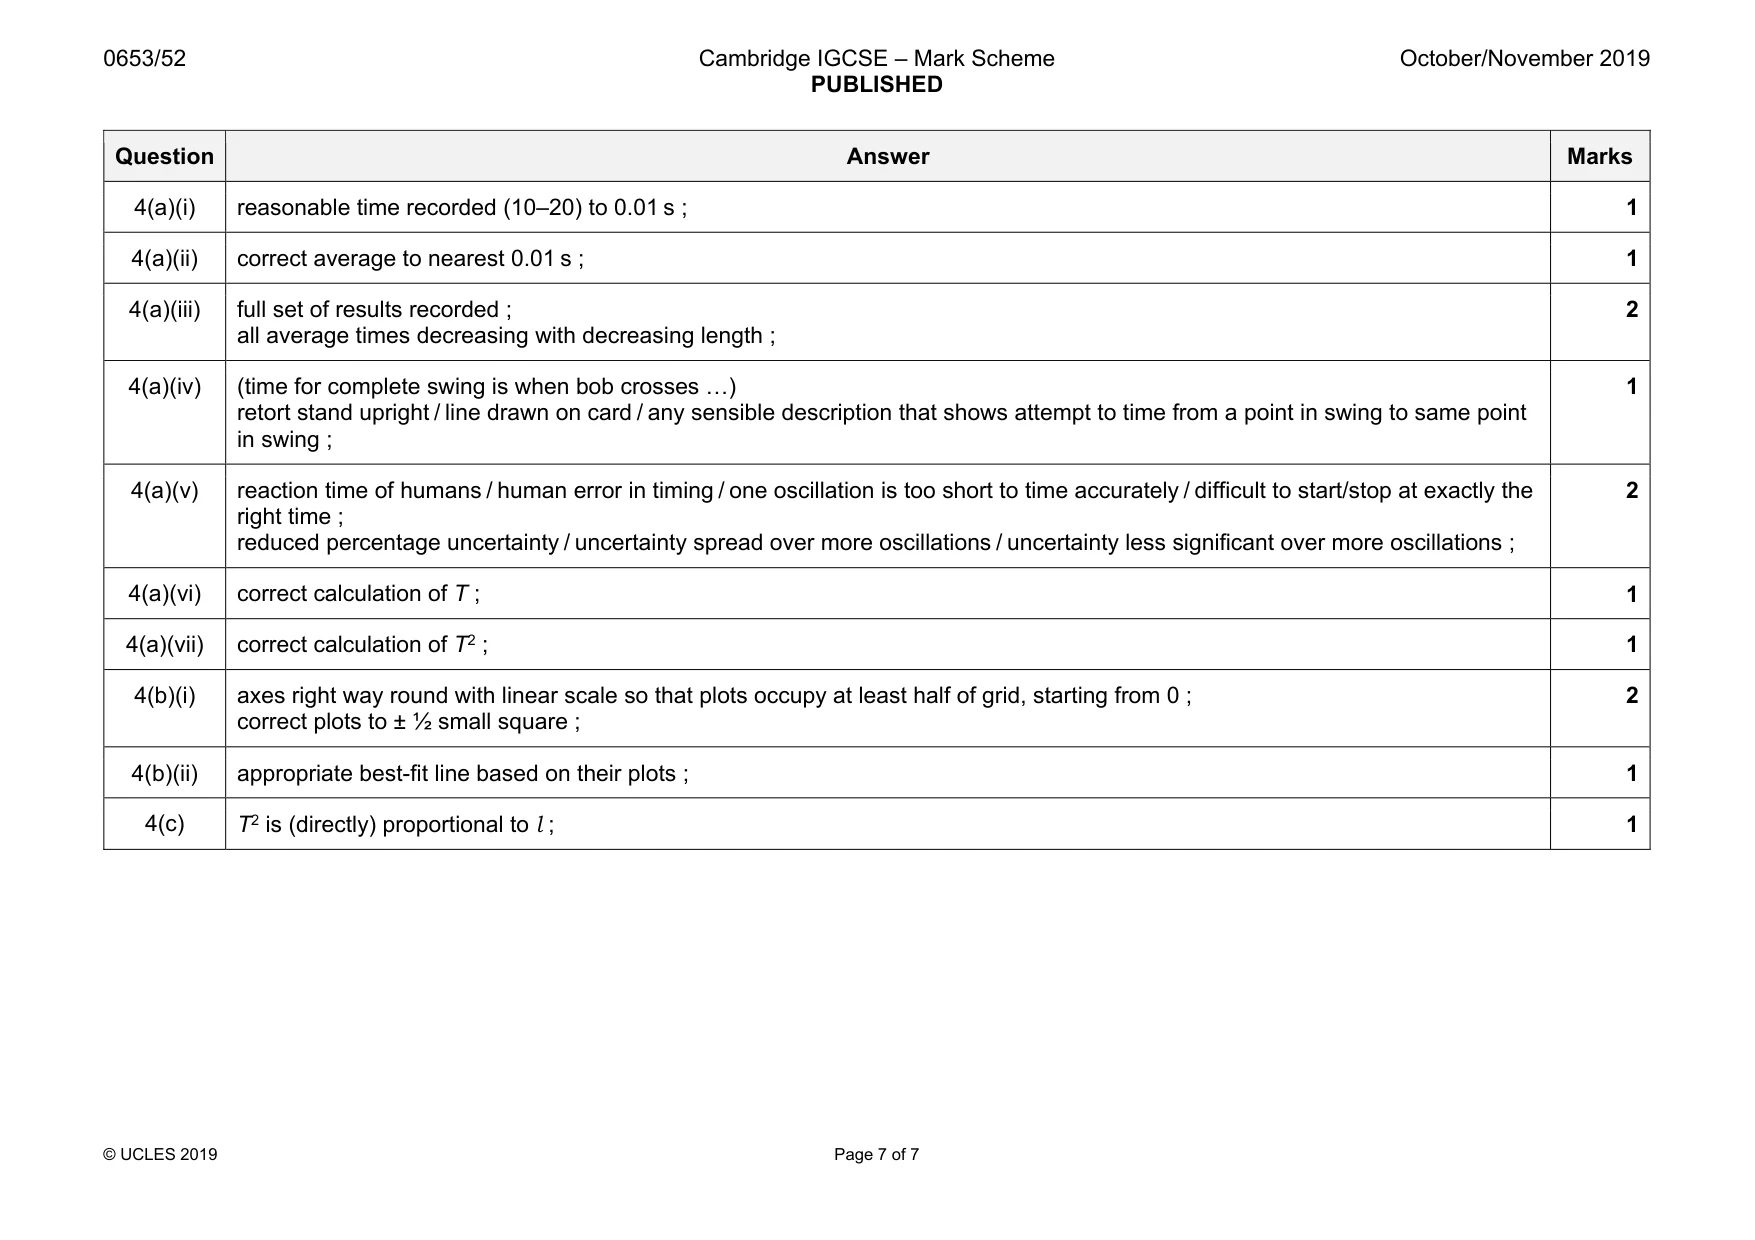
Mark scheme: 4(a)(i) reasonable time recorded (10–20) to 0.01 s ; 1 4(a)(ii) correct average to nearest 0.01 s ; 1 4(a)(iii) full set of results recorded ; all average times decreasing with decreasing length ; 2 4(a)(iv) (time for complete swing is when bob crosses «) retort stand upright / line drawn on card / any sensible description that shows attempt to time from a point in swing to same point in swing ; 1 4(a)(v) reaction time of humans / human error in timing / one oscillation is too short to time accurately / difficult to start/stop at exactly the right time ; reduced percentage uncertainty / uncertainty spread over more oscillations / uncertainty less significant over more oscillations ; 2 4(a)(vi) correct calculation of T ; 1 4(a)(vii) correct calculation of T2 ; 1 4(b)(i) axes right way round with linear scale so that plots occupy at least half of grid, starting from 0 ; correct plots to ± ½ small square ; 2 4(b)(ii) appropriate best-fit line based on their plots ; 1 4(c) T2 is (directly) proportional to l ; 1
More questions on Physical quantities and measurement techniques
What was in this paper
The subtopics covered by these 4 questions, and how many questions each got. Open one in a new tab to see every Cambridge question on it.
What you needed in this session
Cambridge’s own grade thresholds for 2019 Oct/Nov, Paper 5 · Variant 2. A higher threshold means an easier paper — the bar moves with how the cohort did.