Cambridge IGCSE Science - Combined 0653 — 2023 Oct/Nov Paper 5 · Variant 1
0653/51/O/N/23 · 4 questions · 40 marks · ≈45 min
The question paper and its mark scheme, free to read here and free to download. This is Cambridge’s own paper, exactly as it was sat.
Question paper16 pages



Mark scheme8 pages
Answers below. Sit the paper first if you are practising.
Questions as text
Q1 · You are going to investigate the effect of an enzyme used in the large-scale production…
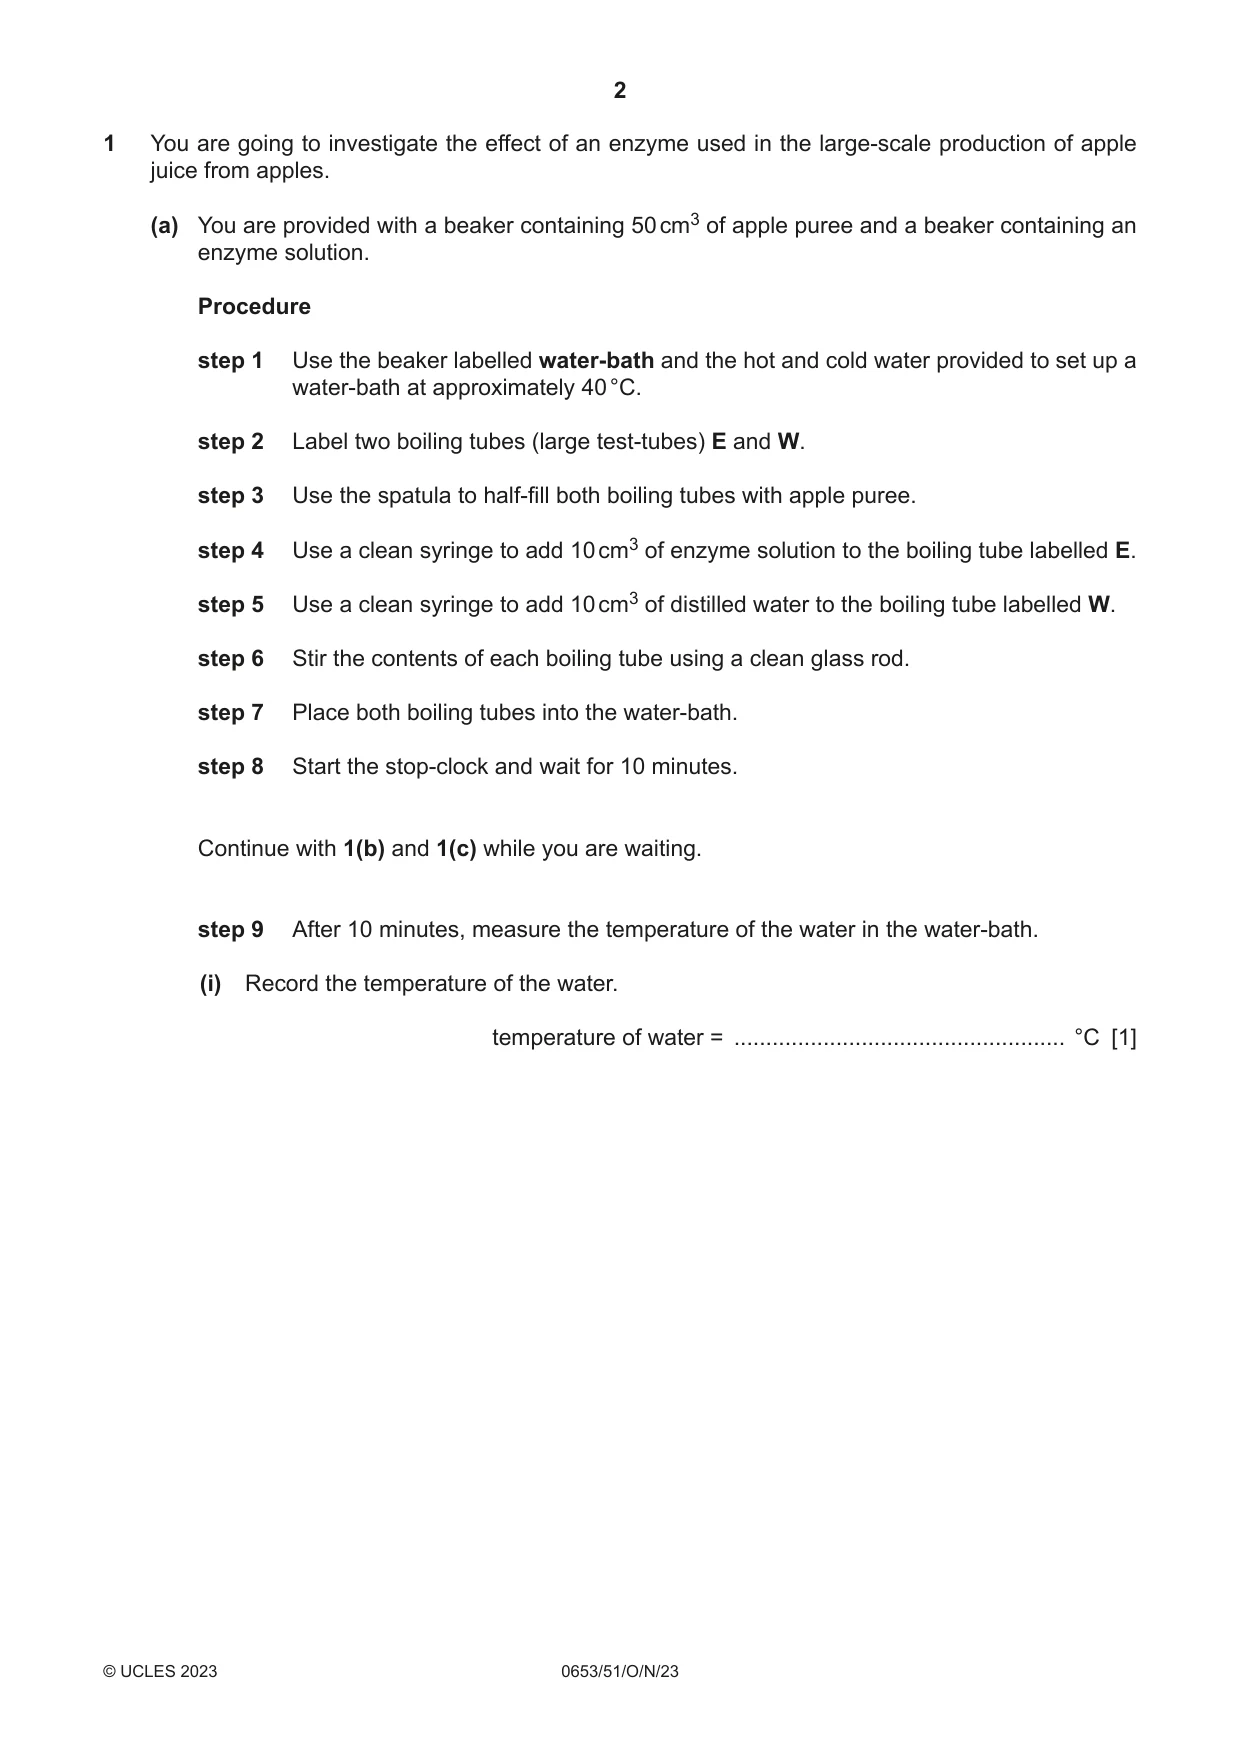
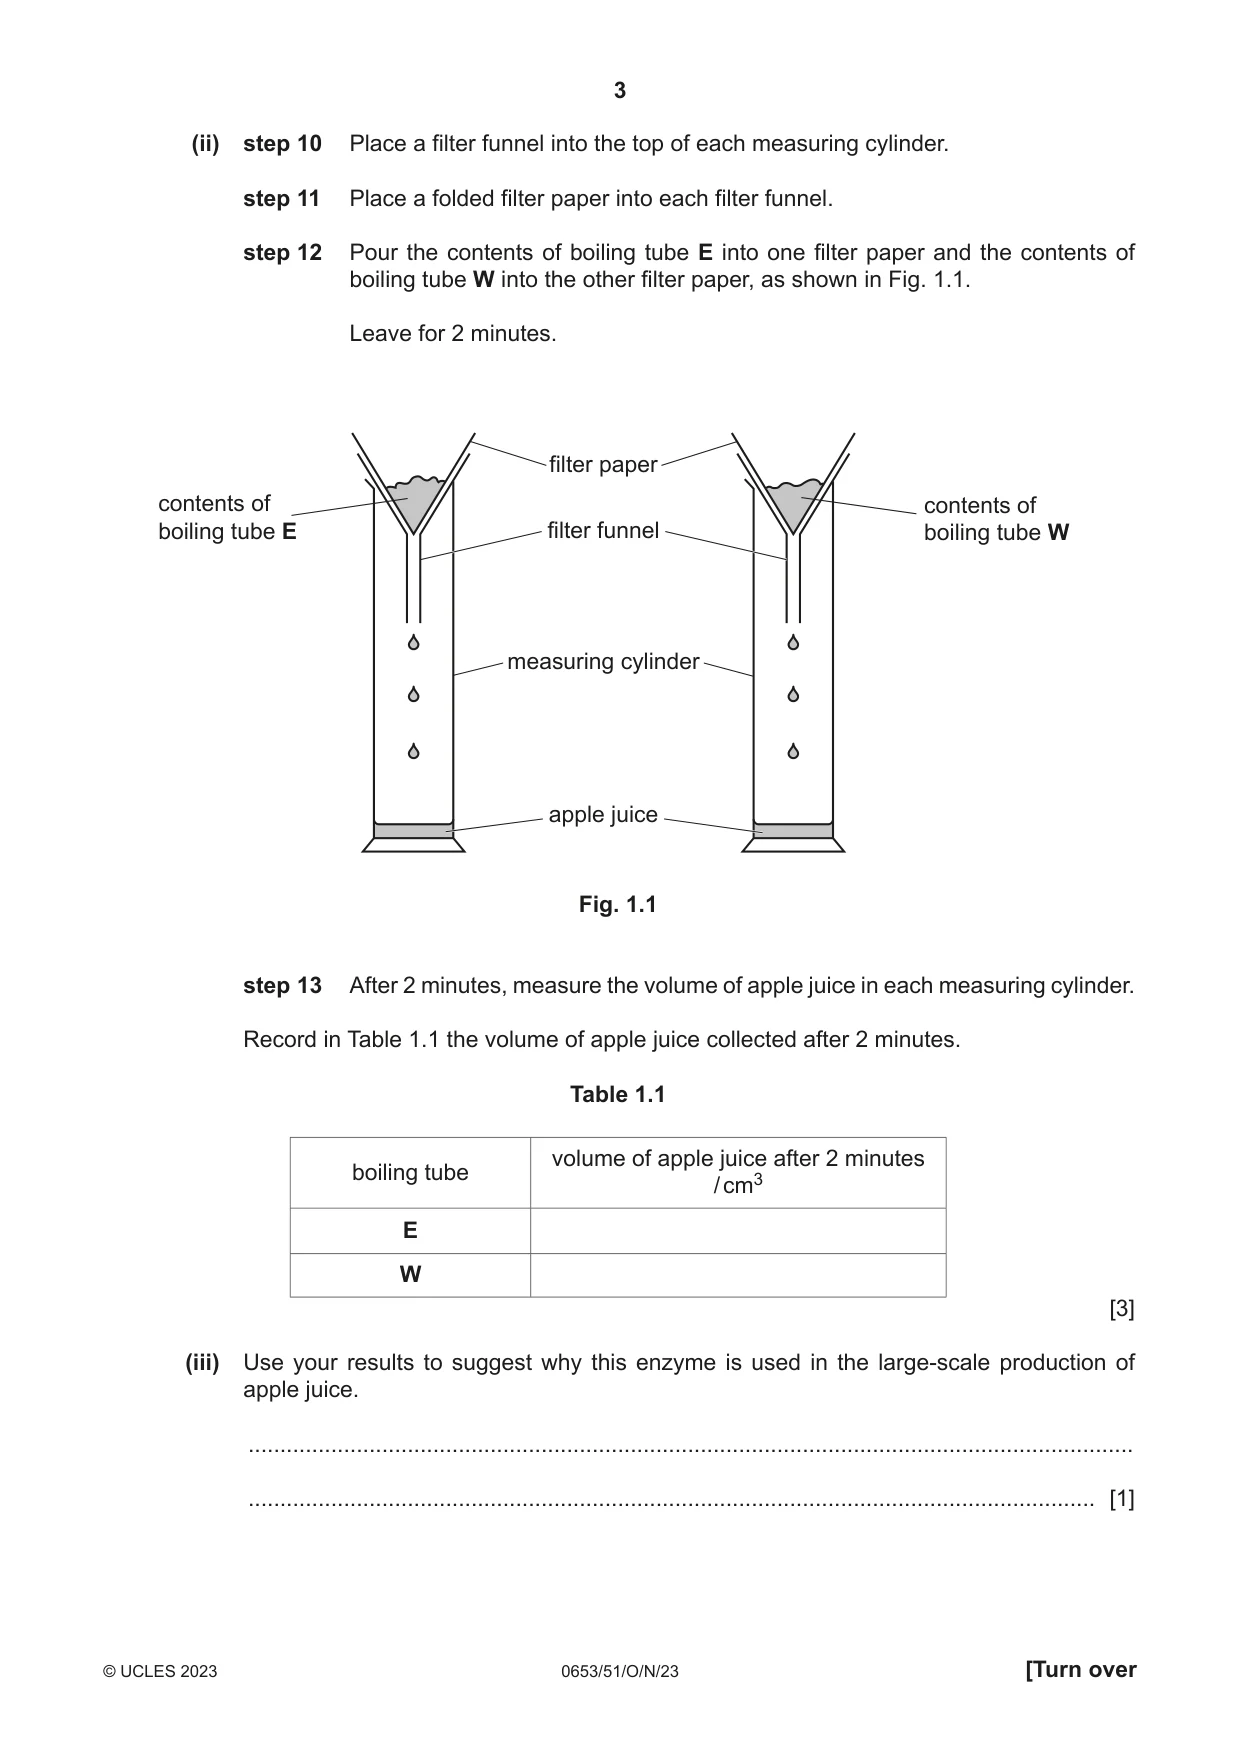
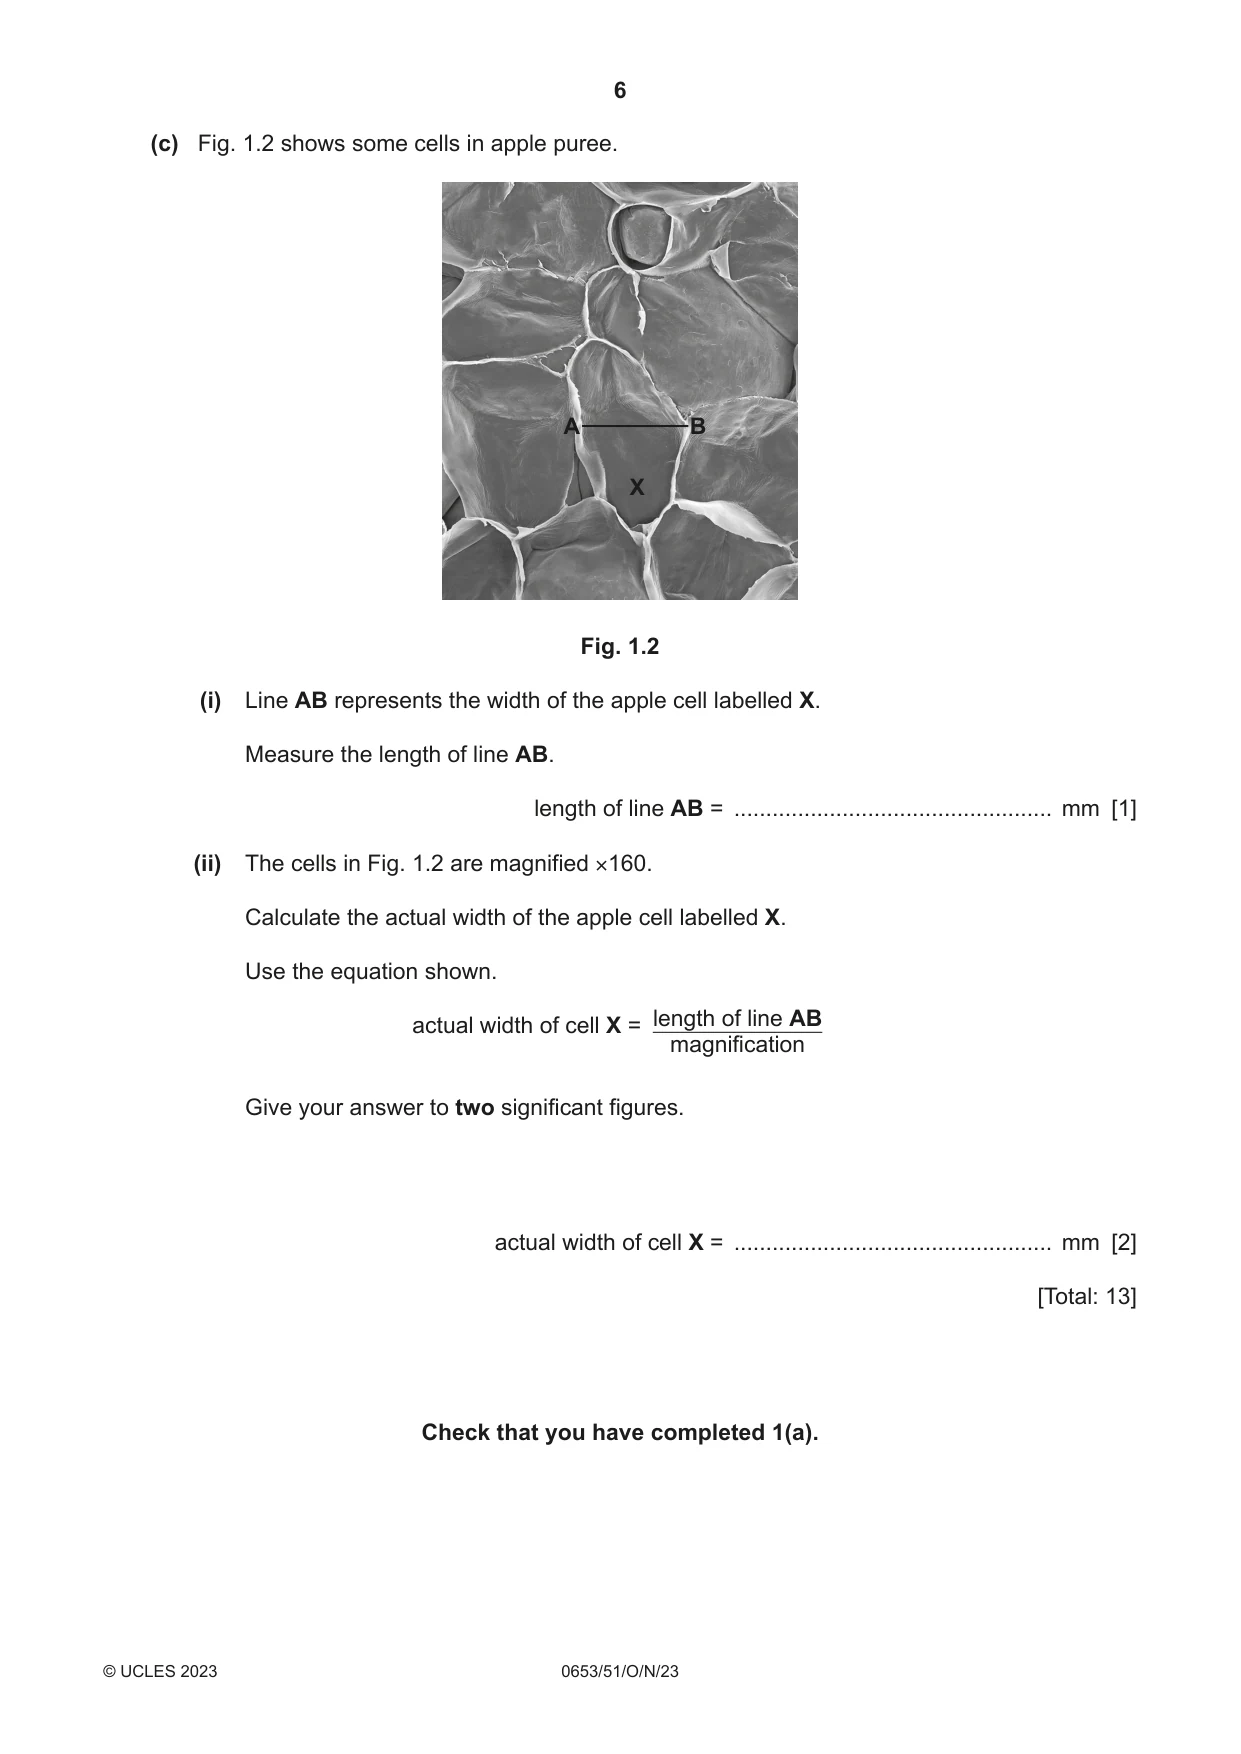
1 You are going to investigate the effect of an enzyme used in the large-scale production of apple juice from apples. (a) You are provided with a beaker containing 50 cm3 of apple puree and a beaker containing an enzyme solution. Procedure step 1 Use the beaker labelled water-bath and the hot and cold water provided to set up a water-bath at approximately 40 °C. step 2 Label two boiling tubes (large test-tubes) E and W. step 3 Use the spatula to half-fill both boiling tubes with apple puree. step 4 Use a clean syringe to add 10 cm3 of enzyme solution to the boiling tube labelled E. step 5 Use a clean syringe to add 10 cm3 of distilled water to the boiling tube labelled W. step 6 Stir the contents of each boiling tube using a clean glass rod. step 7 Place both boiling tubes into the water-bath. step 8 Start the stop-clock and wait for 10 minutes. Continue with 1(b) and 1(c) while you are waiting. step 9 After 10 minutes, measure the temperature of the water in the water-bath. (i) Record the temperature of the water. temperature of water = .................................................... °C [1] (ii) step 10 Place a filter funnel into the top of each measuring cylinder. step 11 Place a folded filter paper into each filter funnel. step 12 Pour the contents of boiling tube E into one filter paper and the contents of boiling tube W into the other filter paper, as shown in Fig. 1.1. Leave for 2 minutes. filter paper contents of contents of boiling tube E filter funnel boiling tube W measuring cylinder apple juice Fig. 1.1 step 13 After 2 minutes, measure the volume of apple juice in each measuring cylinder. Record in Table 1.1 the volume of apple juice collected after 2 minutes. Table 1.1 volume of apple juice after 2 minutes boiling tube / cm3 E W [3] (iii) Use your results to suggest why this enzyme is used in the large-scale production of apple juice. ........................................................................................................................................... ..................................................................................................................................... [1] (iv) Use your measurement in 1(a)(i) to decide if temperature is a source of error in your investigation. Tick the appropriate box and explain your decision. temperature is a source of error temperature is not a source of error explanation ........................................................................................................................ ........................................................................................................................................... ........................................................................................................................................... [1] (v) Identify one source of error in step 3. Suggest a suitable piece of apparatus to overcome this error. error ................................................................................................................................... apparatus .......................................................................................................................... [1] (b) You are provided with a section through an apple. In the box, make a large clear pencil drawing of the cut surface of the apple. [3] (c) Fig. 1.2 shows some cells in apple puree. A B X Fig. 1.2 (i) Line AB represents the width of the apple cell labelled X. Measure the length of line AB. length of line AB = .................................................. mm [1] (ii) The cells in Fig. 1.2 are magnified ×160. Calculate the actual width of the apple cell labelled X. Use the equation shown. length of line AB actual width of cell X = magnification Give your answer to two significant figures. actual width of cell X = .................................................. mm [2] [Total: 13] Check that you have completed 1(a).
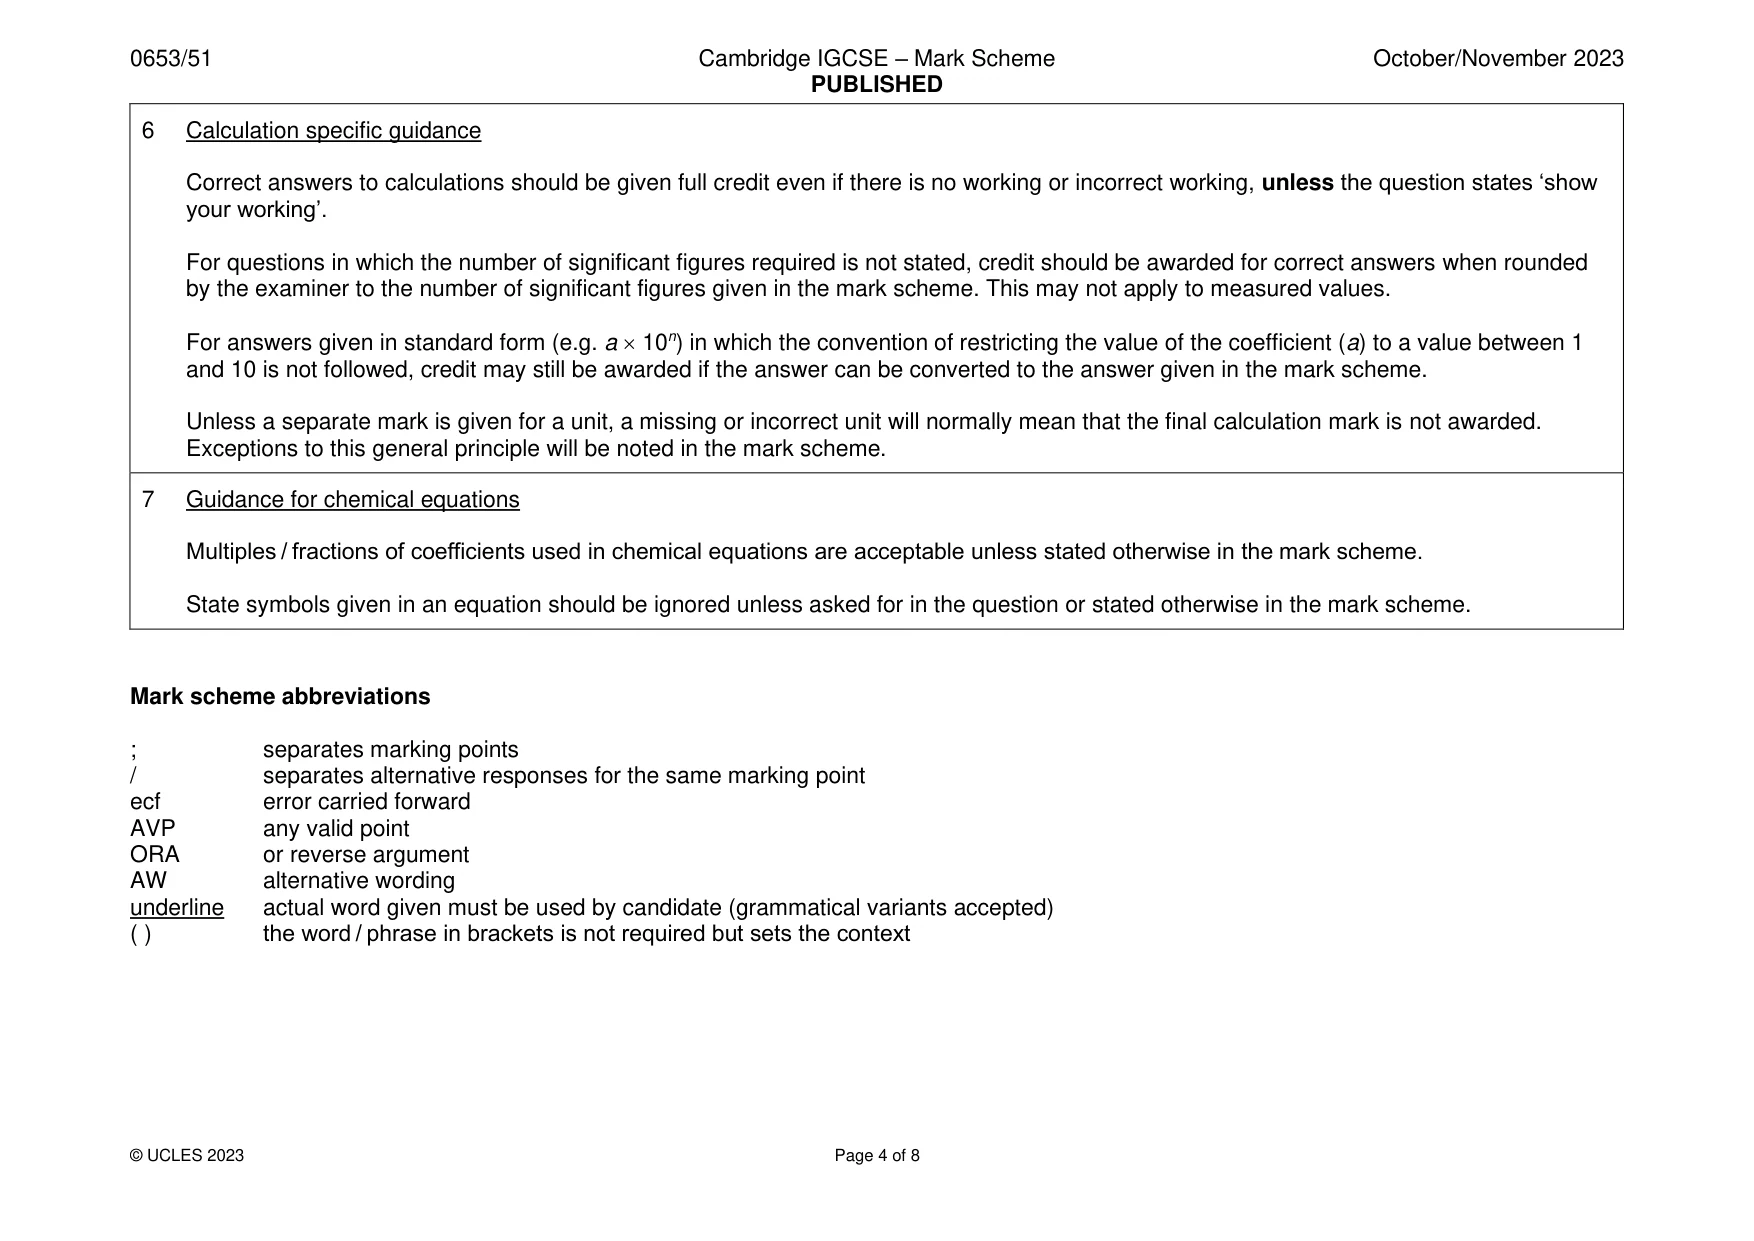
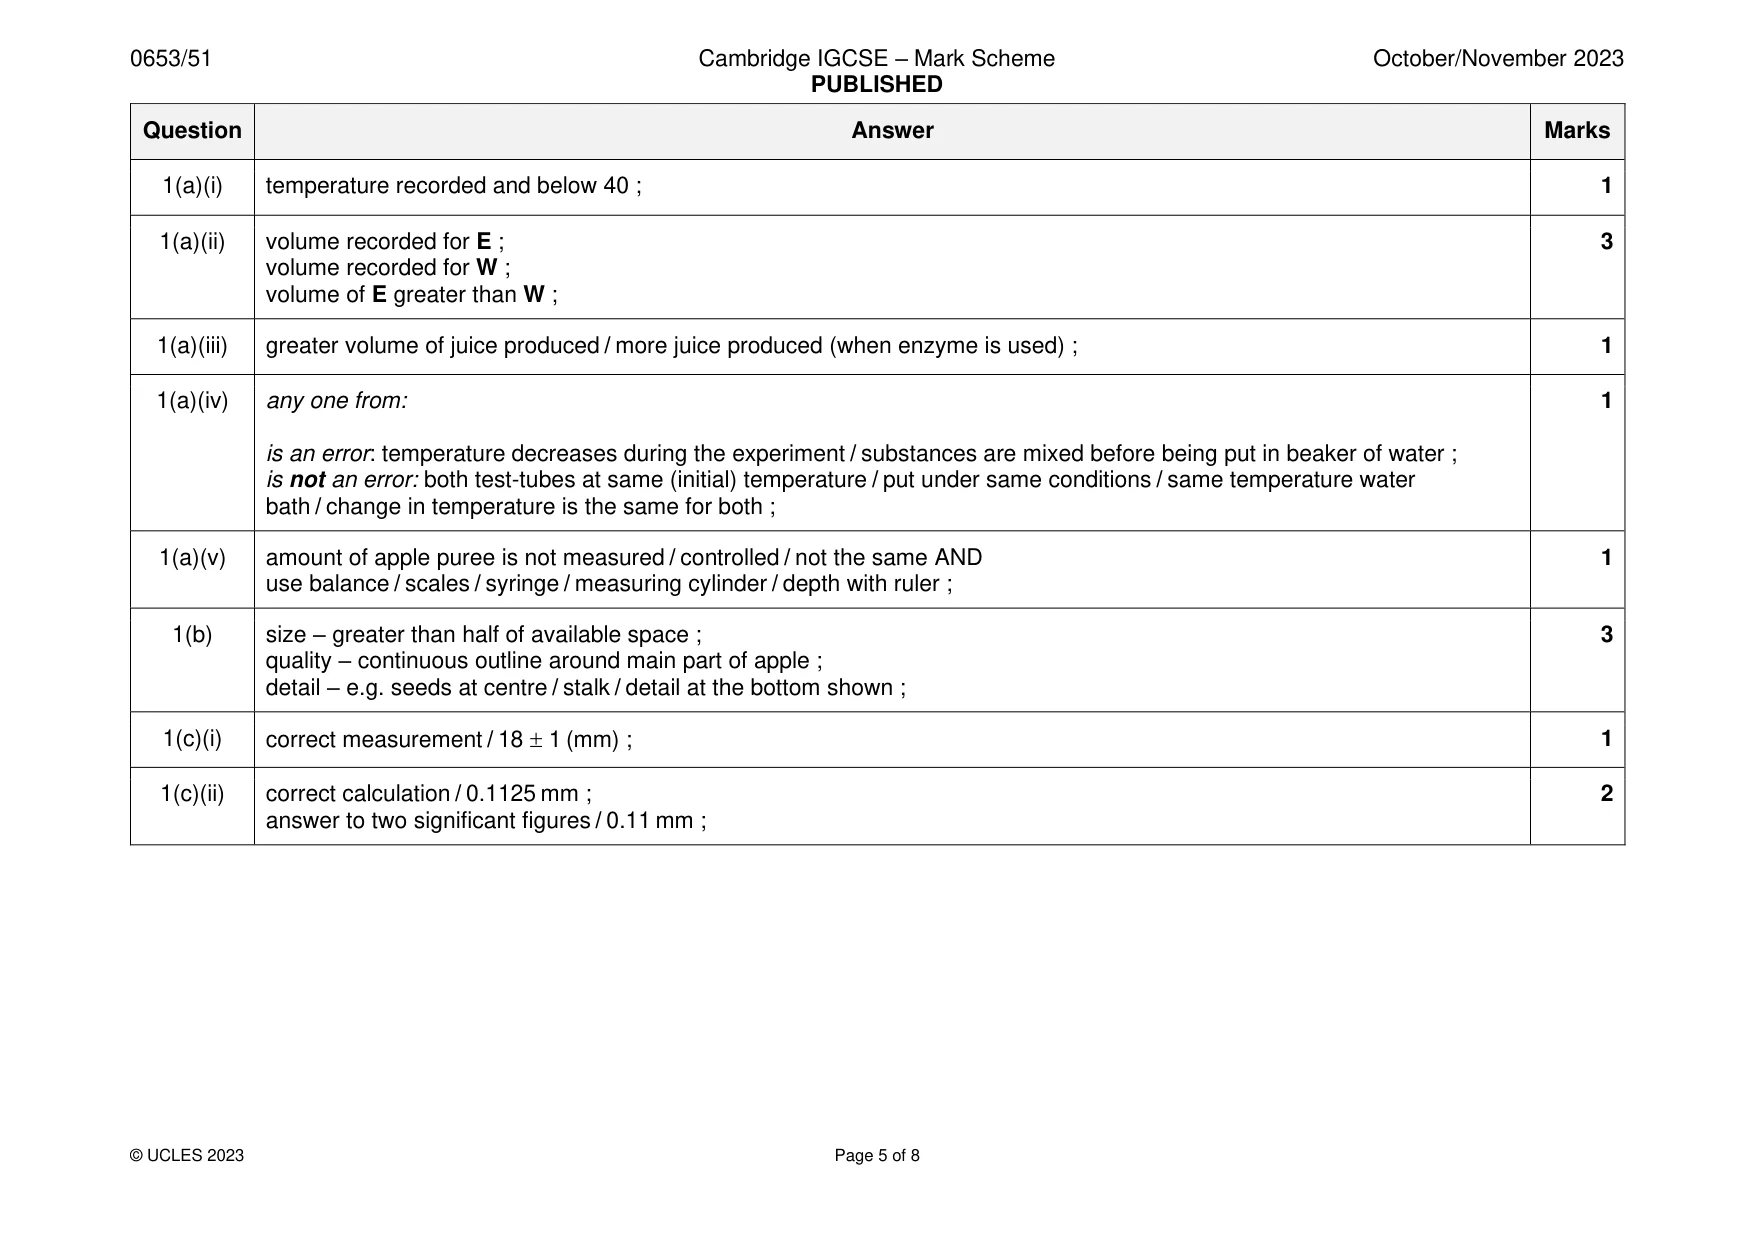
Mark scheme: Question Answer Marks 1(a)(i) temperature recorded and below 40 ; 1 1(a)(ii) volume recorded for E ; 3 volume recorded for W ; volume of E greater than W ; 1(a)(iii) greater volume of juice produced / more juice produced (when enzyme is used) ; 1 1(a)(iv) any one from: 1 is an error: temperature decreases during the experiment / substances are mixed before being put in beaker of water ; is not an error: both test-tubes at same (initial) temperature / put under same conditions / same temperature water bath / change in temperature is the same for both ; 1(a)(v) amount of apple puree is not measured / controlled / not the same AND 1 use balance / scales / syringe / measuring cylinder / depth with ruler ; 1(b) size – greater than half of available space ; 3 quality – continuous outline around main part of apple ; detail – e.g. seeds at centre / stalk / detail at the bottom shown ; 1(c)(i) correct measurement / 18 1 (mm) ; 1 1(c)(ii) correct calculation / 0.1125 mm ; 2 answer to two significant figures / 0.11 mm ;
Q2 · You are going to investigate the rate of reaction between magnesium and dilute…
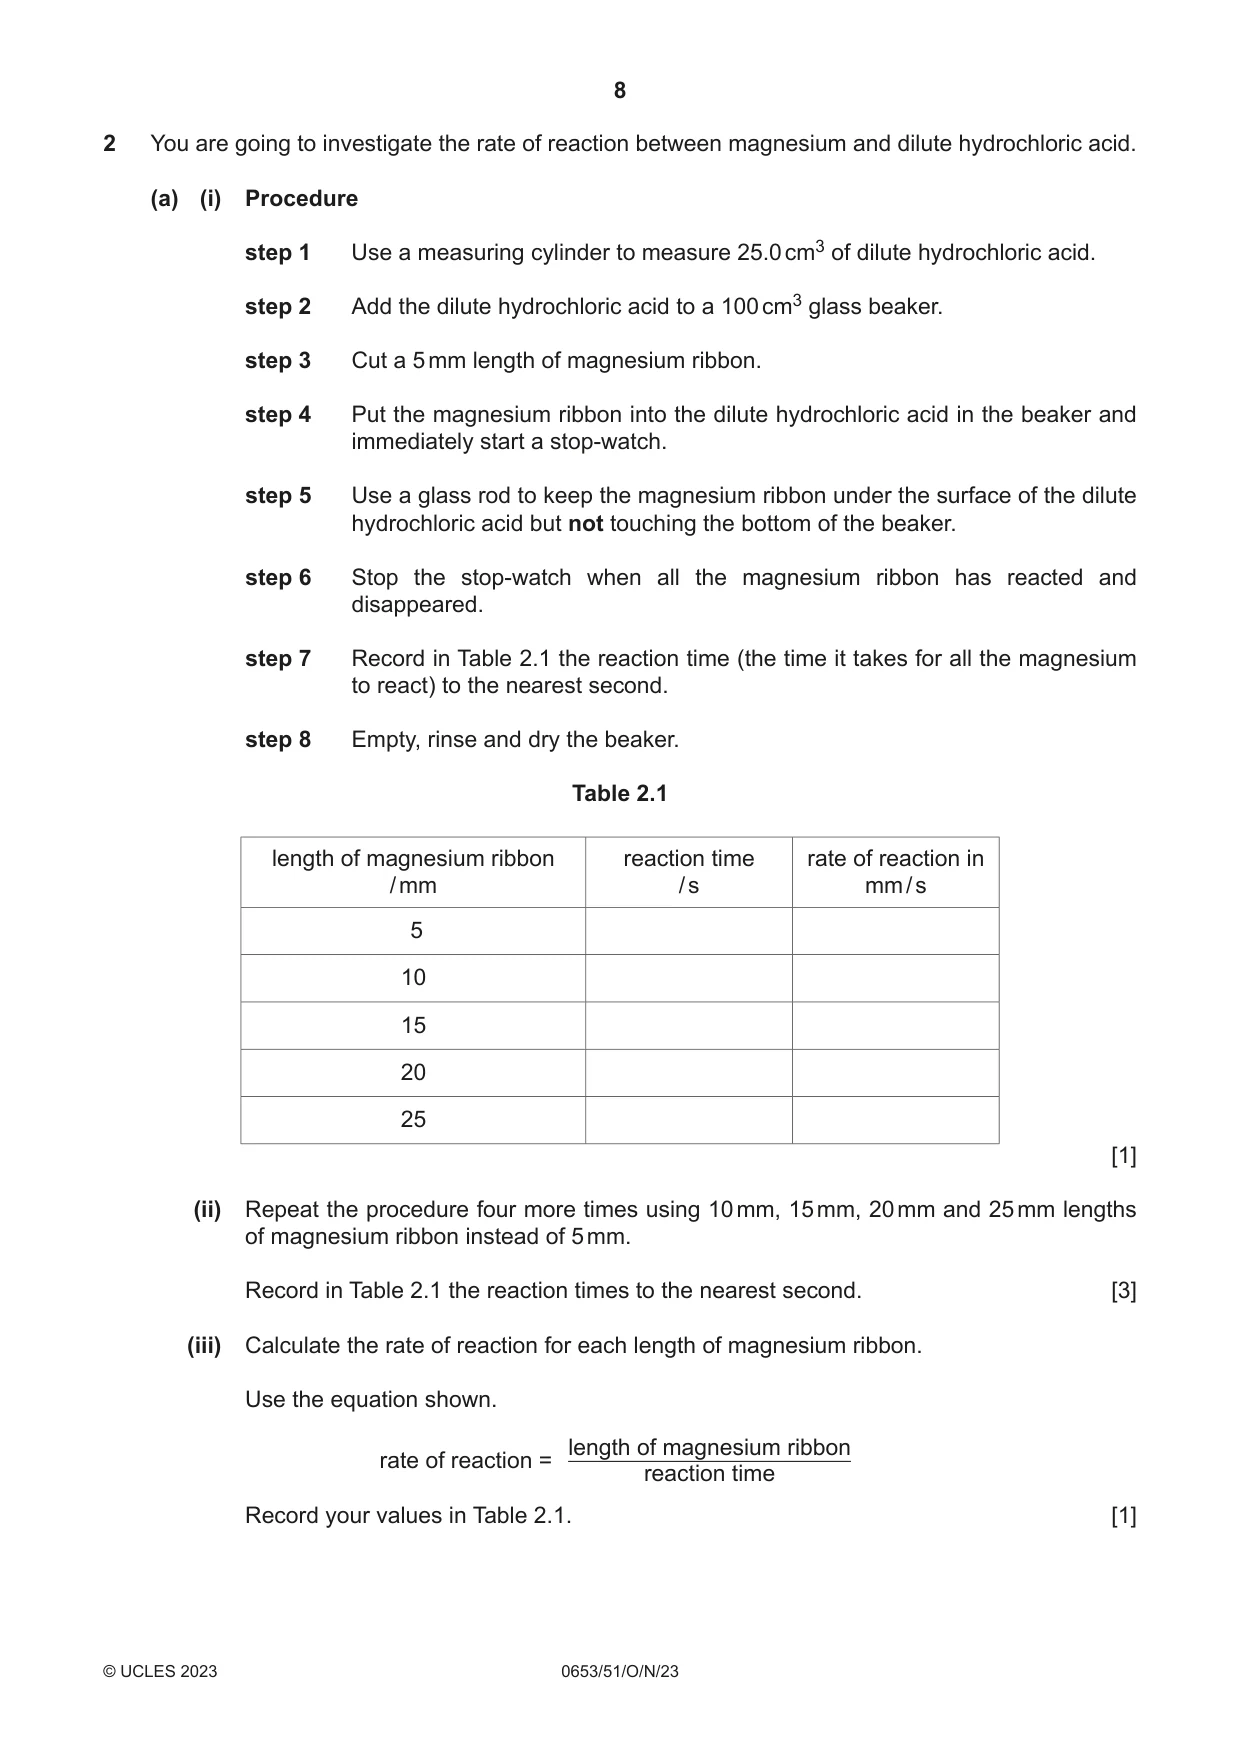
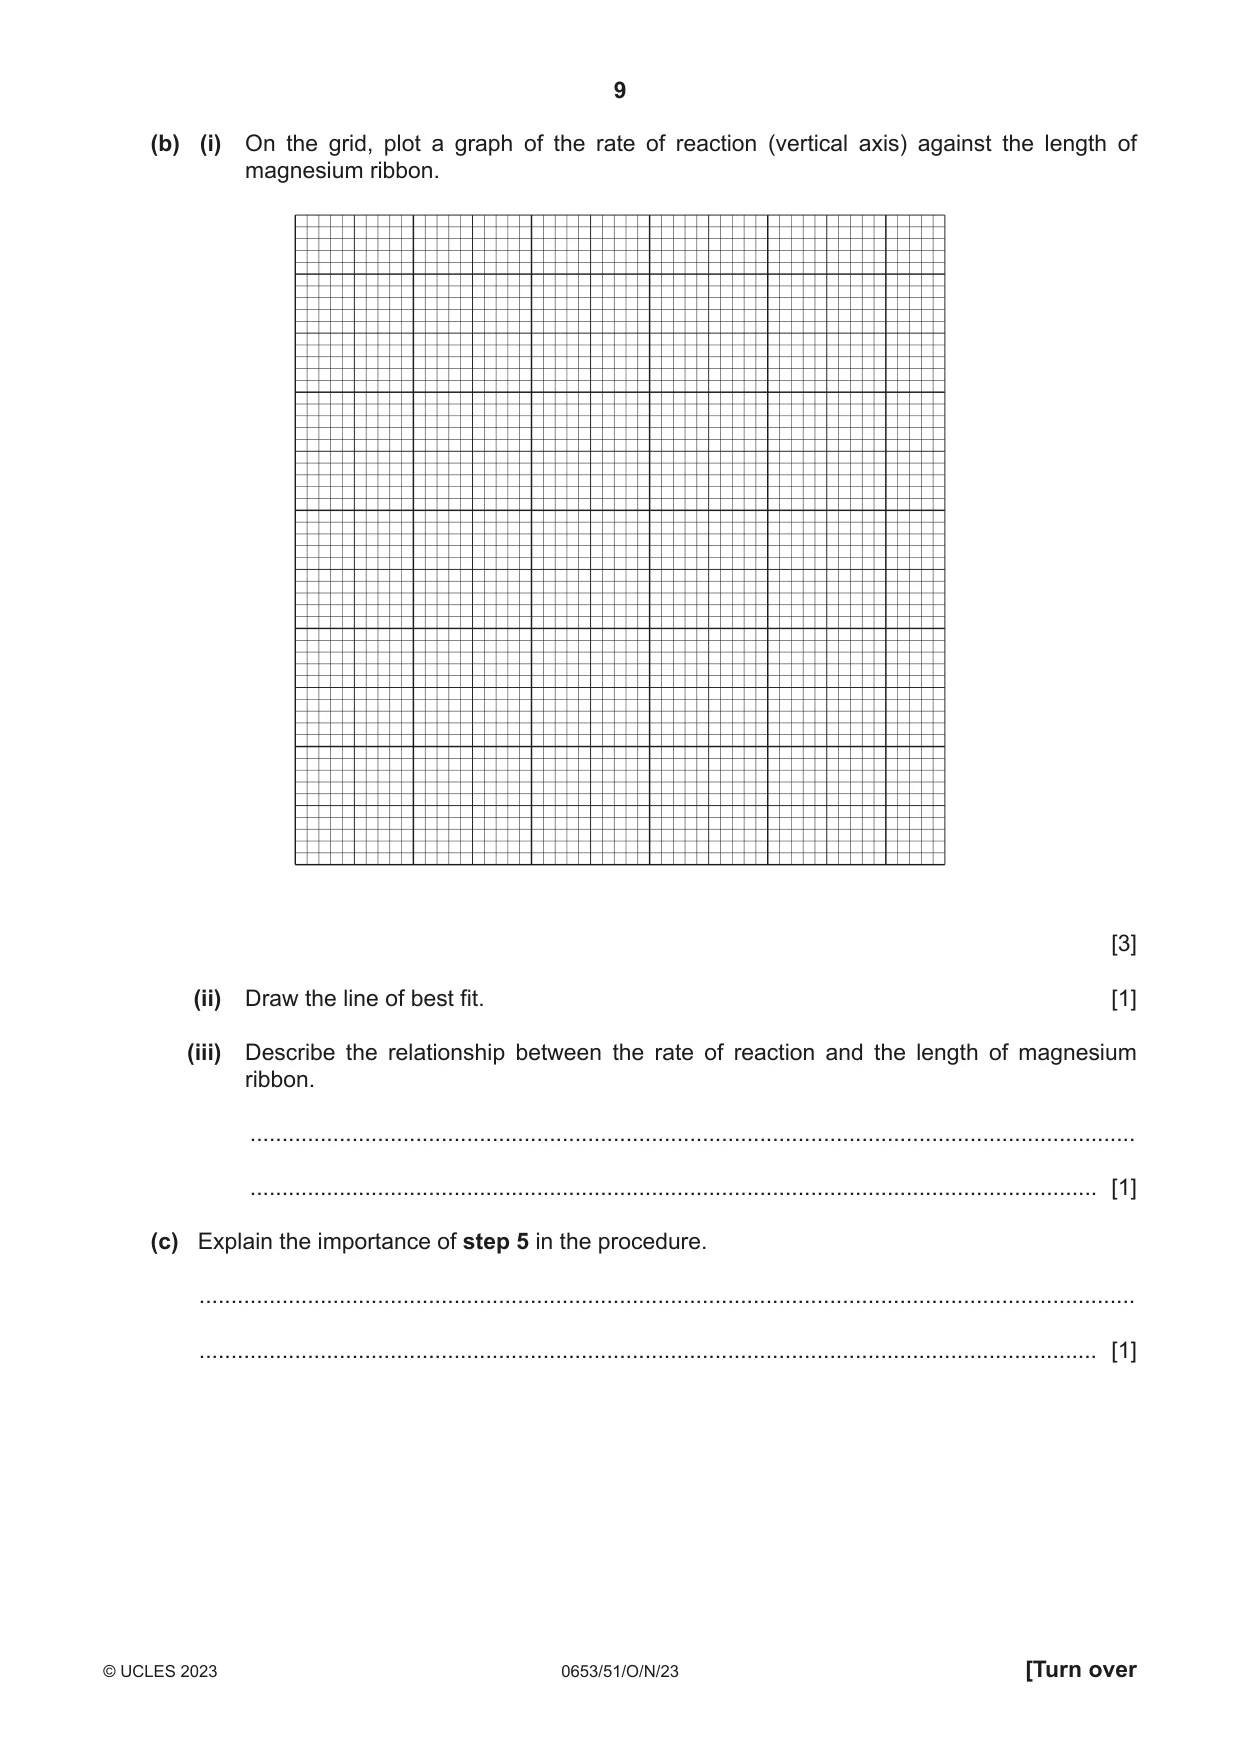
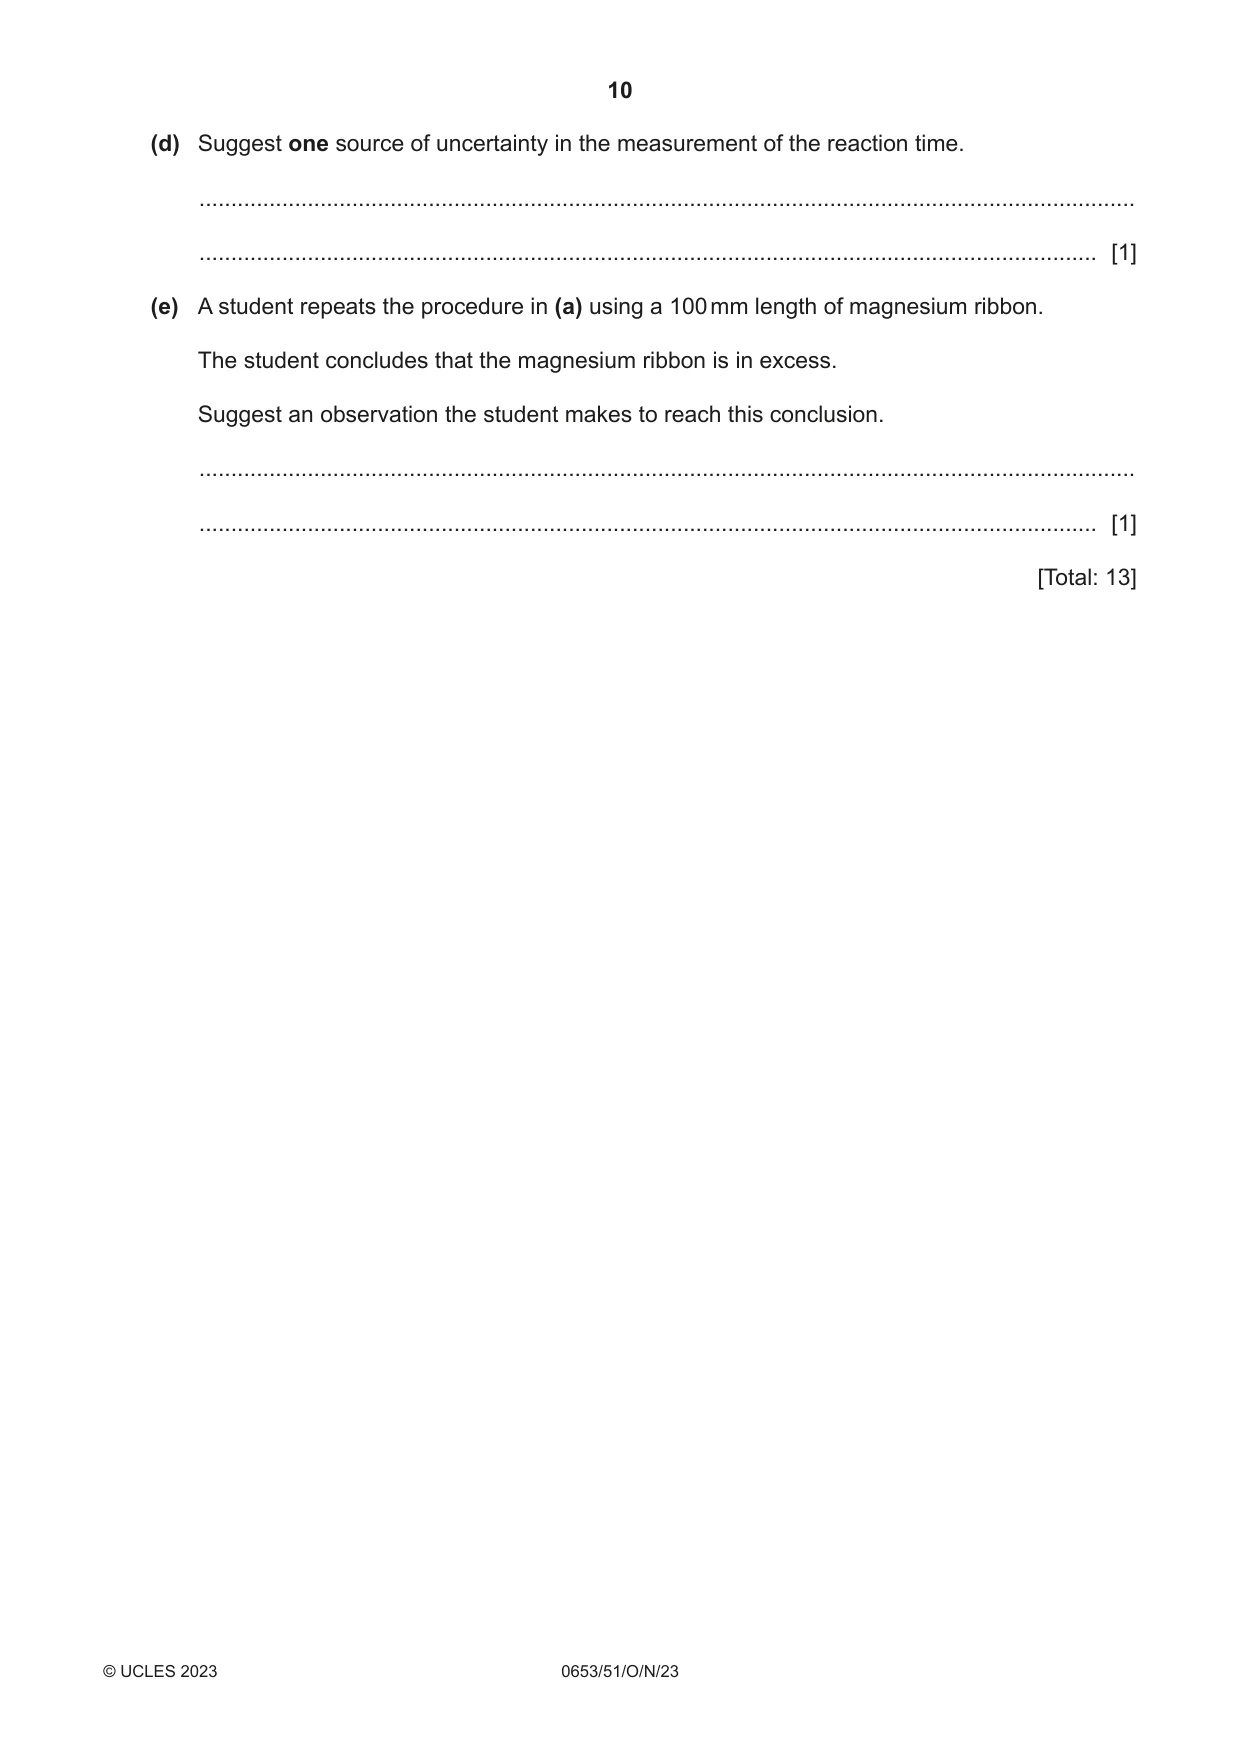
2 You are going to investigate the rate of reaction between magnesium and dilute hydrochloric acid. (a) (i) Procedure step 1 Use a measuring cylinder to measure 25.0 cm3 of dilute hydrochloric acid. step 2 Add the dilute hydrochloric acid to a 100 cm3 glass beaker. step 3 Cut a 5 mm length of magnesium ribbon. step 4 Put the magnesium ribbon into the dilute hydrochloric acid in the beaker and immediately start a stop-watch. step 5 Use a glass rod to keep the magnesium ribbon under the surface of the dilute hydrochloric acid but not touching the bottom of the beaker. step 6 Stop the stop-watch when all the magnesium ribbon has reacted and disappeared. step 7 Record in Table 2.1 the reaction time (the time it takes for all the magnesium to react) to the nearest second. step 8 Empty, rinse and dry the beaker. Table 2.1 length of magnesium ribbon reaction time rate of reaction in / mm / s mm / s 5 10 15 20 25 [1] (ii) Repeat the procedure four more times using 10 mm, 15 mm, 20 mm and 25 mm lengths of magnesium ribbon instead of 5 mm. Record in Table 2.1 the reaction times to the nearest second. [3] (iii) Calculate the rate of reaction for each length of magnesium ribbon. Use the equation shown. length of magnesium ribbon rate of reaction = reaction time Record your values in Table 2.1. [1] (b) (i) On the grid, plot a graph of the rate of reaction (vertical axis) against the length of magnesium ribbon. [3] (ii) Draw the line of best fit. [1] (iii) Describe the relationship between the rate of reaction and the length of magnesium ribbon. ........................................................................................................................................... ..................................................................................................................................... [1] (c) Explain the importance of step 5 in the procedure. ................................................................................................................................................... ............................................................................................................................................. [1] (d) Suggest one source of uncertainty in the measurement of the reaction time. ................................................................................................................................................... ............................................................................................................................................. [1] (e) A student repeats the procedure in (a) using a 100 mm length of magnesium ribbon. The student concludes that the magnesium ribbon is in excess. Suggest an observation the student makes to reach this conclusion. ................................................................................................................................................... ............................................................................................................................................. [1] [Total: 13]
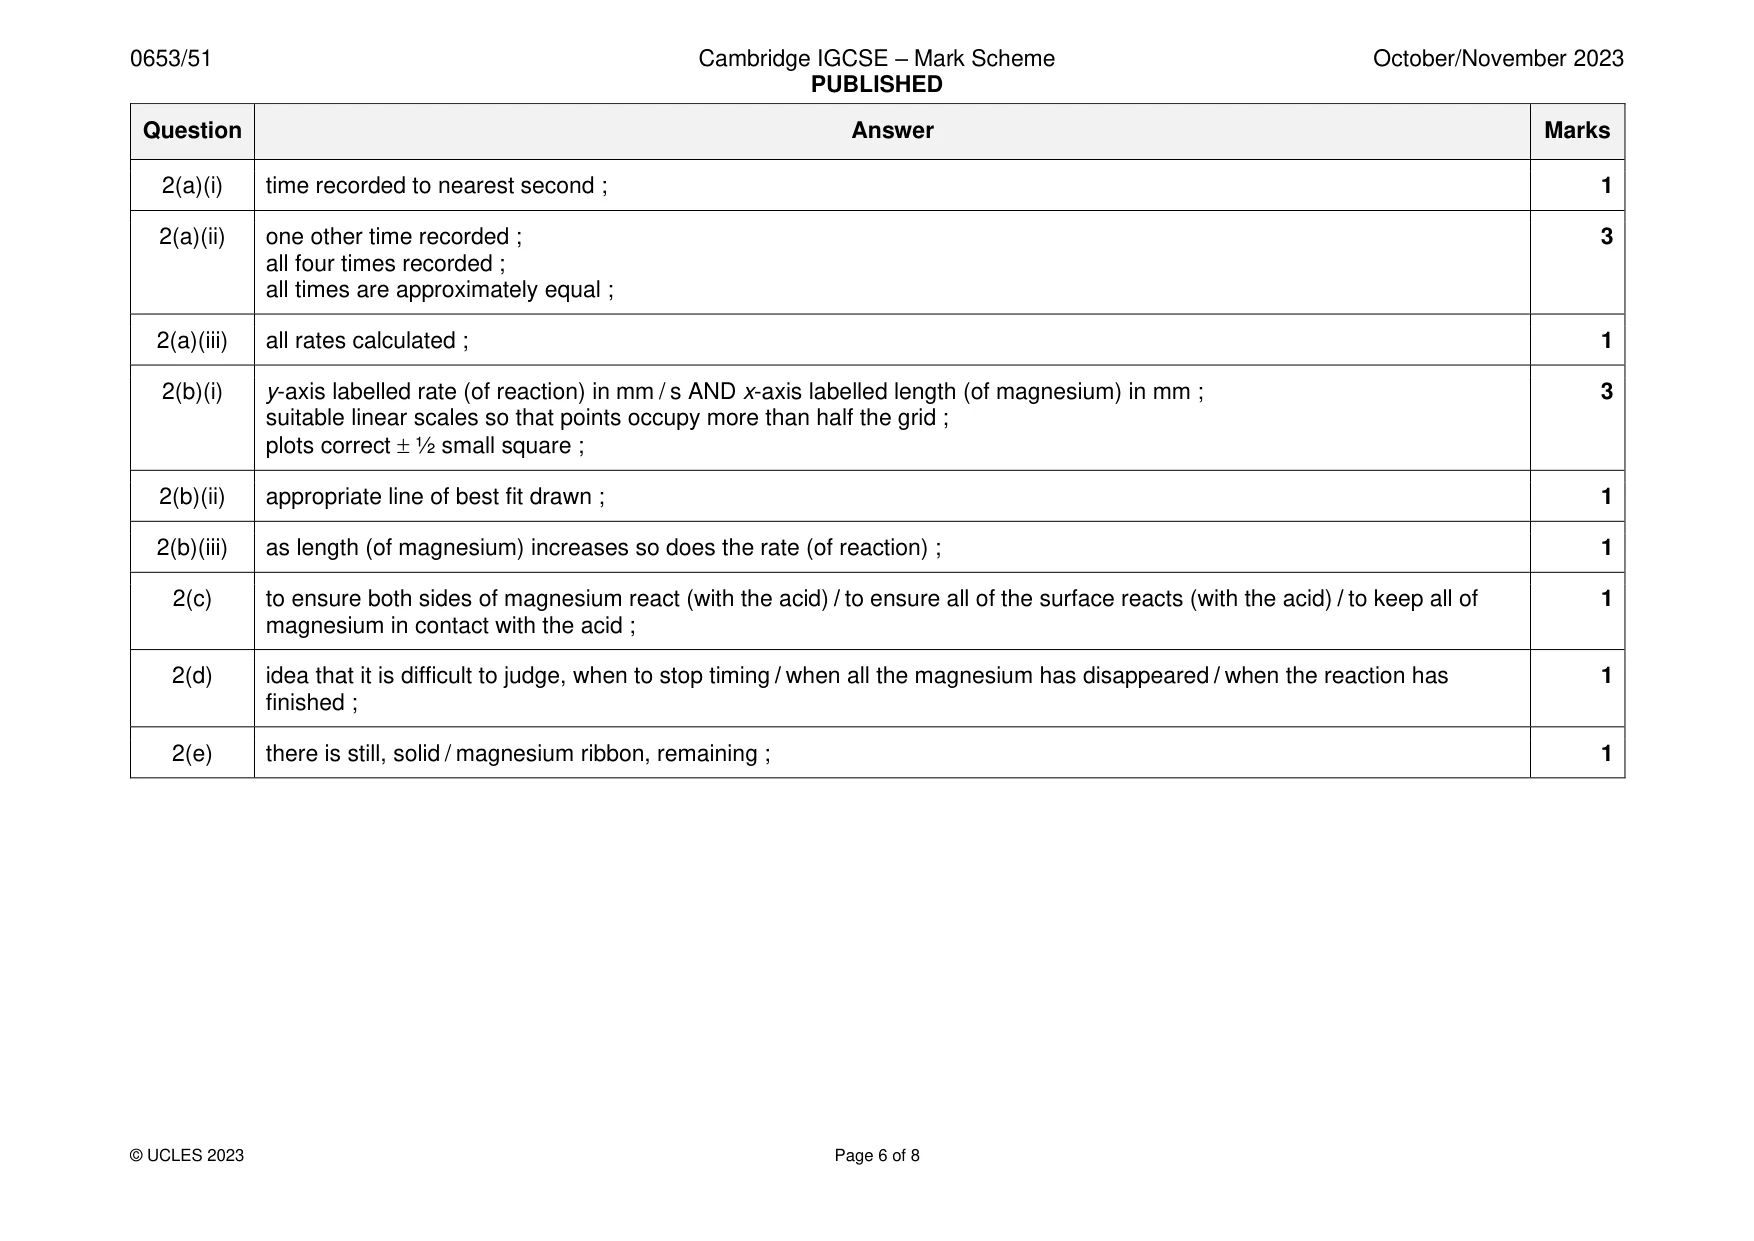
Mark scheme: 2(a)(i) time recorded to nearest second ; 1 2(a)(ii) one other time recorded ; 3 all four times recorded ; all times are approximately equal ; 2(a)(iii) all rates calculated ; 1 2(b)(i) y-axis labelled rate (of reaction) in mm / s AND x-axis labelled length (of magnesium) in mm ; 3 suitable linear scales so that points occupy more than half the grid ; plots correct ½ small square ; 2(b)(ii) appropriate line of best fit drawn ; 1 2(b)(iii) as length (of magnesium) increases so does the rate (of reaction) ; 1 2(c) to ensure both sides of magnesium react (with the acid) / to ensure all of the surface reacts (with the acid) / to keep all of 1 magnesium in contact with the acid ; 2(d) idea that it is difficult to judge, when to stop timing / when all the magnesium has disappeared / when the reaction has 1 finished ; 2(e) there is still, solid / magnesium ribbon, remaining ; 1
Q3 · You are going to investigate the reflection of light by a plane mirror
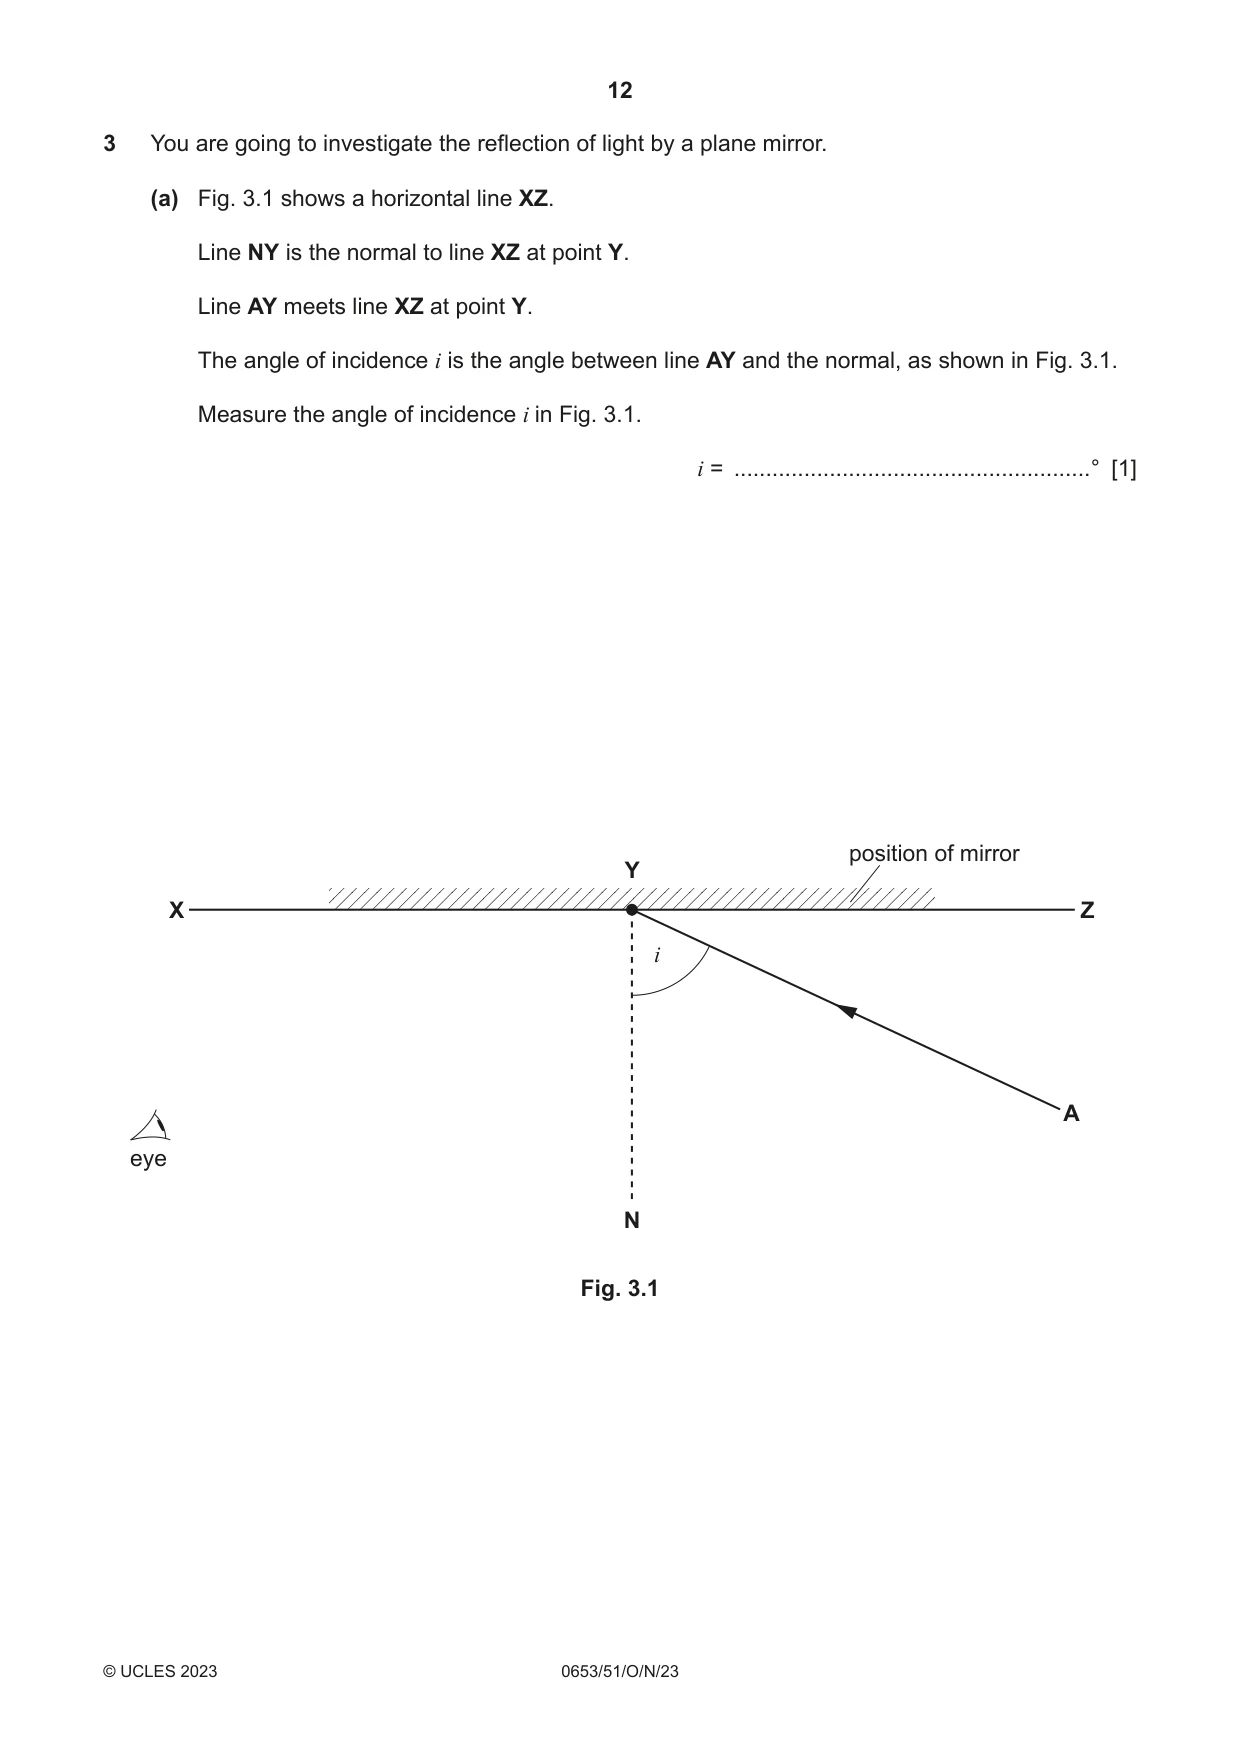
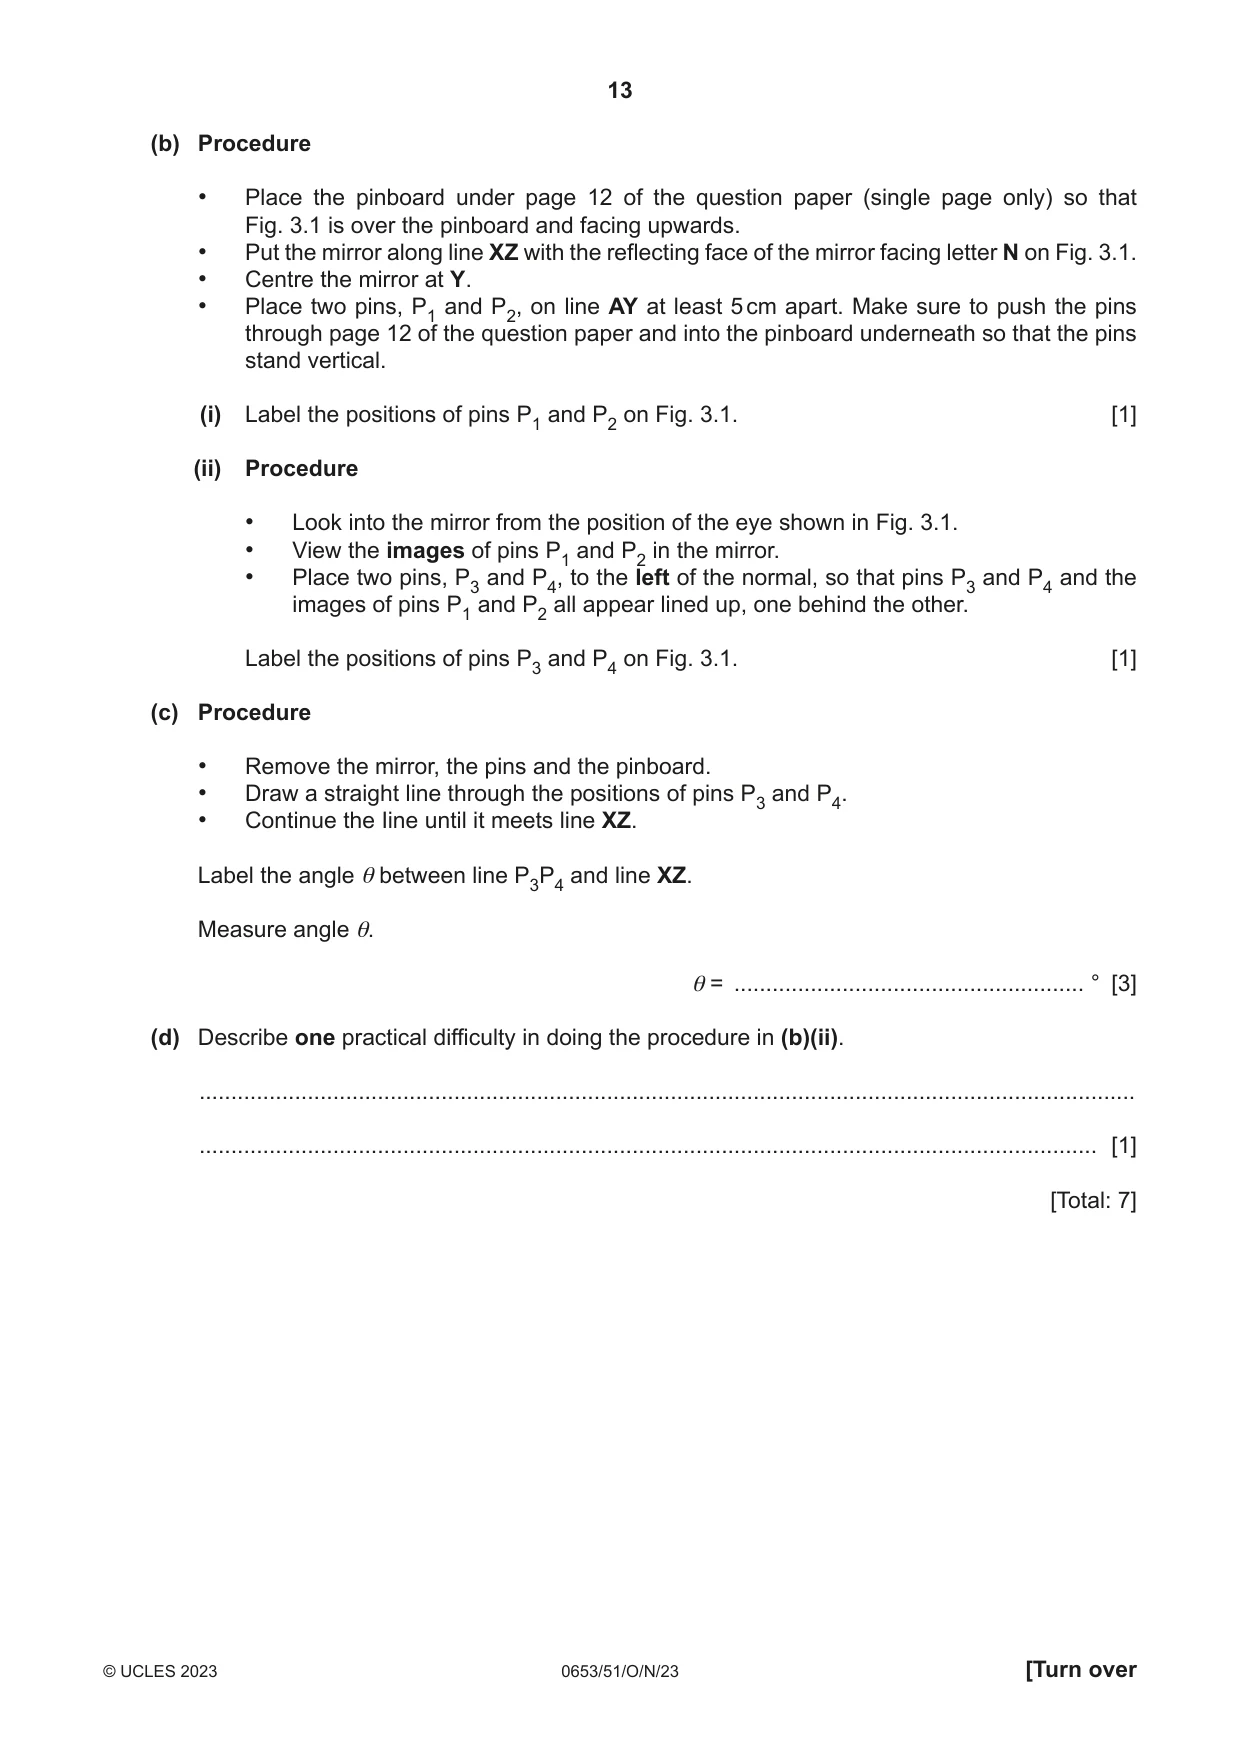
3 You are going to investigate the reflection of light by a plane mirror. (a) Fig. 3.1 shows a horizontal line XZ. Line NY is the normal to line XZ at point Y. Line AY meets line XZ at point Y. The angle of incidence i is the angle between line AY and the normal, as shown in Fig. 3.1. Measure the angle of incidence i in Fig. 3.1. i = ........................................................° [1] position of mirror Y X Z i A eye N Fig. 3.1 (b) Procedure • Place the pinboard under page 12 of the question paper (single page only) so that Fig. 3.1 is over the pinboard and facing upwards. • Put the mirror along line XZ with the reflecting face of the mirror facing letter N on Fig. 3.1. • Centre the mirror at Y. • Place two pins, P1 and P2, on line AY at least 5 cm apart. Make sure to push the pins through page 12 of the question paper and into the pinboard underneath so that the pins stand vertical. (i) Label the positions of pins P1 and P2 on Fig. 3.1. [1] (ii) Procedure • Look into the mirror from the position of the eye shown in Fig. 3.1. • View the images of pins P1 and P2 in the mirror. • Place two pins, P3 and P4, to the left of the normal, so that pins P3 and P4 and the images of pins P1 and P2 all appear lined up, one behind the other. Label the positions of pins P3 and P4 on Fig. 3.1. [1] (c) Procedure • Remove the mirror, the pins and the pinboard. • Draw a straight line through the positions of pins P3 and P4. • Continue the Iine until it meets line XZ. Label the angle θ between line P3P4 and line XZ. Measure angle θ. θ = ....................................................... ° [3] (d) Describe one practical difficulty in doing the procedure in (b)(ii). ................................................................................................................................................... ............................................................................................................................................. [1] [Total: 7]
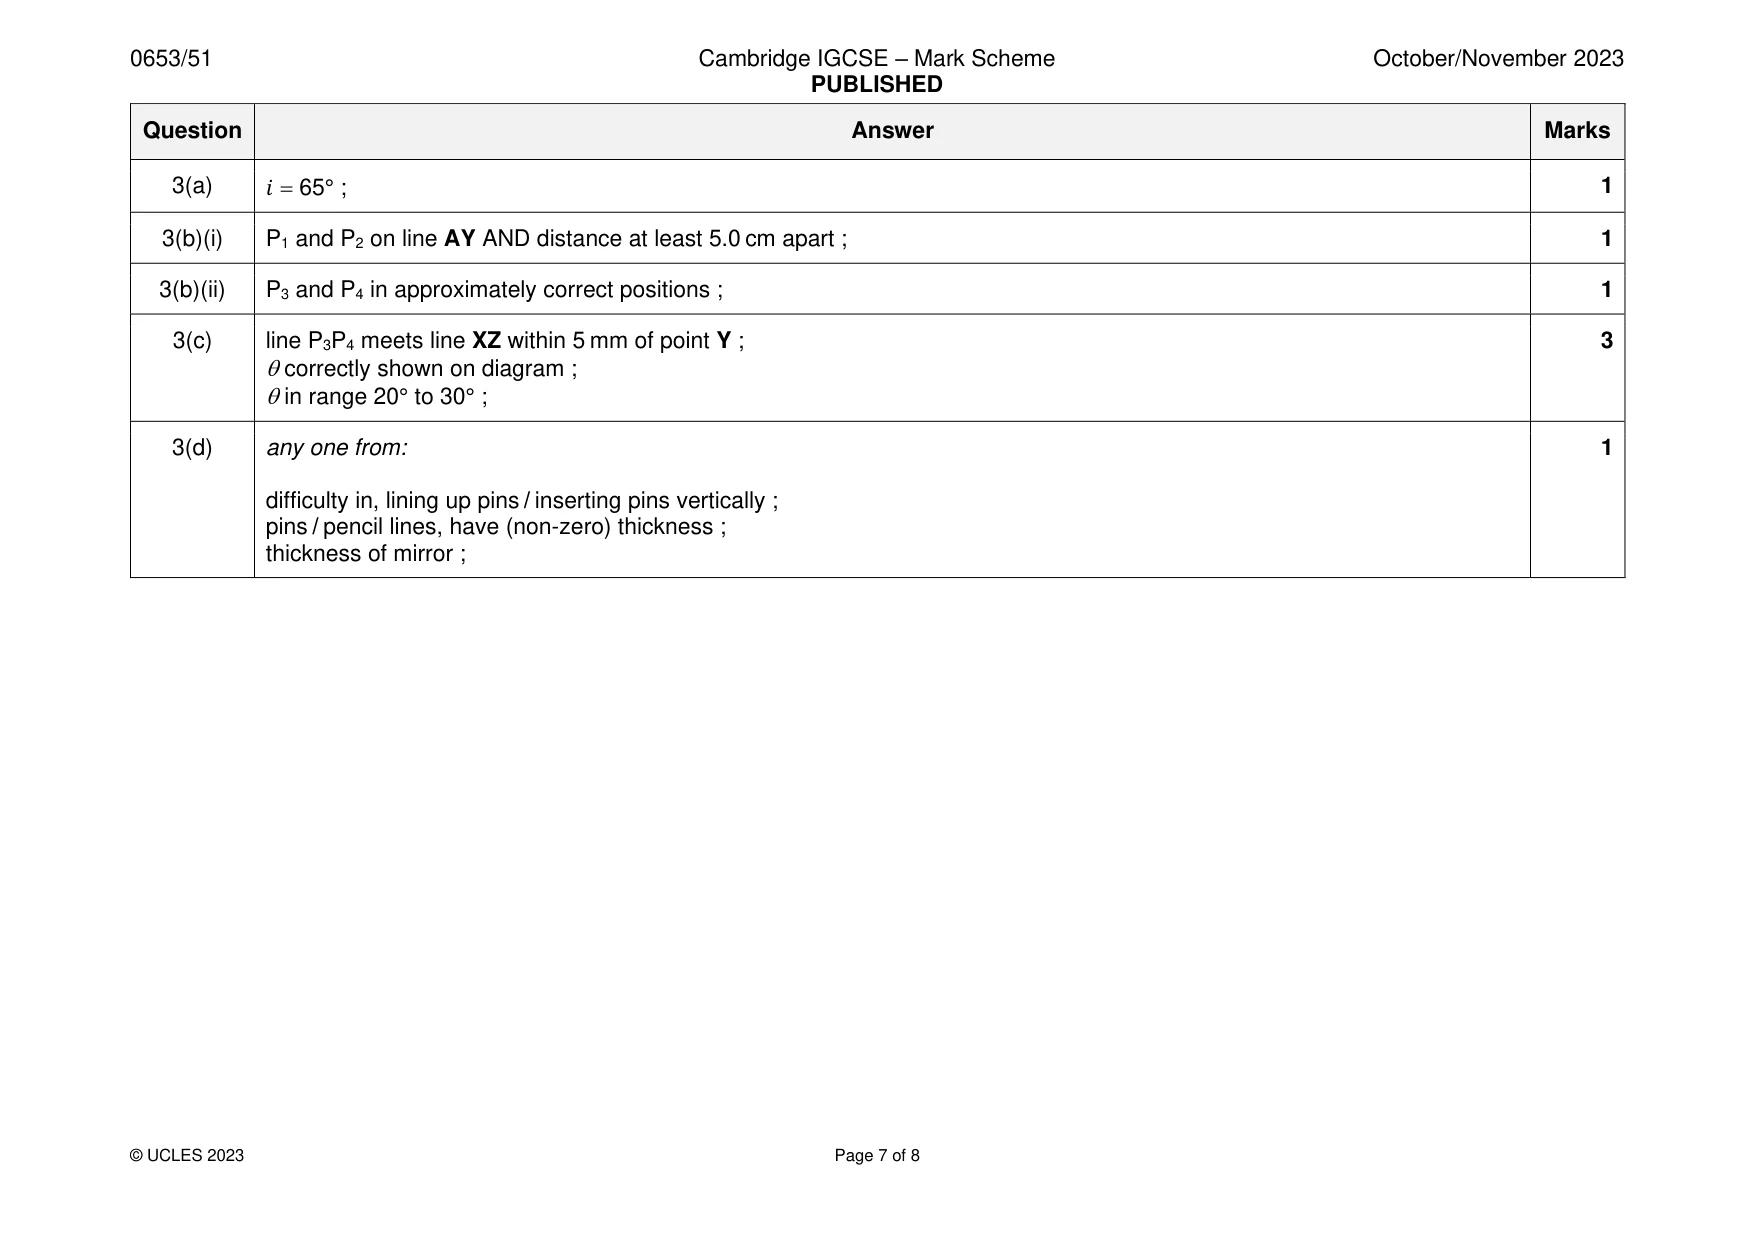
Mark scheme: 3(a) 𝑖 = 65° ; 1 3(b)(i) P1 and P2 on line AY AND distance at least 5.0 cm apart ; 1 3(b)(ii) P3 and P4 in approximately correct positions ; 1 3(c) line P3P4 meets line XZ within 5 mm of point Y ; 3 correctly shown on diagram ; in range 20° to 30° ; 3(d) any one from: 1 difficulty in, lining up pins / inserting pins vertically ; pins / pencil lines, have (non-zero) thickness ; thickness of mirror ;
Q4 · Plan an investigation to determine the relationship between the temperature of apple…
4 Plan an investigation to determine the relationship between the temperature of apple juice and the time it takes for ice cubes to melt when added to it. You are provided with: • ice cubes of different shapes and sizes • a supply of apple juice • beakers. You may use any other common laboratory apparatus. You are not required to do this investigation. In your plan, include: • any other apparatus you will need • a brief description of the method, including what you will measure and how you will make sure your measurements are accurate • the variables you will control • a results table to record your measurements (you are not required to enter any readings in the table) • how you will process your results to draw a conclusion. You may include a labelled diagram if you wish. .......................................................................................................................................................... .......................................................................................................................................................... .......................................................................................................................................................... .......................................................................................................................................................... .......................................................................................................................................................... .......................................................................................................................................................... .......................................................................................................................................................... .......................................................................................................................................................... .......................................................................................................................................................... .......................................................................................................................................................... .......................................................................................................................................................... .......................................................................................................................................................... .......................................................................................................................................................... .......................................................................................................................................................... .......................................................................................................................................................... .................................................................................................................................................... [7] NOTES FOR USE IN QUALITATIVE ANALYSIS Tests for anions anion test test result carbonate (CO32–) add dilute acid effervescence, carbon dioxide produced chloride (Cl –) acidify with dilute nitric acid, then white ppt. [in solution] add aqueous silver nitrate nitrate (NO3–) add aqueous sodium hydroxide, then ammonia produced [in solution] aluminium foil; warm carefully sulfate (SO42–) acidify, then add aqueous barium white ppt. [in solution] nitrate Tests for aqueous cations cation effect of aqueous sodium hydroxide effect of aqueous ammonia ammonium (NH4+) ammonia produced on warming – calcium (Ca2+) white ppt., insoluble in excess no ppt., or very slight white ppt. copper(II) (Cu2+) light blue ppt., insoluble in excess light blue ppt., soluble in excess, giving a dark blue solution iron(II) (Fe2+) green ppt., insoluble in excess green ppt., insoluble in excess iron(III) (Fe3+) red-brown ppt., insoluble in excess red-brown ppt., insoluble in excess zinc (Zn2+) white ppt., soluble in excess, giving a white ppt., soluble in excess, giving colourless solution a colourless solution Tests for gases Flame tests for metal ions gas test and test result metal ion flame colour ammonia (NH3) turns damp red litmus paper blue lithium (Li+) red carbon dioxide (CO2) turns limewater milky sodium (Na+) yellow chlorine (Cl 2) bleaches damp litmus paper potassium (K+) lilac hydrogen (H2) ‘pops’ with a lighted splint copper(II) (Cu2+) blue-green oxygen (O2) relights a glowing splint
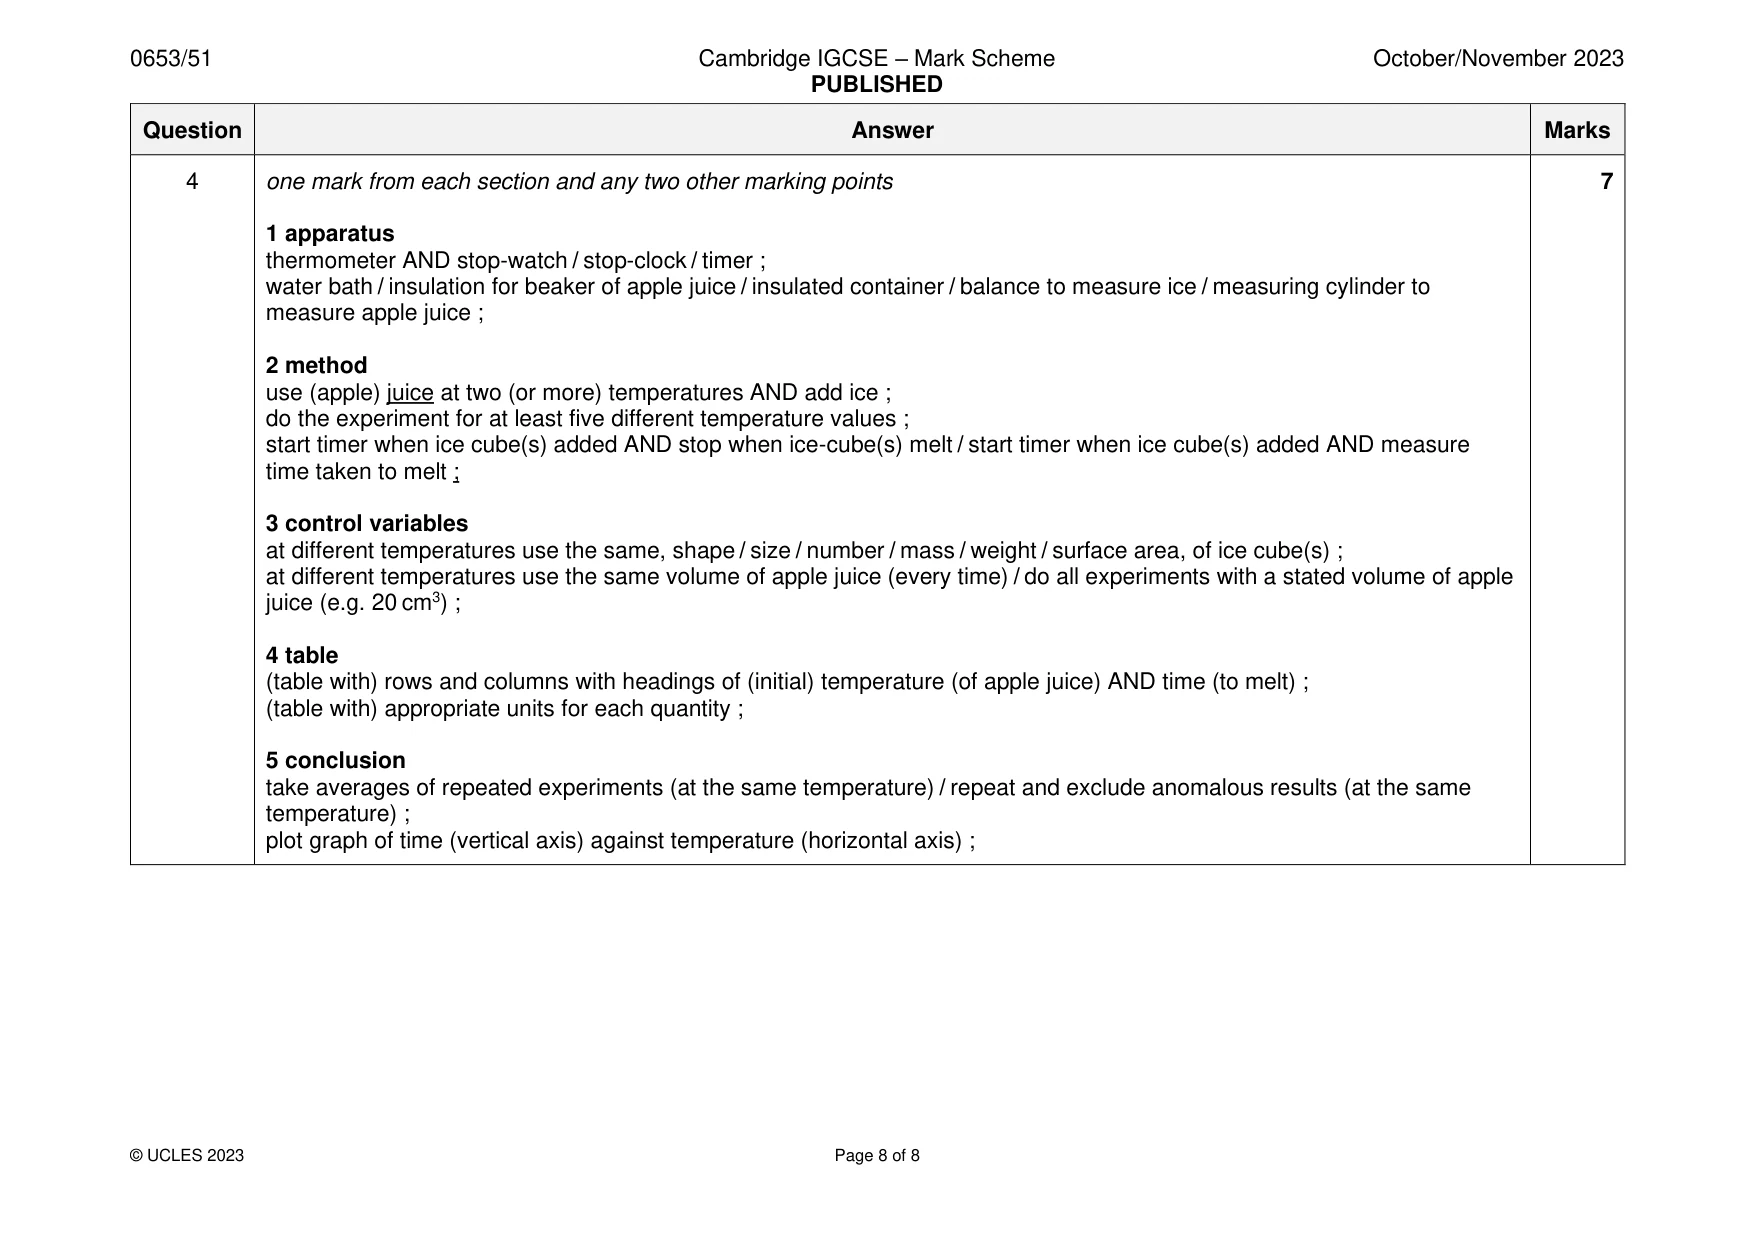
Mark scheme: 4 one mark from each section and any two other marking points 7 1 apparatus thermometer AND stop-watch / stop-clock / timer ; water bath / insulation for beaker of apple juice / insulated container / balance to measure ice / measuring cylinder to measure apple juice ; 2 method use (apple) juice at two (or more) temperatures AND add ice ; do the experiment for at least five different temperature values ; start timer when ice cube(s) added AND stop when ice-cube(s) melt / start timer when ice cube(s) added AND measure time taken to melt ; 3 control variables at different temperatures use the same, shape / size / number / mass / weight / surface area, of ice cube(s) ; at different temperatures use the same volume of apple juice (every time) / do all experiments with a stated volume of apple juice (e.g. 20 cm3) ; 4 table (table with) rows and columns with headings of (initial) temperature (of apple juice) AND time (to melt) ; (table with) appropriate units for each quantity ; 5 conclusion take averages of repeated experiments (at the same temperature) / repeat and exclude anomalous results (at the same temperature) ; plot graph of time (vertical axis) against temperature (horizontal axis) ;
What was in this paper
The subtopics covered by these 4 questions, and how many questions each got. Open one in a new tab to see every Cambridge question on it.
What you needed in this session
Cambridge’s own grade thresholds for 2023 Oct/Nov, Paper 5 · Variant 1. A higher threshold means an easier paper — the bar moves with how the cohort did.