Cambridge IGCSE Science - Combined 0653 — 2025 May/June Paper 5 · Variant 1
0653/51/M/J/25 · 4 questions · 40 marks · 75 min
The question paper and its mark scheme, free to read here and free to download. This is Cambridge’s own paper, exactly as it was sat.
Question paper16 pages




Mark scheme8 pages
Answers below. Sit the paper first if you are practising.
Questions as text
Q1 · You are going to investigate the nutrient content of three drinks, A, B and C
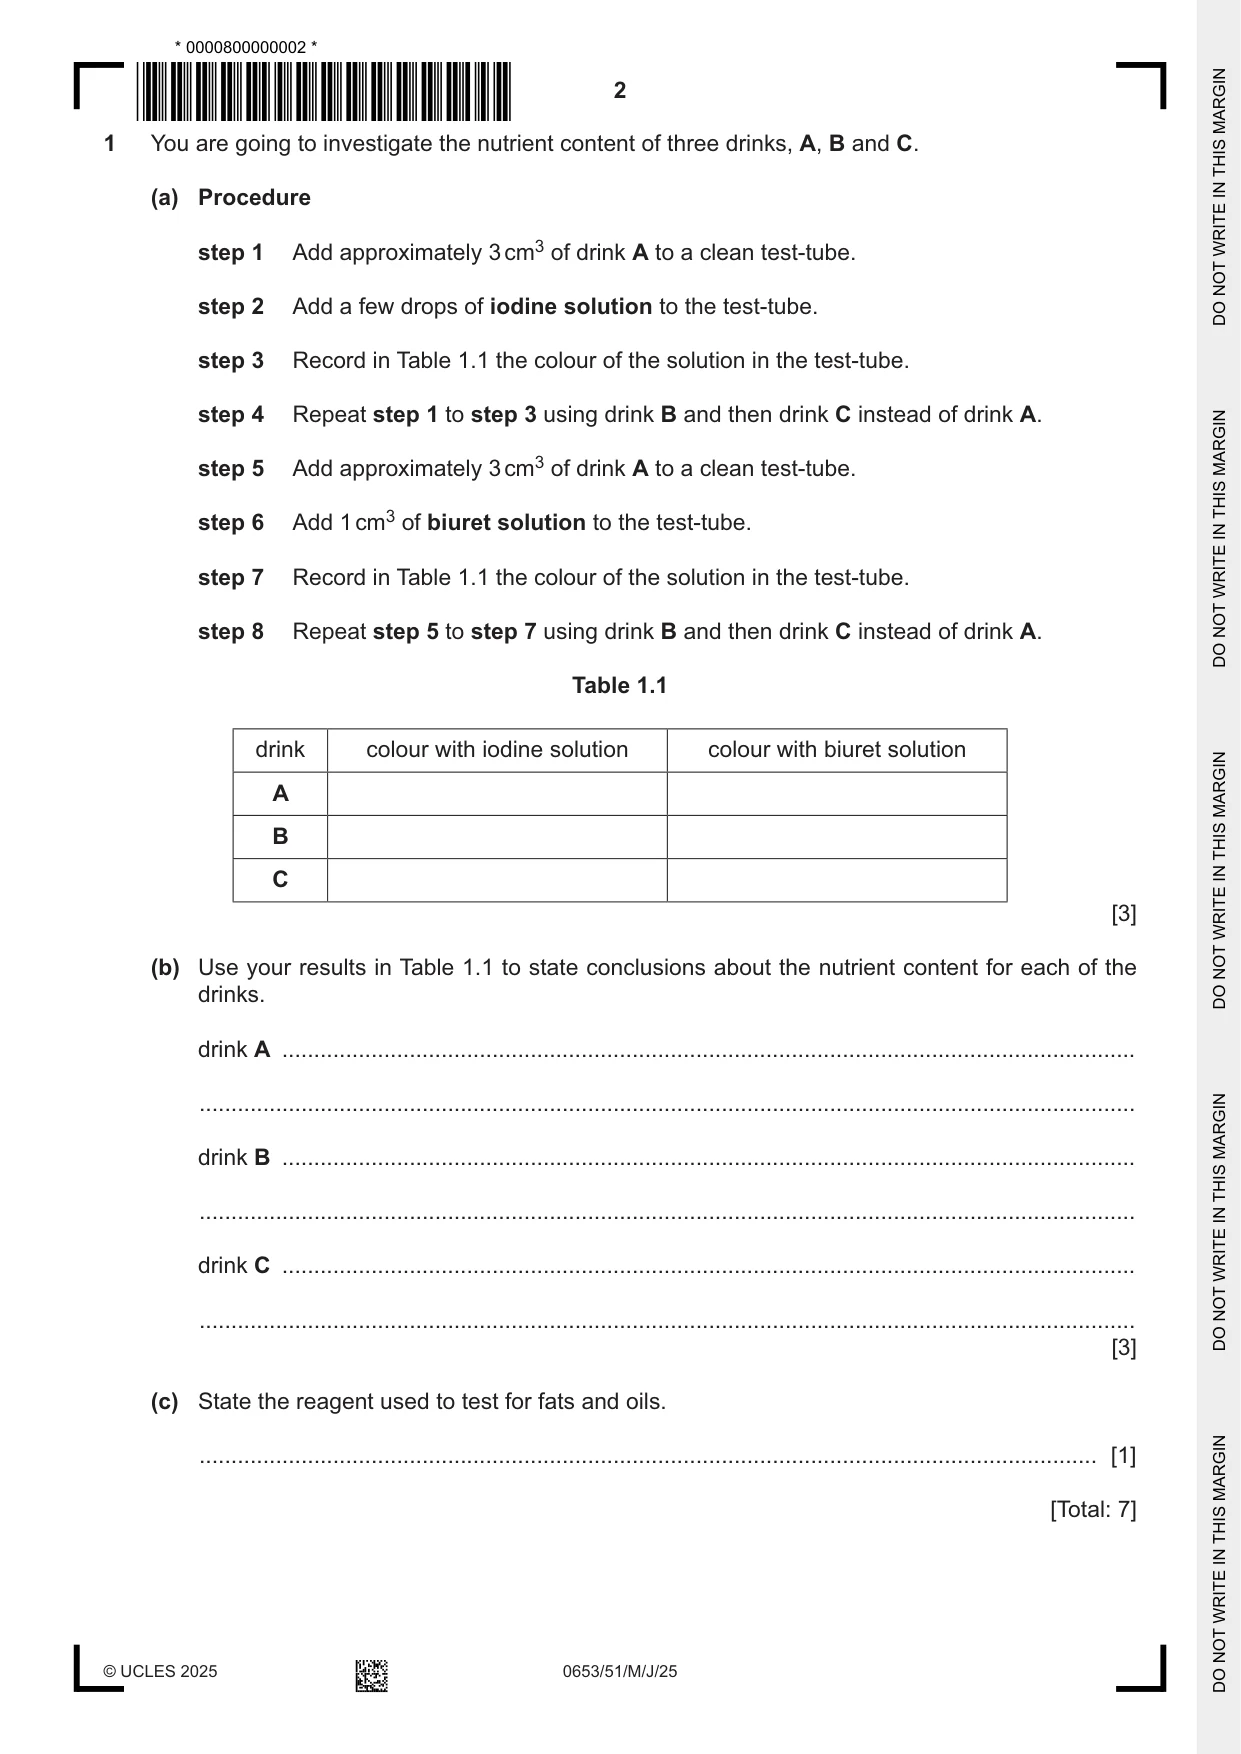
1 You are going to investigate the nutrient content of three drinks, A, B and C. (a) Procedure step 1 Add approximately 3 cm3 of drink A to a clean test-tube. step 2 Add a few drops of iodine solution to the test-tube. step 3 Record in Table 1.1 the colour of the solution in the test-tube. step 4 Repeat step 1 to step 3 using drink B and then drink C instead of drink A. step 5 Add approximately 3 cm3 of drink A to a clean test-tube. step 6 Add 1 cm3 of biuret solution to the test-tube. step 7 Record in Table 1.1 the colour of the solution in the test-tube. step 8 Repeat step 5 to step 7 using drink B and then drink C instead of drink A. Table 1.1 drink colour with iodine solution colour with biuret solution A B C [3] (b) Use your results in Table 1.1 to state conclusions about the nutrient content for each of the drinks. drink A ...................................................................................................................................... ................................................................................................................................................... drink B ...................................................................................................................................... ................................................................................................................................................... drink C ...................................................................................................................................... ................................................................................................................................................... [3] (c) State the reagent used to test for fats and oils. ............................................................................................................................................. [1] [Total: 7]
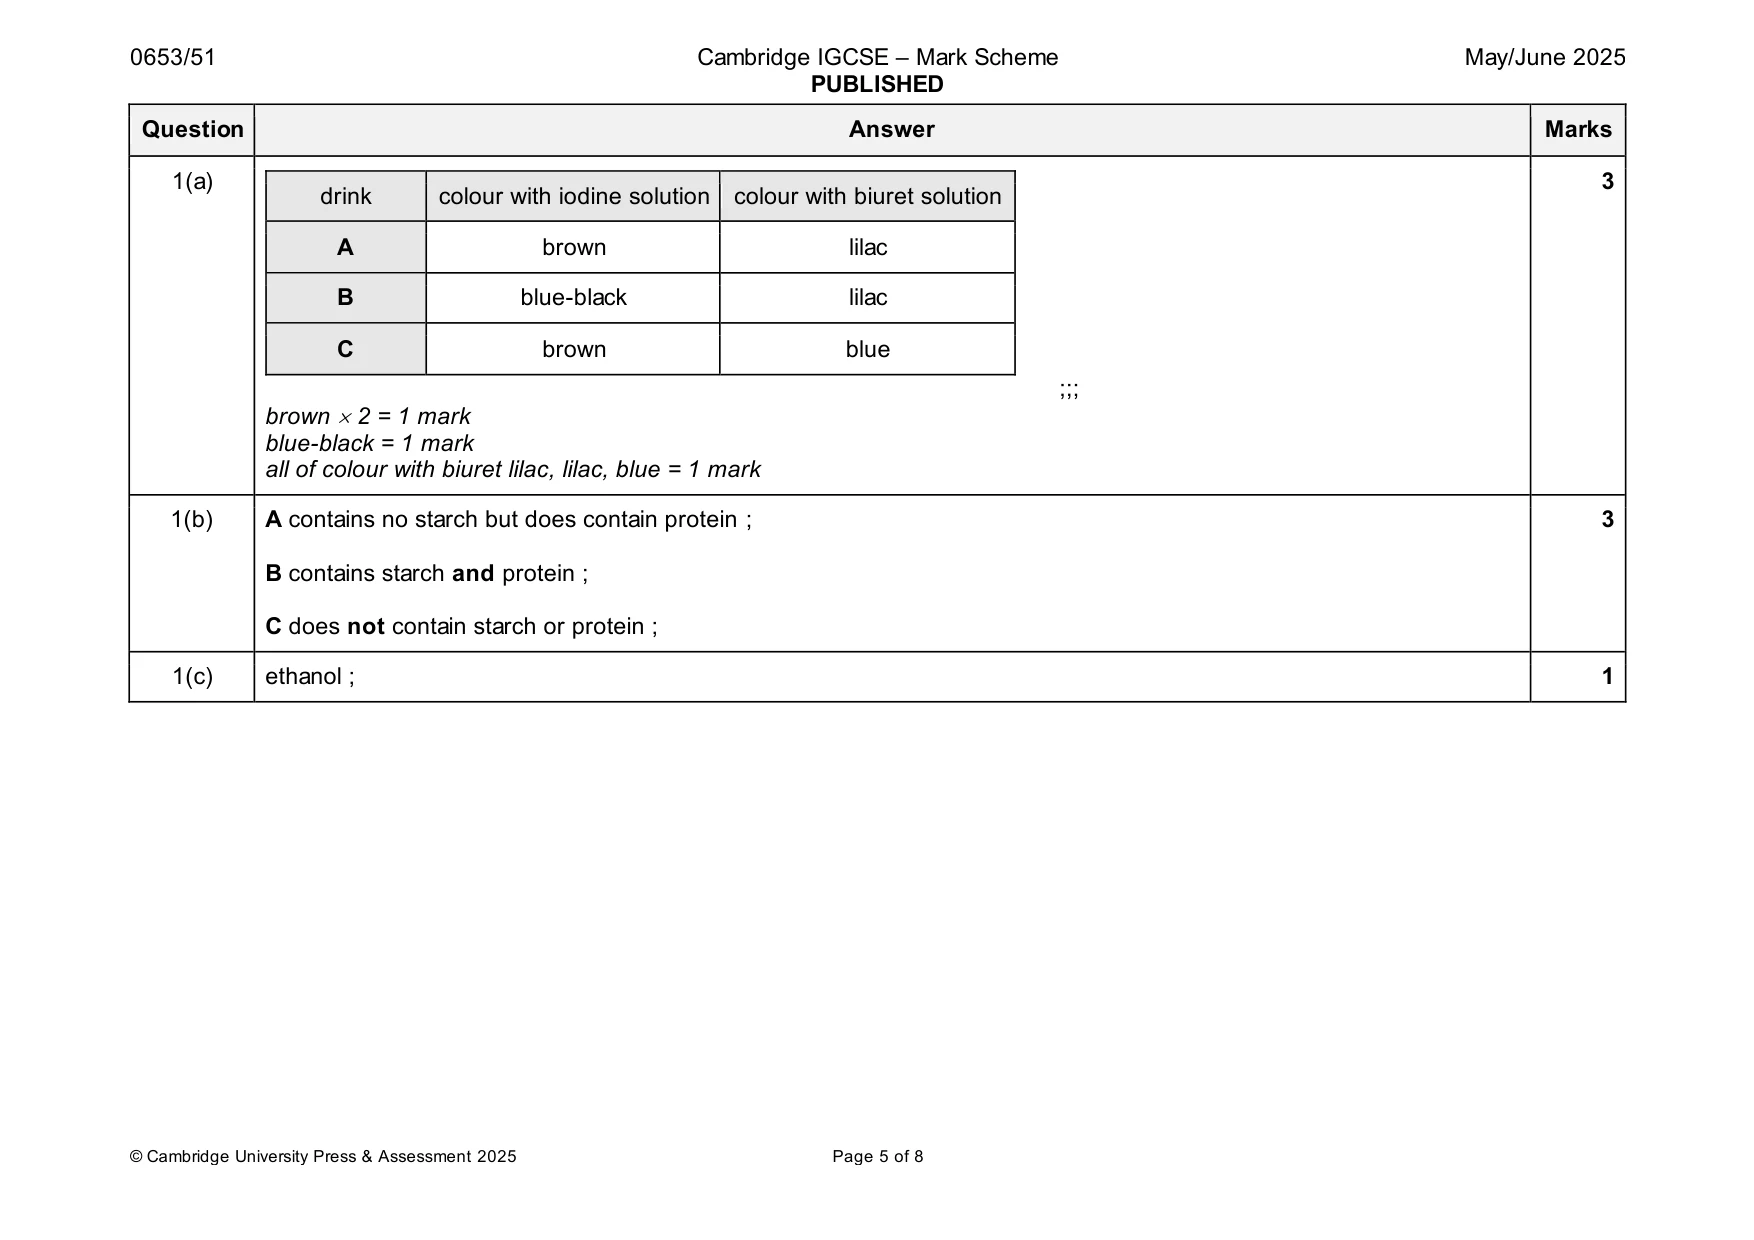
Mark scheme: Question Answer Marks 1(a) 3 drink colour with iodine solution colour with biuret solution A brown lilac B blue-black lilac C brown blue ;;; brown 2 = 1 mark blue-black = 1 mark all of colour with biuret lilac, lilac, blue = 1 mark 1(b) A contains no starch but does contain protein ; 3 B contains starch and protein ; C does not contain starch or protein ; 1(c) ethanol ; 1
Q2 · Invertase is an enzyme
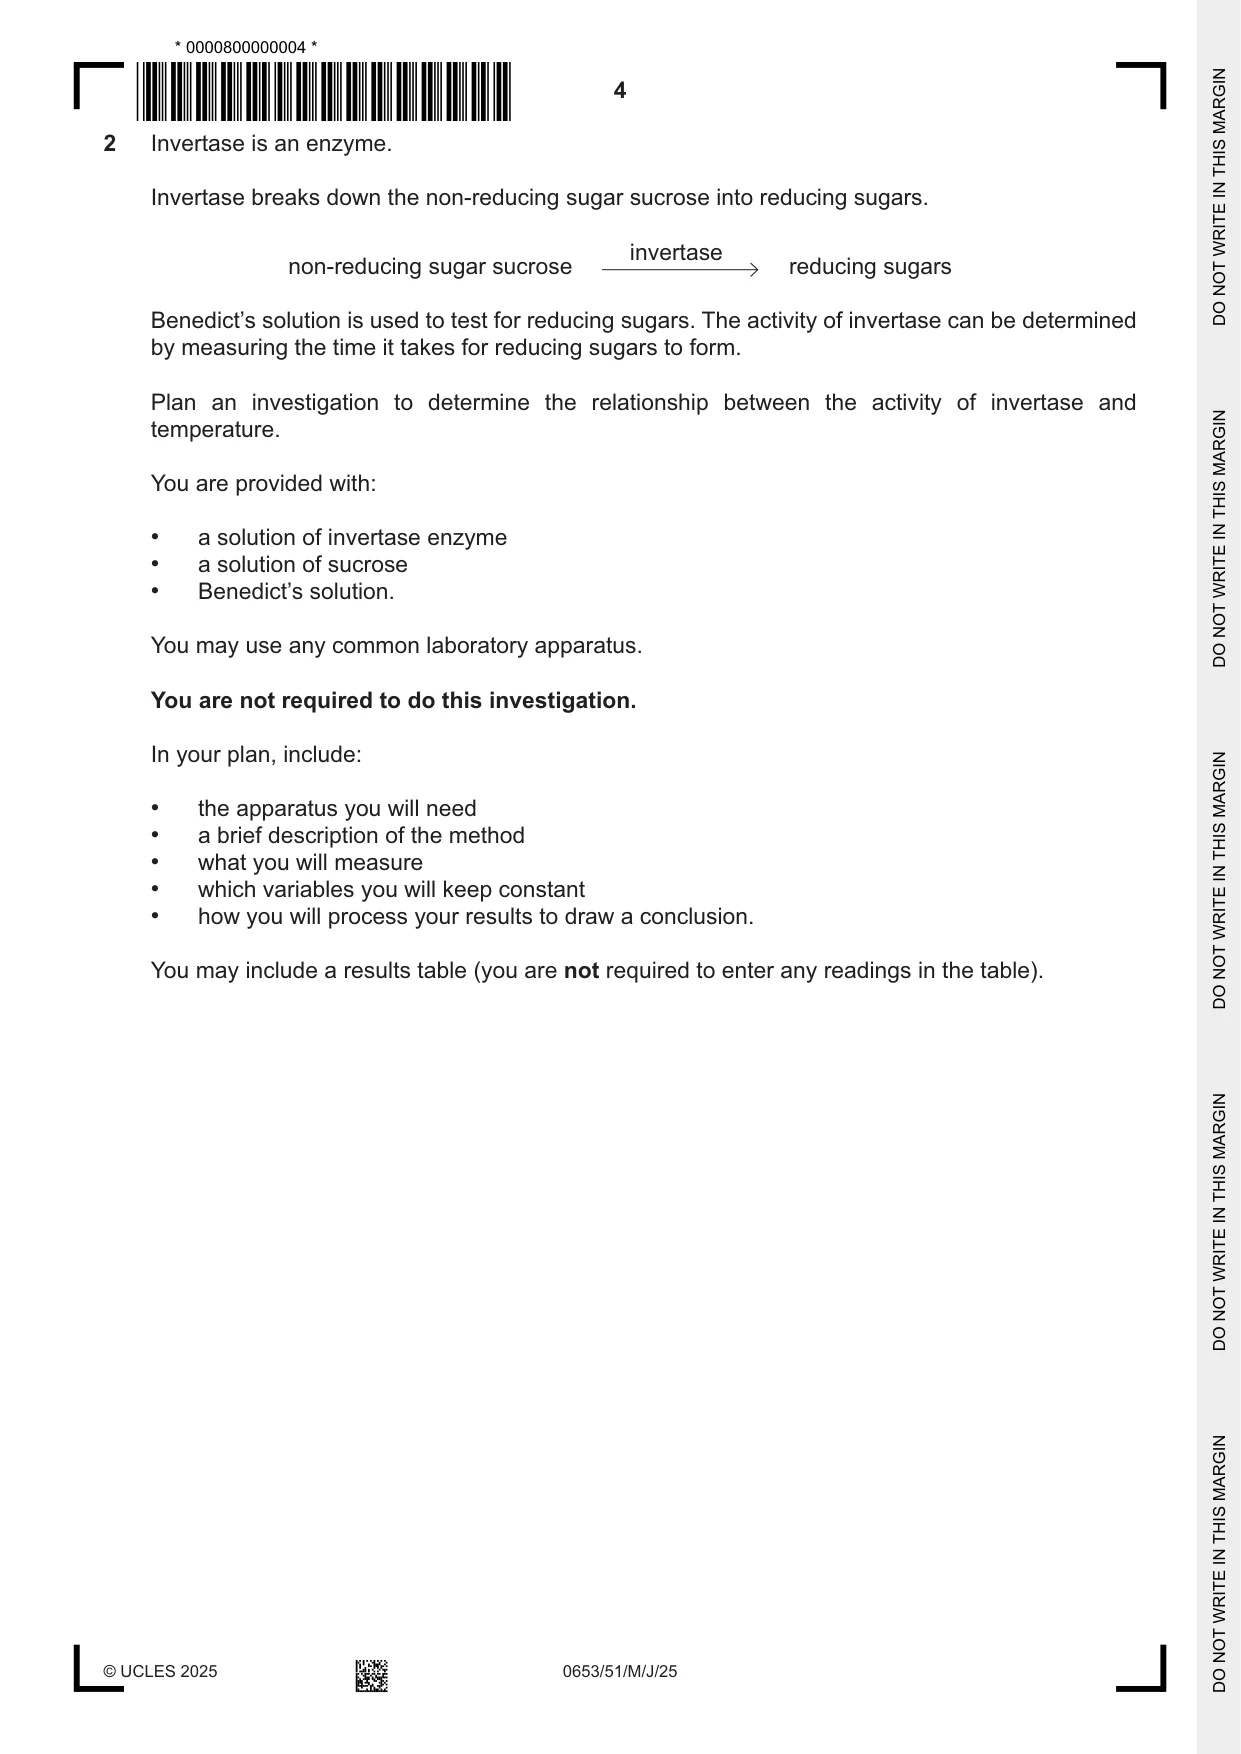
2 Invertase is an enzyme. Invertase breaks down the non-reducing sugar sucrose into reducing sugars. invertase non-reducing sugar sucrose reducing sugars Benedict’s solution is used to test for reducing sugars. The activity of invertase can be determined by measuring the time it takes for reducing sugars to form. Plan an investigation to determine the relationship between the activity of invertase and temperature. You are provided with: • a solution of invertase enzyme • a solution of sucrose • Benedict’s solution. You may use any common laboratory apparatus. You are not required to do this investigation. In your plan, include: • the apparatus you will need • a brief description of the method • what you will measure • which variables you will keep constant • how you will process your results to draw a conclusion. You may include a results table (you are not required to enter any readings in the table). .......................................................................................................................................................... .......................................................................................................................................................... .......................................................................................................................................................... .......................................................................................................................................................... .......................................................................................................................................................... .......................................................................................................................................................... .......................................................................................................................................................... .......................................................................................................................................................... .......................................................................................................................................................... .......................................................................................................................................................... .......................................................................................................................................................... .......................................................................................................................................................... .......................................................................................................................................................... .................................................................................................................................................... [7]
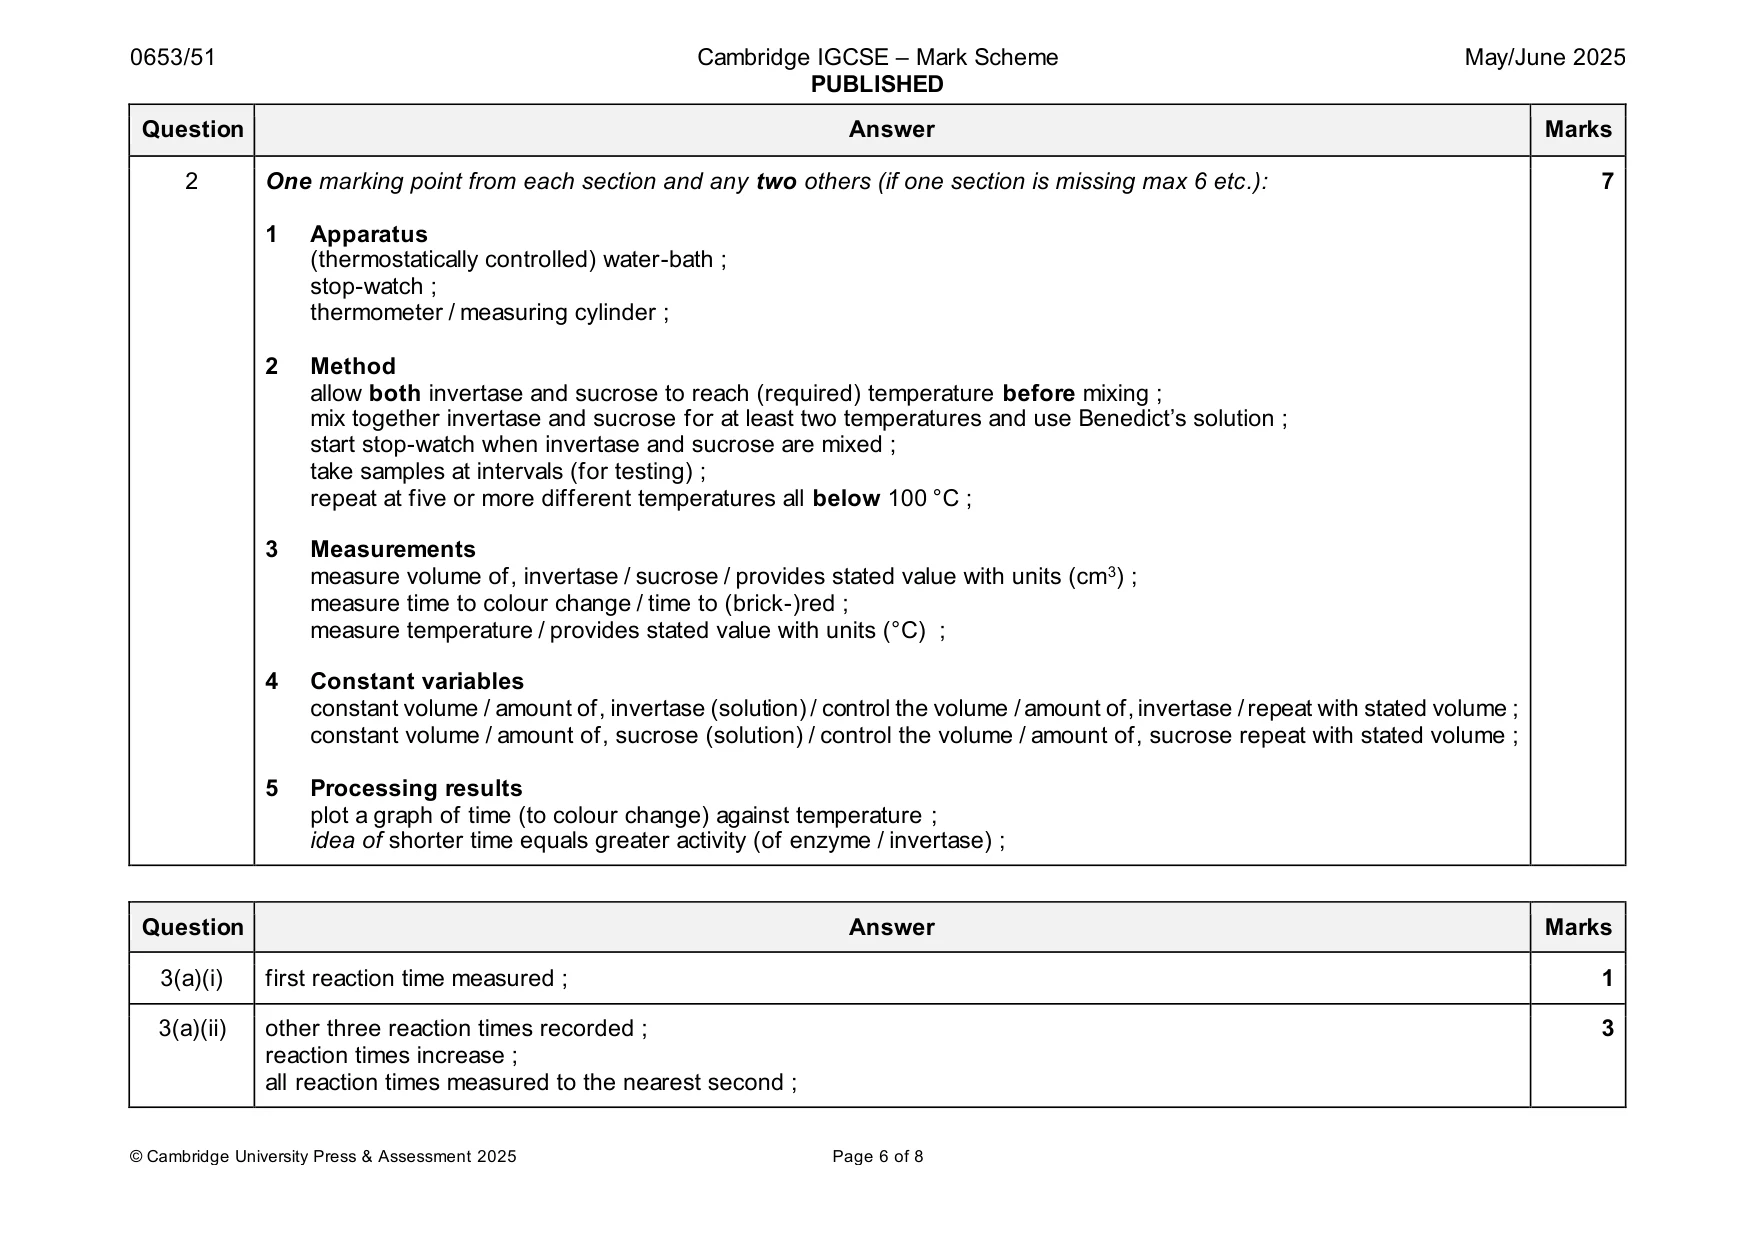
Mark scheme: 2 One marking point from each section and any two others (if one section is missing max 6 etc.): 7 1 Apparatus (thermostatically controlled) water-bath ; stop-watch ; thermometer / measuring cylinder ; 2 Method allow both invertase and sucrose to reach (required) temperature before mixing ; mix together invertase and sucrose for at least two temperatures and use Benedict’s solution ; start stop-watch when invertase and sucrose are mixed ; take samples at intervals (for testing) ; repeat at five or more different temperatures all below 100 °C ; 3 Measurements measure volume of, invertase / sucrose / provides stated value with units (cm3) ; measure time to colour change / time to (brick-)red ; measure temperature / provides stated value with units (°C) ; 4 Constant variables constant volume / amount of, invertase (solution) / control the volume / amount of, invertase / repeat with stated volume ; constant volume / amount of, sucrose (solution) / control the volume / amount of, sucrose repeat with stated volume ; 5 Processing results plot a graph of time (to colour change) against temperature ; idea of shorter time equals greater activity (of enzyme / invertase) ;
Q3 · You are going to investigate aqueous H
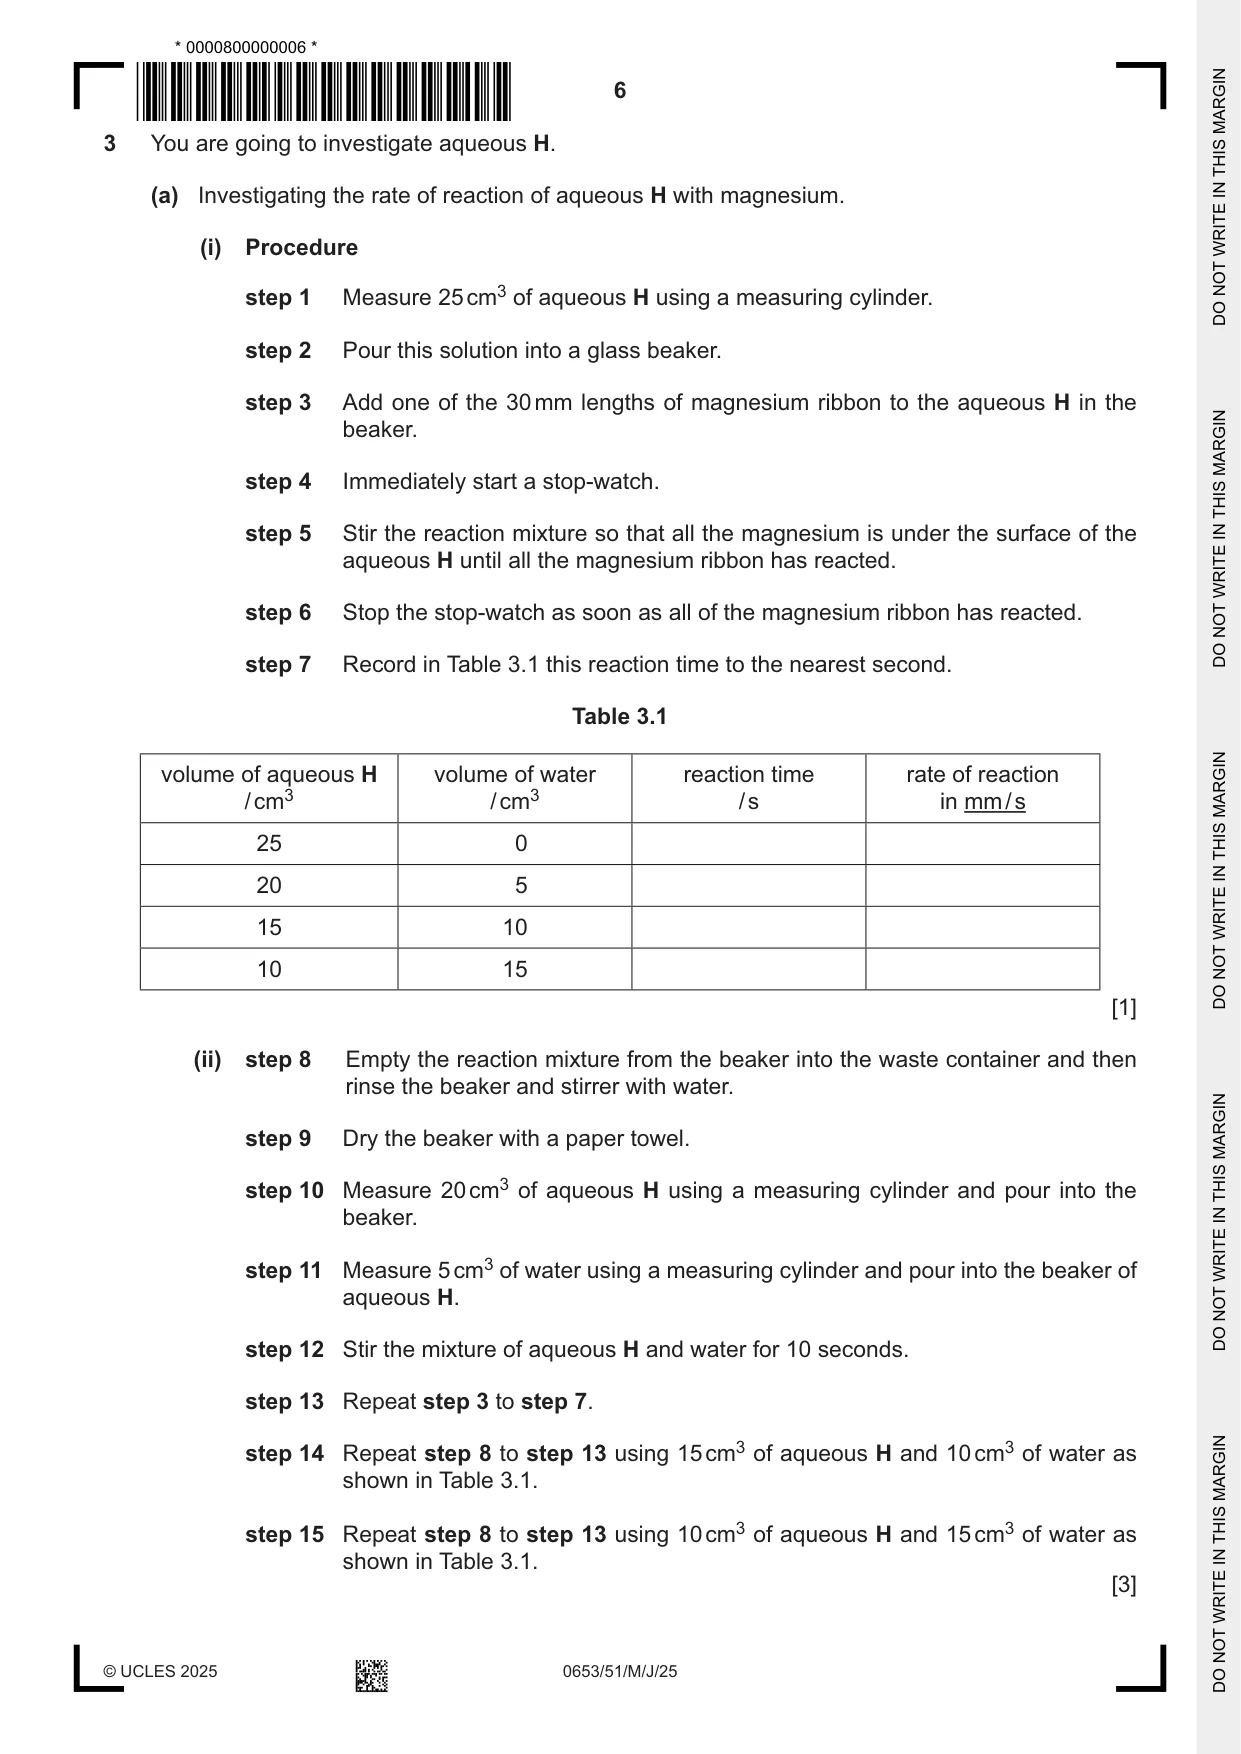
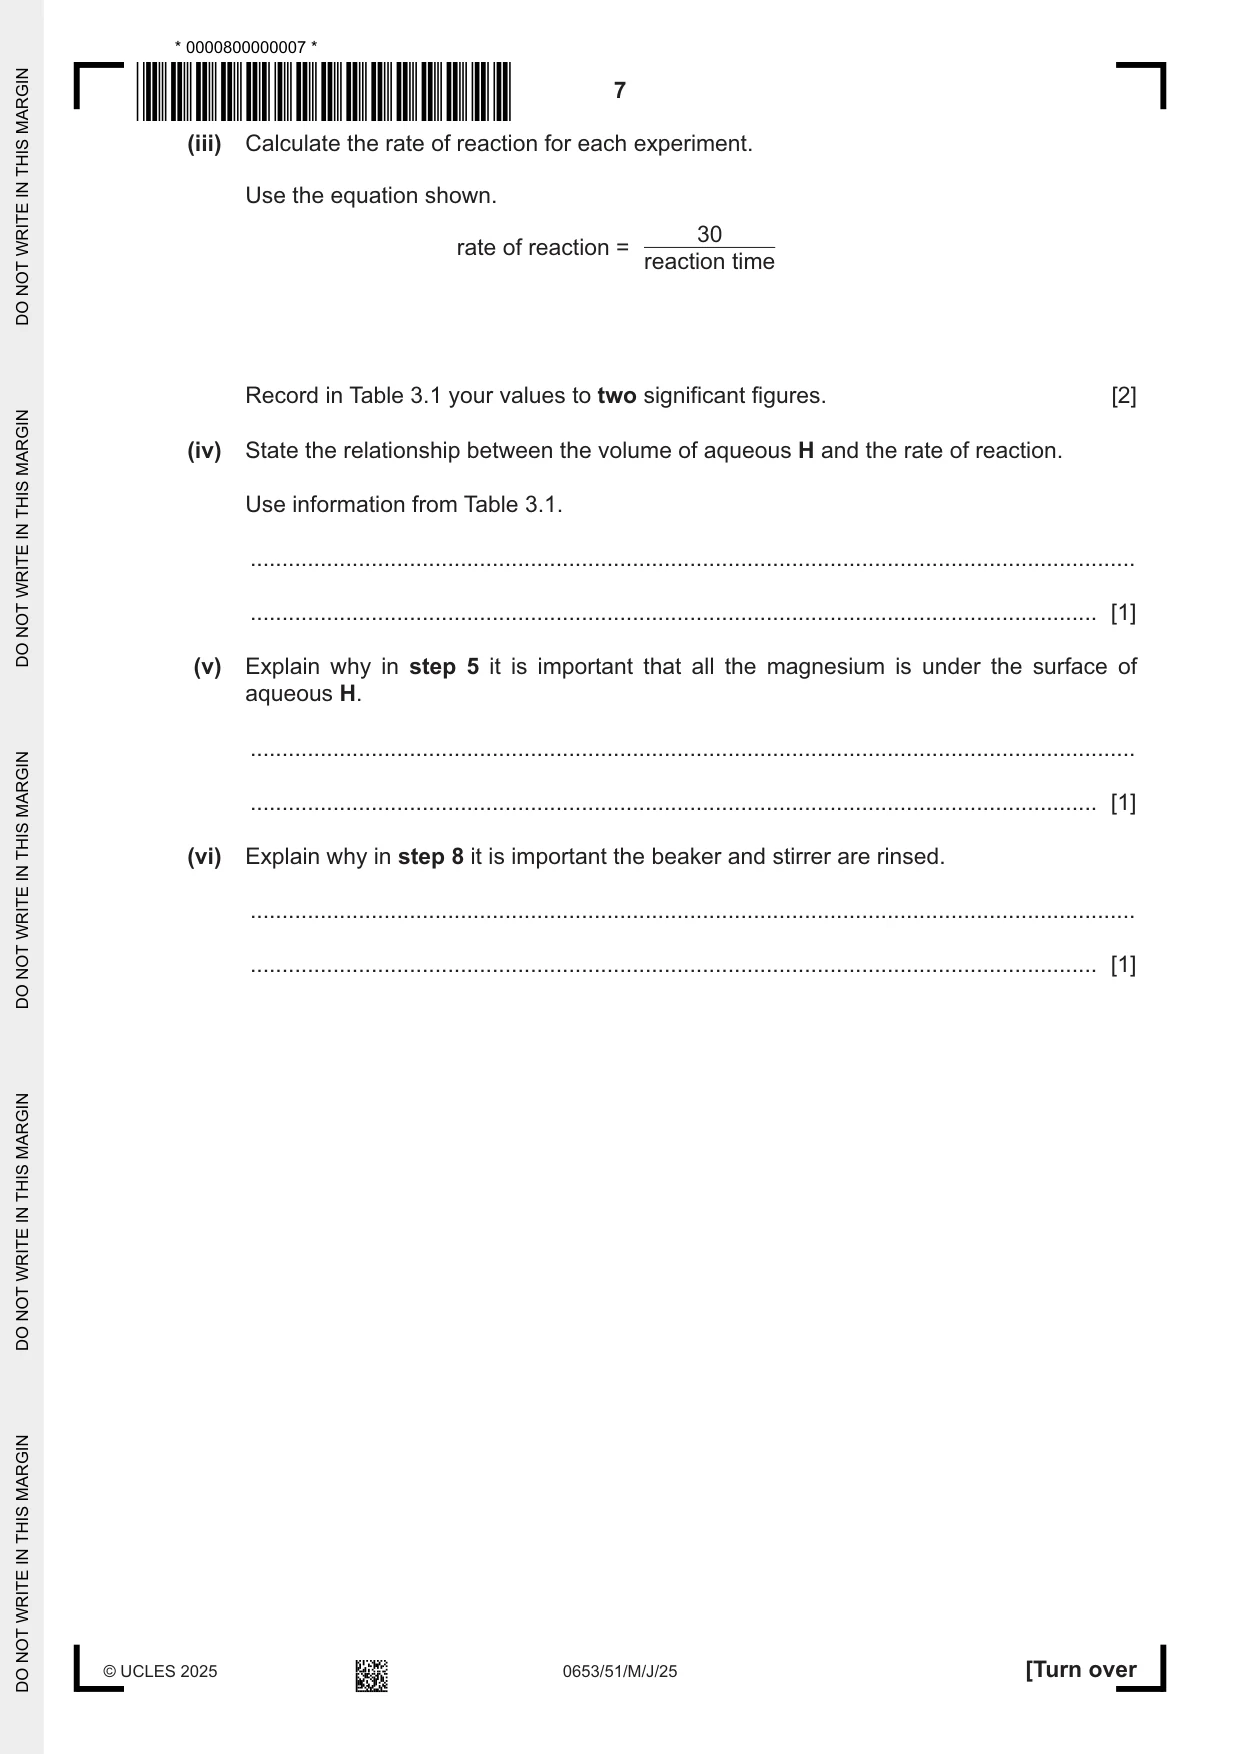
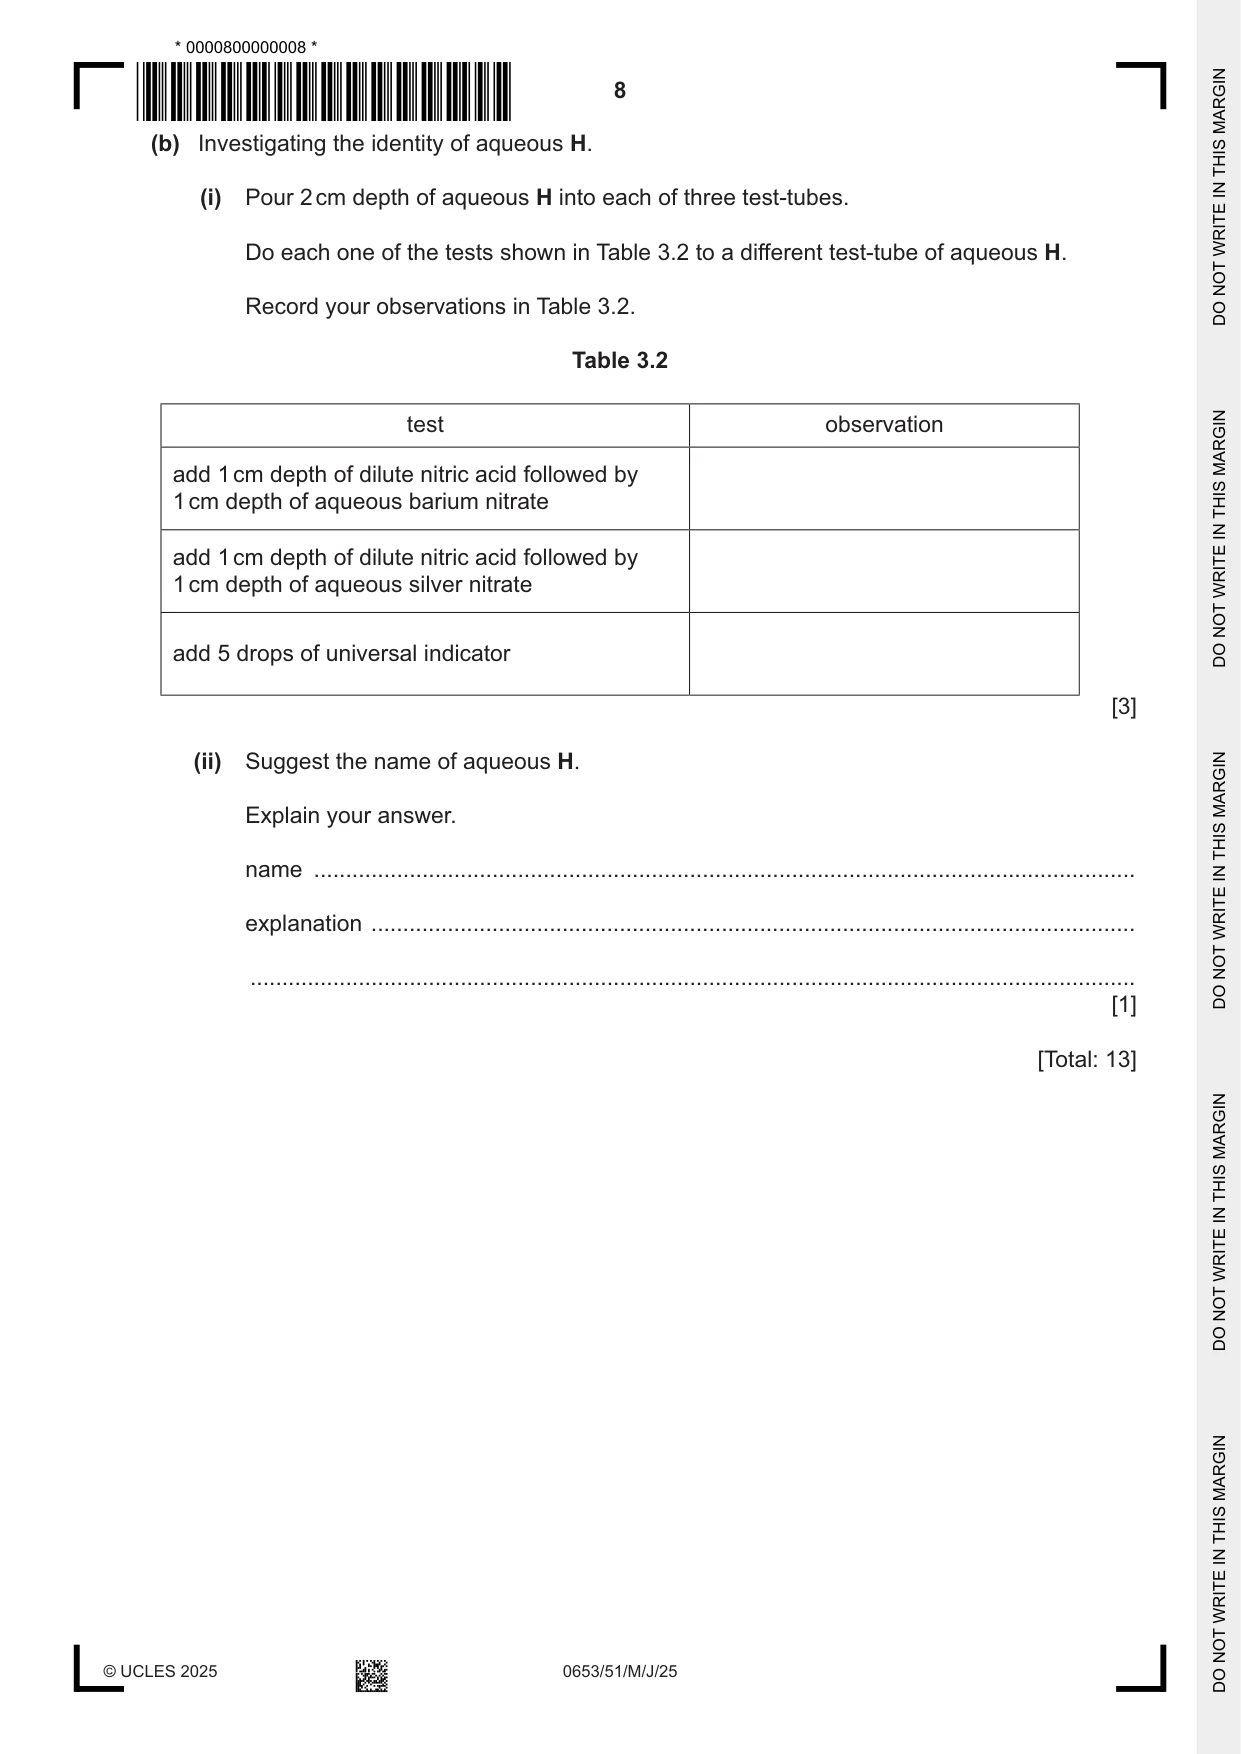
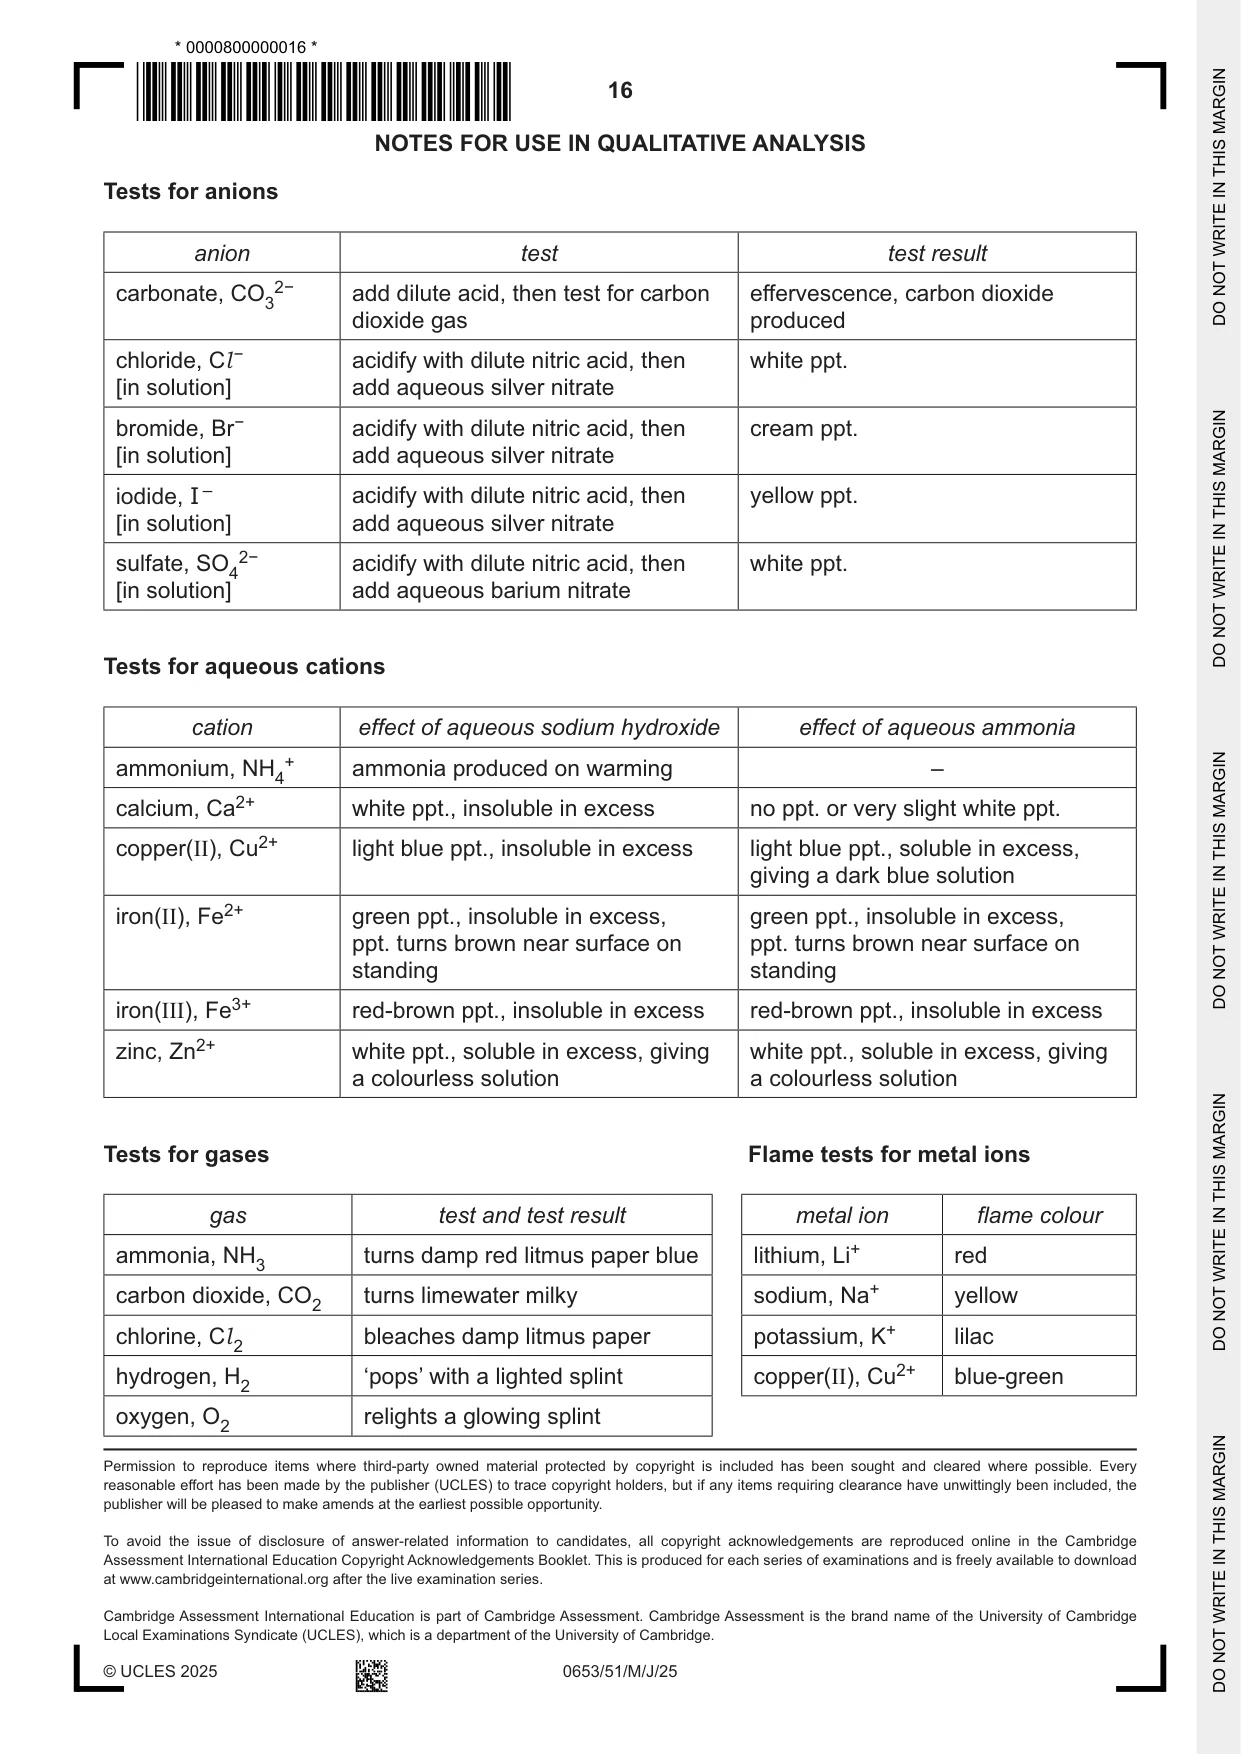
3 You are going to investigate aqueous H. (a) Investigating the rate of reaction of aqueous H with magnesium. (i) Procedure step 1 Measure 25 cm3 of aqueous H using a measuring cylinder. step 2 Pour this solution into a glass beaker. step 3 Add one of the 30 mm lengths of magnesium ribbon to the aqueous H in the beaker. step 4 Immediately start a stop-watch. step 5 Stir the reaction mixture so that all the magnesium is under the surface of the aqueous H until all the magnesium ribbon has reacted. step 6 Stop the stop-watch as soon as all of the magnesium ribbon has reacted. step 7 Record in Table 3.1 this reaction time to the nearest second. Table 3.1 volume of aqueous H volume of water reaction time rate of reaction / cm3 / cm3 / s in mm / s 25 0 20 5 15 10 10 15 [1] (ii) step 8 Empty the reaction mixture from the beaker into the waste container and then rinse the beaker and stirrer with water. step 9 Dry the beaker with a paper towel. step 10 Measure 20 cm3 of aqueous H using a measuring cylinder and pour into the beaker. step 11 Measure 5 cm3 of water using a measuring cylinder and pour into the beaker of aqueous H. step 12 Stir the mixture of aqueous H and water for 10 seconds. step 13 Repeat step 3 to step 7. step 14 Repeat step 8 to step 13 using 15 cm3 of aqueous H and 10 cm3 of water as shown in Table 3.1. step 15 Repeat step 8 to step 13 using 10 cm3 of aqueous H and 15 cm3 of water as shown in Table 3.1. [3] (iii) Calculate the rate of reaction for each experiment. Use the equation shown. 30 rate of reaction = reaction time Record in Table 3.1 your values to two significant figures. [2] (iv) State the relationship between the volume of aqueous H and the rate of reaction. Use information from Table 3.1. ........................................................................................................................................... ..................................................................................................................................... [1] (v) Explain why in step 5 it is important that all the magnesium is under the surface of aqueous H. ........................................................................................................................................... ..................................................................................................................................... [1] (vi) Explain why in step 8 it is important the beaker and stirrer are rinsed. ........................................................................................................................................... ..................................................................................................................................... [1] (b) Investigating the identity of aqueous H. (i) Pour 2 cm depth of aqueous H into each of three test-tubes. Do each one of the tests shown in Table 3.2 to a different test-tube of aqueous H. Record your observations in Table 3.2. Table 3.2 test observation add 1 cm depth of dilute nitric acid followed by 1 cm depth of aqueous barium nitrate add 1 cm depth of dilute nitric acid followed by 1 cm depth of aqueous silver nitrate add 5 drops of universal indicator [3] (ii) Suggest the name of aqueous H. Explain your answer. name ................................................................................................................................. explanation ........................................................................................................................ ........................................................................................................................................... [1] [Total: 13]
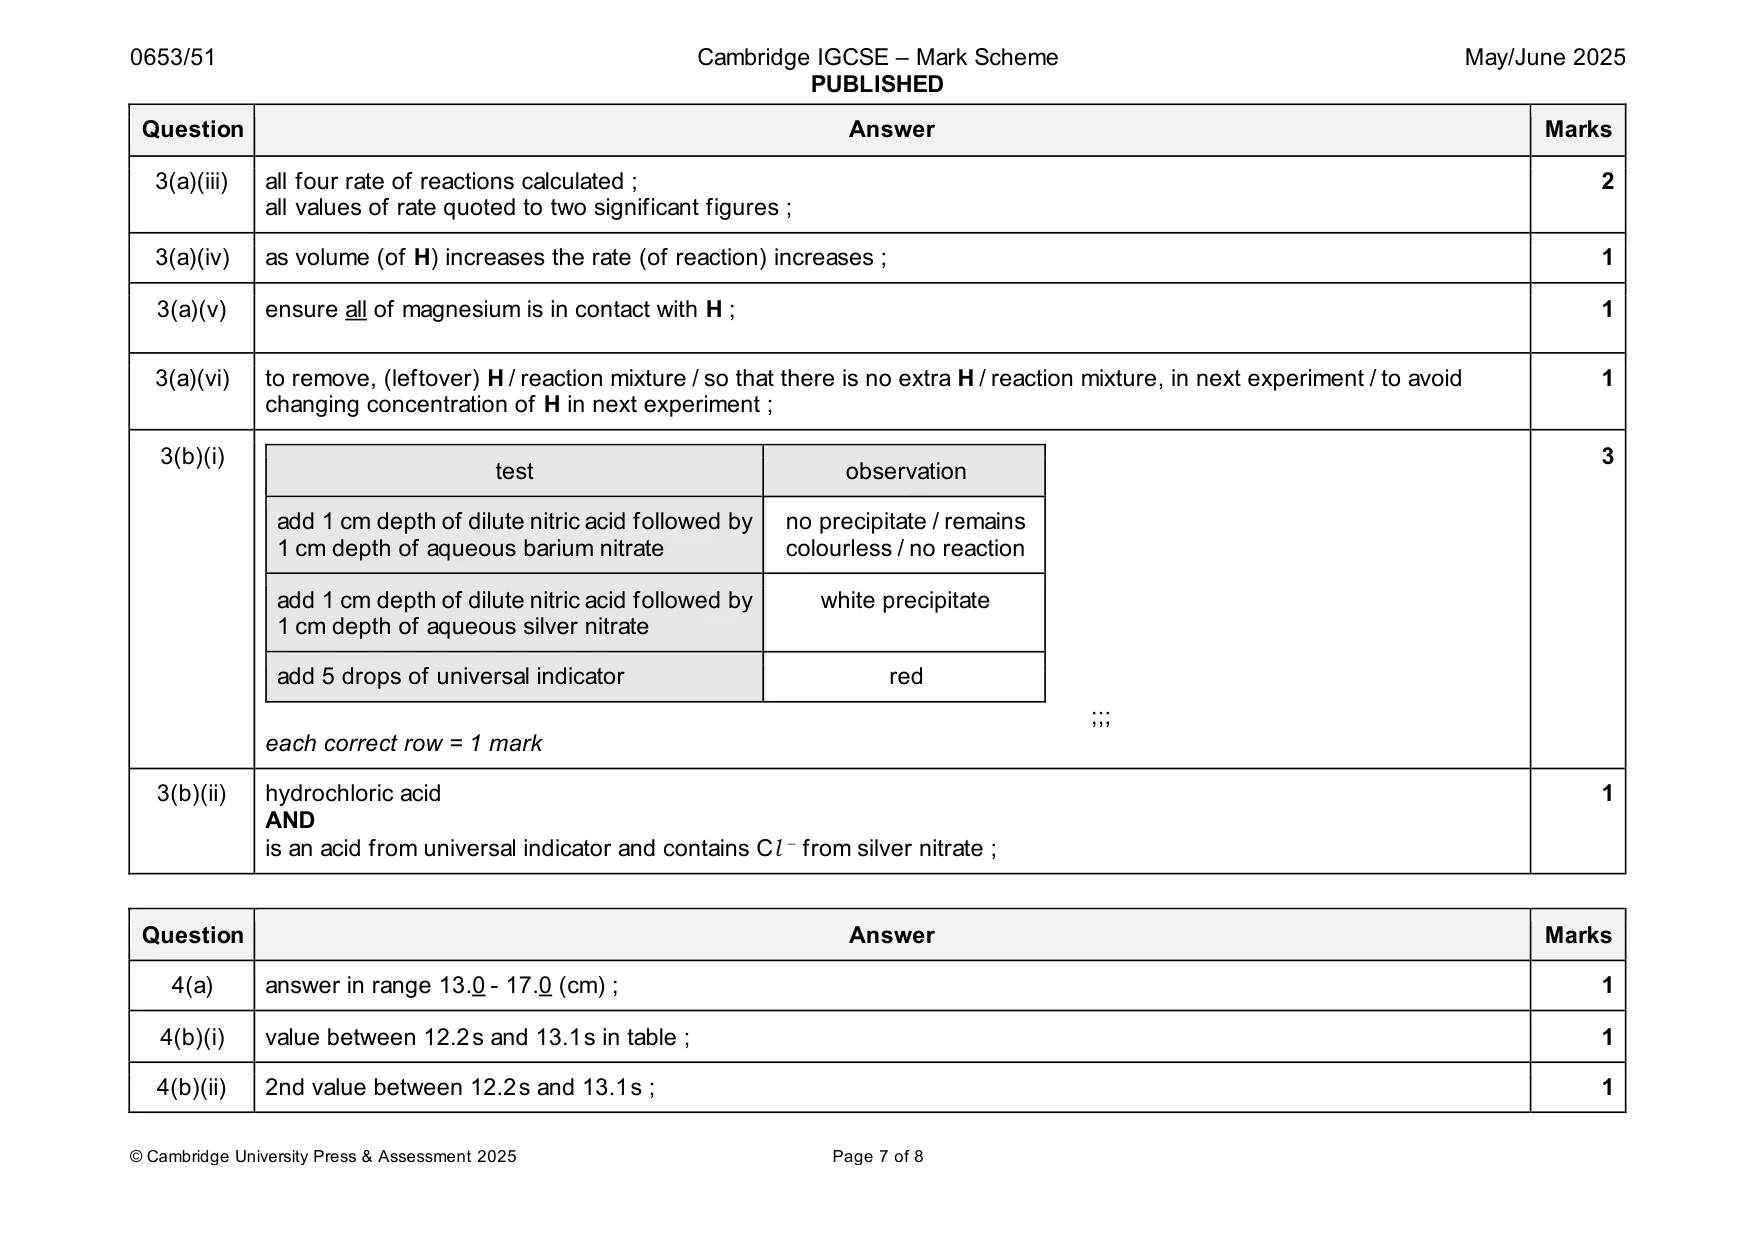
Mark scheme: 3(a)(i) first reaction time measured ; 1 3(a)(ii) other three reaction times recorded ; 3 reaction times increase ; all reaction times measured to the nearest second ; 3(a)(iii) all four rate of reactions calculated ; 2 all values of rate quoted to two significant figures ; 3(a)(iv) as volume (of H) increases the rate (of reaction) increases ; 1 3(a)(v) ensure all of magnesium is in contact with H ; 1 3(a)(vi) to remove, (leftover) H / reaction mixture / so that there is no extra H / reaction mixture, in next experiment / to avoid 1 changing concentration of H in next experiment ; 3(b)(i) 3 test observation add 1 cm depth of dilute nitric acid followed by no precipitate / remains 1 cm depth of aqueous barium nitrate colourless / no reaction add 1 cm depth of dilute nitric acid followed by white precipitate 1 cm depth of aqueous silver nitrate add 5 drops of universal indicator red ;;; each correct row = 1 mark 3(b)(ii) hydrochloric acid 1 AND is an acid from universal indicator and contains Cl − from silver nitrate ;
Q4 · You are going to determine the period T of a pendulum
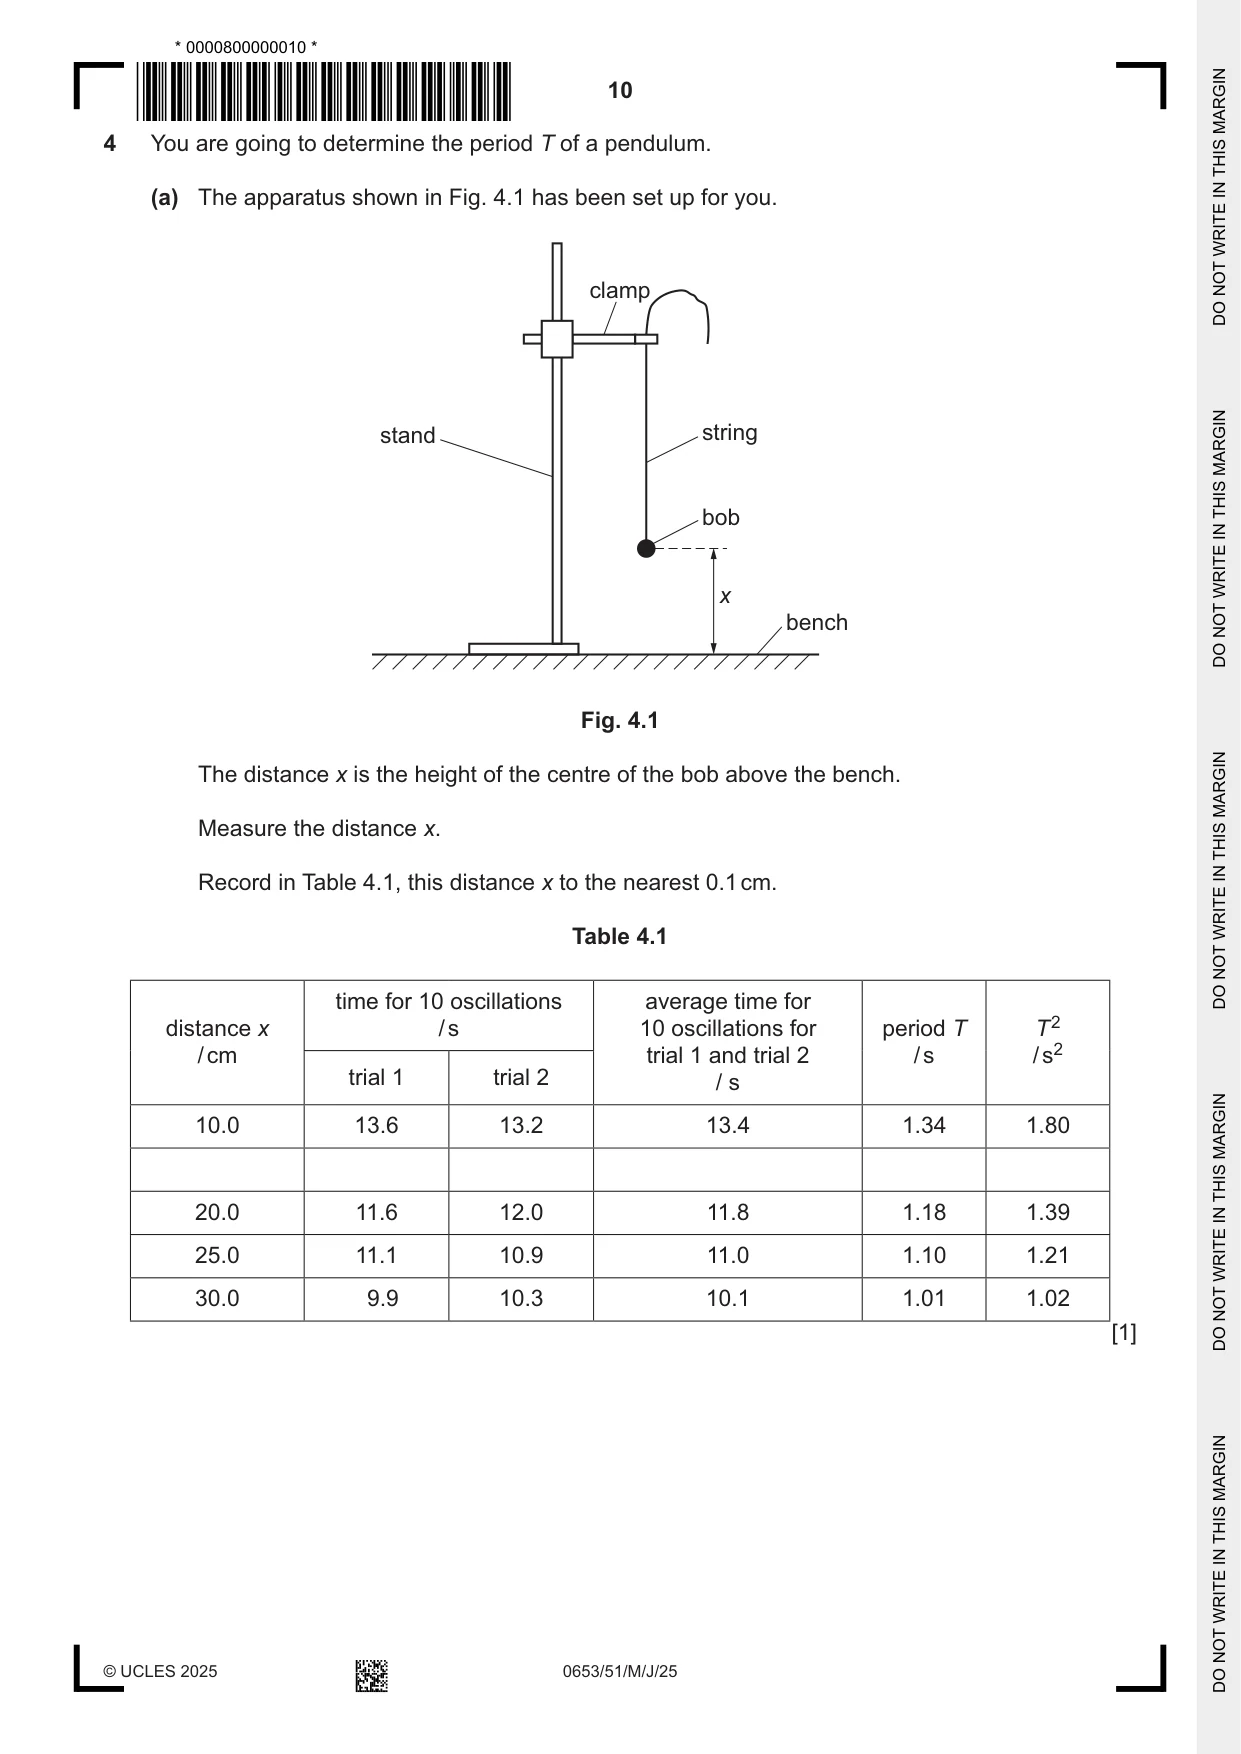
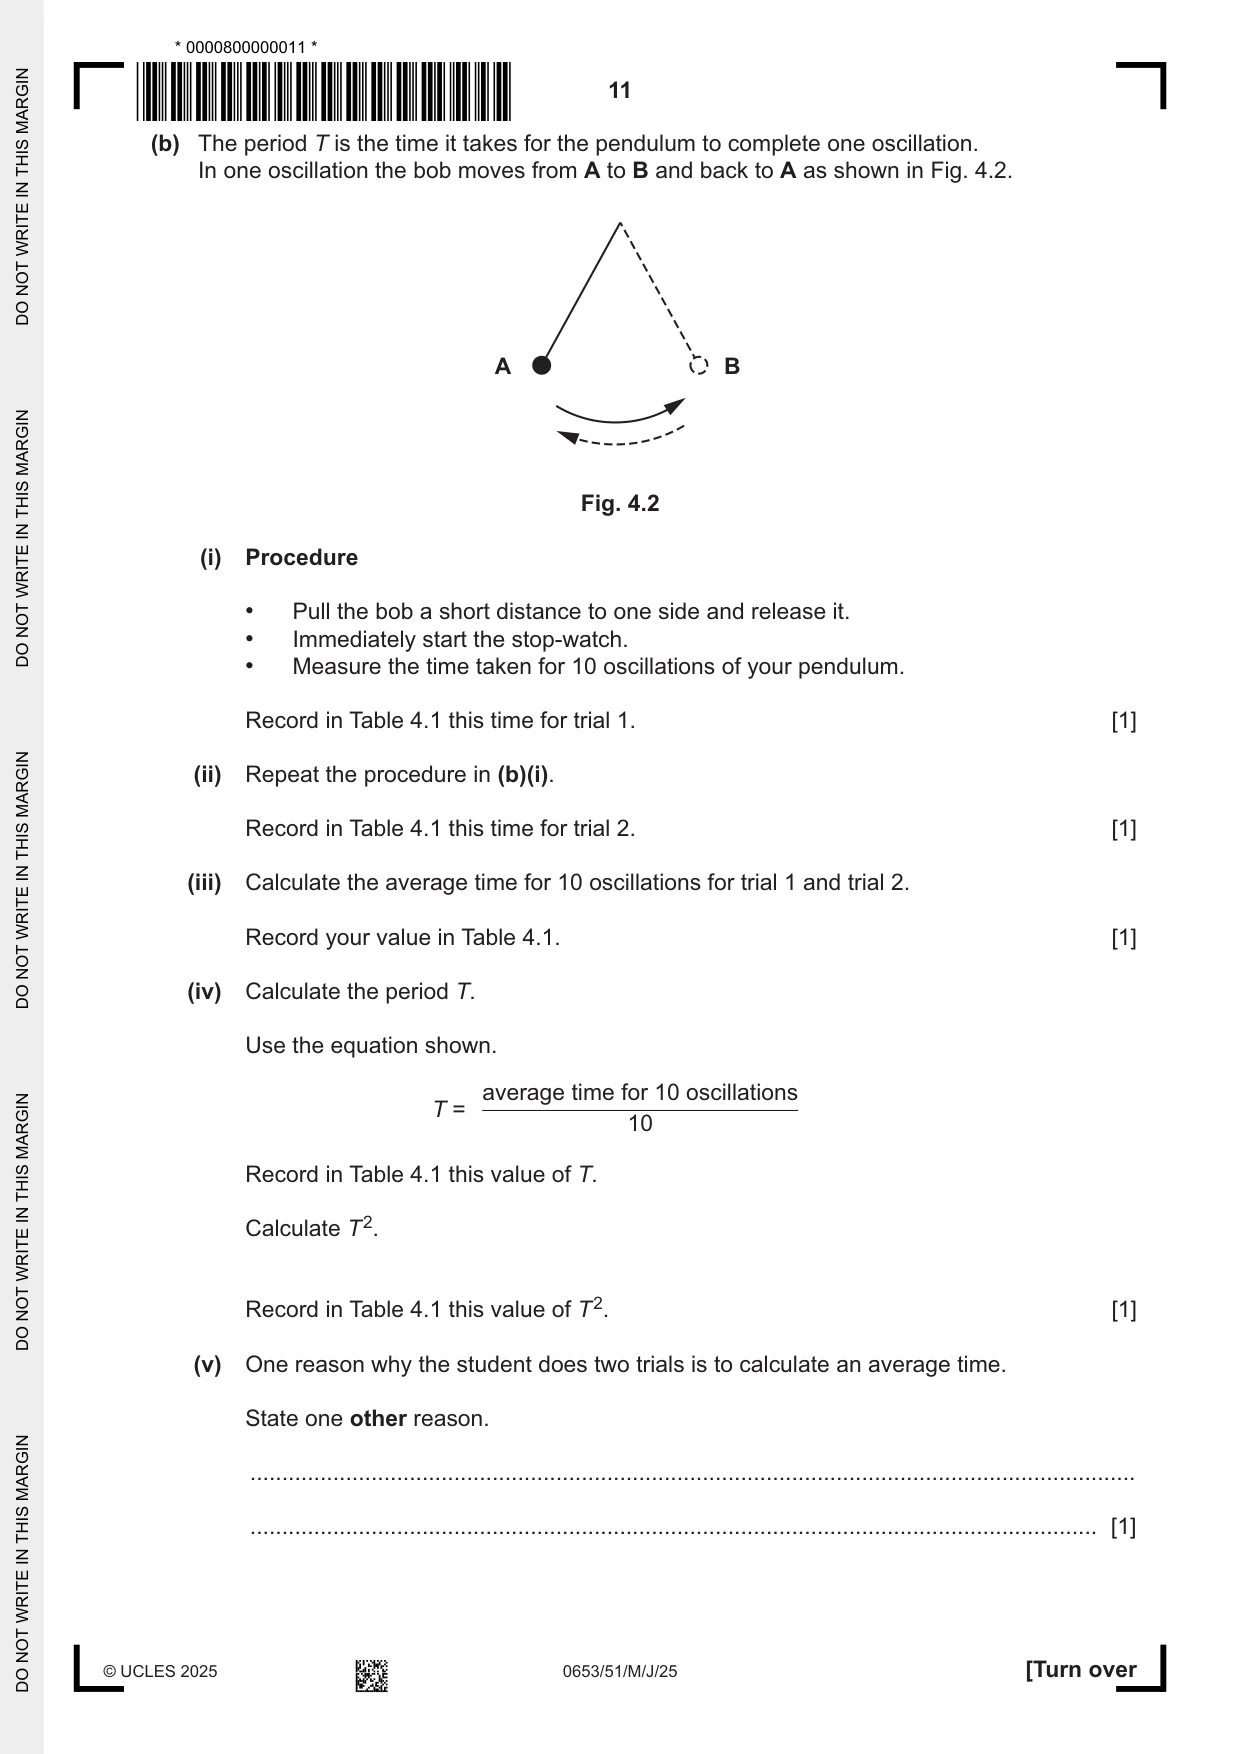
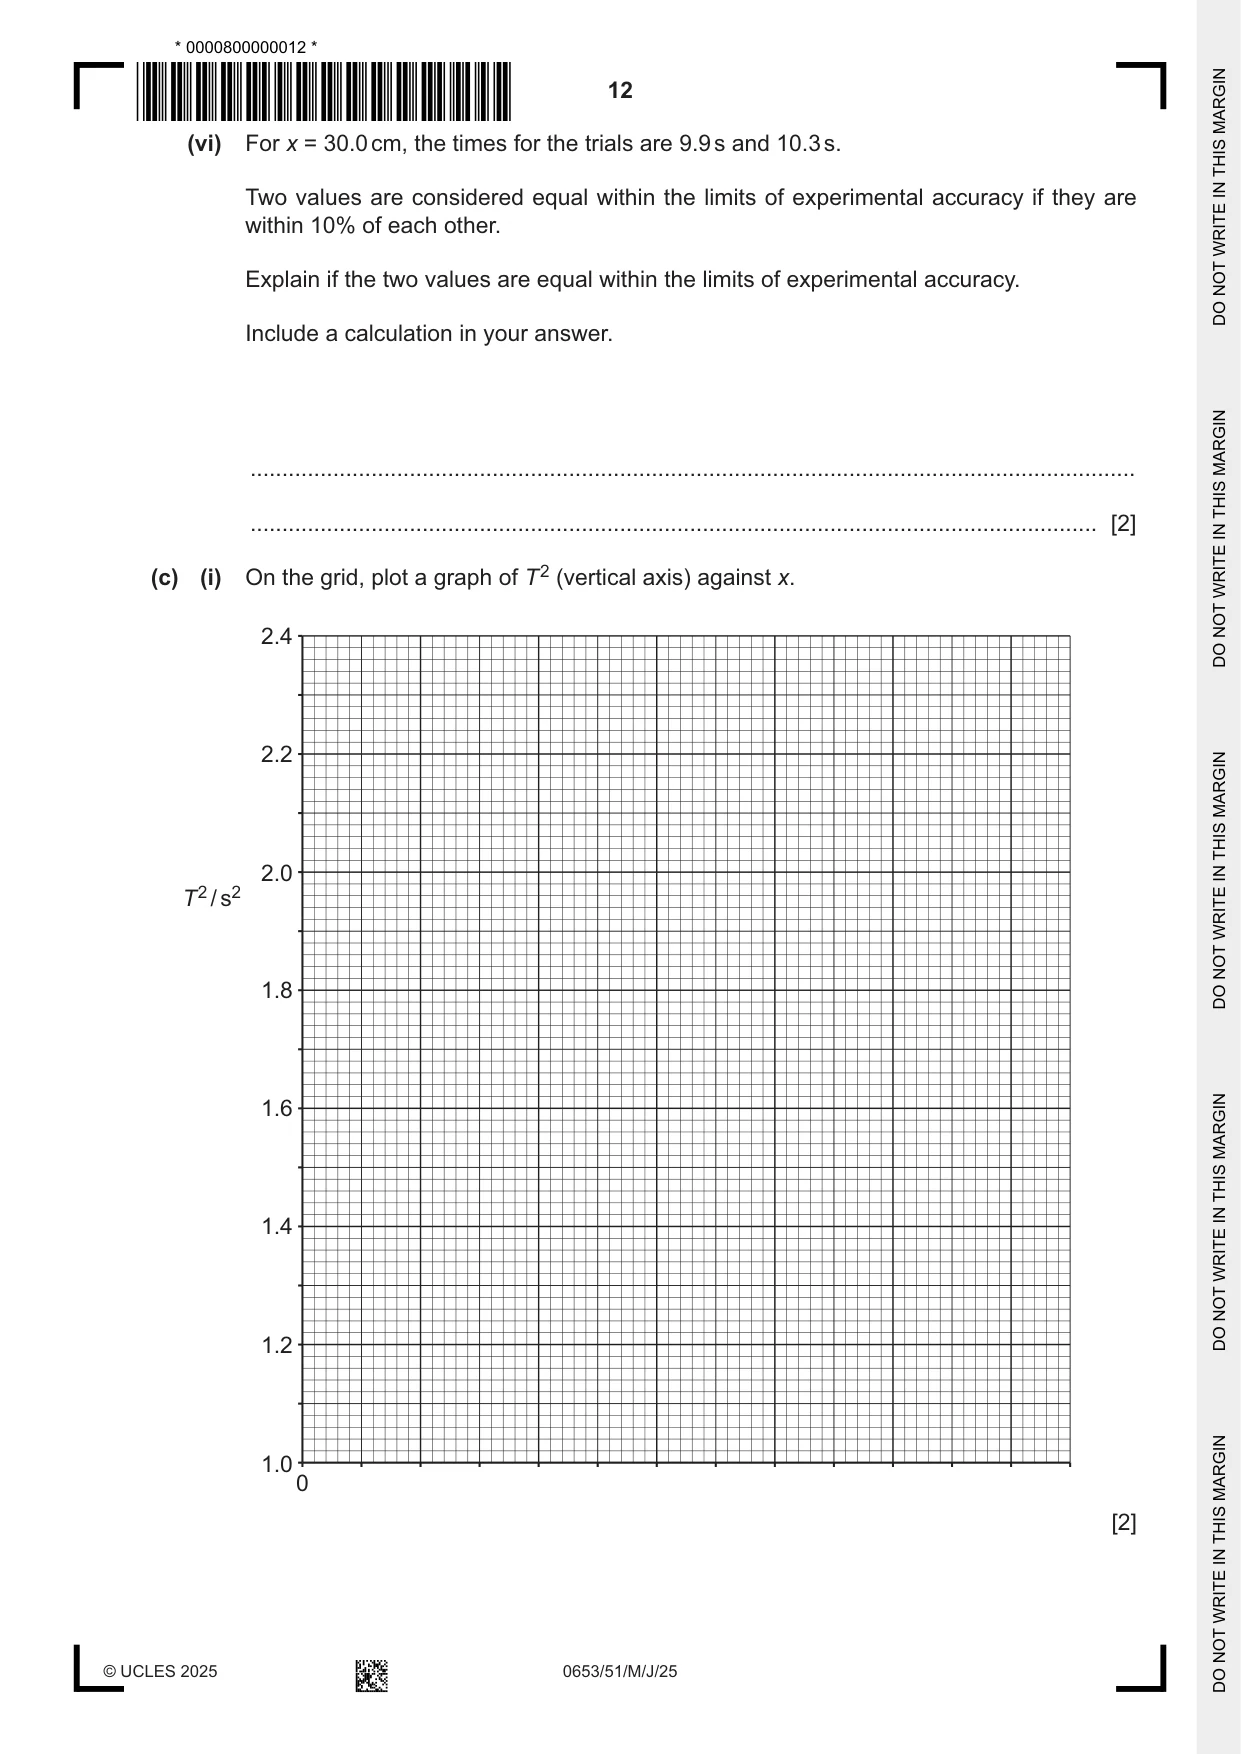
4 You are going to determine the period T of a pendulum. (a) The apparatus shown in Fig. 4.1 has been set up for you. clamp stand string bob x bench Fig. 4.1 The distance x is the height of the centre of the bob above the bench. Measure the distance x. Record in Table 4.1, this distance x to the nearest 0.1 cm. Table 4.1 time for 10 oscillations average time for distance x / s 10 oscillations for period T T 2 / cm trial 1 and trial 2 / s / s2 trial 1 trial 2 / s 10.0 13.6 13.2 13.4 1.34 1.80 20.0 11.6 12.0 11.8 1.18 1.39 25.0 11.1 10.9 11.0 1.10 1.21 30.0 9.9 10.3 10.1 1.01 1.02 [1] (b) The period T is the time it takes for the pendulum to complete one oscillation. In one oscillation the bob moves from A to B and back to A as shown in Fig. 4.2. A B Fig. 4.2 (i) Procedure • Pull the bob a short distance to one side and release it. • Immediately start the stop-watch. • Measure the time taken for 10 oscillations of your pendulum. Record in Table 4.1 this time for trial 1. [1] (ii) Repeat the procedure in (b)(i). Record in Table 4.1 this time for trial 2. [1] (iii) Calculate the average time for 10 oscillations for trial 1 and trial 2. Record your value in Table 4.1. [1] (iv) Calculate the period T. Use the equation shown. average time for 10 oscillations T = 10 Record in Table 4.1 this value of T. Calculate T 2. Record in Table 4.1 this value of T 2. [1] (v) One reason why the student does two trials is to calculate an average time. State one other reason. ........................................................................................................................................... ..................................................................................................................................... [1] (vi) For x = 30.0 cm, the times for the trials are 9.9 s and 10.3 s. Two values are considered equal within the limits of experimental accuracy if they are within 10% of each other. Explain if the two values are equal within the limits of experimental accuracy. Include a calculation in your answer. ........................................................................................................................................... ..................................................................................................................................... [2] (c) (i) On the grid, plot a graph of T 2 (vertical axis) against x. 2.4 2.2 2.0 T 2 / s2 1.8 1.6 1.4 1.2 1.0 0 [2]
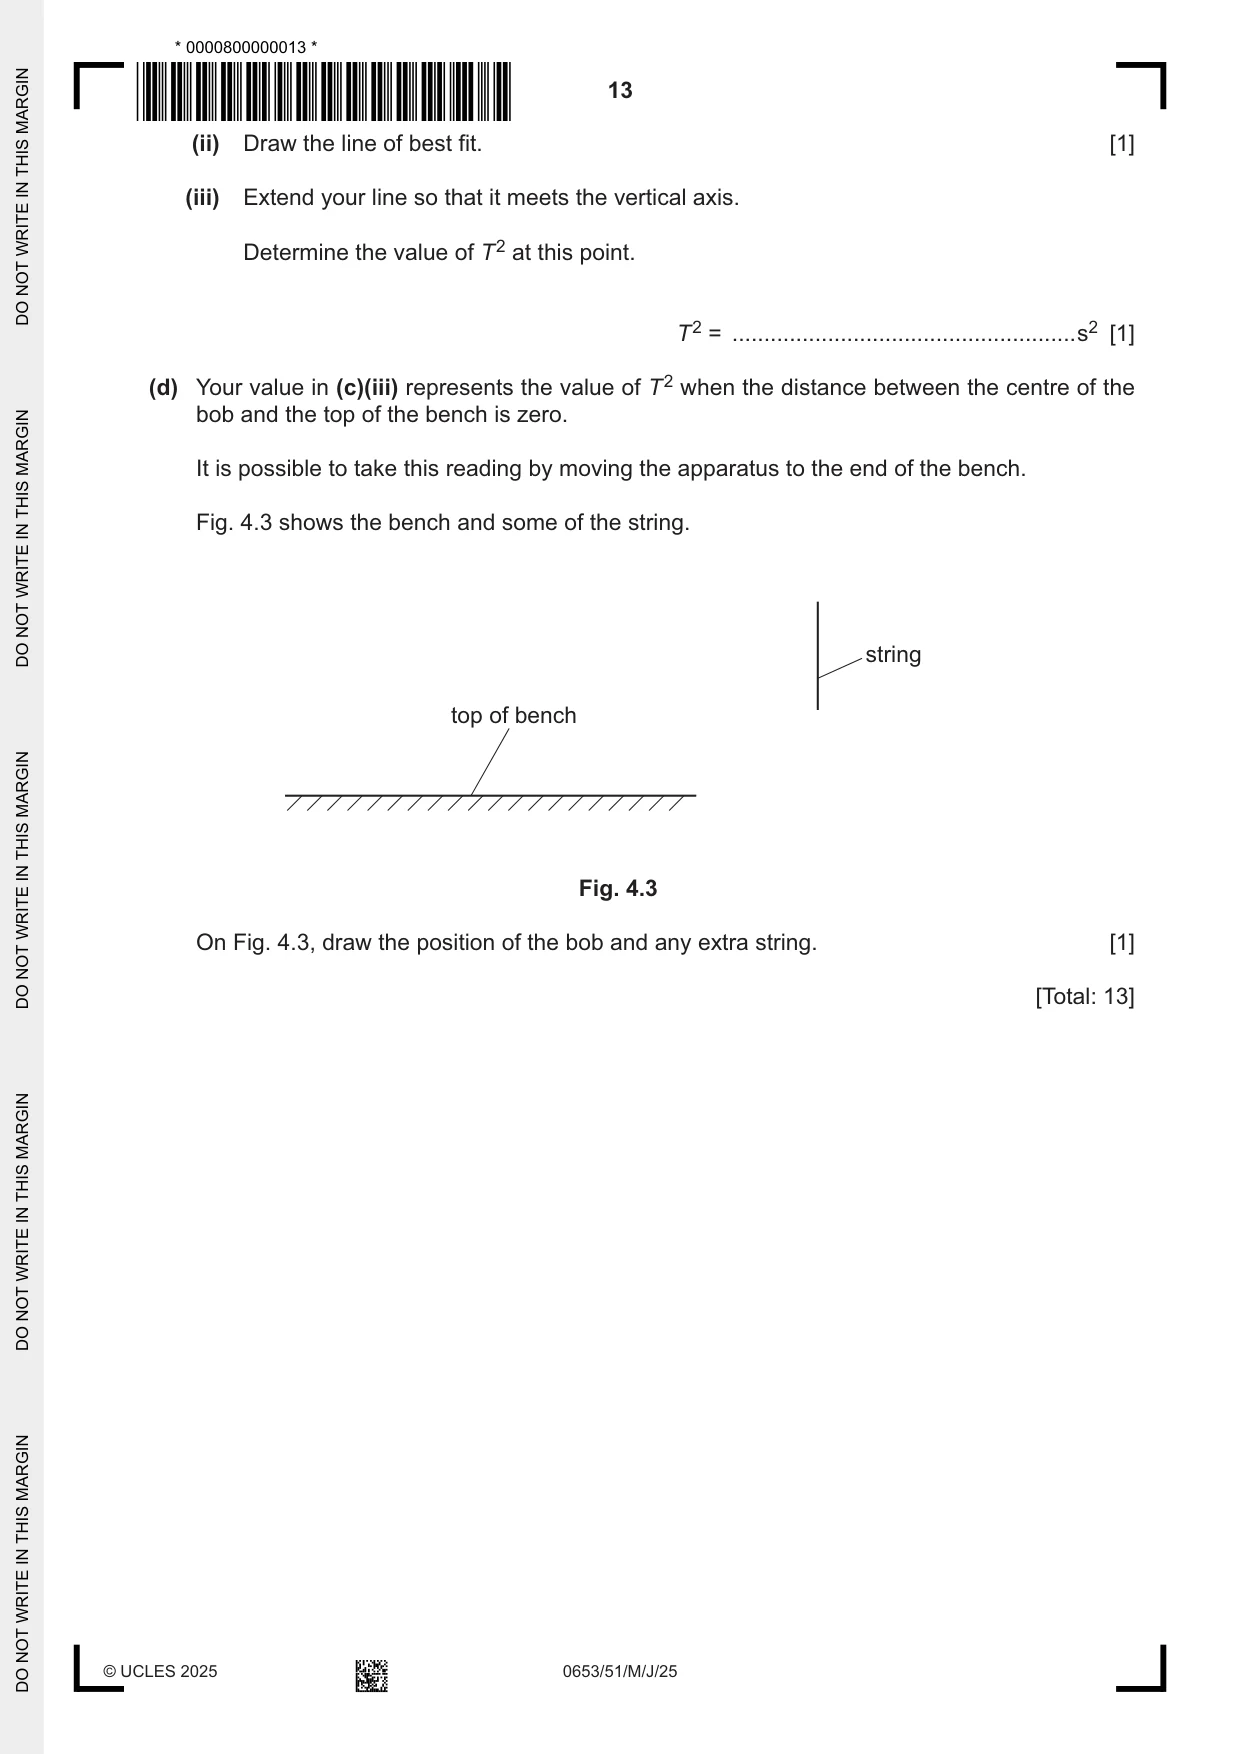
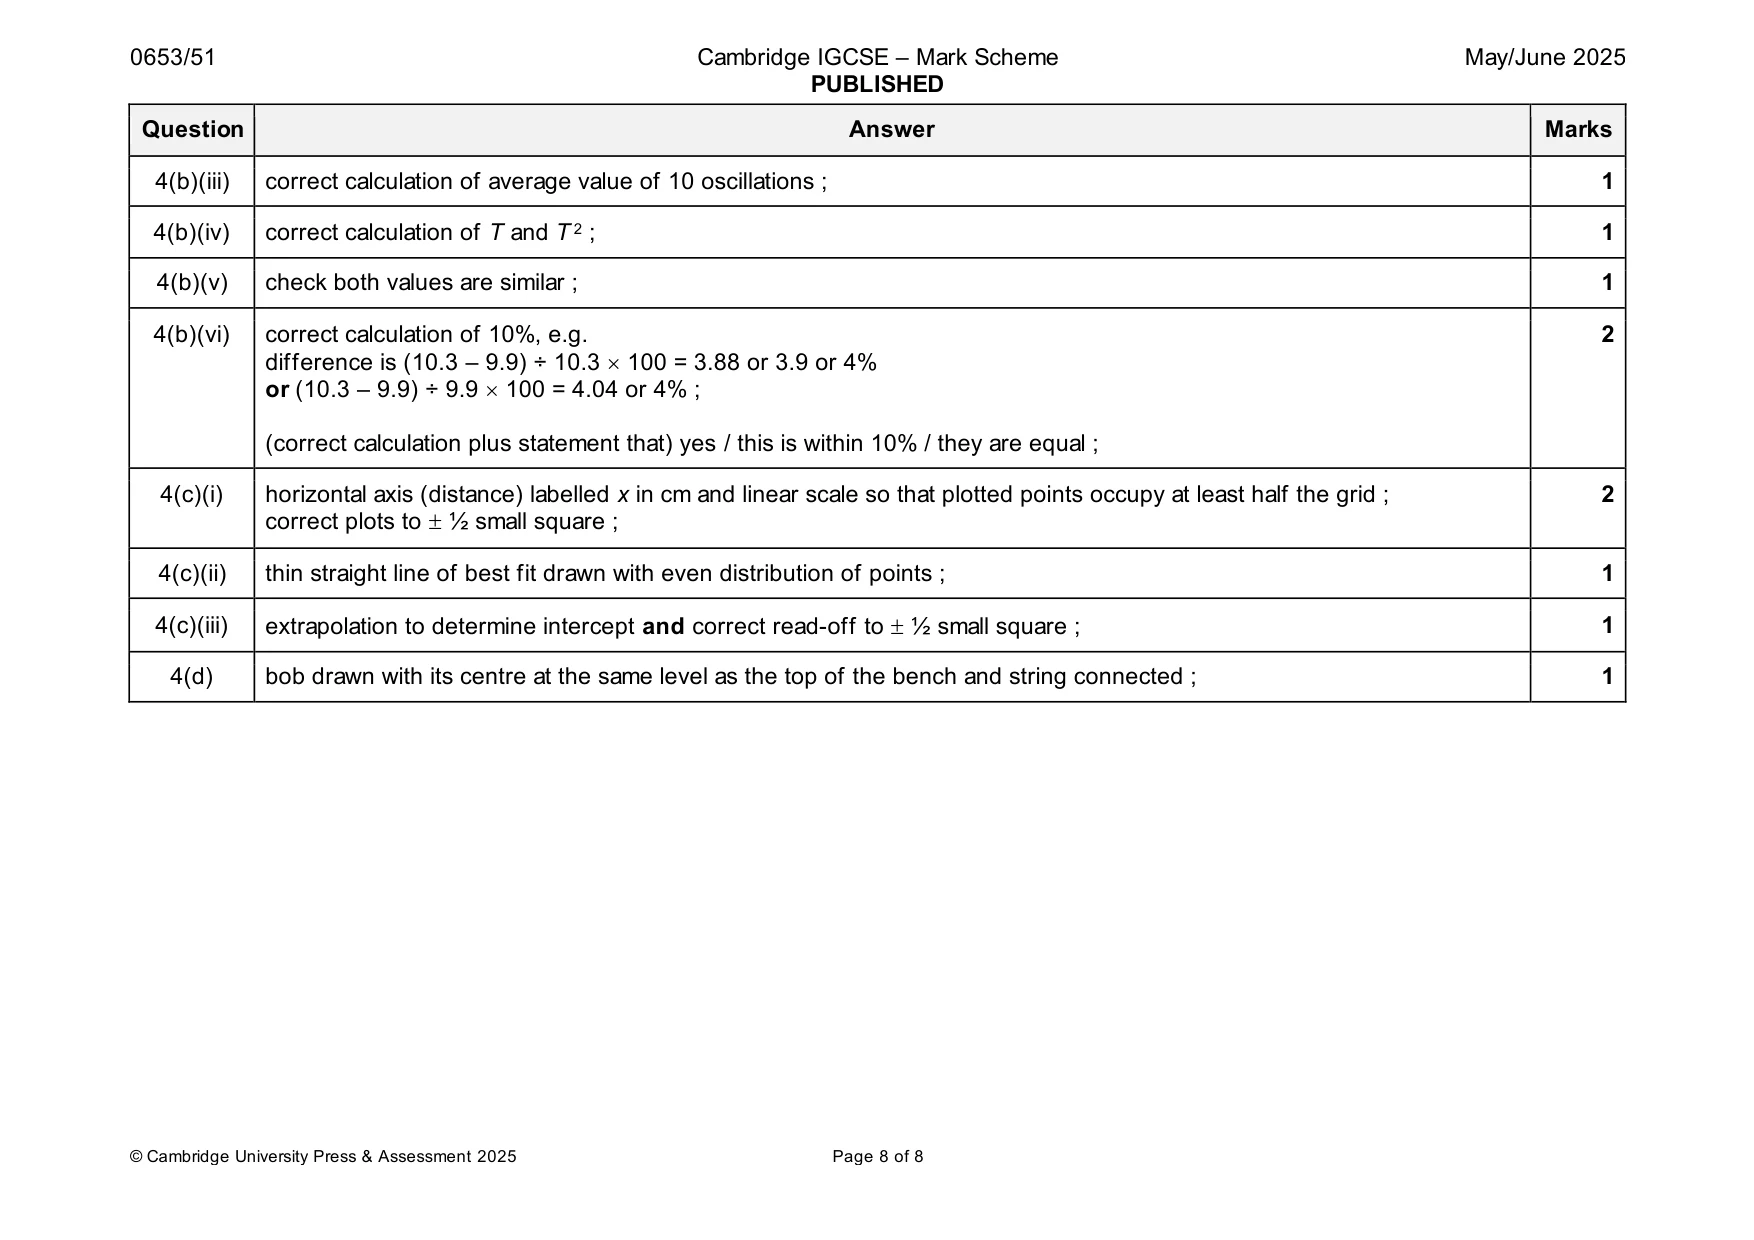
Mark scheme: 4(a) answer in range 13.0 - 17.0 (cm) ; 1 4(b)(i) value between 12.2 s and 13.1 s in table ; 1 4(b)(ii) 2nd value between 12.2 s and 13.1 s ; 1 4(b)(iii) correct calculation of average value of 10 oscillations ; 1 4(b)(iv) correct calculation of T and T 2 ; 1 4(b)(v) check both values are similar ; 1 4(b)(vi) correct calculation of 10%, e.g. 2 difference is (10.3 – 9.9) ÷ 10.3 100 = 3.88 or 3.9 or 4% or (10.3 – 9.9) ÷ 9.9 100 = 4.04 or 4% ; (correct calculation plus statement that) yes / this is within 10% / they are equal ; 4(c)(i) horizontal axis (distance) labelled x in cm and linear scale so that plotted points occupy at least half the grid ; 2 correct plots to ½ small square ; 4(c)(ii) thin straight line of best fit drawn with even distribution of points ; 1 4(c)(iii) extrapolation to determine intercept and correct read-off to ½ small square ; 1 4(d) bob drawn with its centre at the same level as the top of the bench and string connected ; 1
More questions on Physical quantities and measurement techniques
What was in this paper
The subtopics covered by these 4 questions, and how many questions each got. Open one in a new tab to see every Cambridge question on it.
What you needed in this session
Cambridge’s own grade thresholds for 2025 May/June, Paper 5 · Variant 1. A higher threshold means an easier paper — the bar moves with how the cohort did.