Cambridge IGCSE Science - Combined 0653 — 2024 Oct/Nov Paper 5 · Variant 1
0653/51/O/N/24 · 4 questions · 40 marks · ≈45 min
The question paper and its mark scheme, free to read here and free to download. This is Cambridge’s own paper, exactly as it was sat.
Question paper16 pages





Mark scheme8 pages
Answers below. Sit the paper first if you are practising.
Questions as text
Q1 · You are provided with one half of an onion on a white tile
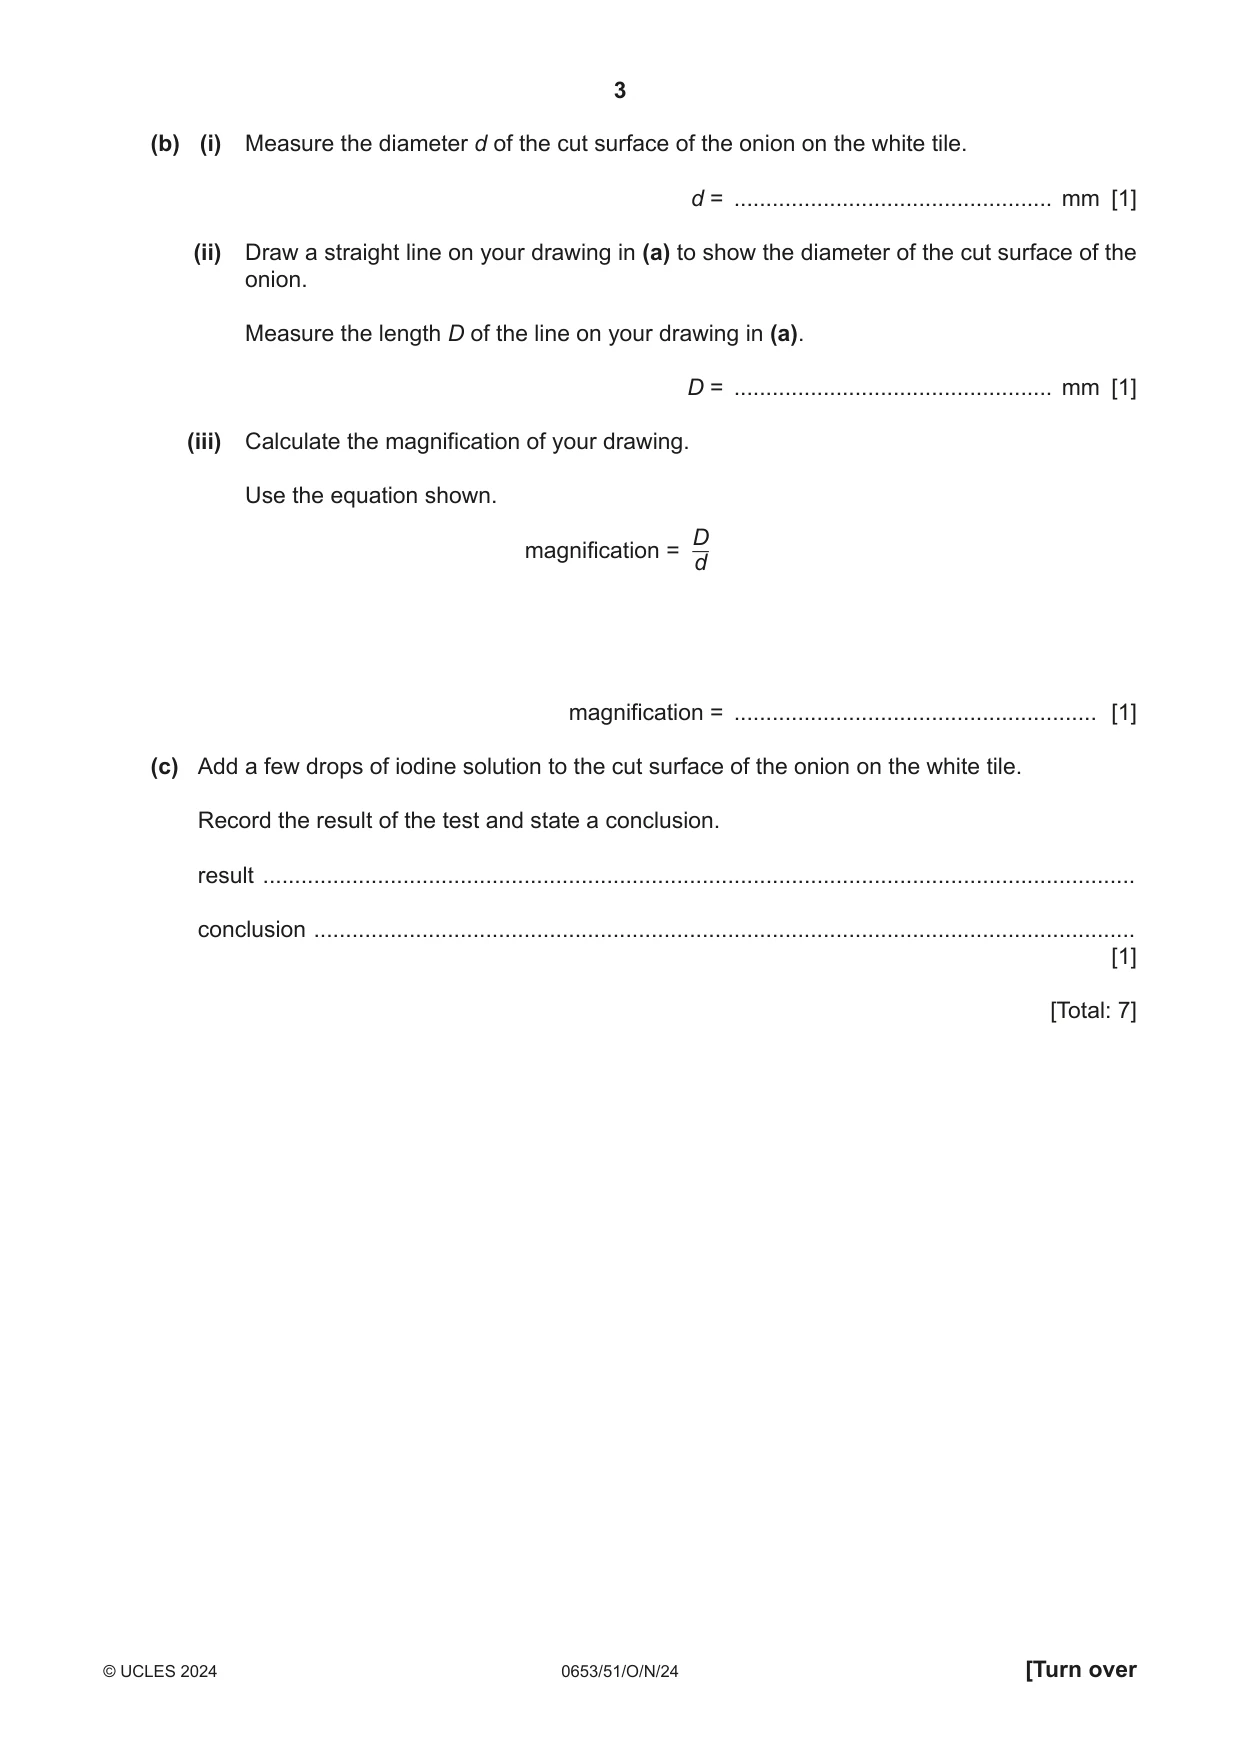
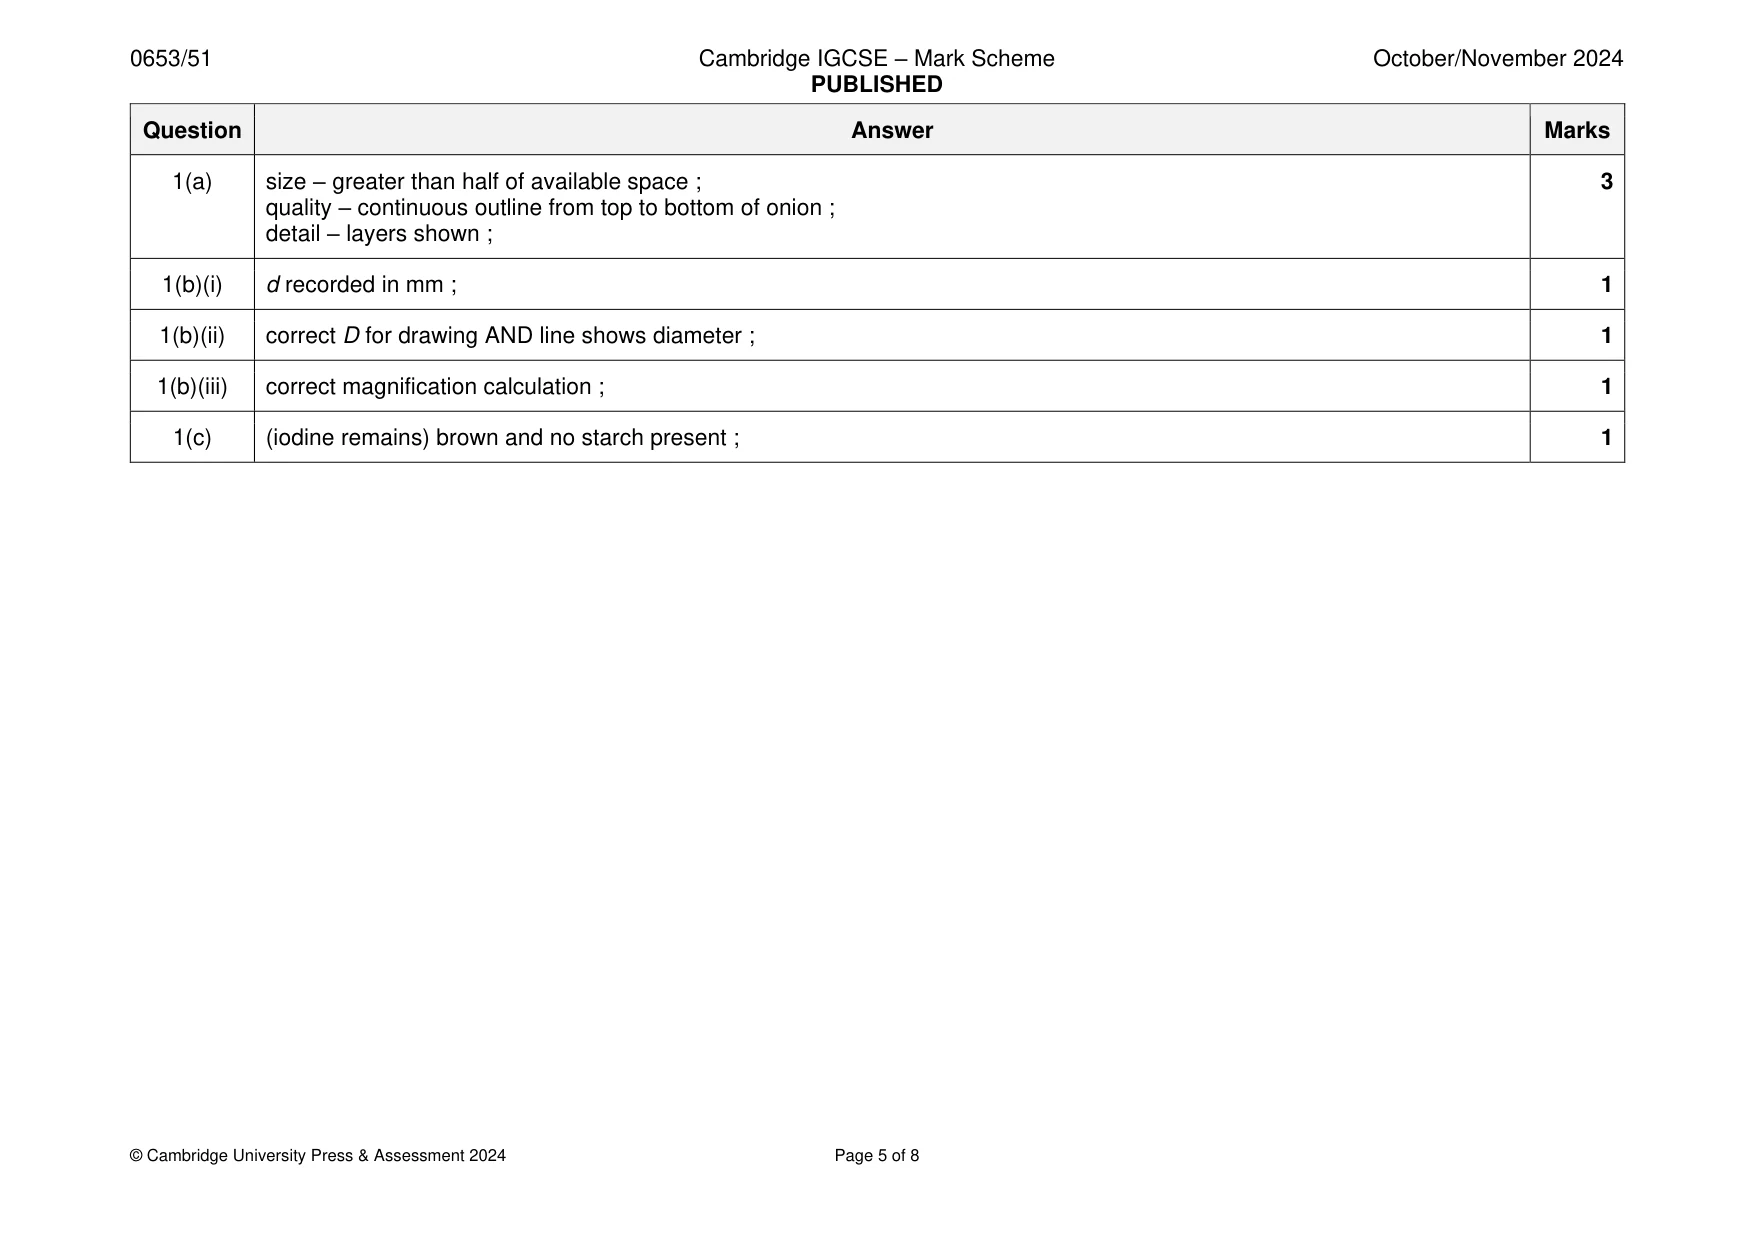
1 You are provided with one half of an onion on a white tile. (a) In the box, make a large and detailed pencil drawing of the cut surface of the onion. [3] (b) (i) Measure the diameter d of the cut surface of the onion on the white tile. d = .................................................. mm [1] (ii) Draw a straight line on your drawing in (a) to show the diameter of the cut surface of the onion. Measure the length D of the line on your drawing in (a). D = .................................................. mm [1] (iii) Calculate the magnification of your drawing. Use the equation shown. D magnification = d magnification = ......................................................... [1] (c) Add a few drops of iodine solution to the cut surface of the onion on the white tile. Record the result of the test and state a conclusion. result ......................................................................................................................................... conclusion ................................................................................................................................. [1] [Total: 7]
Mark scheme: Question Answer Marks 1(a) size – greater than half of available space ; 3 quality – continuous outline from top to bottom of onion ; detail – layers shown ; 1(b)(i) d recorded in mm ; 1 1(b)(ii) correct D for drawing AND line shows diameter ; 1 1(b)(iii) correct magnification calculation ; 1 1(c) (iodine remains) brown and no starch present ; 1
Q2 · Plants such as onions need minerals in the soil to grow
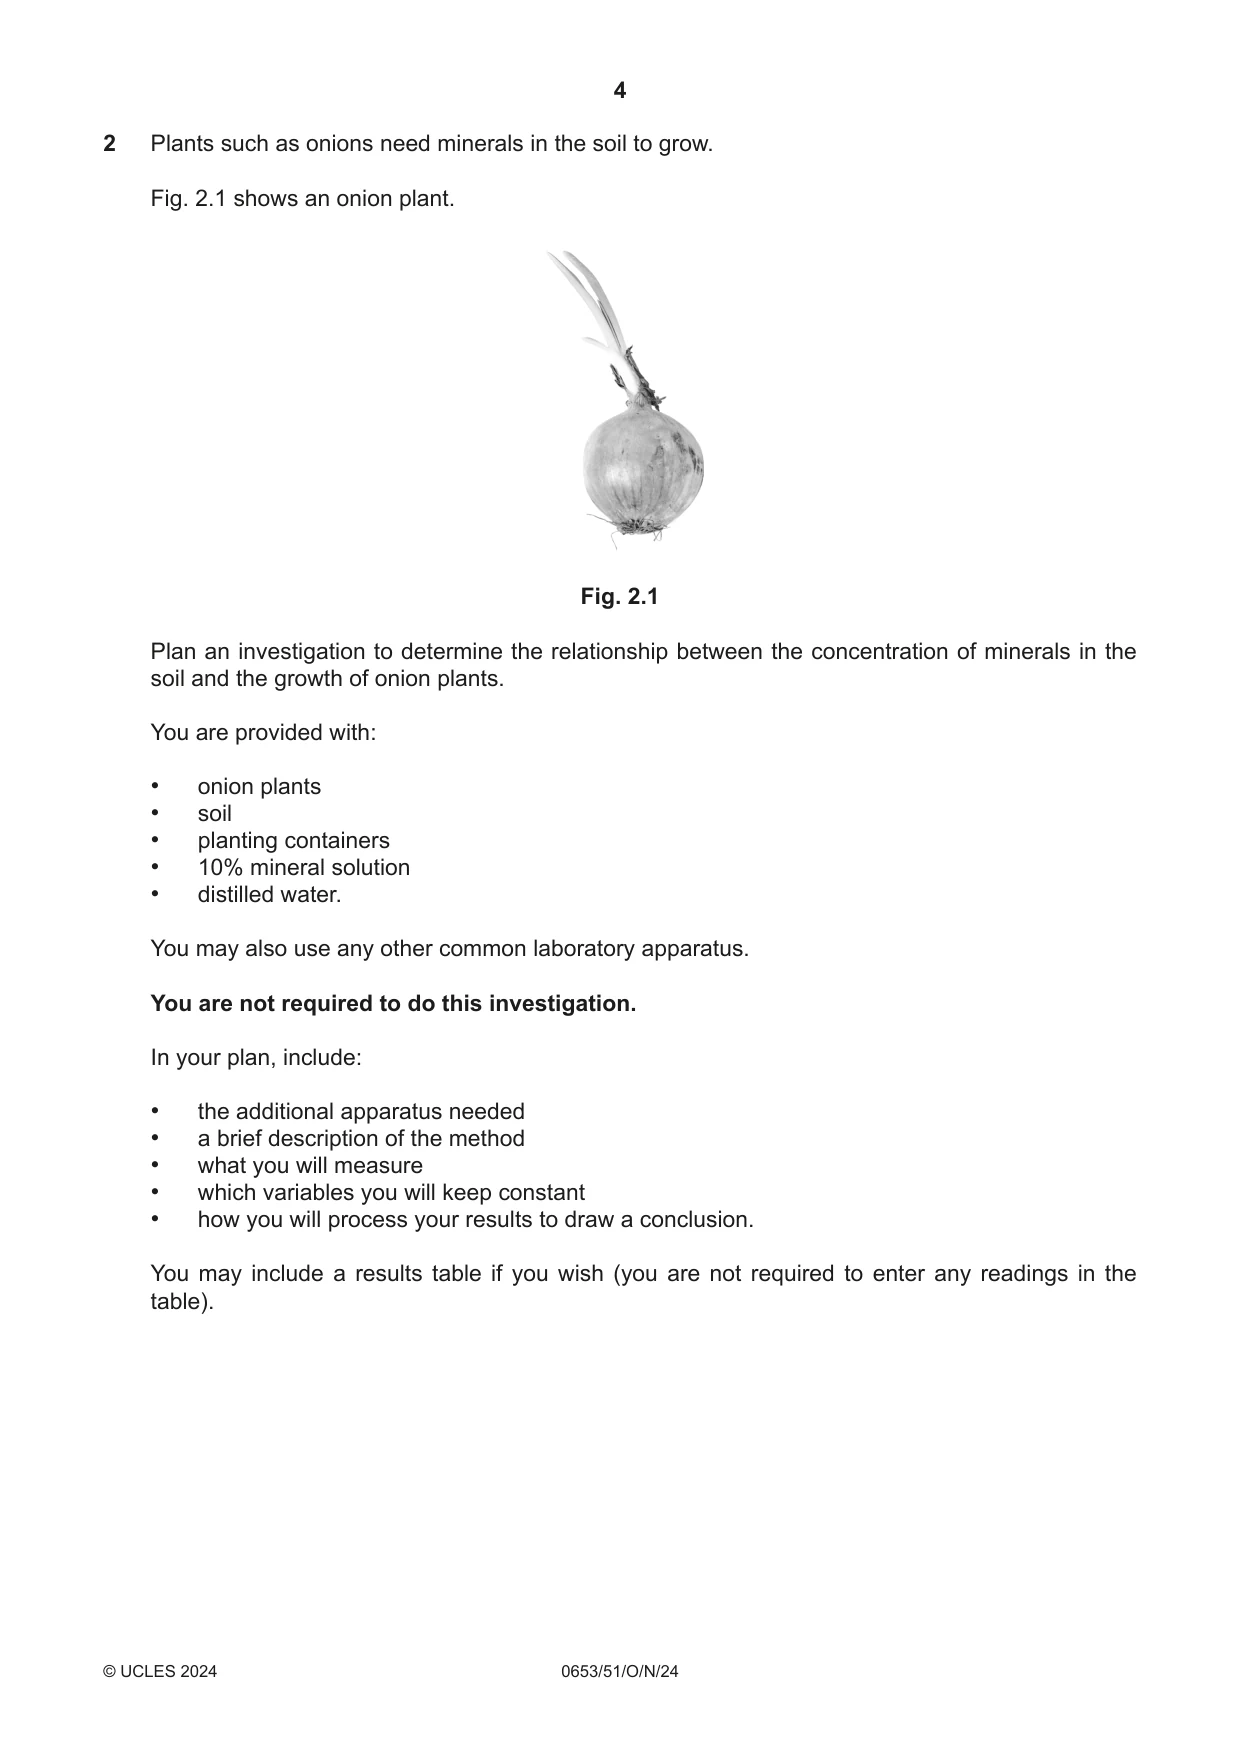
2 Plants such as onions need minerals in the soil to grow. Fig. 2.1 shows an onion plant. Fig. 2.1 Plan an investigation to determine the relationship between the concentration of minerals in the soil and the growth of onion plants. You are provided with: • onion plants • soil • planting containers • 10% mineral solution • distilled water. You may also use any other common laboratory apparatus. You are not required to do this investigation. In your plan, include: • the additional apparatus needed • a brief description of the method • what you will measure • which variables you will keep constant • how you will process your results to draw a conclusion. You may include a results table if you wish (you are not required to enter any readings in the table). .......................................................................................................................................................... .......................................................................................................................................................... .......................................................................................................................................................... .......................................................................................................................................................... .......................................................................................................................................................... .......................................................................................................................................................... .......................................................................................................................................................... .......................................................................................................................................................... .......................................................................................................................................................... .......................................................................................................................................................... .......................................................................................................................................................... .......................................................................................................................................................... .......................................................................................................................................................... .......................................................................................................................................................... .................................................................................................................................................... [7]
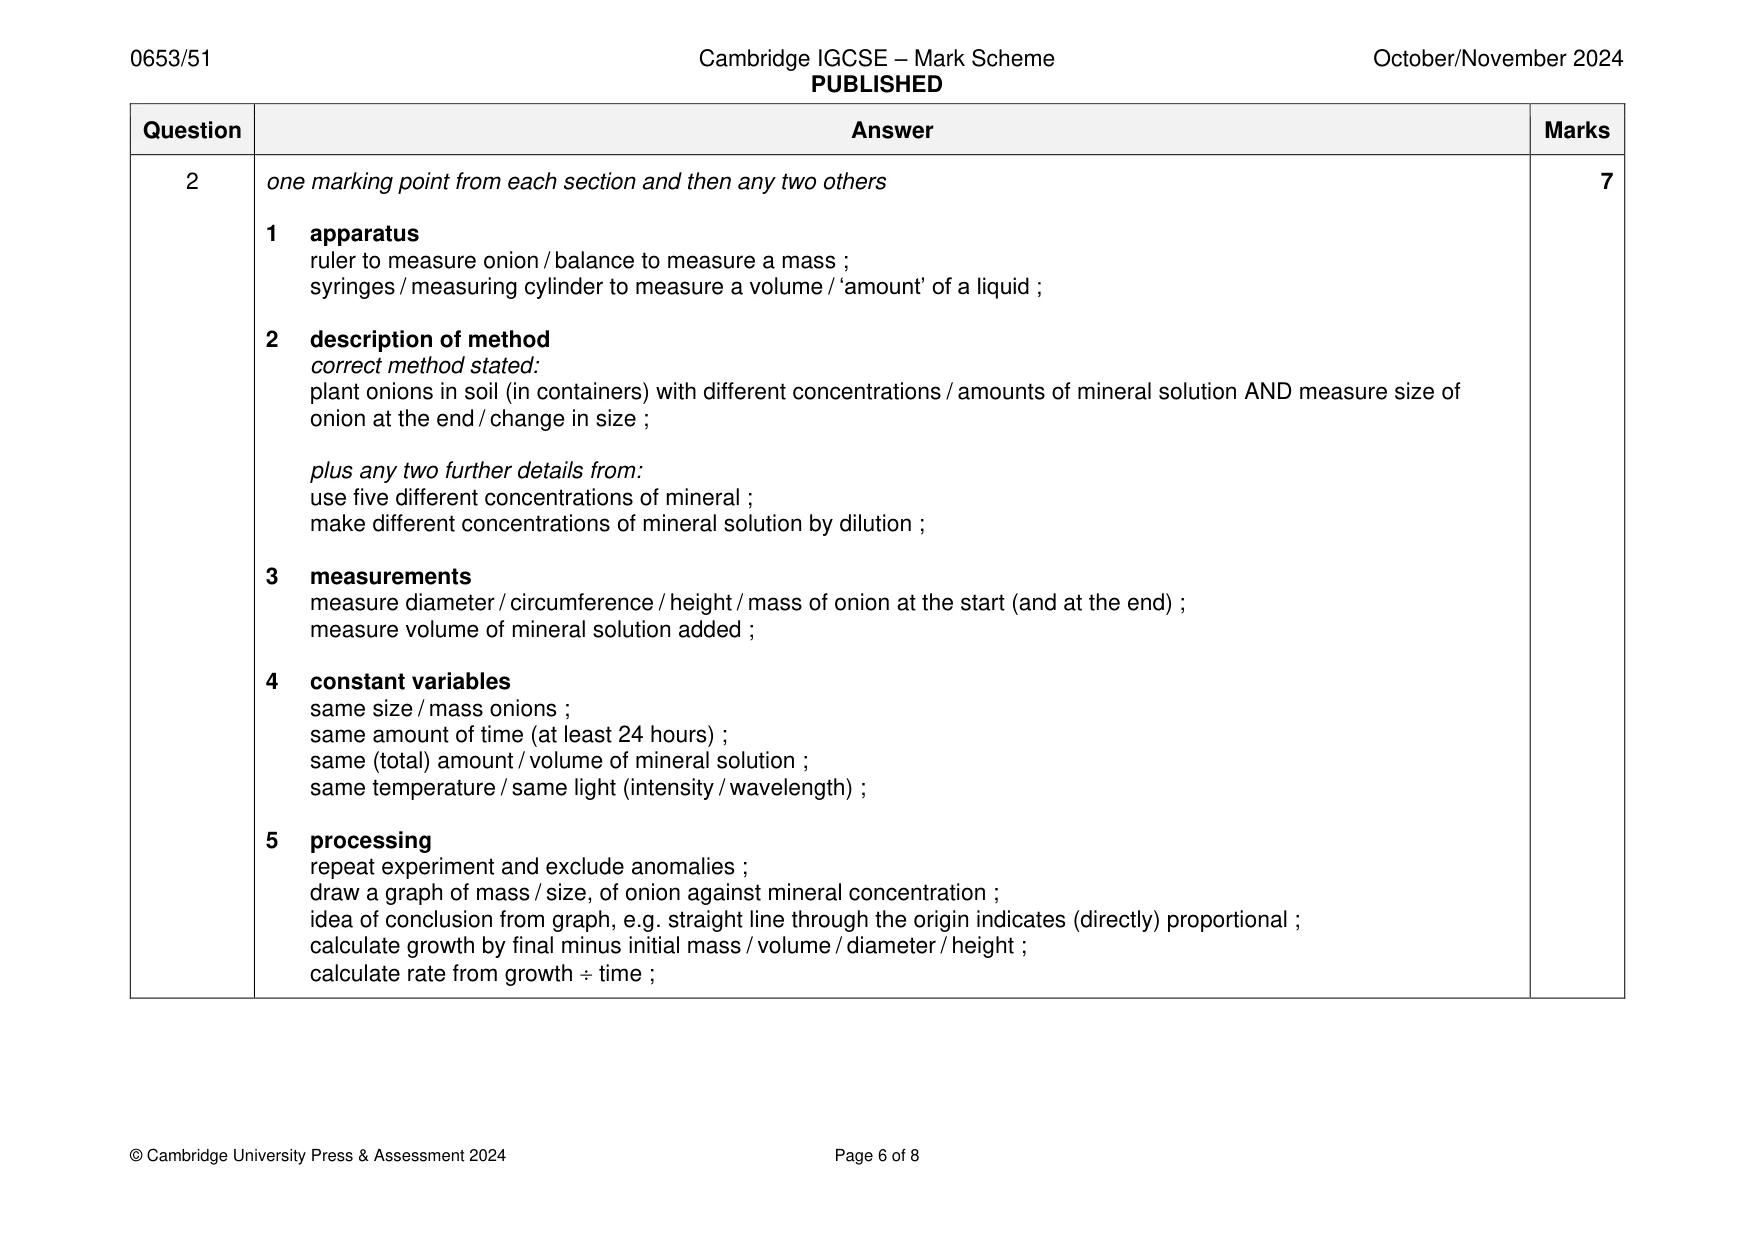
Mark scheme: 2 one marking point from each section and then any two others 7 1 apparatus ruler to measure onion / balance to measure a mass ; syringes / measuring cylinder to measure a volume / ‘amount’ of a liquid ; 2 description of method correct method stated: plant onions in soil (in containers) with different concentrations / amounts of mineral solution AND measure size of onion at the end / change in size ; plus any two further details from: use five different concentrations of mineral ; make different concentrations of mineral solution by dilution ; 3 measurements measure diameter / circumference / height / mass of onion at the start (and at the end) ; measure volume of mineral solution added ; 4 constant variables same size / mass onions ; same amount of time (at least 24 hours) ; same (total) amount / volume of mineral solution ; same temperature / same light (intensity / wavelength) ; 5 processing repeat experiment and exclude anomalies ; draw a graph of mass / size, of onion against mineral concentration ; idea of conclusion from graph, e.g. straight line through the origin indicates (directly) proportional ; calculate growth by final minus initial mass / volume / diameter / height ; calculate rate from growth time ;
Q3 · You are going to investigate the white solid provided, solid H
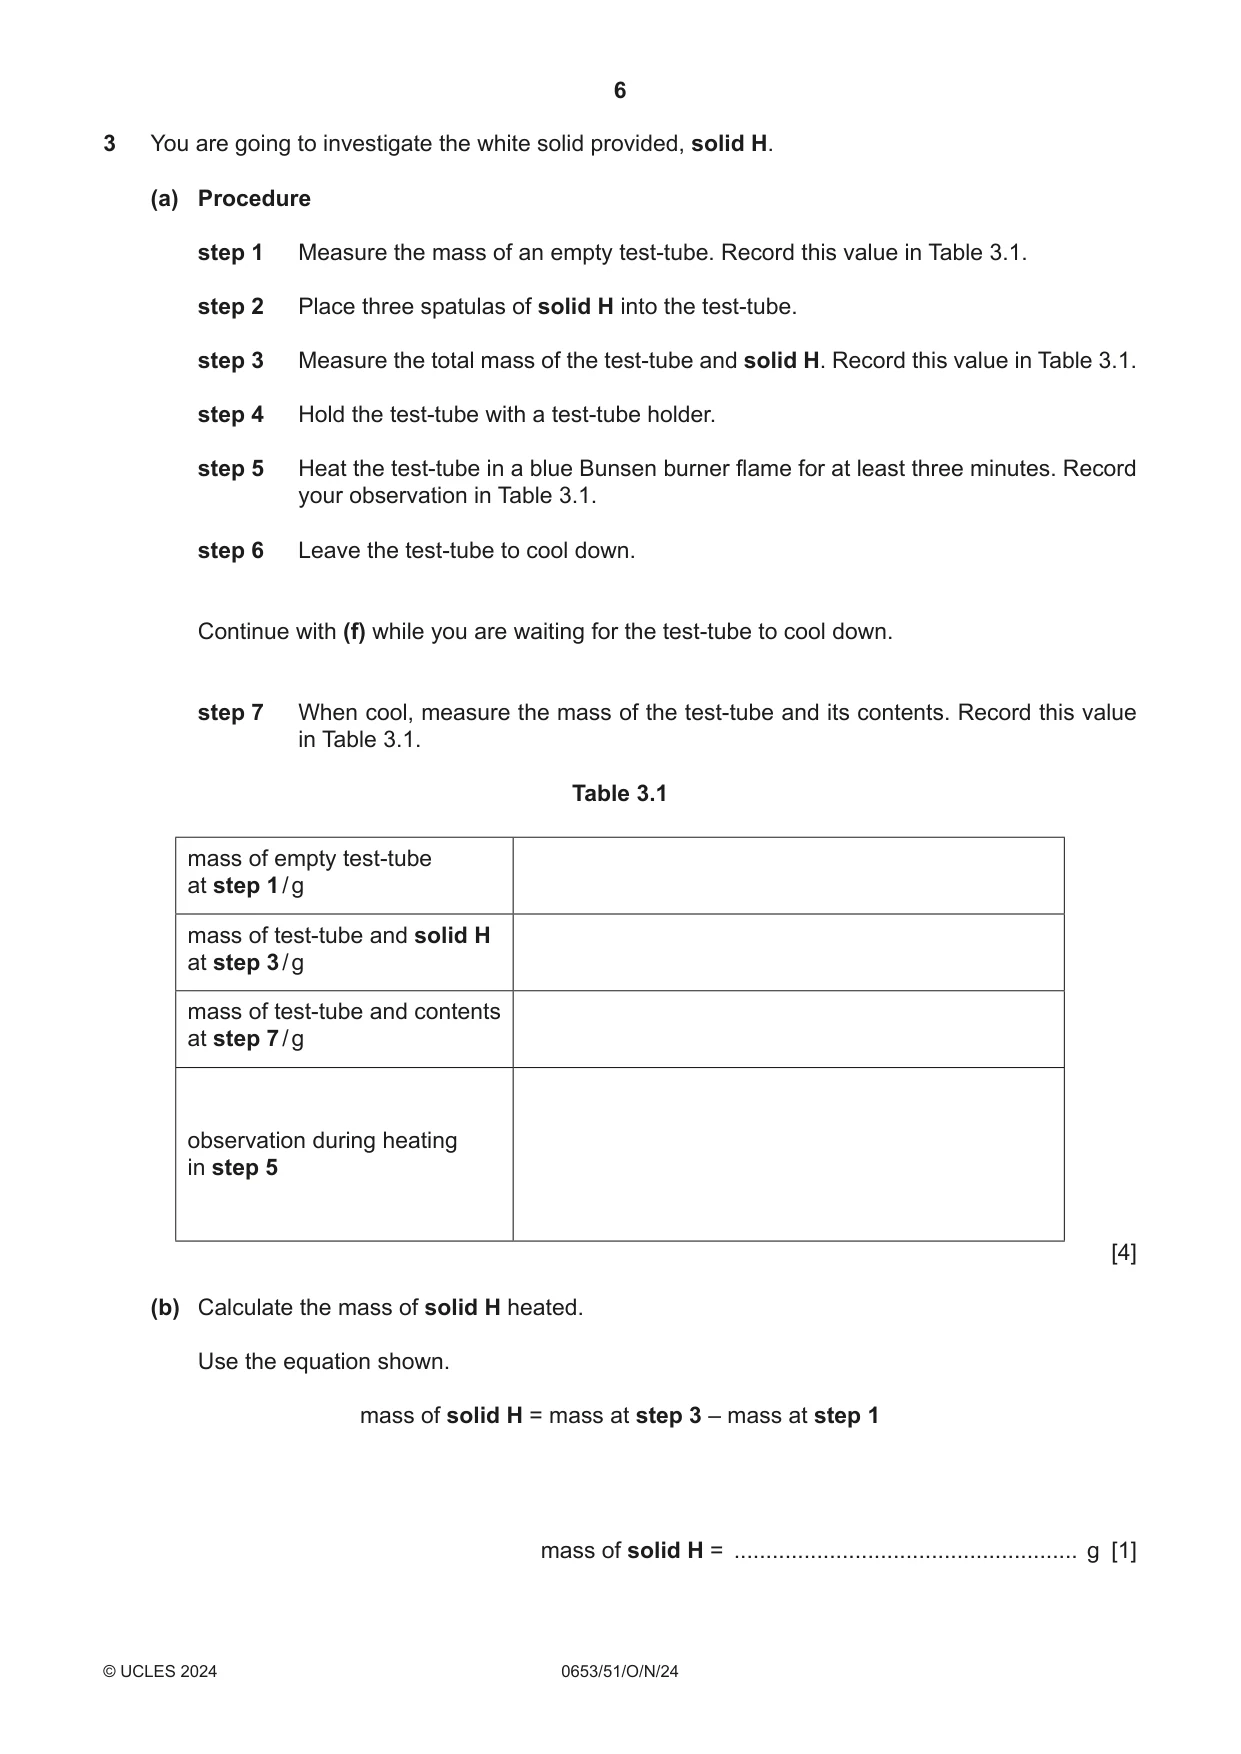
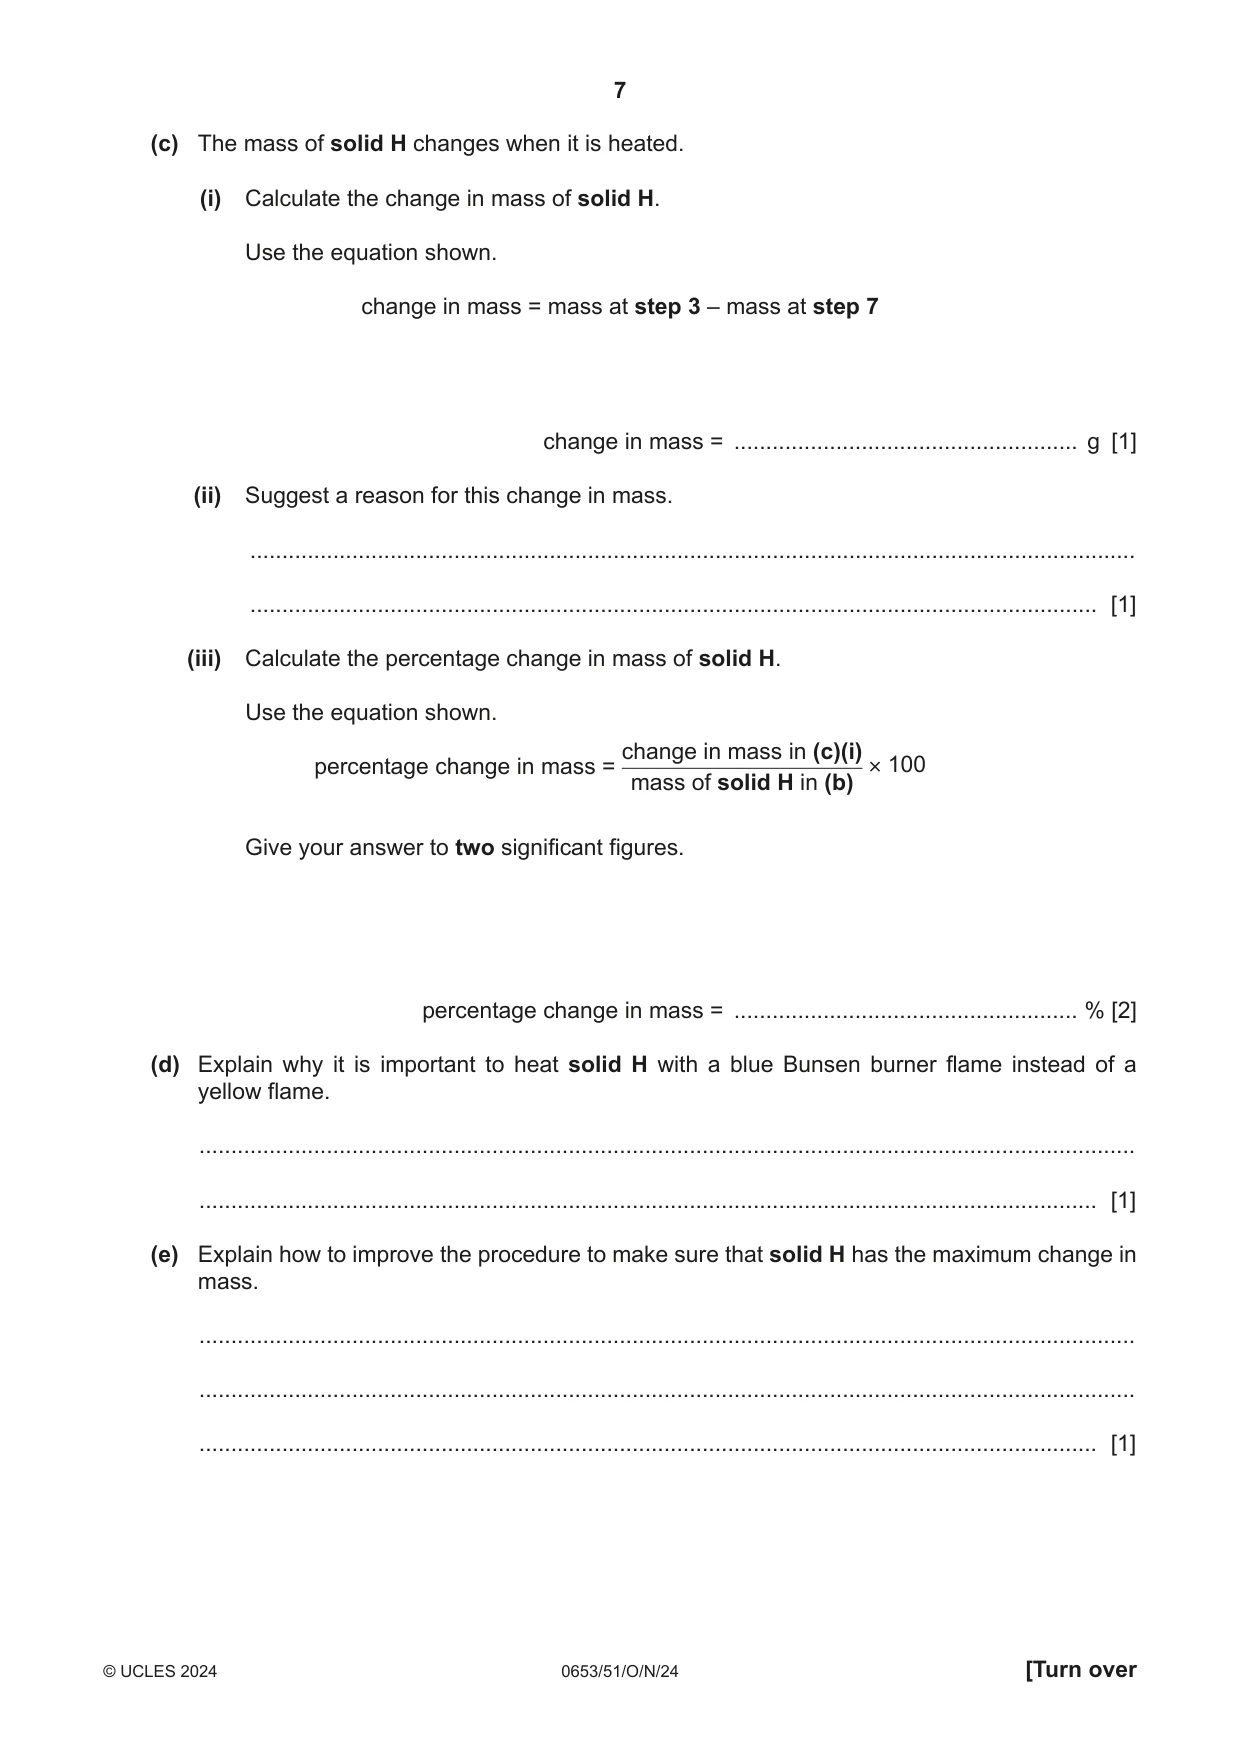
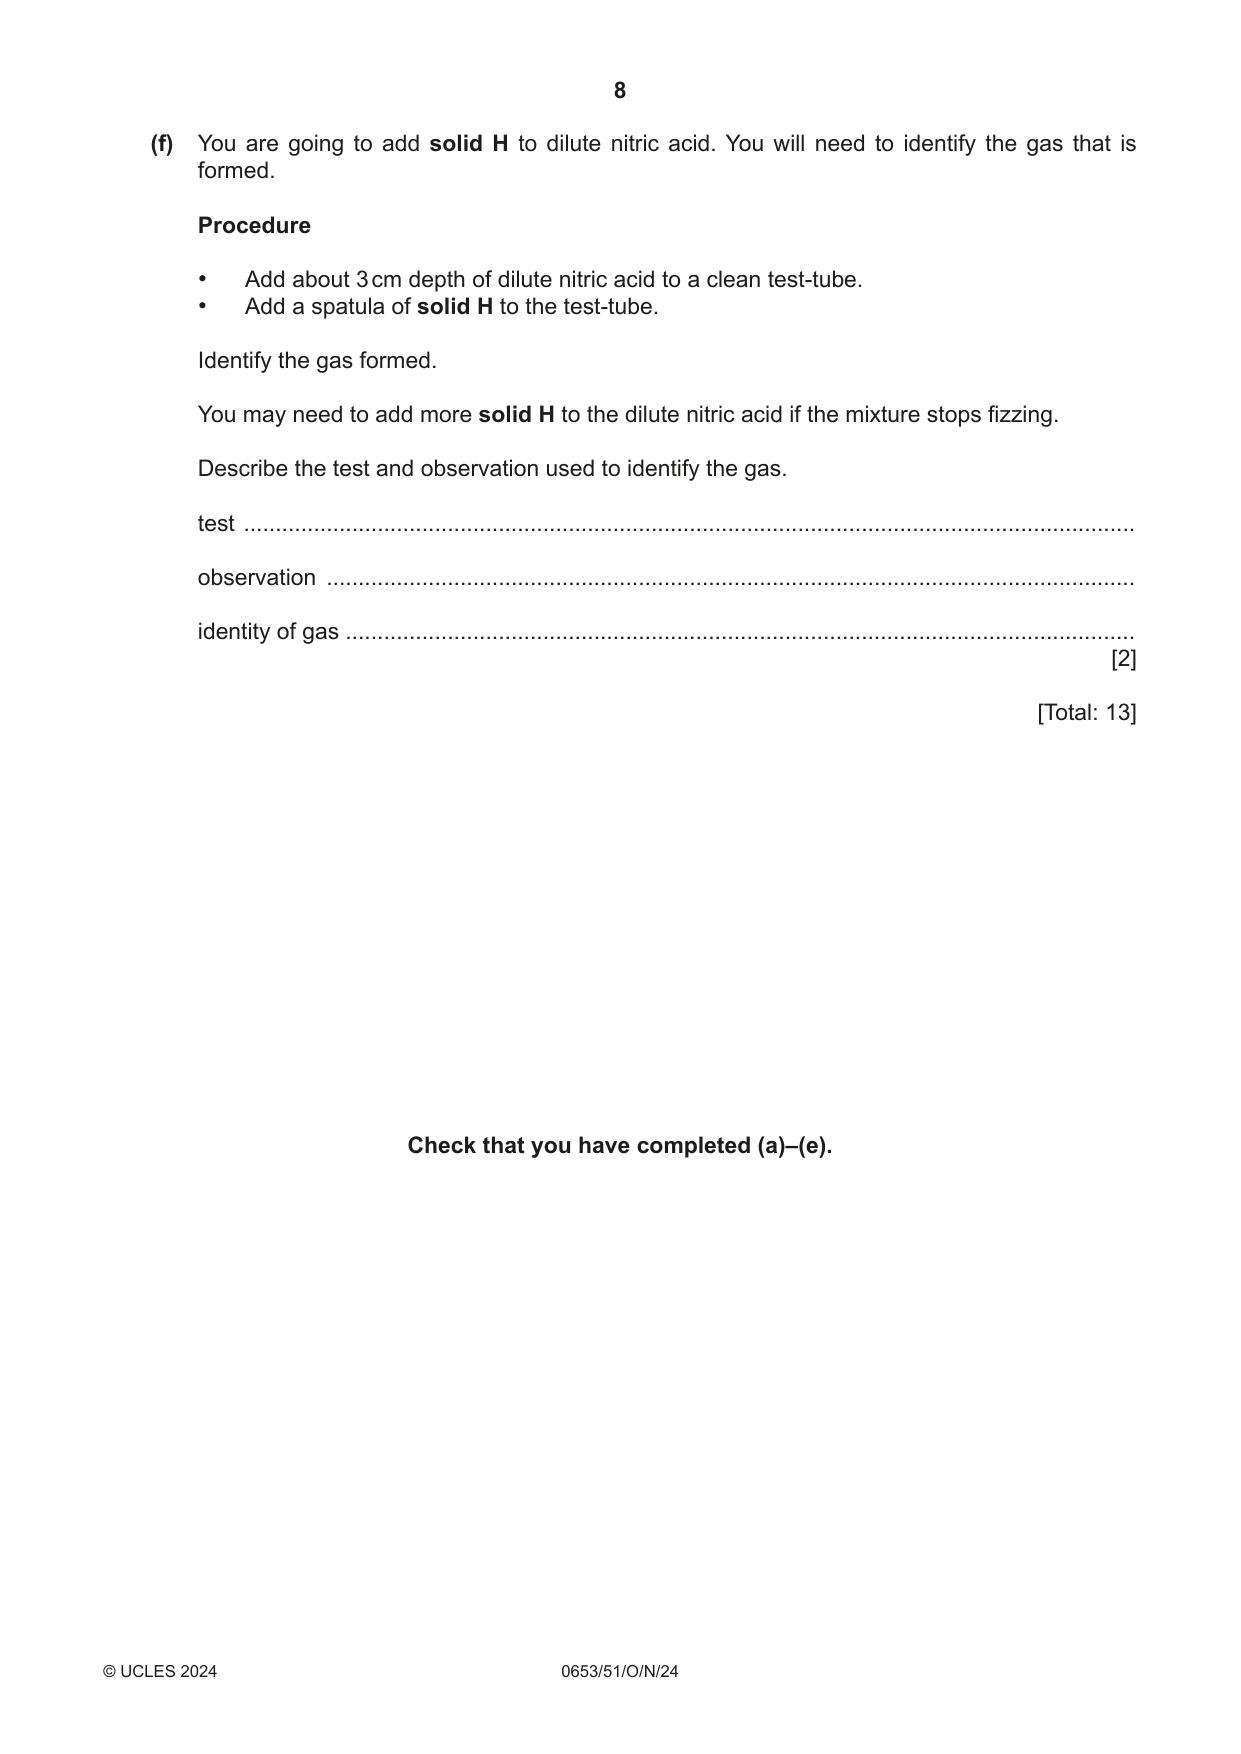
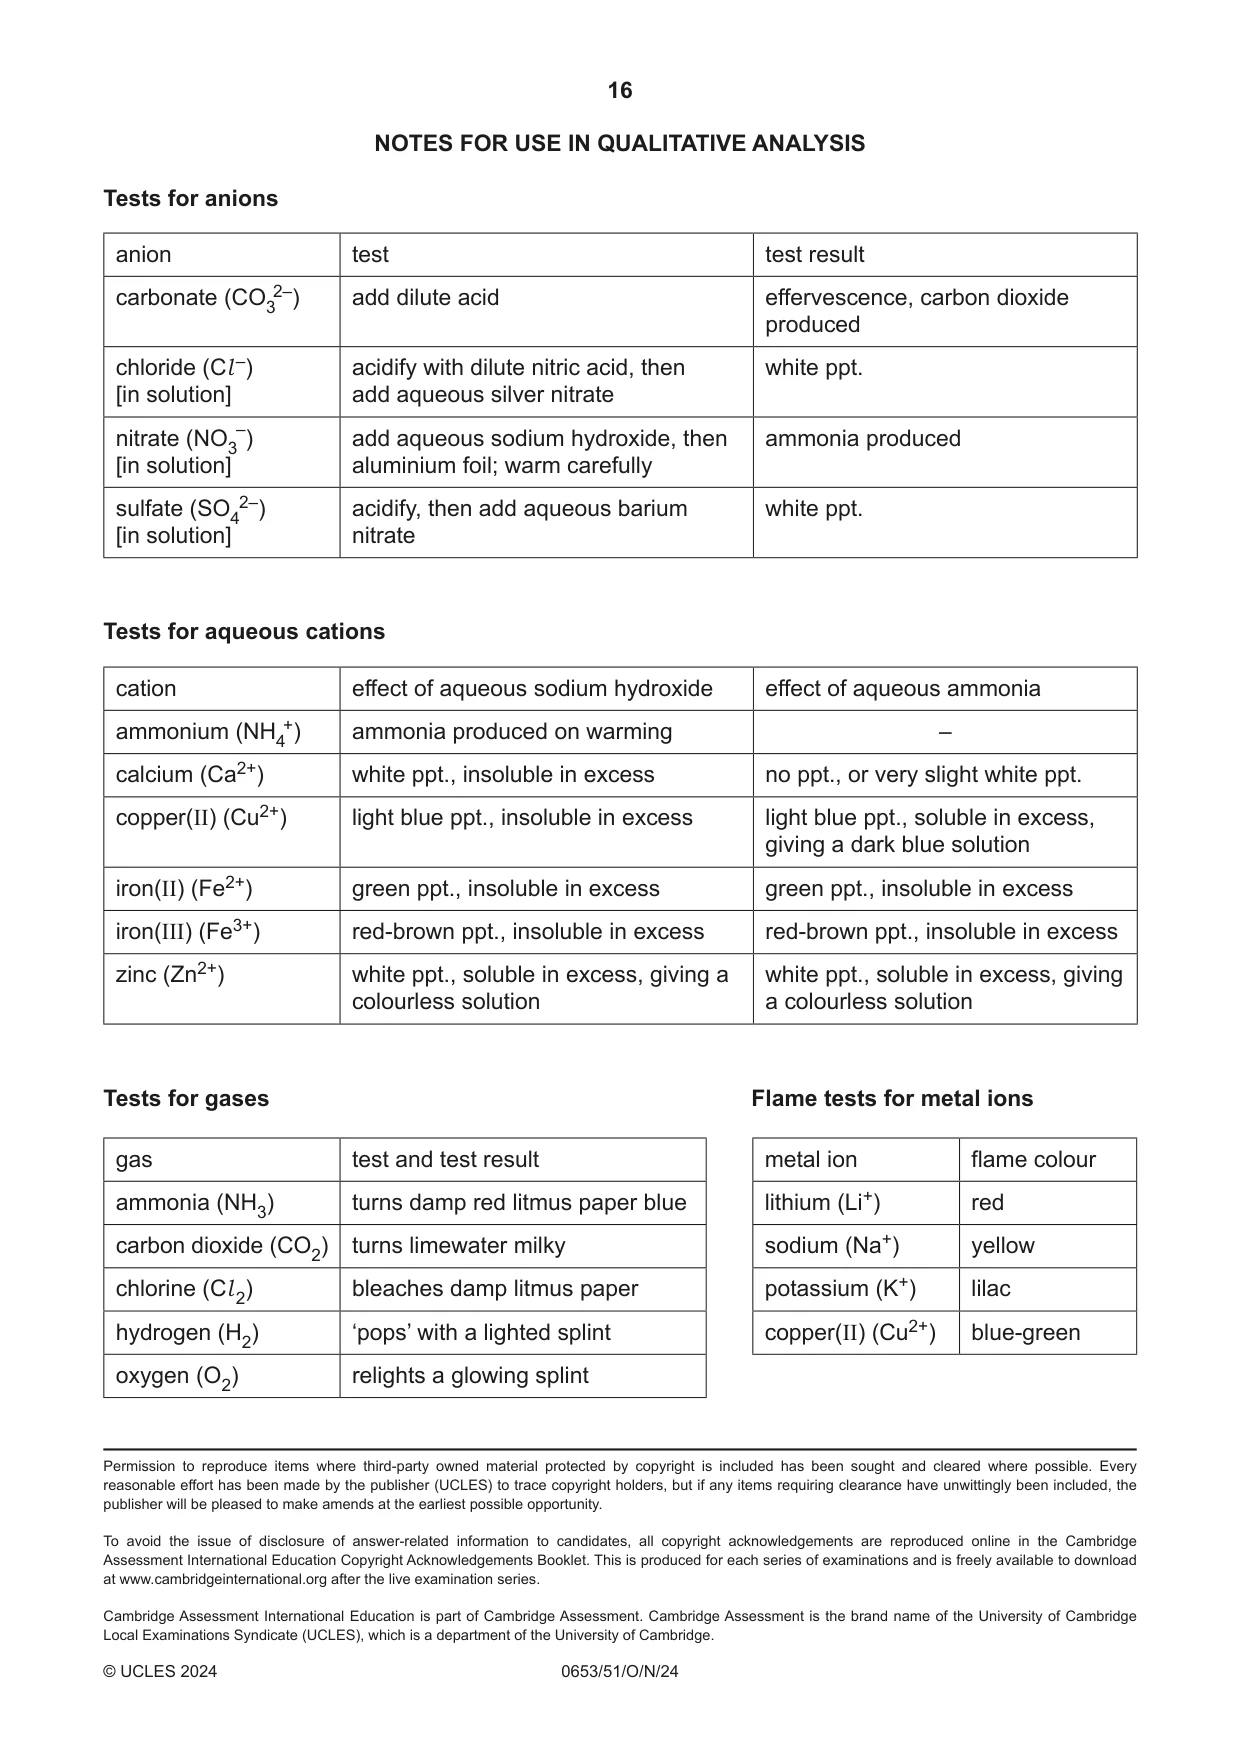
3 You are going to investigate the white solid provided, solid H. (a) Procedure step 1 Measure the mass of an empty test‑tube. Record this value in Table 3.1. step 2 Place three spatulas of solid H into the test‑tube. step 3 Measure the total mass of the test‑tube and solid H. Record this value in Table 3.1. step 4 Hold the test‑tube with a test‑tube holder. step 5 Heat the test‑tube in a blue Bunsen burner flame for at least three minutes. Record your observation in Table 3.1. step 6 Leave the test‑tube to cool down. Continue with (f) while you are waiting for the test‑tube to cool down. step 7 When cool, measure the mass of the test‑tube and its contents. Record this value in Table 3.1. Table 3.1 mass of empty test‑tube at step 1 / g mass of test‑tube and solid H at step 3 / g mass of test‑tube and contents at step 7 / g observation during heating in step 5 [4] (b) Calculate the mass of solid H heated. Use the equation shown. mass of solid H = mass at step 3 – mass at step 1 mass of solid H = ...................................................... g [1] (c) The mass of solid H changes when it is heated. (i) Calculate the change in mass of solid H. Use the equation shown. change in mass = mass at step 3 – mass at step 7 change in mass = ...................................................... g [1] (ii) Suggest a reason for this change in mass. ........................................................................................................................................... ..................................................................................................................................... [1] (iii) Calculate the percentage change in mass of solid H. Use the equation shown. change in mass in (c)(i) percentage change in mass = × 100 mass of solid H in (b) Give your answer to two significant figures. percentage change in mass = ...................................................... % [2] (d) Explain why it is important to heat solid H with a blue Bunsen burner flame instead of a yellow flame. ................................................................................................................................................... ............................................................................................................................................. [1] (e) Explain how to improve the procedure to make sure that solid H has the maximum change in mass. ................................................................................................................................................... ................................................................................................................................................... ............................................................................................................................................. [1] (f) You are going to add solid H to dilute nitric acid. You will need to identify the gas that is formed. Procedure • Add about 3 cm depth of dilute nitric acid to a clean test‑tube. • Add a spatula of solid H to the test‑tube. Identify the gas formed. You may need to add more solid H to the dilute nitric acid if the mixture stops fizzing. Describe the test and observation used to identify the gas. test ............................................................................................................................................ observation ............................................................................................................................... identity of gas ............................................................................................................................ [2] [Total: 13] Check that you have completed (a)–(e).
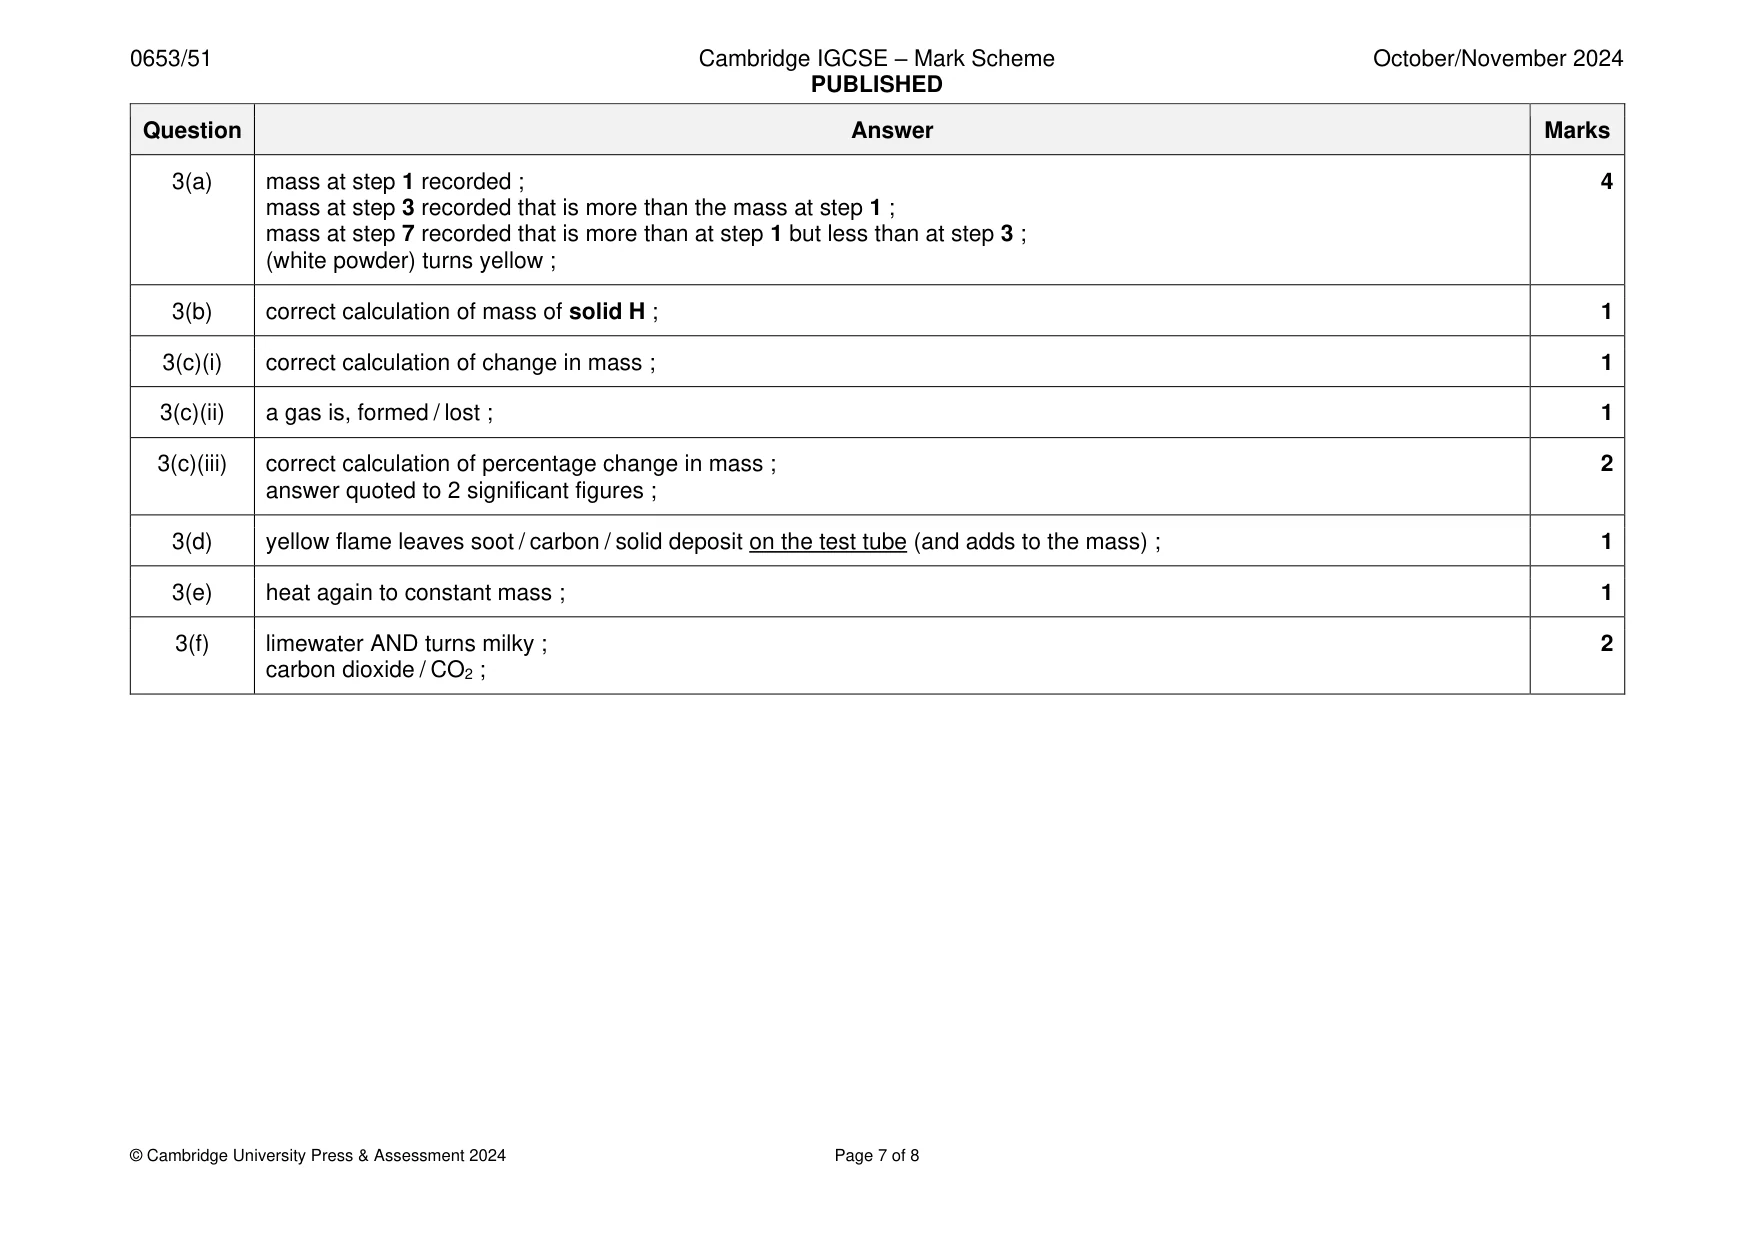
Mark scheme: 3(a) mass at step 1 recorded ; 4 mass at step 3 recorded that is more than the mass at step 1 ; mass at step 7 recorded that is more than at step 1 but less than at step 3 ; (white powder) turns yellow ; 3(b) correct calculation of mass of solid H ; 1 3(c)(i) correct calculation of change in mass ; 1 3(c)(ii) a gas is, formed / lost ; 1 3(c)(iii) correct calculation of percentage change in mass ; 2 answer quoted to 2 significant figures ; 3(d) yellow flame leaves soot / carbon / solid deposit on the test tube (and adds to the mass) ; 1 3(e) heat again to constant mass ; 1 3(f) limewater AND turns milky ; 2 carbon dioxide / CO2 ;
Q4 · You are going to investigate the stretching of identical springs
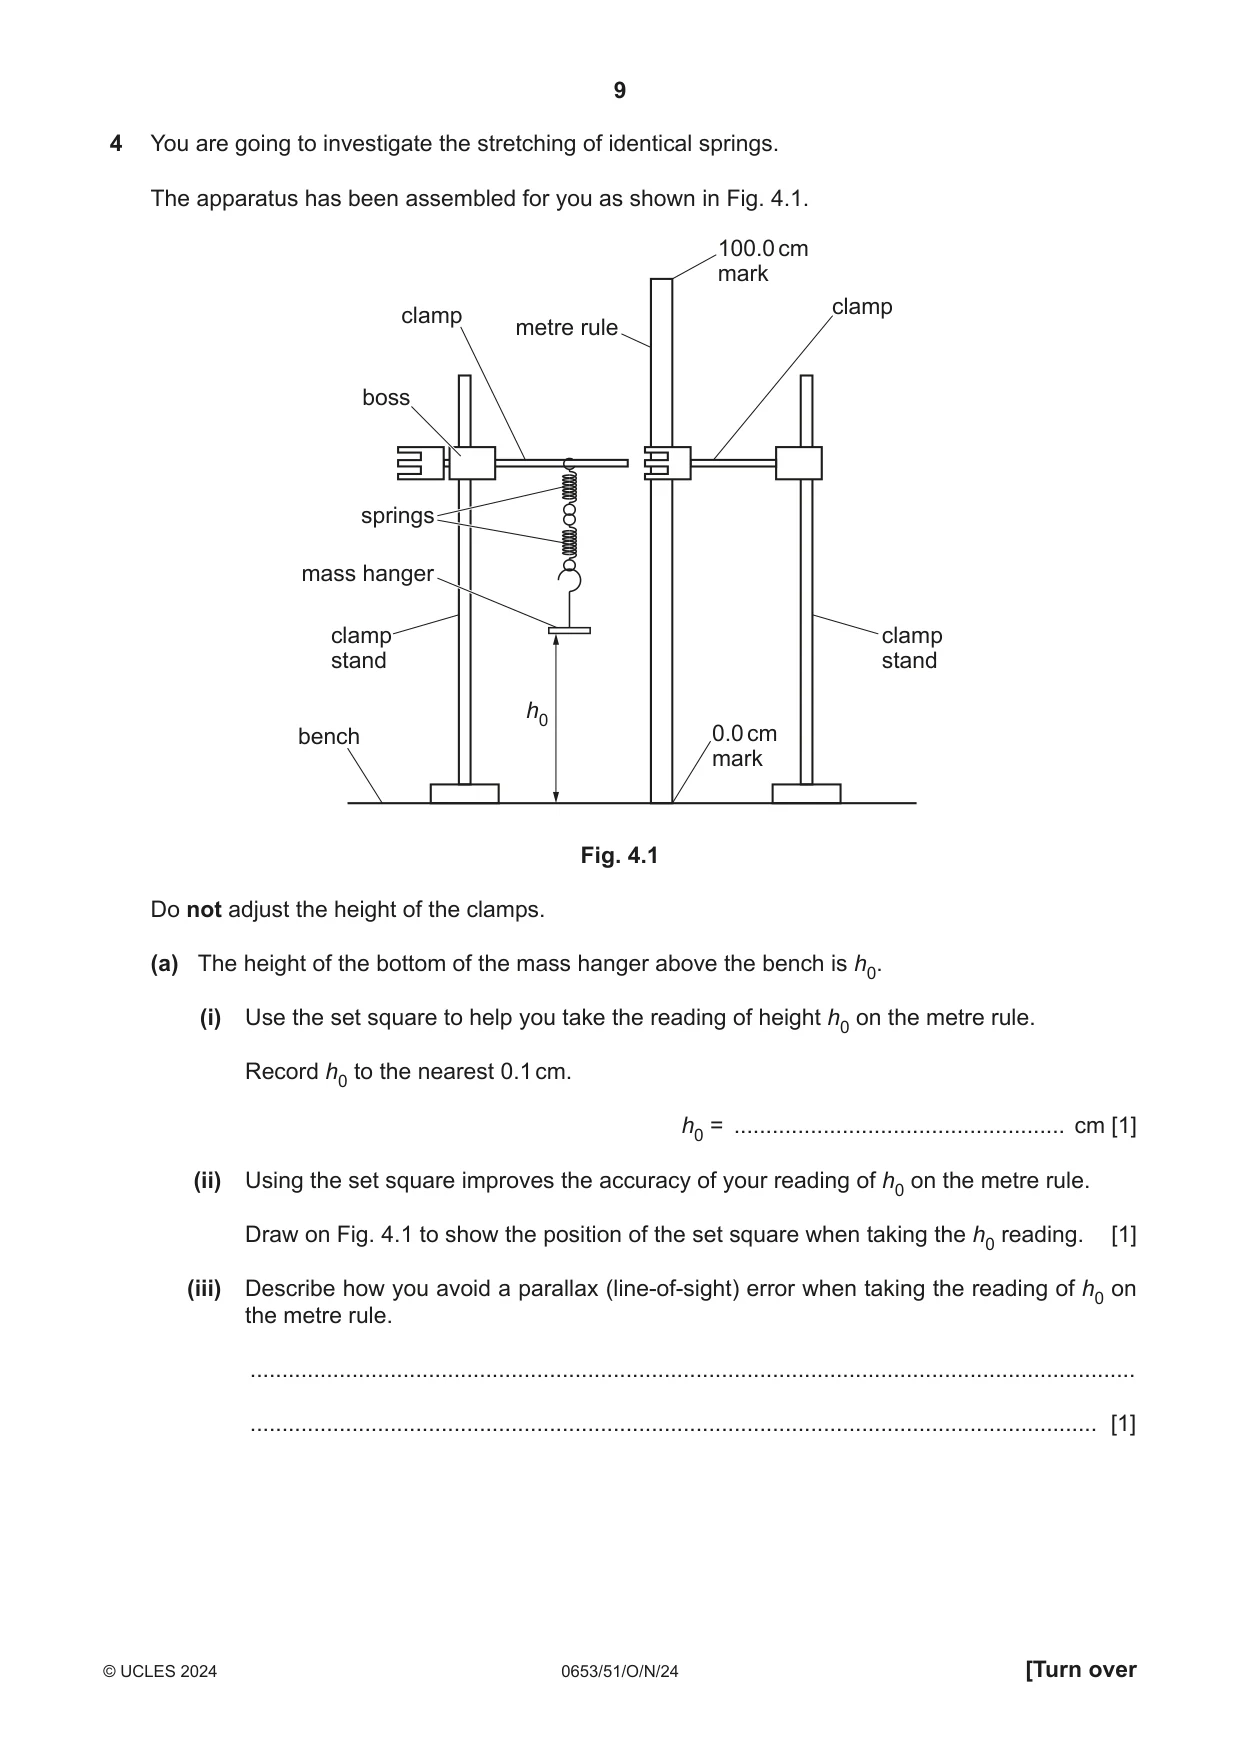
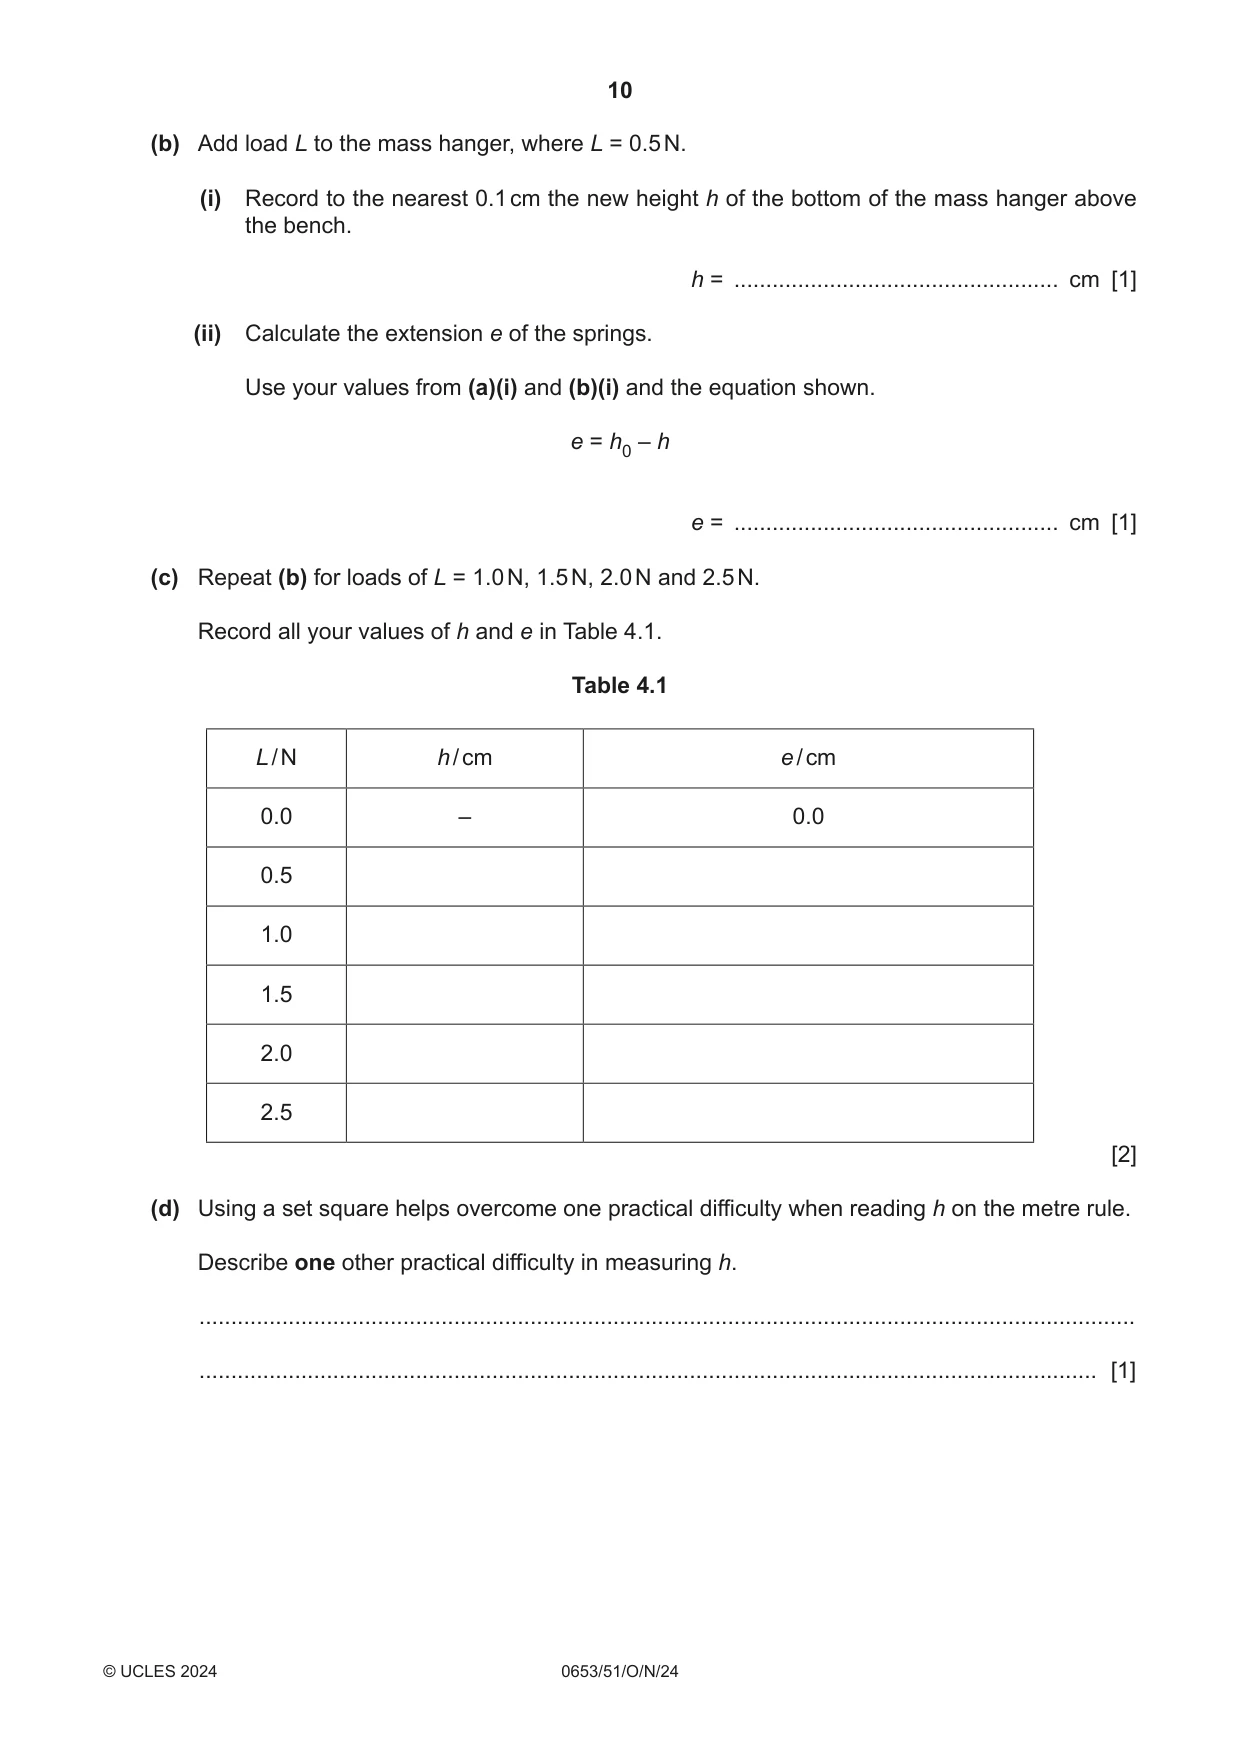
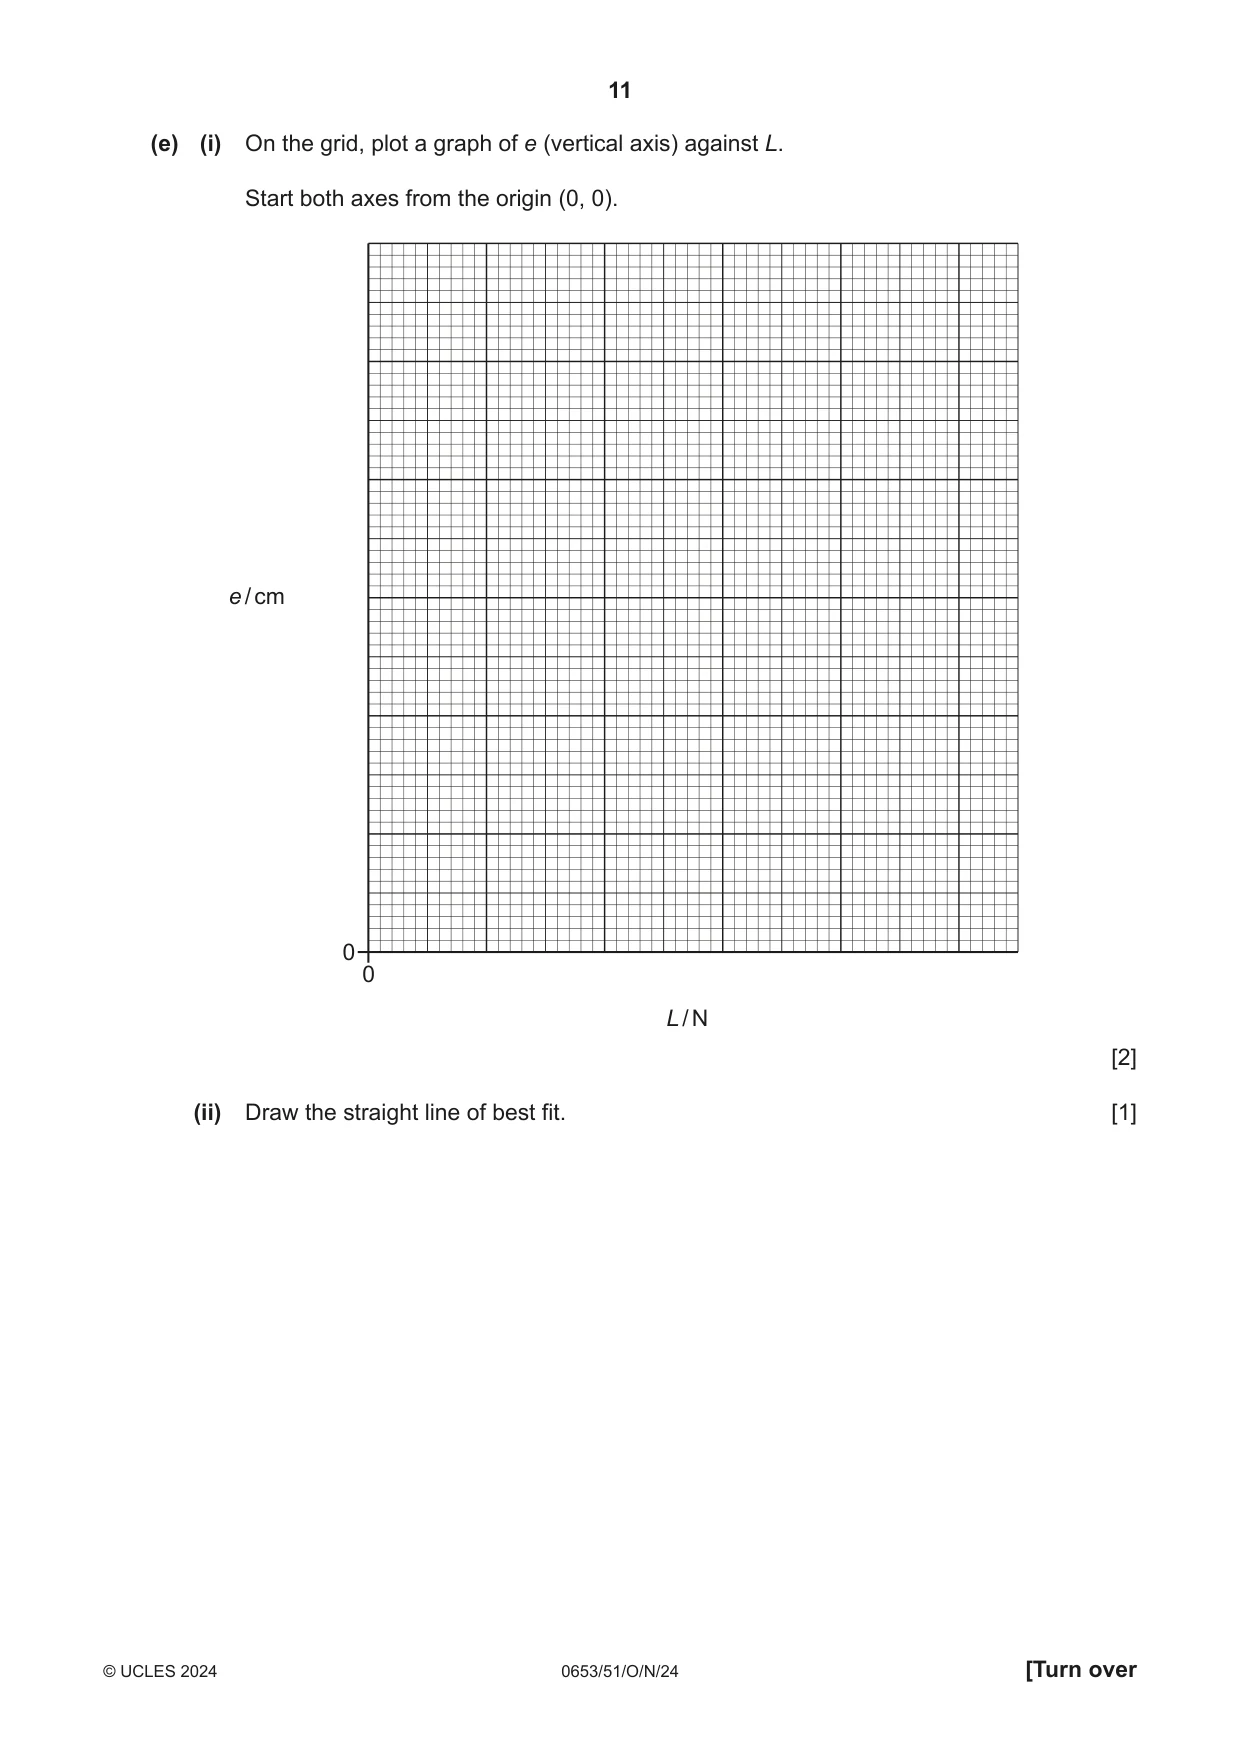
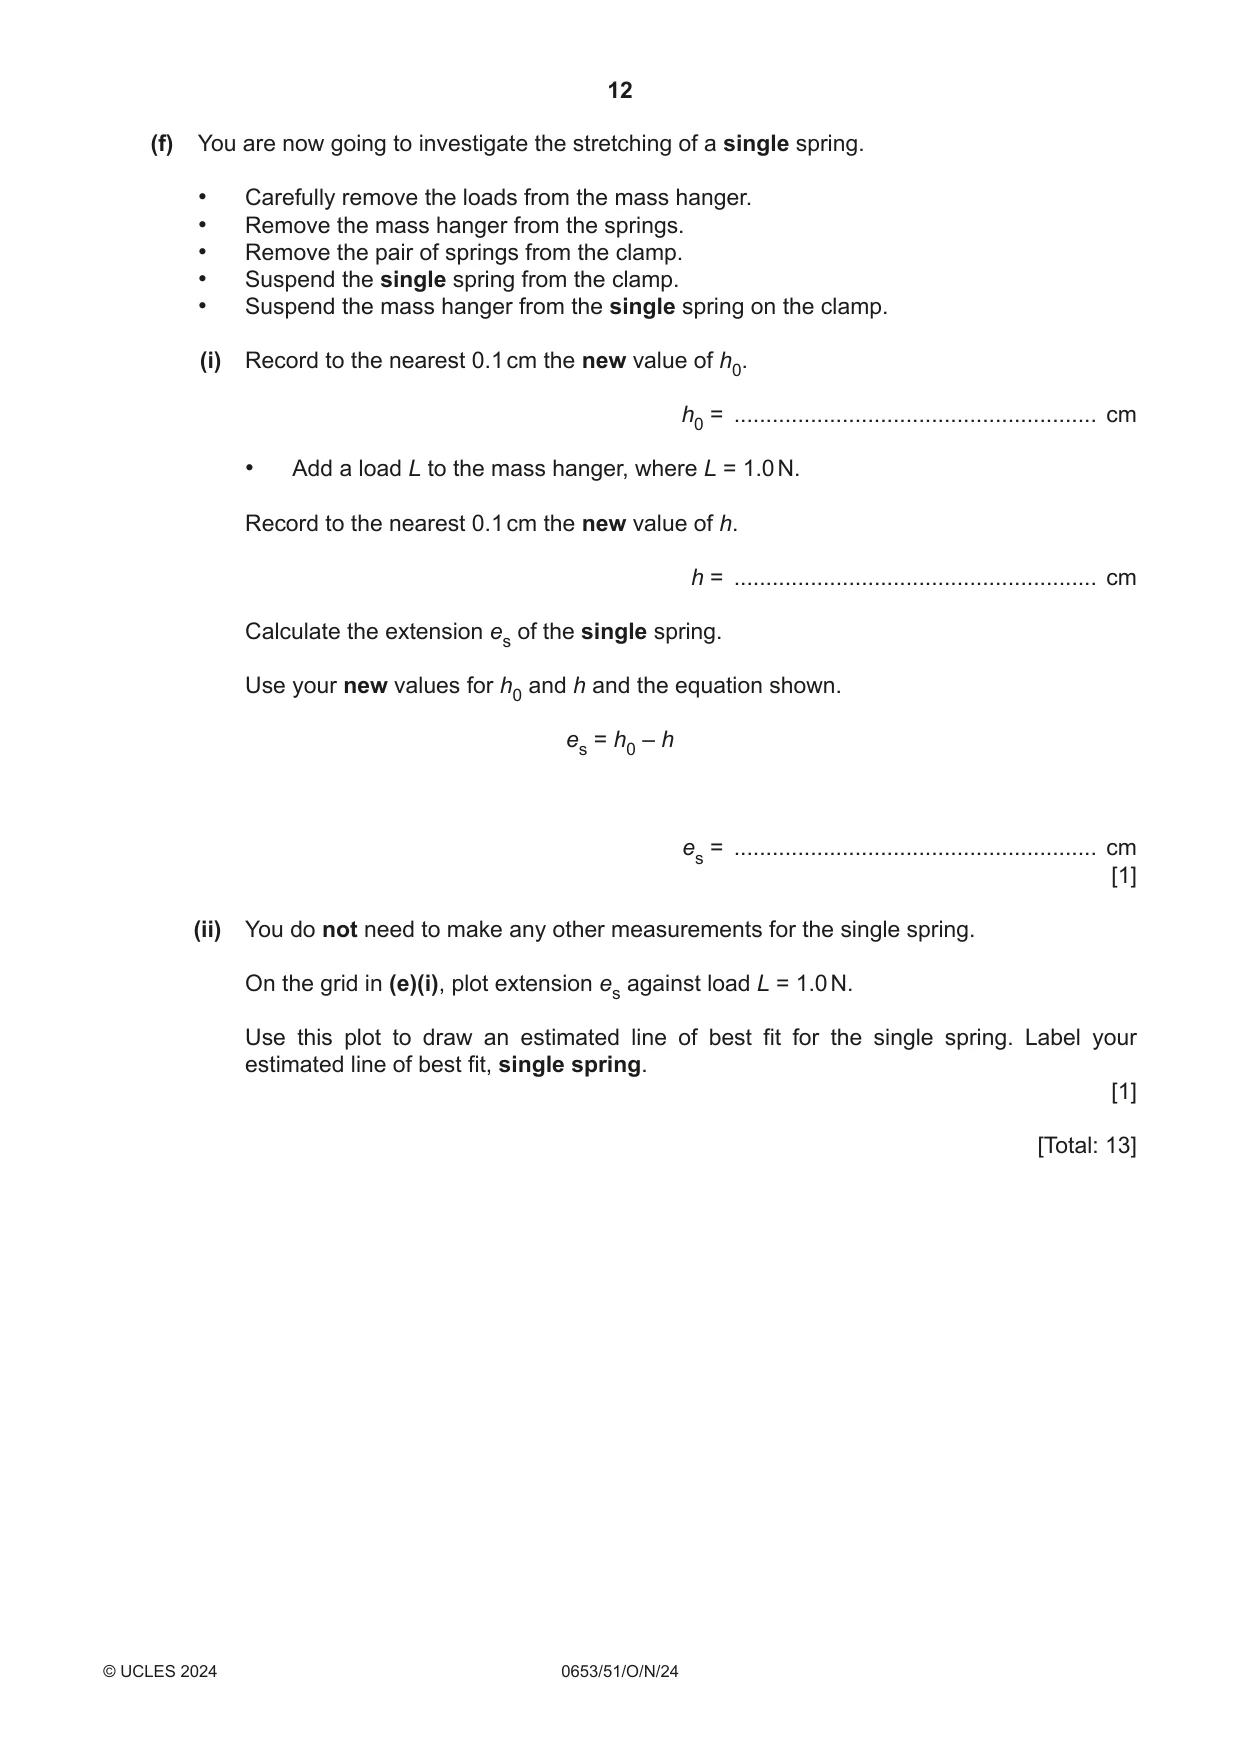
4 You are going to investigate the stretching of identical springs. The apparatus has been assembled for you as shown in Fig. 4.1. 100.0 cm mark clamp clamp metre rule boss springs mass hanger clamp clamp stand stand h0 bench 0.0 cm mark Fig. 4.1 Do not adjust the height of the clamps. (a) The height of the bottom of the mass hanger above the bench is h0. (i) Use the set square to help you take the reading of height h0 on the metre rule. Record h0 to the nearest 0.1 cm. h0 = .................................................... cm [1] (ii) Using the set square improves the accuracy of your reading of h0 on the metre rule. Draw on Fig. 4.1 to show the position of the set square when taking the h0 reading. [1] (iii) Describe how you avoid a parallax (line‑of‑sight) error when taking the reading of h0 on the metre rule. ........................................................................................................................................... ..................................................................................................................................... [1] (b) Add load L to the mass hanger, where L = 0.5 N. (i) Record to the nearest 0.1 cm the new height h of the bottom of the mass hanger above the bench. h = ................................................... cm [1] (ii) Calculate the extension e of the springs. Use your values from (a)(i) and (b)(i) and the equation shown. e = h0 – h e = ................................................... cm [1] (c) Repeat (b) for loads of L = 1.0 N, 1.5 N, 2.0 N and 2.5 N. Record all your values of h and e in Table 4.1. Table 4.1 L / N h / cm e / cm 0.0 – 0.0 0.5 1.0 1.5 2.0 2.5 [2] (d) Using a set square helps overcome one practical difficulty when reading h on the metre rule. Describe one other practical difficulty in measuring h. ................................................................................................................................................... ............................................................................................................................................. [1] (e) (i) On the grid, plot a graph of e (vertical axis) against L. Start both axes from the origin (0, 0). e / cm 0 0 L / N [2] (ii) Draw the straight line of best fit. [1]
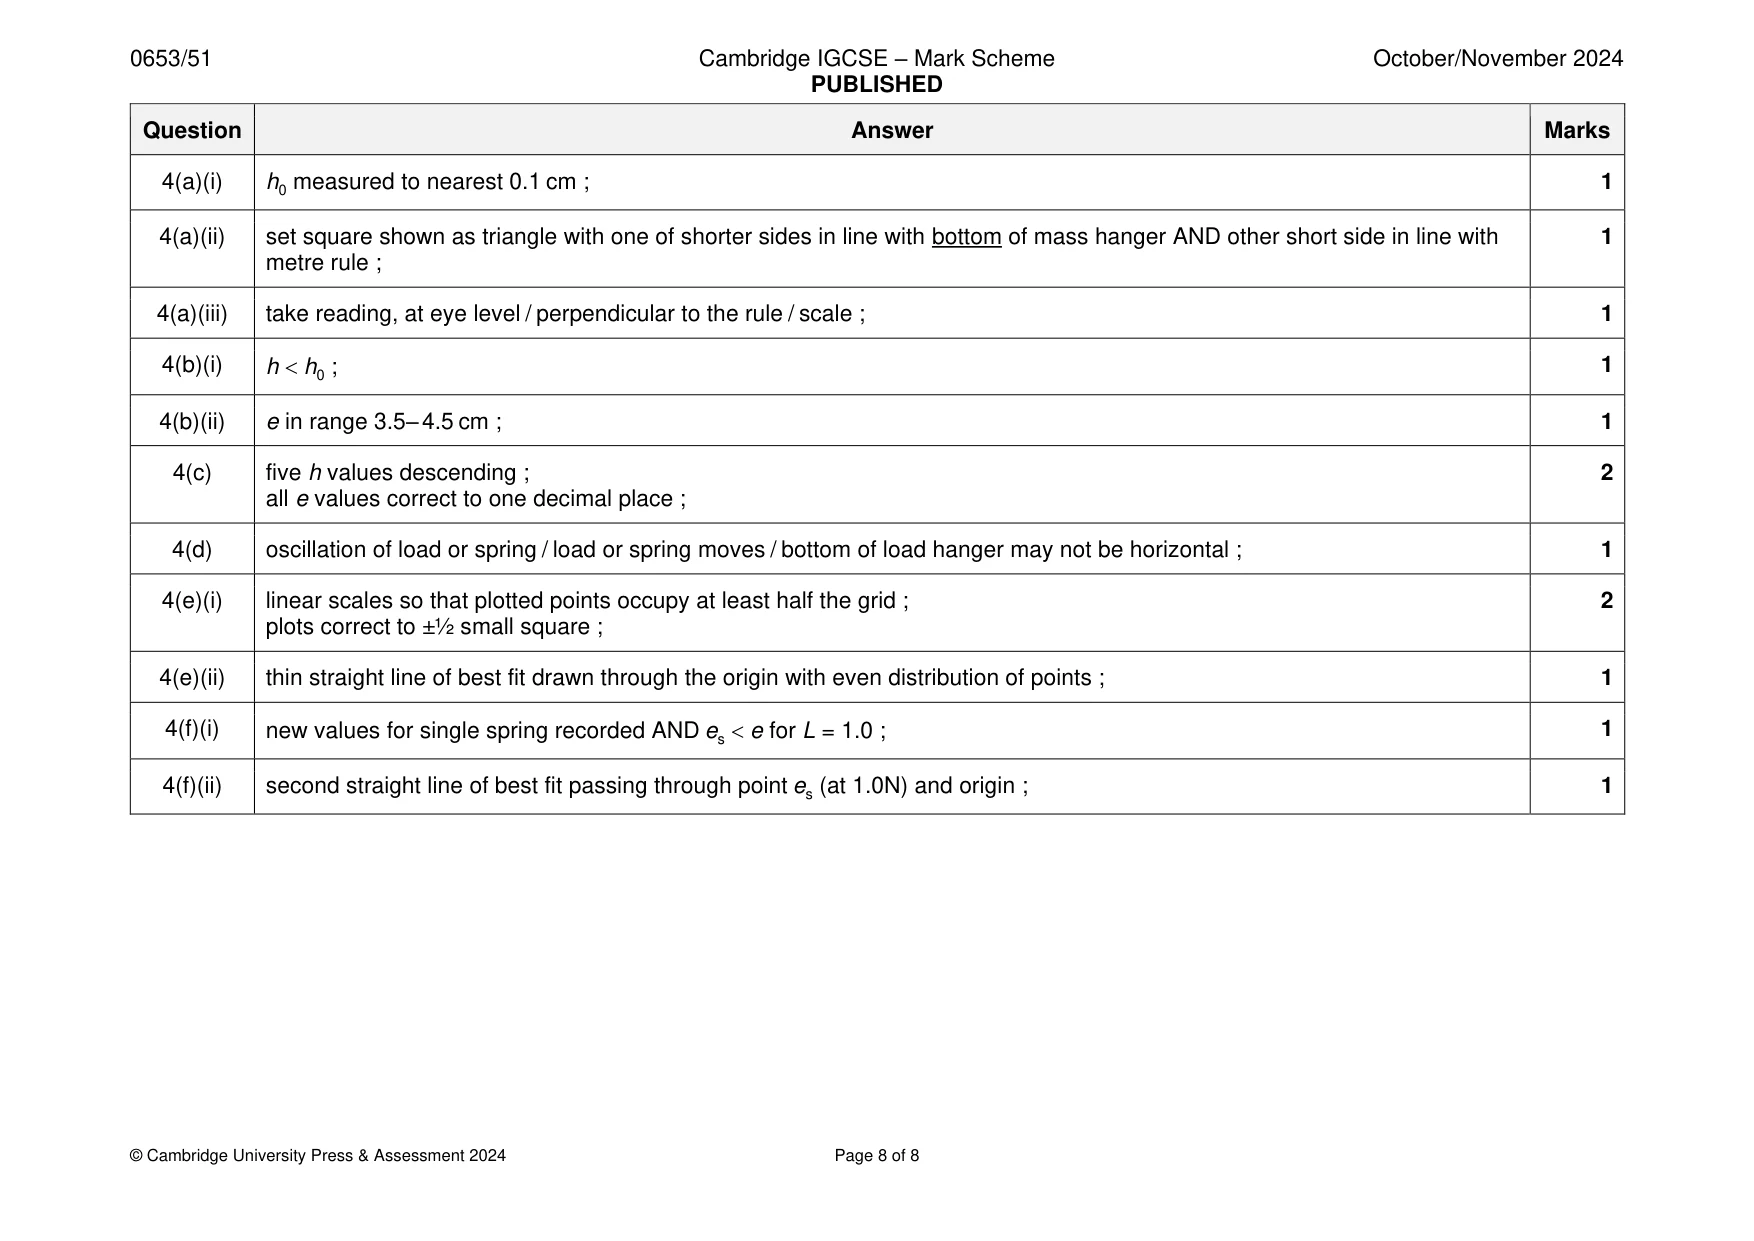
Mark scheme: 4(a)(i) h0 measured to nearest 0.1 cm ; 1 4(a)(ii) set square shown as triangle with one of shorter sides in line with bottom of mass hanger AND other short side in line with 1 metre rule ; 4(a)(iii) take reading, at eye level / perpendicular to the rule / scale ; 1 4(b)(i) h h0 ; 1 4(b)(ii) e in range 3.5– 4.5 cm ; 1 4(c) five h values descending ; 2 all e values correct to one decimal place ; 4(d) oscillation of load or spring / load or spring moves / bottom of load hanger may not be horizontal ; 1 4(e)(i) linear scales so that plotted points occupy at least half the grid ; 2 plots correct to ±½ small square ; 4(e)(ii) thin straight line of best fit drawn through the origin with even distribution of points ; 1 4(f)(i) new values for single spring recorded AND es e for L = 1.0 ; 1 4(f)(ii) second straight line of best fit passing through point es (at 1.0N) and origin ; 1
More questions on Physical quantities and measurement techniques
What was in this paper
The subtopics covered by these 4 questions, and how many questions each got. Open one in a new tab to see every Cambridge question on it.
What you needed in this session
Cambridge’s own grade thresholds for 2024 Oct/Nov, Paper 5 · Variant 1. A higher threshold means an easier paper — the bar moves with how the cohort did.