Cambridge IGCSE Science - Combined 0653 — 2024 May/June Paper 5 · Variant 1
0653/51/M/J/24 · 4 questions · 40 marks · ≈45 min
The question paper and its mark scheme, free to read here and free to download. This is Cambridge’s own paper, exactly as it was sat.
Question paper16 pages




Mark scheme7 pages
Answers below. Sit the paper first if you are practising.
Questions as text
Q1 · You are going to investigate the effect of copper sulfate on the enzyme amylase
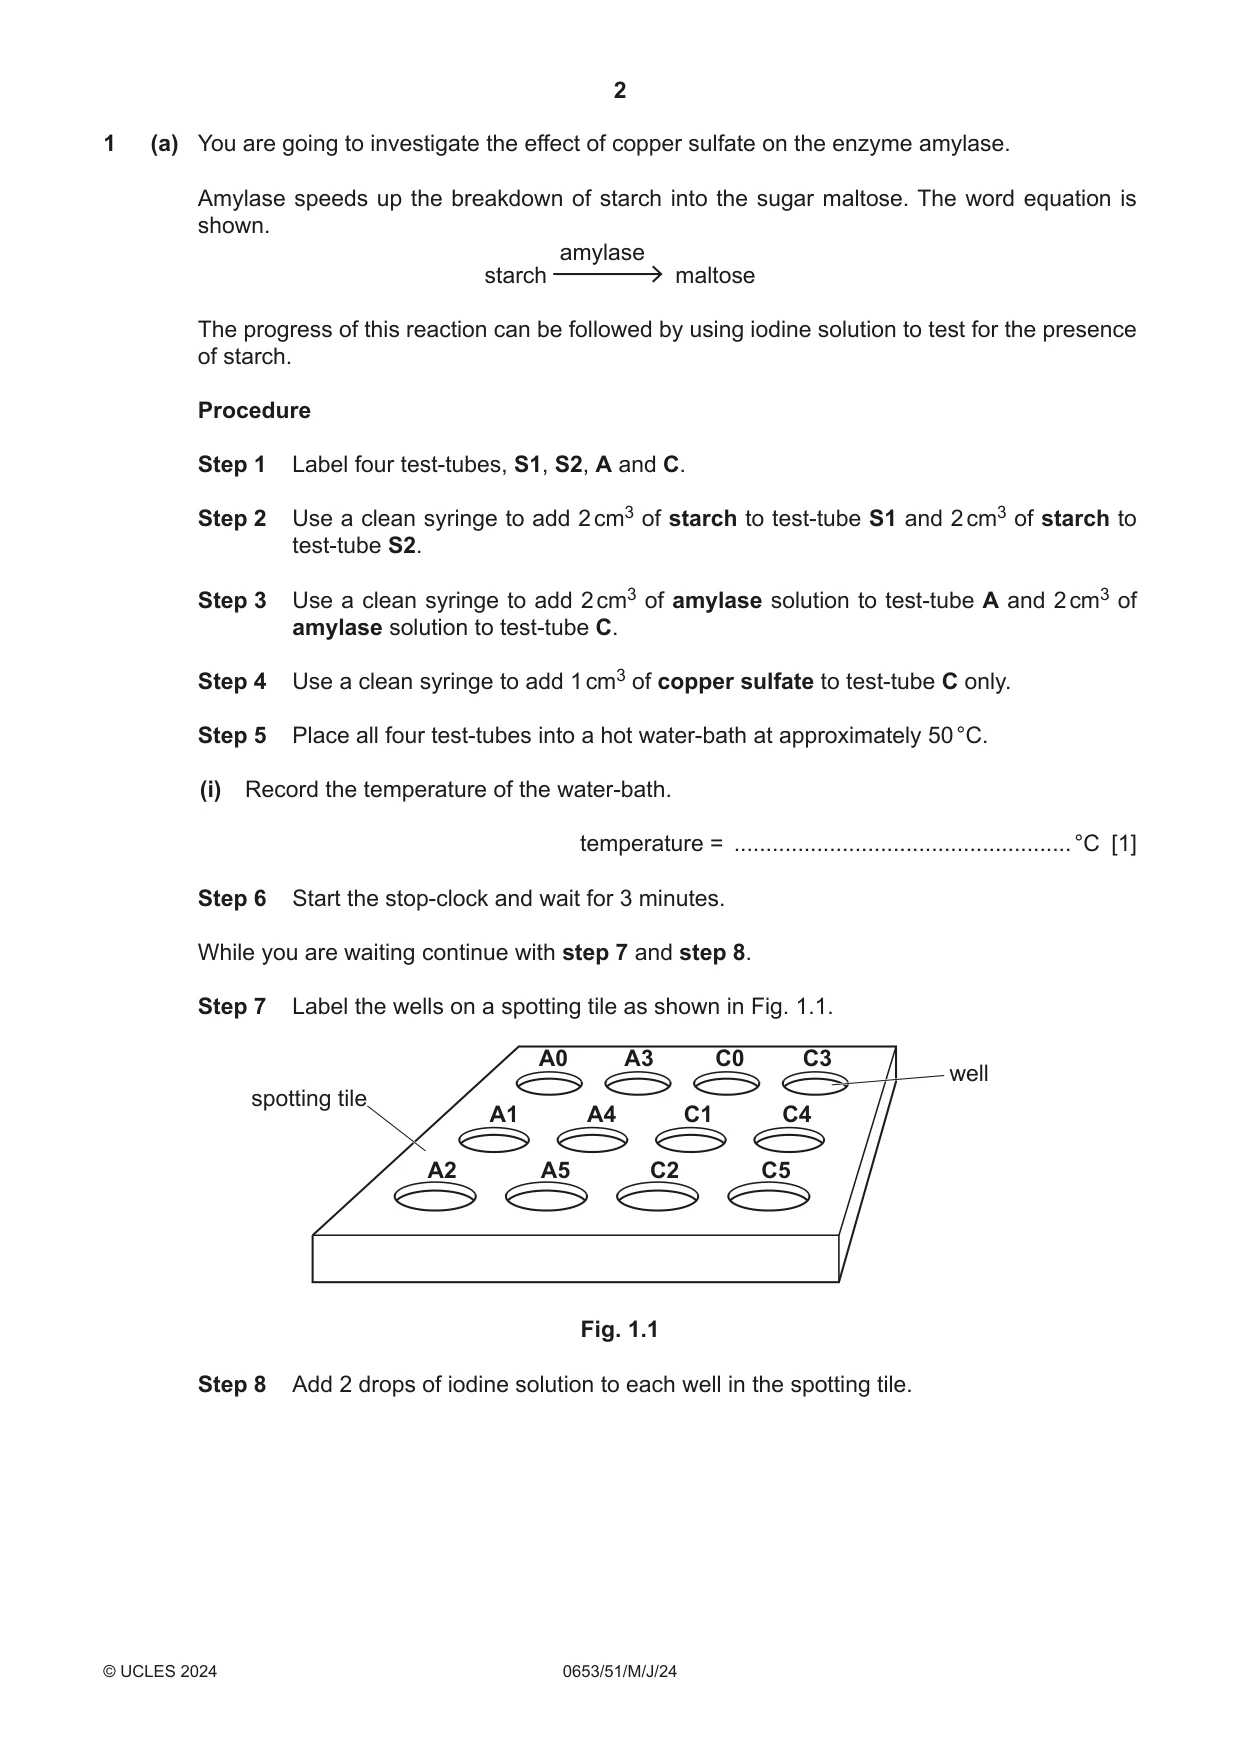
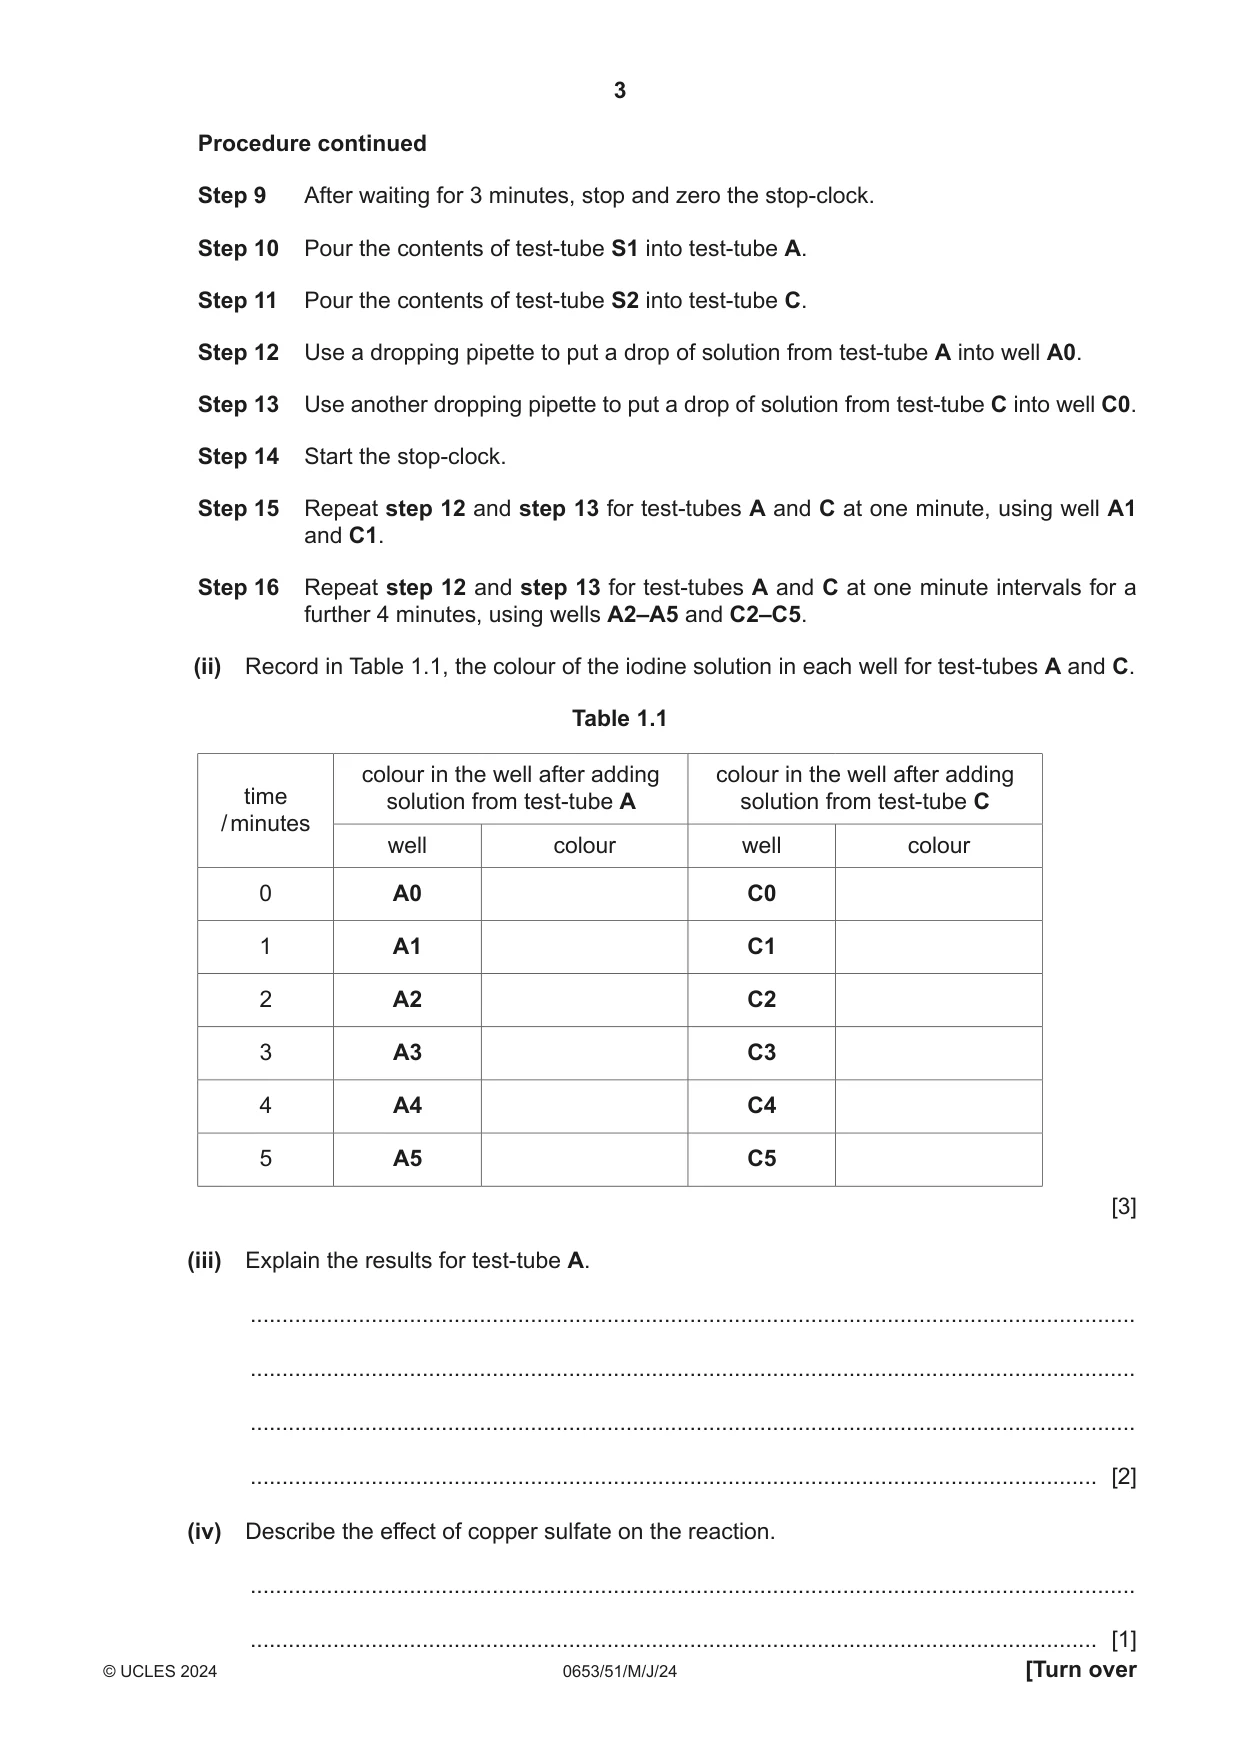
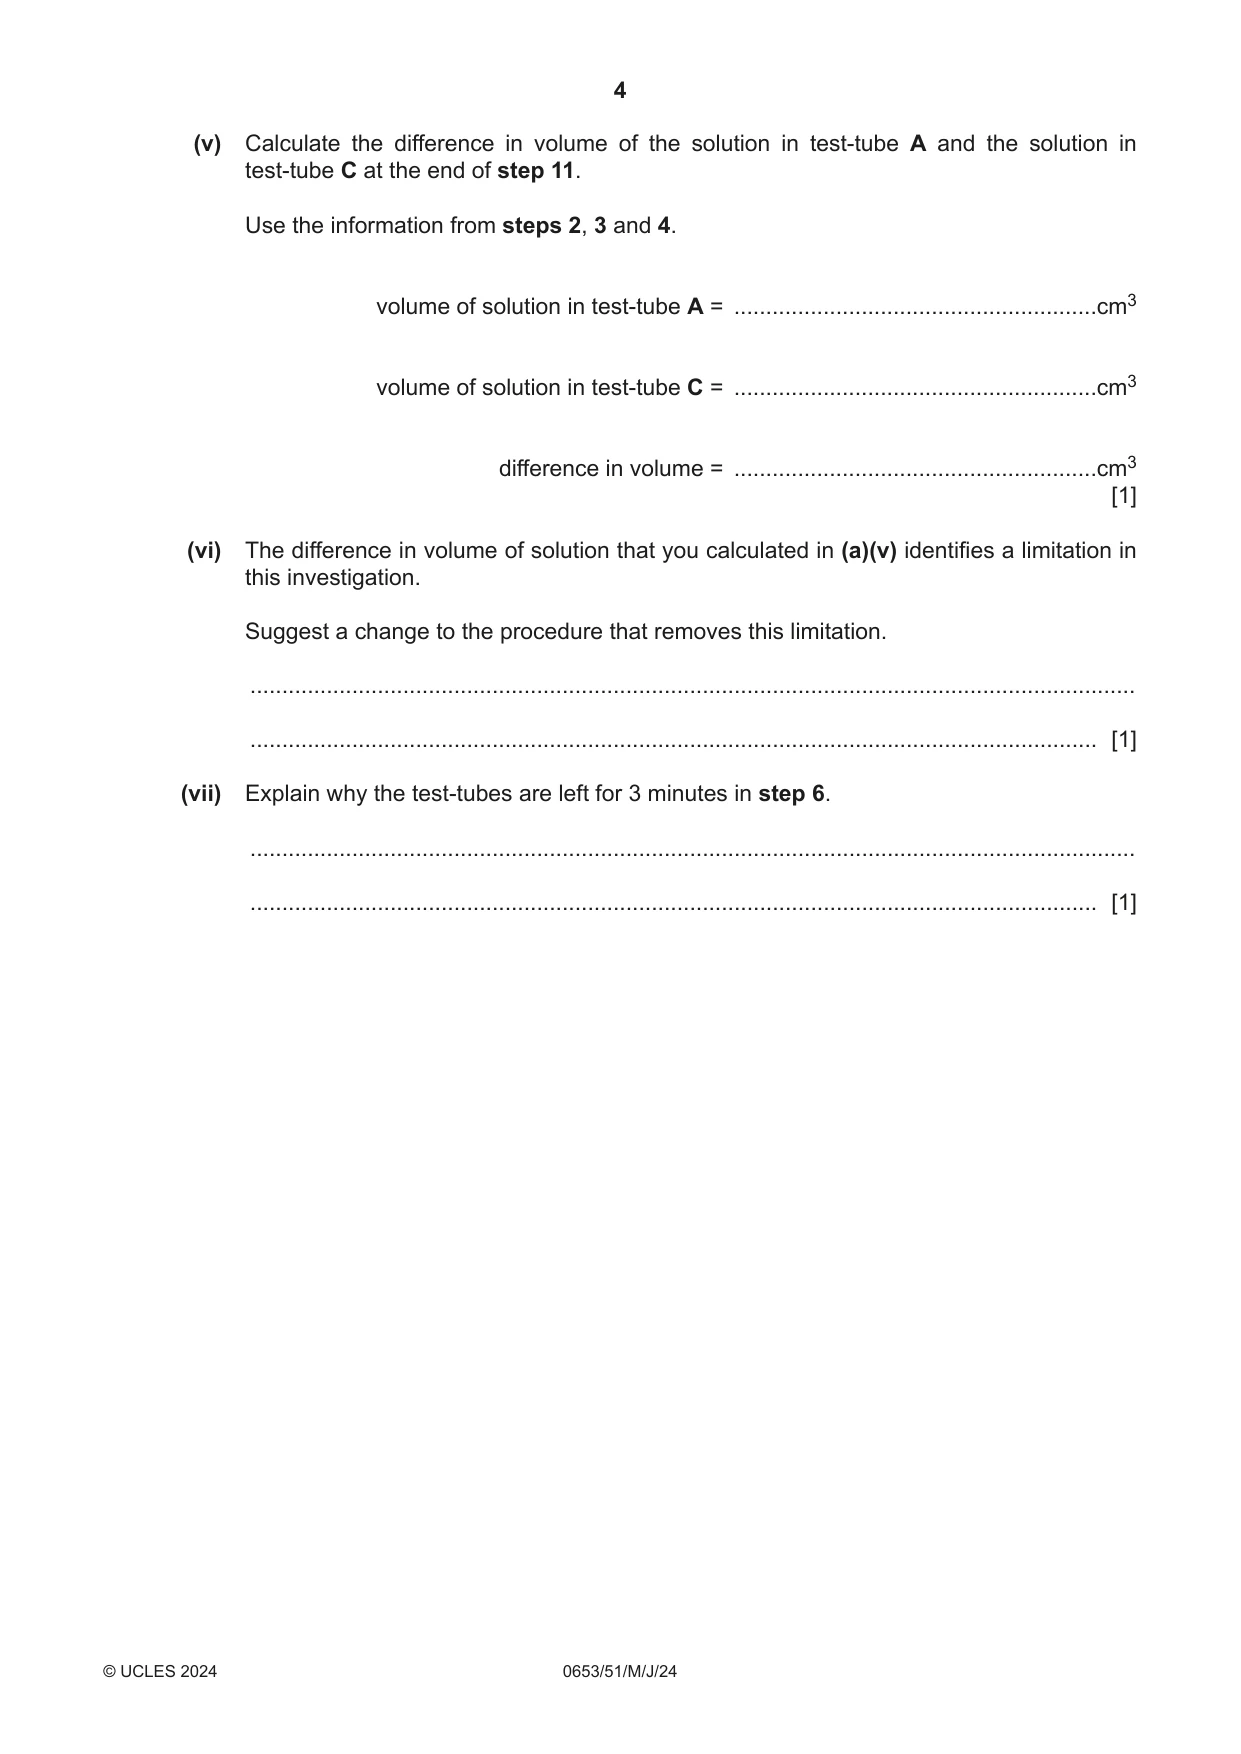
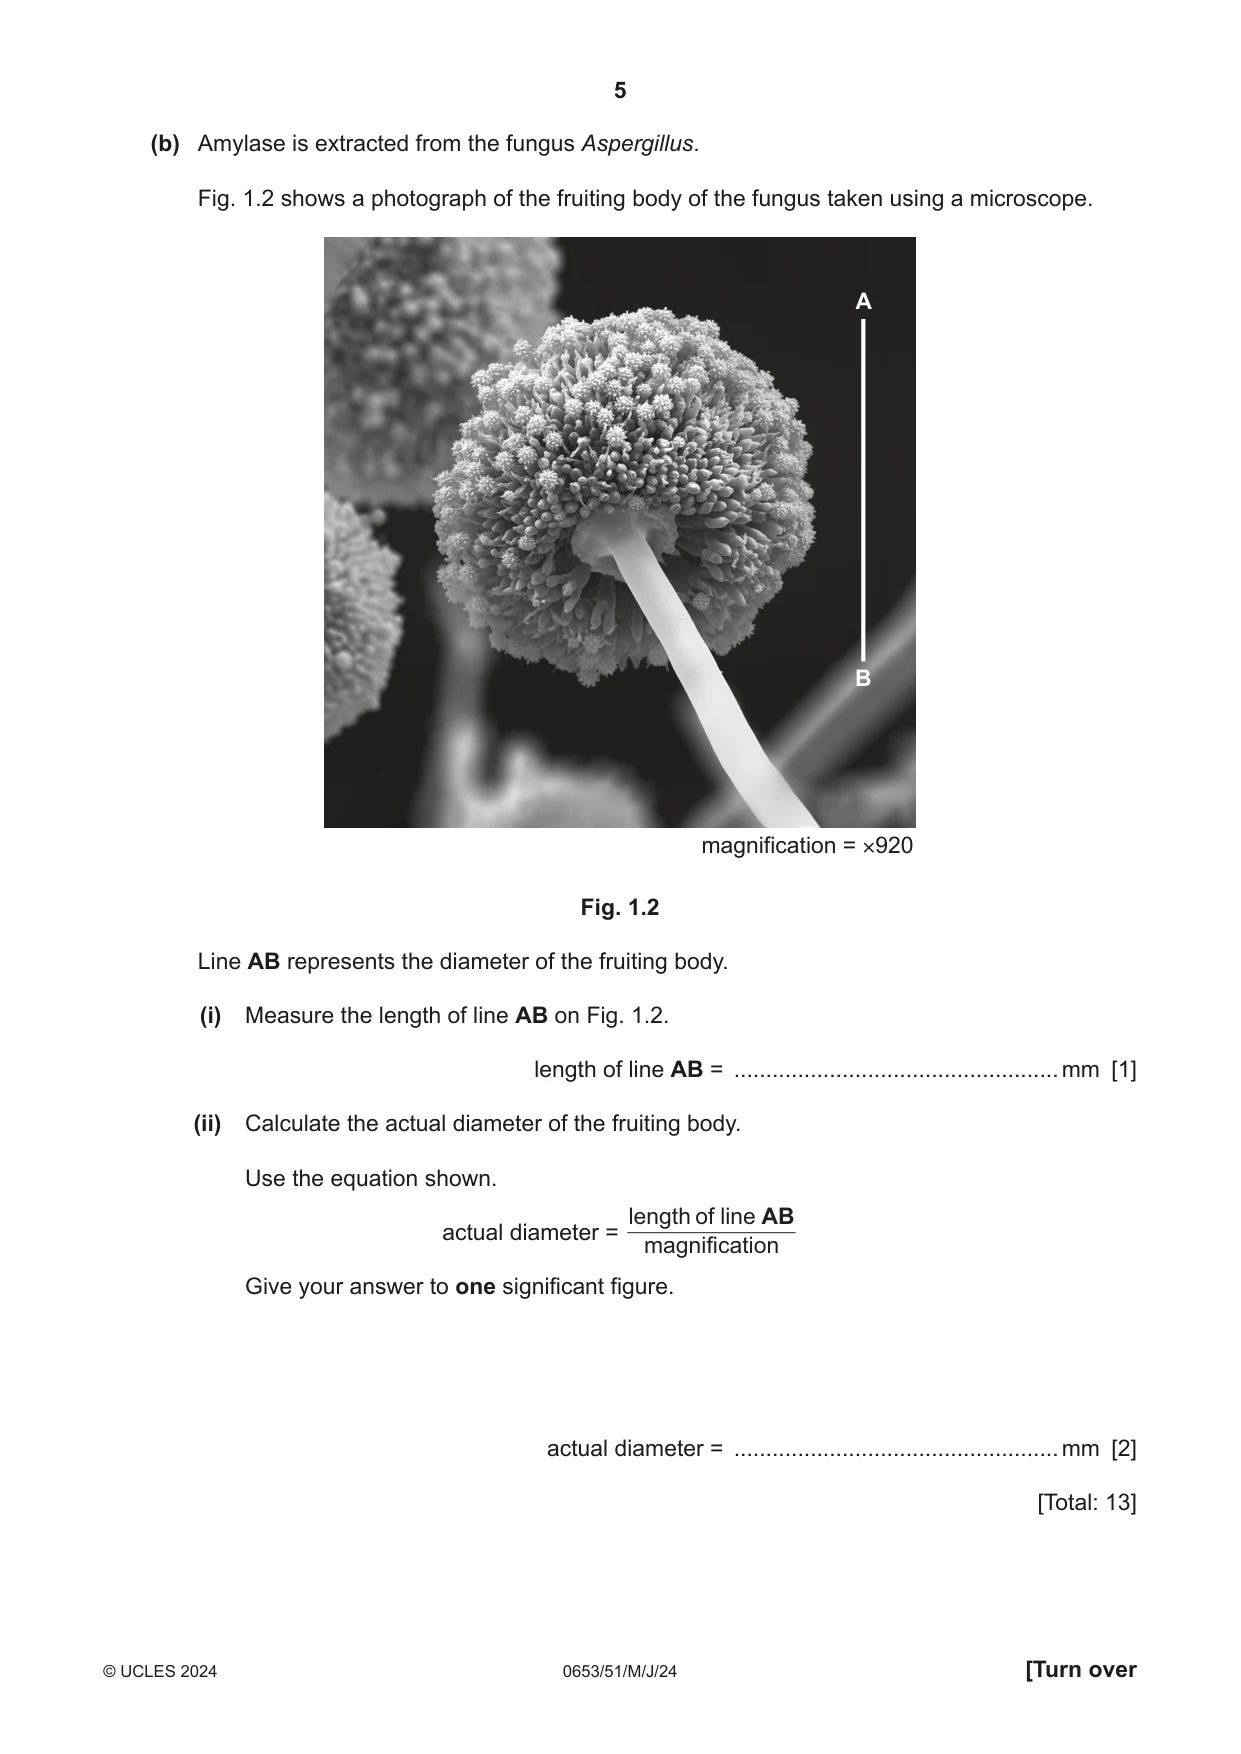
1 (a) You are going to investigate the effect of copper sulfate on the enzyme amylase. Amylase speeds up the breakdown of starch into the sugar maltose. The word equation is shown. amylase starch maltose The progress of this reaction can be followed by using iodine solution to test for the presence of starch. Procedure Step 1 Label four test-tubes, S1, S2, A and C. Step 2 Use a clean syringe to add 2 cm3 of starch to test-tube S1 and 2 cm3 of starch to test-tube S2. Step 3 Use a clean syringe to add 2 cm3 of amylase solution to test-tube A and 2 cm3 of amylase solution to test-tube C. Step 4 Use a clean syringe to add 1 cm3 of copper sulfate to test-tube C only. Step 5 Place all four test-tubes into a hot water-bath at approximately 50 °C. (i) Record the temperature of the water-bath. temperature = .....................................................°C [1] Step 6 Start the stop-clock and wait for 3 minutes. While you are waiting continue with step 7 and step 8. Step 7 Label the wells on a spotting tile as shown in Fig. 1.1. A0 A3 C0 C3 well spotting tile A1 A4 C1 C4 A2 A5 C2 C5 Fig. 1.1 Step 8 Add 2 drops of iodine solution to each well in the spotting tile. Procedure continued Step 9 After waiting for 3 minutes, stop and zero the stop-clock. Step 10 Pour the contents of test-tube S1 into test-tube A. Step 11 Pour the contents of test-tube S2 into test-tube C. Step 12 Use a dropping pipette to put a drop of solution from test-tube A into well A0. Step 13 Use another dropping pipette to put a drop of solution from test-tube C into well C0. Step 14 Start the stop-clock. Step 15 Repeat step 12 and step 13 for test-tubes A and C at one minute, using well A1 and C1. Step 16 Repeat step 12 and step 13 for test-tubes A and C at one minute intervals for a further 4 minutes, using wells A2–A5 and C2–C5. (ii) Record in Table 1.1, the colour of the iodine solution in each well for test-tubes A and C. Table 1.1 colour in the well after adding colour in the well after adding time solution from test-tube A solution from test-tube C / minutes well colour well colour 0 A0 C0 1 A1 C1 2 A2 C2 3 A3 C3 4 A4 C4 5 A5 C5 [3] (iii) Explain the results for test-tube A. ........................................................................................................................................... ........................................................................................................................................... ........................................................................................................................................... ..................................................................................................................................... [2] (iv) Describe the effect of copper sulfate on the reaction. ........................................................................................................................................... ..................................................................................................................................... [1] (v) Calculate the difference in volume of the solution in test-tube A and the solution in test-tube C at the end of step 11. Use the information from steps 2, 3 and 4. volume of solution in test-tube A = .........................................................cm3 volume of solution in test-tube C = .........................................................cm3 difference in volume = .........................................................cm3 [1] (vi) The difference in volume of solution that you calculated in (a)(v) identifies a limitation in this investigation. Suggest a change to the procedure that removes this limitation. ........................................................................................................................................... ..................................................................................................................................... [1] (vii) Explain why the test-tubes are left for 3 minutes in step 6. ........................................................................................................................................... ..................................................................................................................................... [1] (b) Amylase is extracted from the fungus Aspergillus. Fig. 1.2 shows a photograph of the fruiting body of the fungus taken using a microscope. A B magnification = ×920 Fig. 1.2 Line AB represents the diameter of the fruiting body. (i) Measure the length of line AB on Fig. 1.2. length of line AB = ...................................................mm [1] (ii) Calculate the actual diameter of the fruiting body. Use the equation shown. length of line AB actual diameter = magnification Give your answer to one significant figure. actual diameter = ...................................................mm [2] [Total: 13]
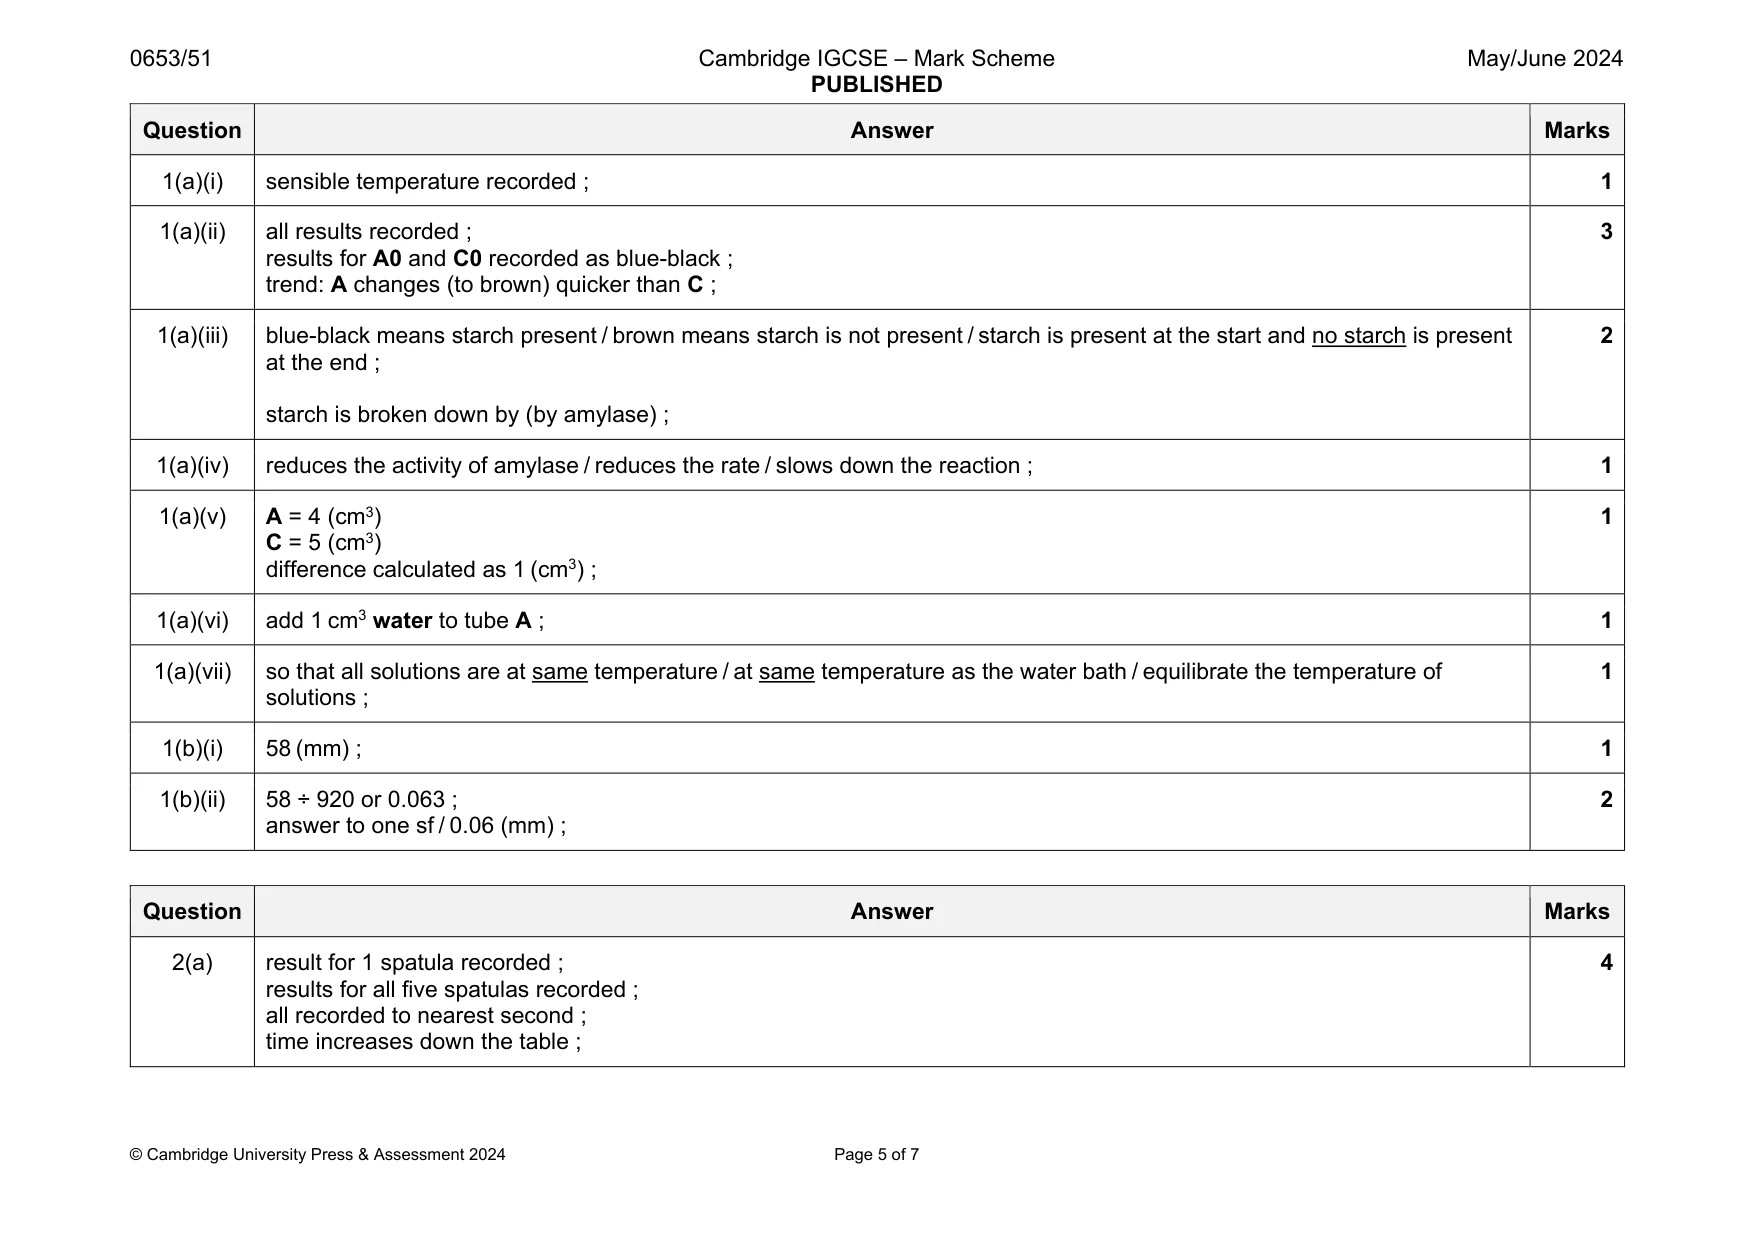
Mark scheme: 1(a)(i) sensible temperature recorded ; 1 1(a)(ii) all results recorded ; results for A0 and C0 recorded as blue-black ; trend: A changes (to brown) quicker than C ; 3 1(a)(iii) blue-black means starch present / brown means starch is not present / starch is present at the start and no starch is present at the end ; starch is broken down by (by amylase) ; 2 1(a)(iv) reduces the activity of amylase / reduces the rate / slows down the reaction ; 1 1(a)(v) A = 4 (cm3) C = 5 (cm3) difference calculated as 1 (cm3) ; 1 1(a)(vi) add 1 cm3 water to tube A ; 1 1(a)(vii) so that all solutions are at same temperature / at same temperature as the water bath / equilibrate the temperature of solutions ; 1 1(b)(i) 58 (mm) ; 1 1(b)(ii) 58 ÷ 920 or 0.063 ; answer to one sf / 0.06 (mm) ; 2
Q2 · You are going to investigate the reaction of sodium hydrogencarbonate with dilute…
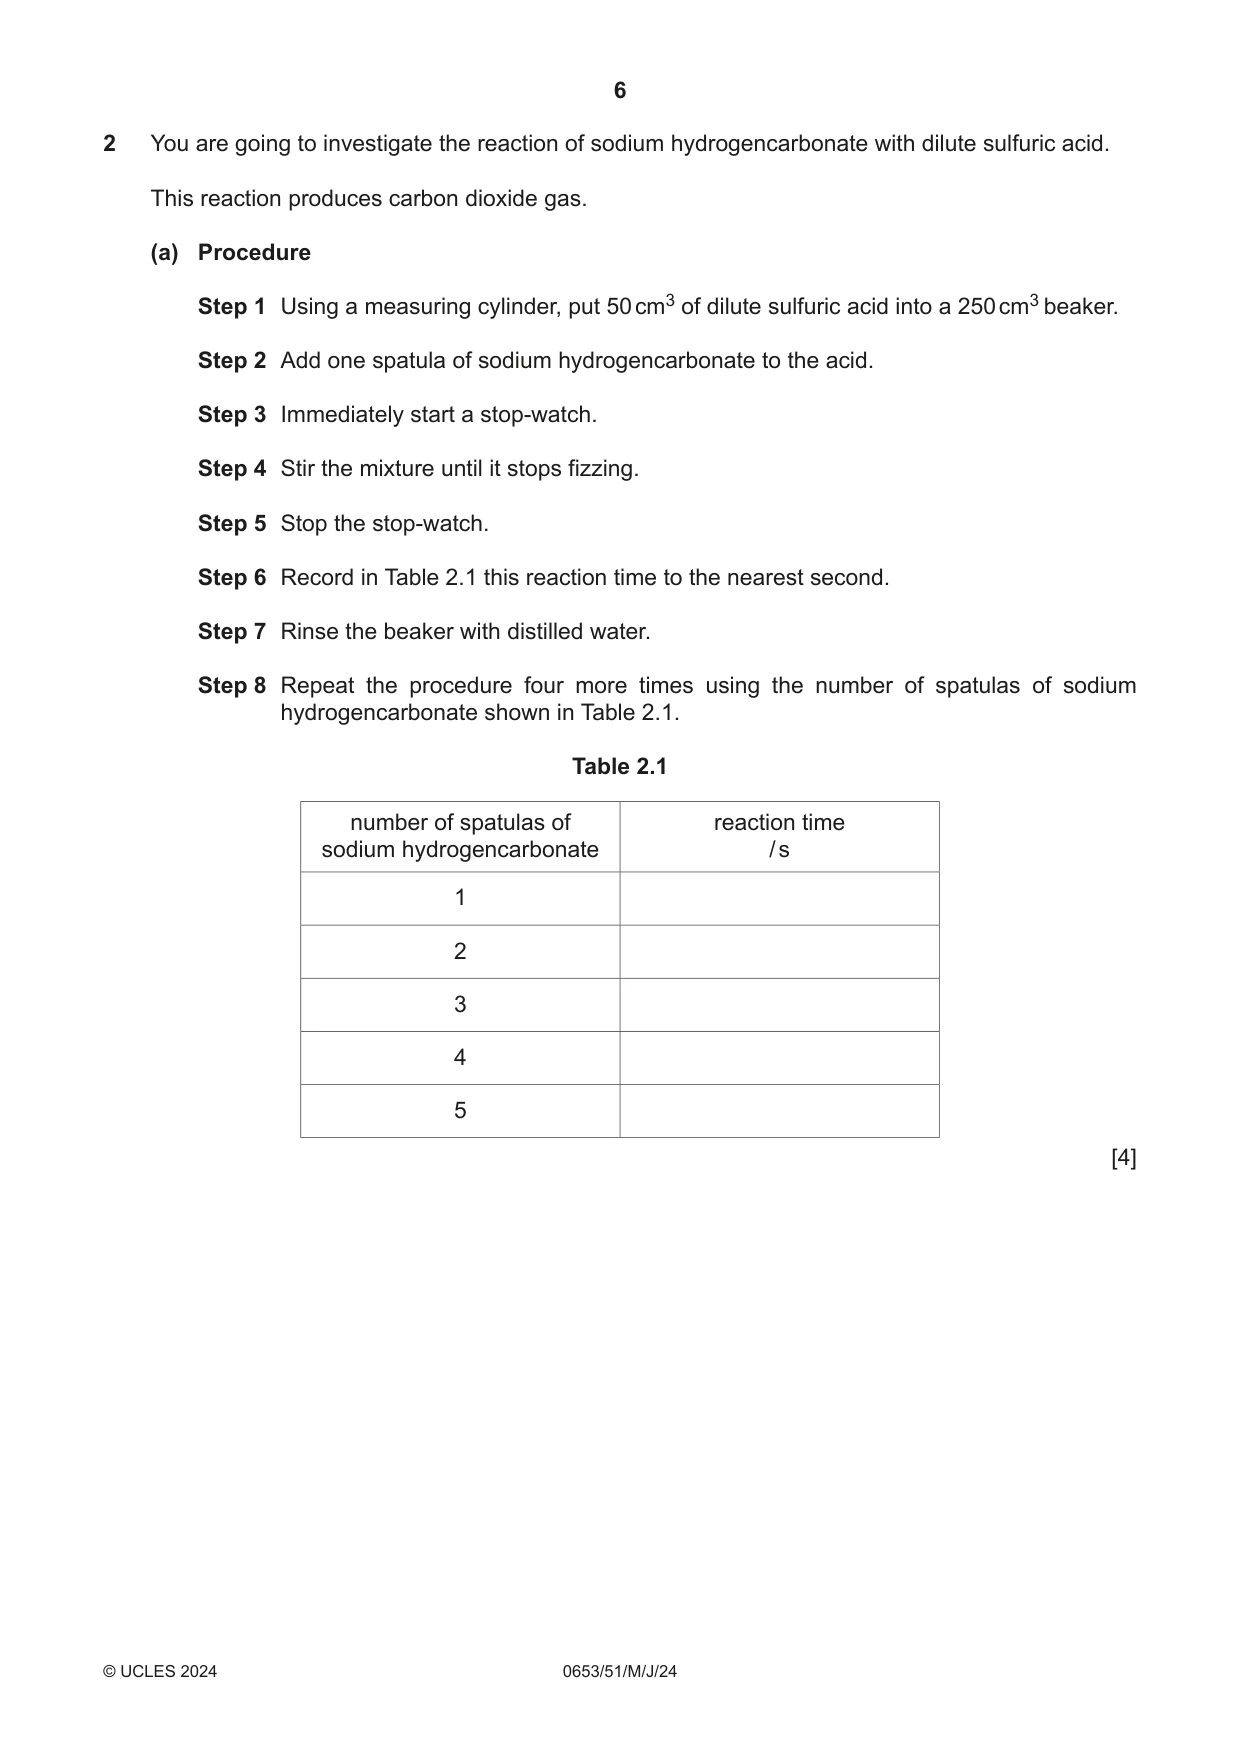
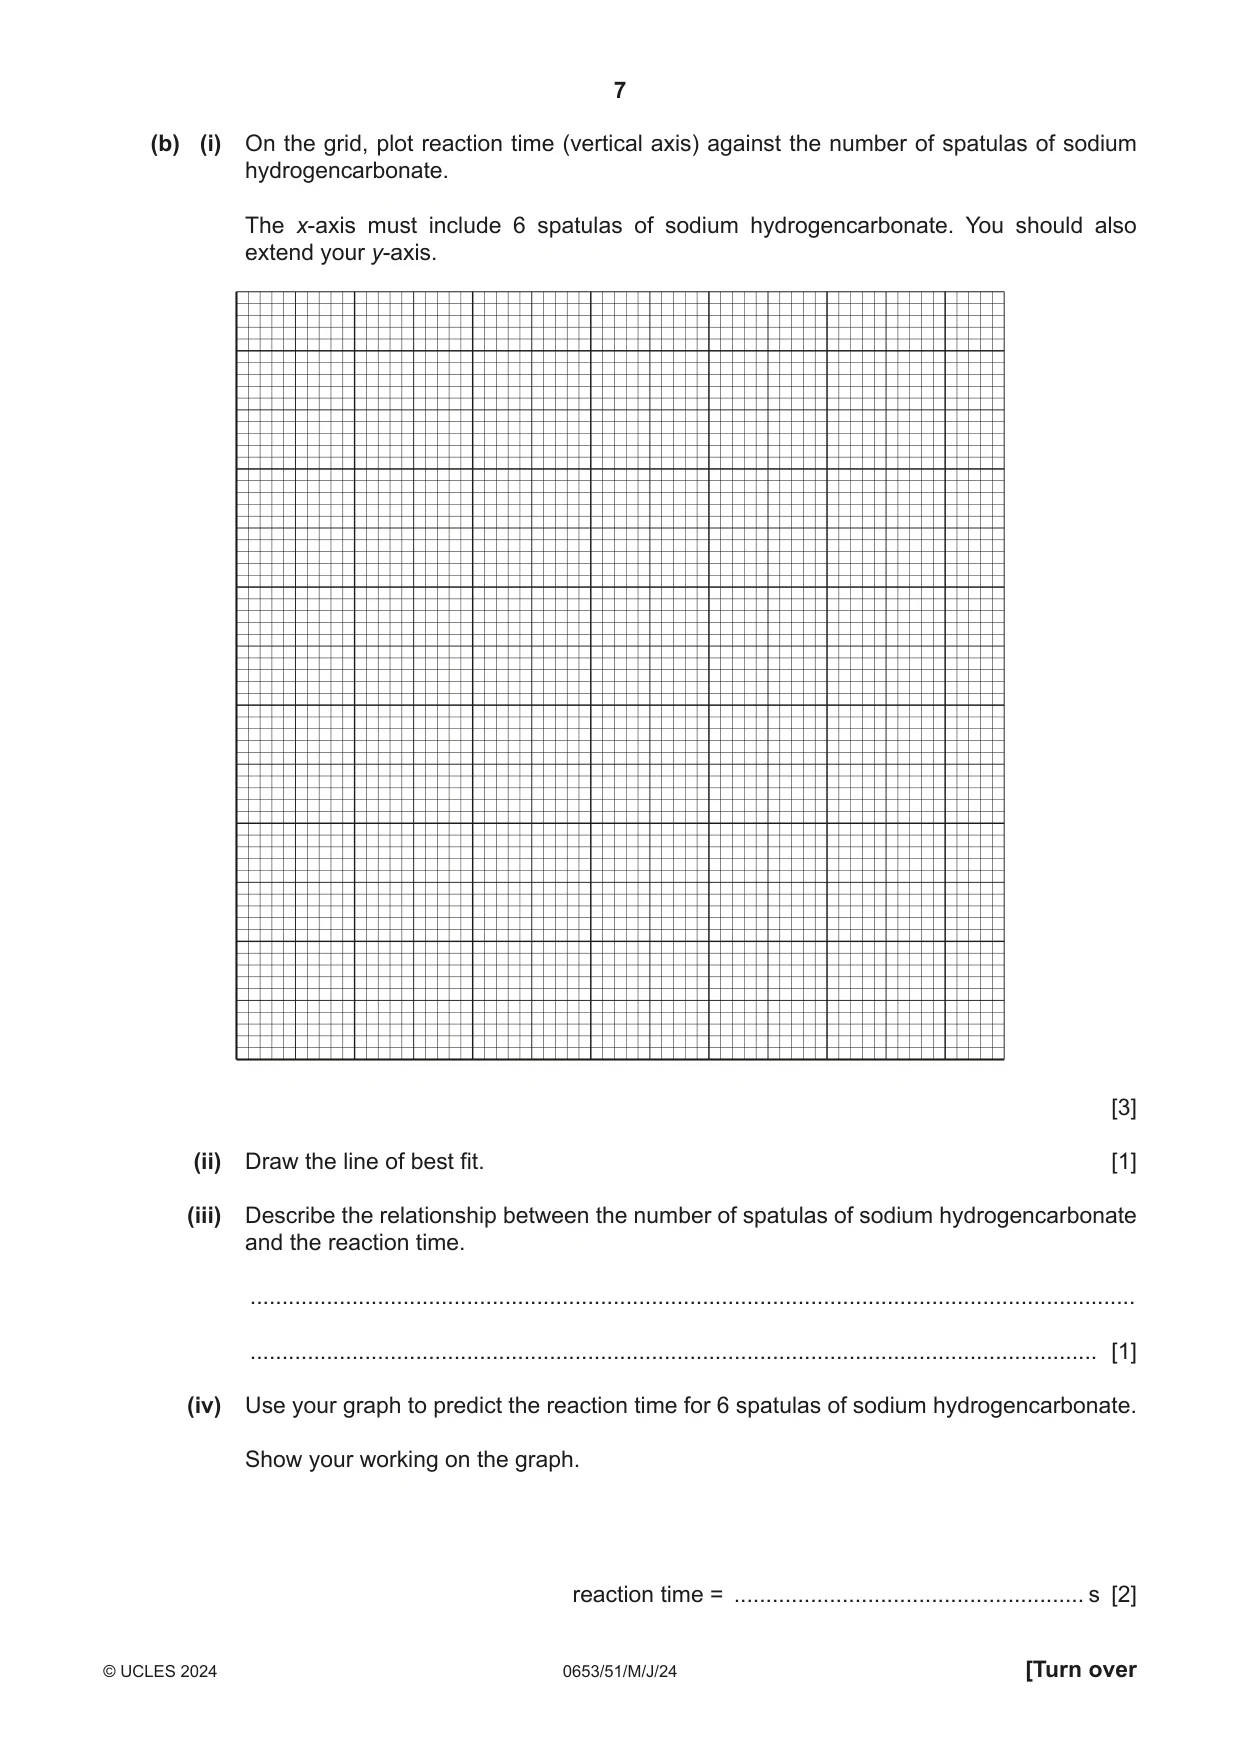
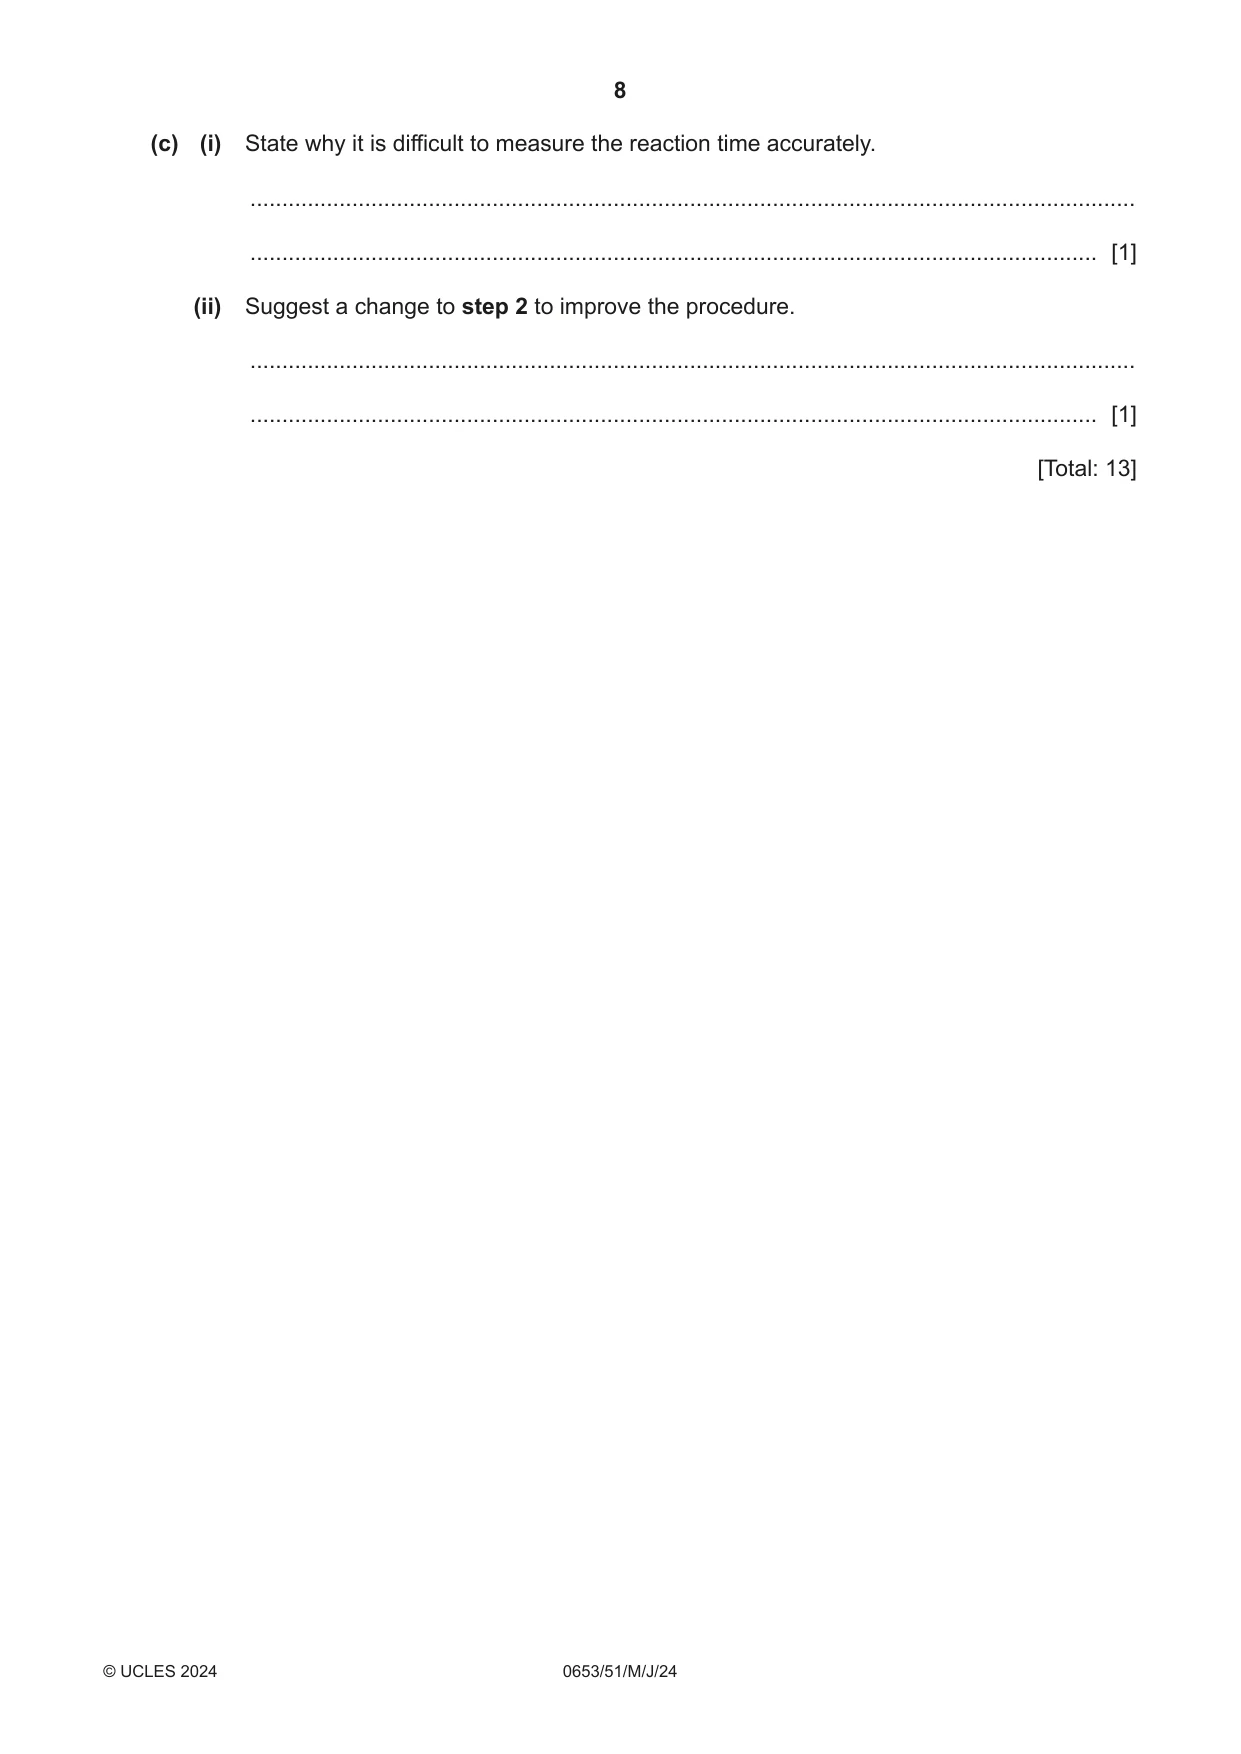
2 You are going to investigate the reaction of sodium hydrogencarbonate with dilute sulfuric acid. This reaction produces carbon dioxide gas. (a) Procedure Step 1 Using a measuring cylinder, put 50 cm3 of dilute sulfuric acid into a 250 cm3 beaker. Step 2 Add one spatula of sodium hydrogencarbonate to the acid. Step 3 Immediately start a stop-watch. Step 4 Stir the mixture until it stops fizzing. Step 5 Stop the stop-watch. Step 6 Record in Table 2.1 this reaction time to the nearest second. Step 7 Rinse the beaker with distilled water. Step 8 Repeat the procedure four more times using the number of spatulas of sodium hydrogencarbonate shown in Table 2.1. Table 2.1 number of spatulas of reaction time sodium hydrogencarbonate / s 1 2 3 4 5 [4] (b) (i) On the grid, plot reaction time (vertical axis) against the number of spatulas of sodium hydrogencarbonate. The x-axis must include 6 spatulas of sodium hydrogencarbonate. You should also extend your y-axis. [3] (ii) Draw the line of best fit. [1] (iii) Describe the relationship between the number of spatulas of sodium hydrogencarbonate and the reaction time. ........................................................................................................................................... ..................................................................................................................................... [1] (iv) Use your graph to predict the reaction time for 6 spatulas of sodium hydrogencarbonate. Show your working on the graph. reaction time = ....................................................... s [2] (c) (i) State why it is difficult to measure the reaction time accurately. ........................................................................................................................................... ..................................................................................................................................... [1] (ii) Suggest a change to step 2 to improve the procedure. ........................................................................................................................................... ..................................................................................................................................... [1] [Total: 13]
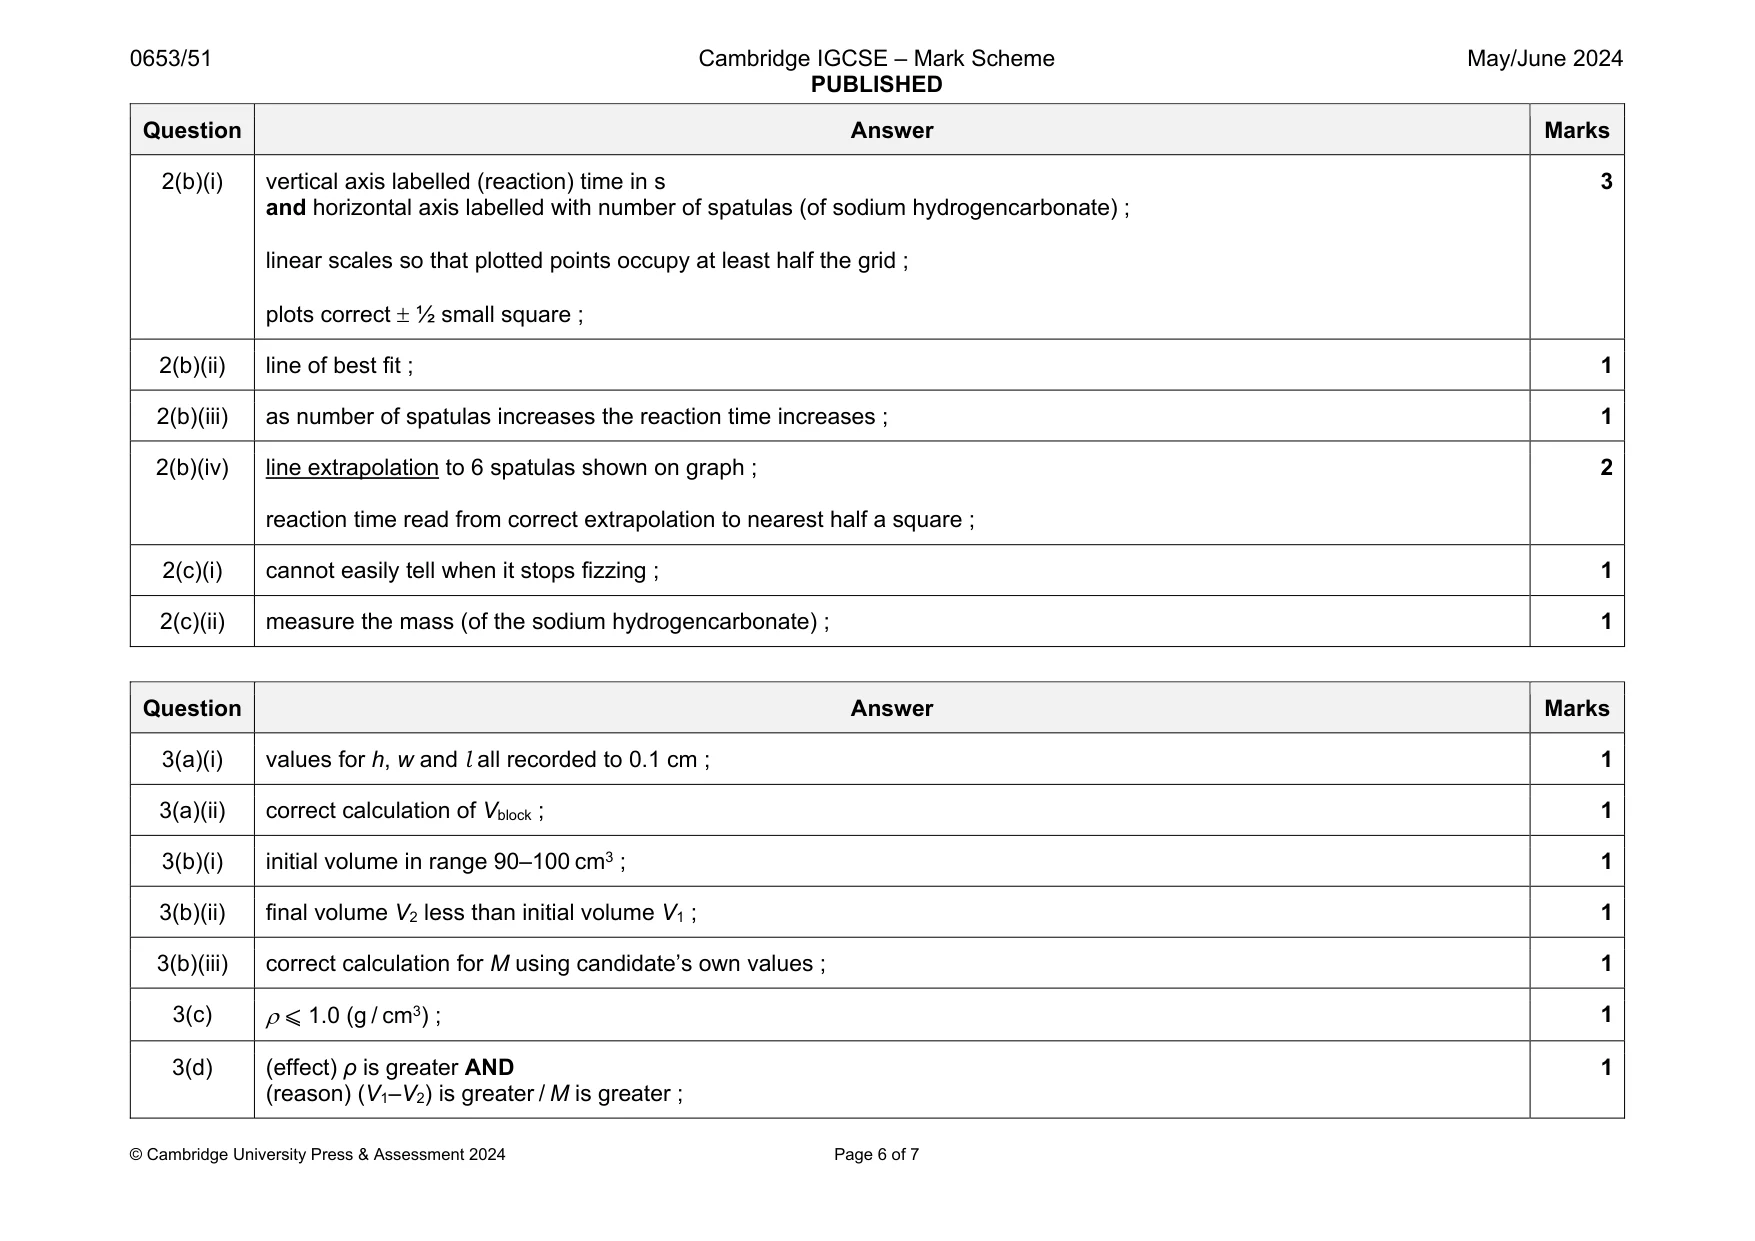
Mark scheme: 2(a) result for 1 spatula recorded ; results for all five spatulas recorded ; all recorded to nearest second ; time increases down the table ; 4 Question Answer Marks 2(b)(i) vertical axis labelled (reaction) time in s and horizontal axis labelled with number of spatulas (of sodium hydrogencarbonate) ; linear scales so that plotted points occupy at least half the grid ; plots correct ½ small square ; 3 2(b)(ii) line of best fit ; 1 2(b)(iii) as number of spatulas increases the reaction time increases ; 1 2(b)(iv) line extrapolation to 6 spatulas shown on graph ; reaction time read from correct extrapolation to nearest half a square ; 2 2(c)(i) cannot easily tell when it stops fizzing ; 1 2(c)(ii) measure the mass (of the sodium hydrogencarbonate) ; 1
Q3 · You are going to determine the density of a wooden block
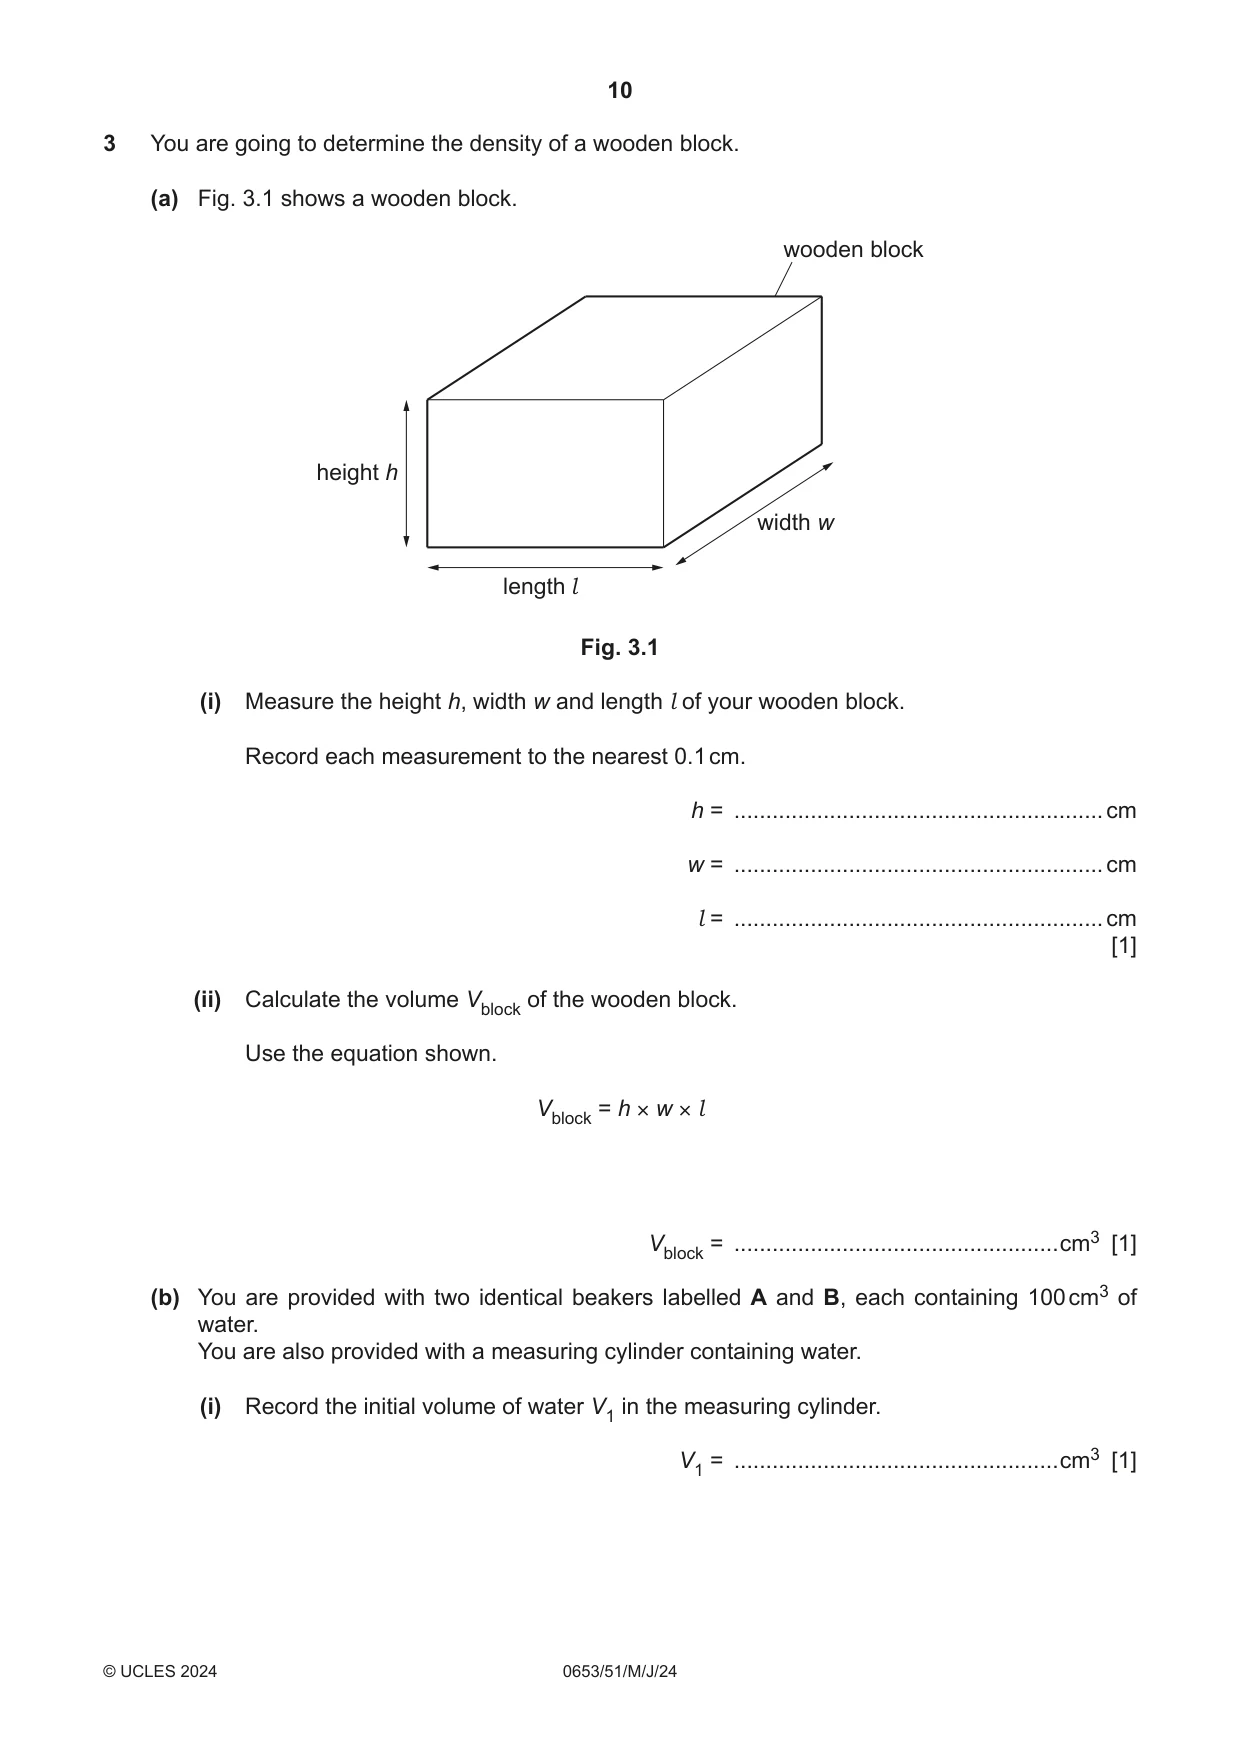
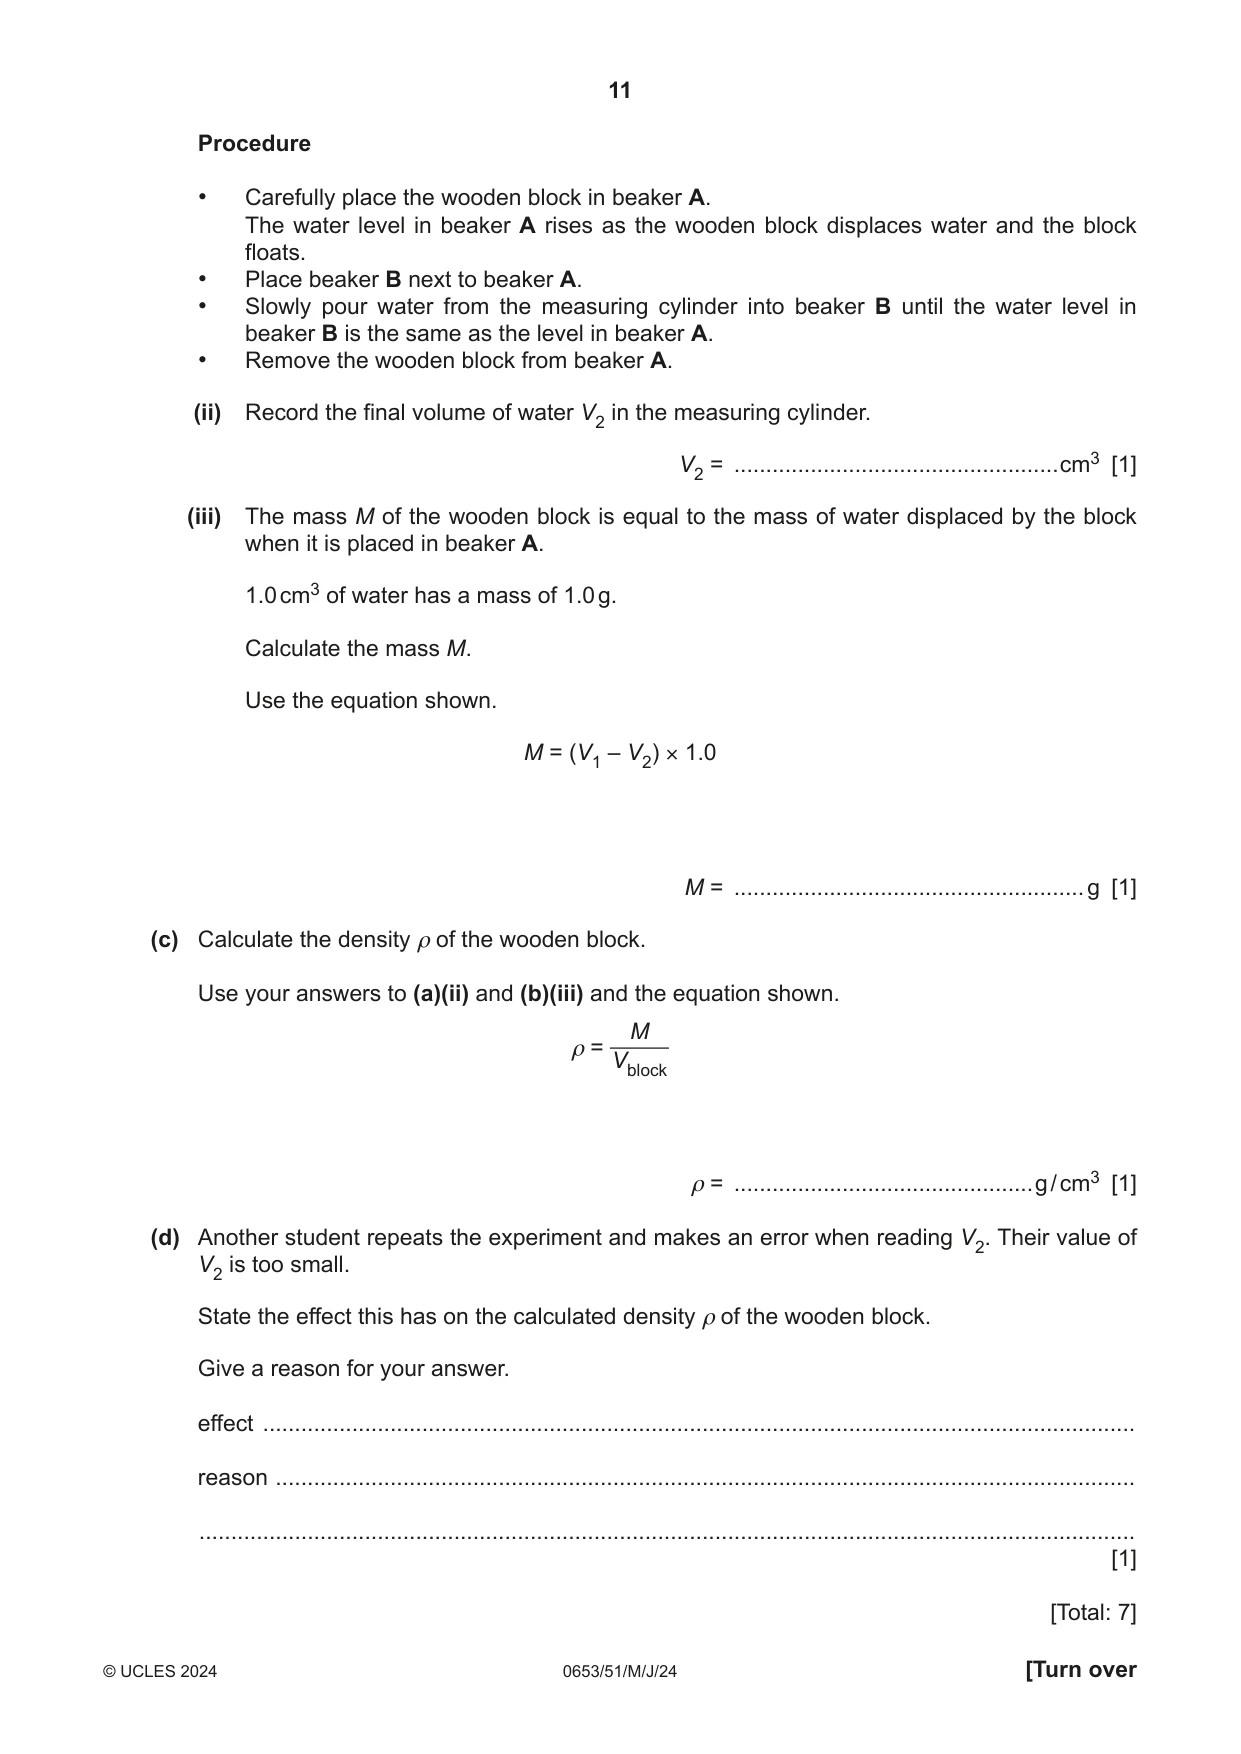
3 You are going to determine the density of a wooden block. (a) Fig. 3.1 shows a wooden block. wooden block height h width w length l Fig. 3.1 (i) Measure the height h, width w and length l of your wooden block. Record each measurement to the nearest 0.1 cm. h = ..........................................................cm w = ..........................................................cm l = ..........................................................cm [1] (ii) Calculate the volume Vblock of the wooden block. Use the equation shown. Vblock = h × w × l Vblock = ...................................................cm3 [1] (b) You are provided with two identical beakers labelled A and B, each containing 100 cm3 of water. You are also provided with a measuring cylinder containing water. (i) Record the initial volume of water V1 in the measuring cylinder. V1 = ...................................................cm3 [1] Procedure • Carefully place the wooden block in beaker A. The water level in beaker A rises as the wooden block displaces water and the block floats. • Place beaker B next to beaker A. • Slowly pour water from the measuring cylinder into beaker B until the water level in beaker B is the same as the level in beaker A. • Remove the wooden block from beaker A. (ii) Record the final volume of water V2 in the measuring cylinder. V2 = ...................................................cm3 [1] (iii) The mass M of the wooden block is equal to the mass of water displaced by the block when it is placed in beaker A. 1.0 cm3 of water has a mass of 1.0 g. Calculate the mass M. Use the equation shown. M = (V1 – V2) × 1.0 M = .......................................................g [1] (c) Calculate the density ρ of the wooden block. Use your answers to (a)(ii) and (b)(iii) and the equation shown. M ρ = Vblock ρ = ...............................................g / cm3 [1] (d) Another student repeats the experiment and makes an error when reading V2. Their value of V2 is too small. State the effect this has on the calculated density ρ of the wooden block. Give a reason for your answer. effect ......................................................................................................................................... reason ....................................................................................................................................... ................................................................................................................................................... [1] [Total: 7] 4 A thermistor is a type of variable resistor. A thermistor is used to measure changes in the temperature of water in a beaker. The resistance of the thermistor changes as the water temperature changes. The resistance R of the thermistor at temperature T is calculated using the equation: V R T = I where V is the potential difference across the thermistor and I is the current through the thermistor. Plan an investigation to find the relationship between the temperature of the water and the resistance of the thermistor. You are provided with: • a supply of hot and cold water • extra connecting wires (or leads) • the assembled apparatus shown in Fig. 4.1. switch power supply ammeter A thermistor glass beaker water Fig. 4.1 You may use any common laboratory apparatus in your plan. You are not required to do this investigation. In your plan, include: • a brief description of how you will use the assembled apparatus shown in Fig. 4.1 • any other apparatus needed • what you will measure and how you will make sure your measurements are accurate • a results table to record your measurements (you do not need to enter any readings in the table) • how you will process your results to draw a conclusion.
Mark scheme: 3(a)(i) 1 3(a)(ii) correct calculation of Vblock ; 1 3(b)(i) initial volume in range 90–100 cm3 ; 1 3(b)(ii) final volume V2 less than initial volume V1 ; 1 3(b)(iii) correct calculation for M using candidate’s own values ; 1 3(c) ⩽ 1.0 (g / cm3) ; 1 3(d) (effect) ρ is greater AND (reason) (V1–V2) is greater / M is greater ; 1
Q4 · A thermistor is a type of variable resistor
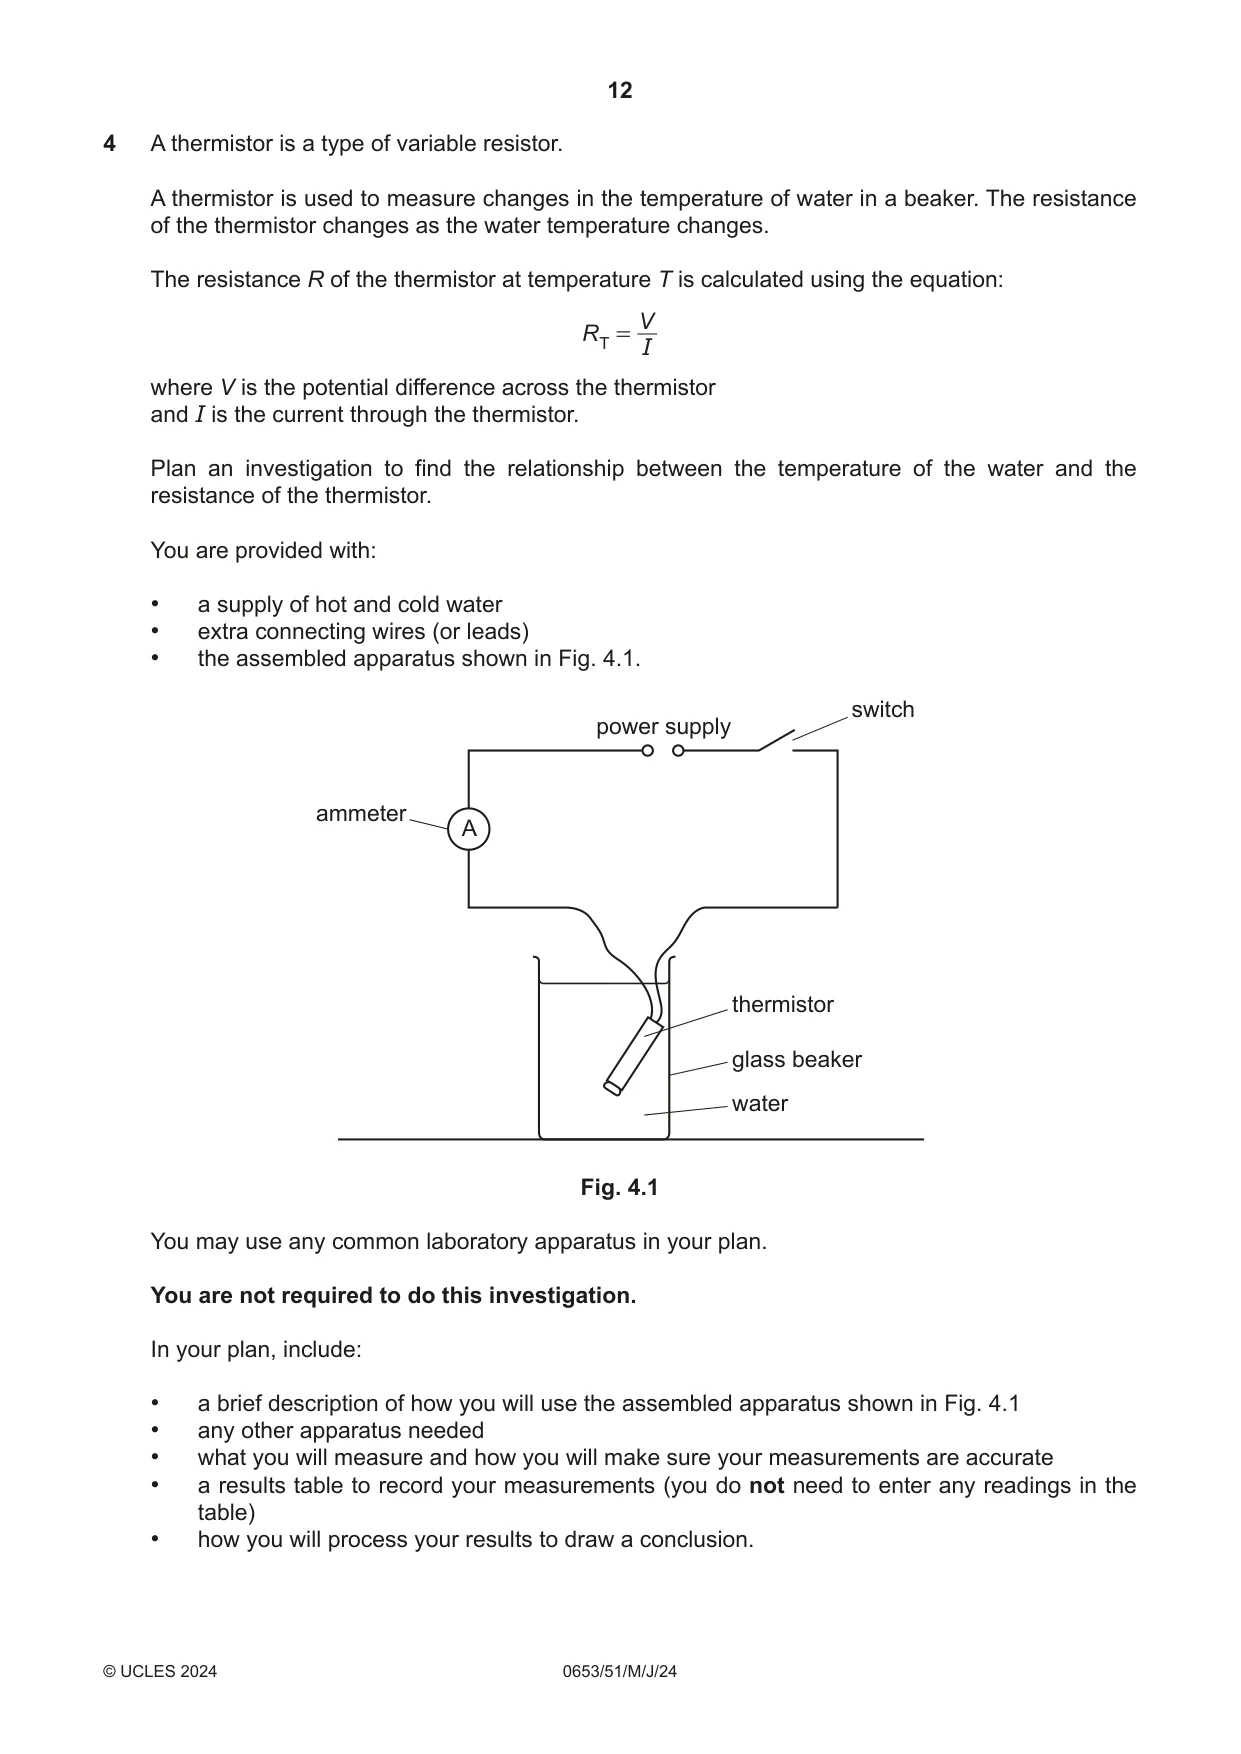
4 A thermistor is a type of variable resistor. A thermistor is used to measure changes in the temperature of water in a beaker. The resistance of the thermistor changes as the water temperature changes. The resistance R of the thermistor at temperature T is calculated using the equation: V R T = I where V is the potential difference across the thermistor and I is the current through the thermistor. Plan an investigation to find the relationship between the temperature of the water and the resistance of the thermistor. You are provided with: • a supply of hot and cold water • extra connecting wires (or leads) • the assembled apparatus shown in Fig. 4.1. switch power supply ammeter A thermistor glass beaker water Fig. 4.1 You may use any common laboratory apparatus in your plan. You are not required to do this investigation. In your plan, include: • a brief description of how you will use the assembled apparatus shown in Fig. 4.1 • any other apparatus needed • what you will measure and how you will make sure your measurements are accurate • a results table to record your measurements (you do not need to enter any readings in the table) • how you will process your results to draw a conclusion. .......................................................................................................................................................... .......................................................................................................................................................... .......................................................................................................................................................... .......................................................................................................................................................... .......................................................................................................................................................... .......................................................................................................................................................... .......................................................................................................................................................... .......................................................................................................................................................... .......................................................................................................................................................... .......................................................................................................................................................... .......................................................................................................................................................... .......................................................................................................................................................... ..........................................................................................................................................................
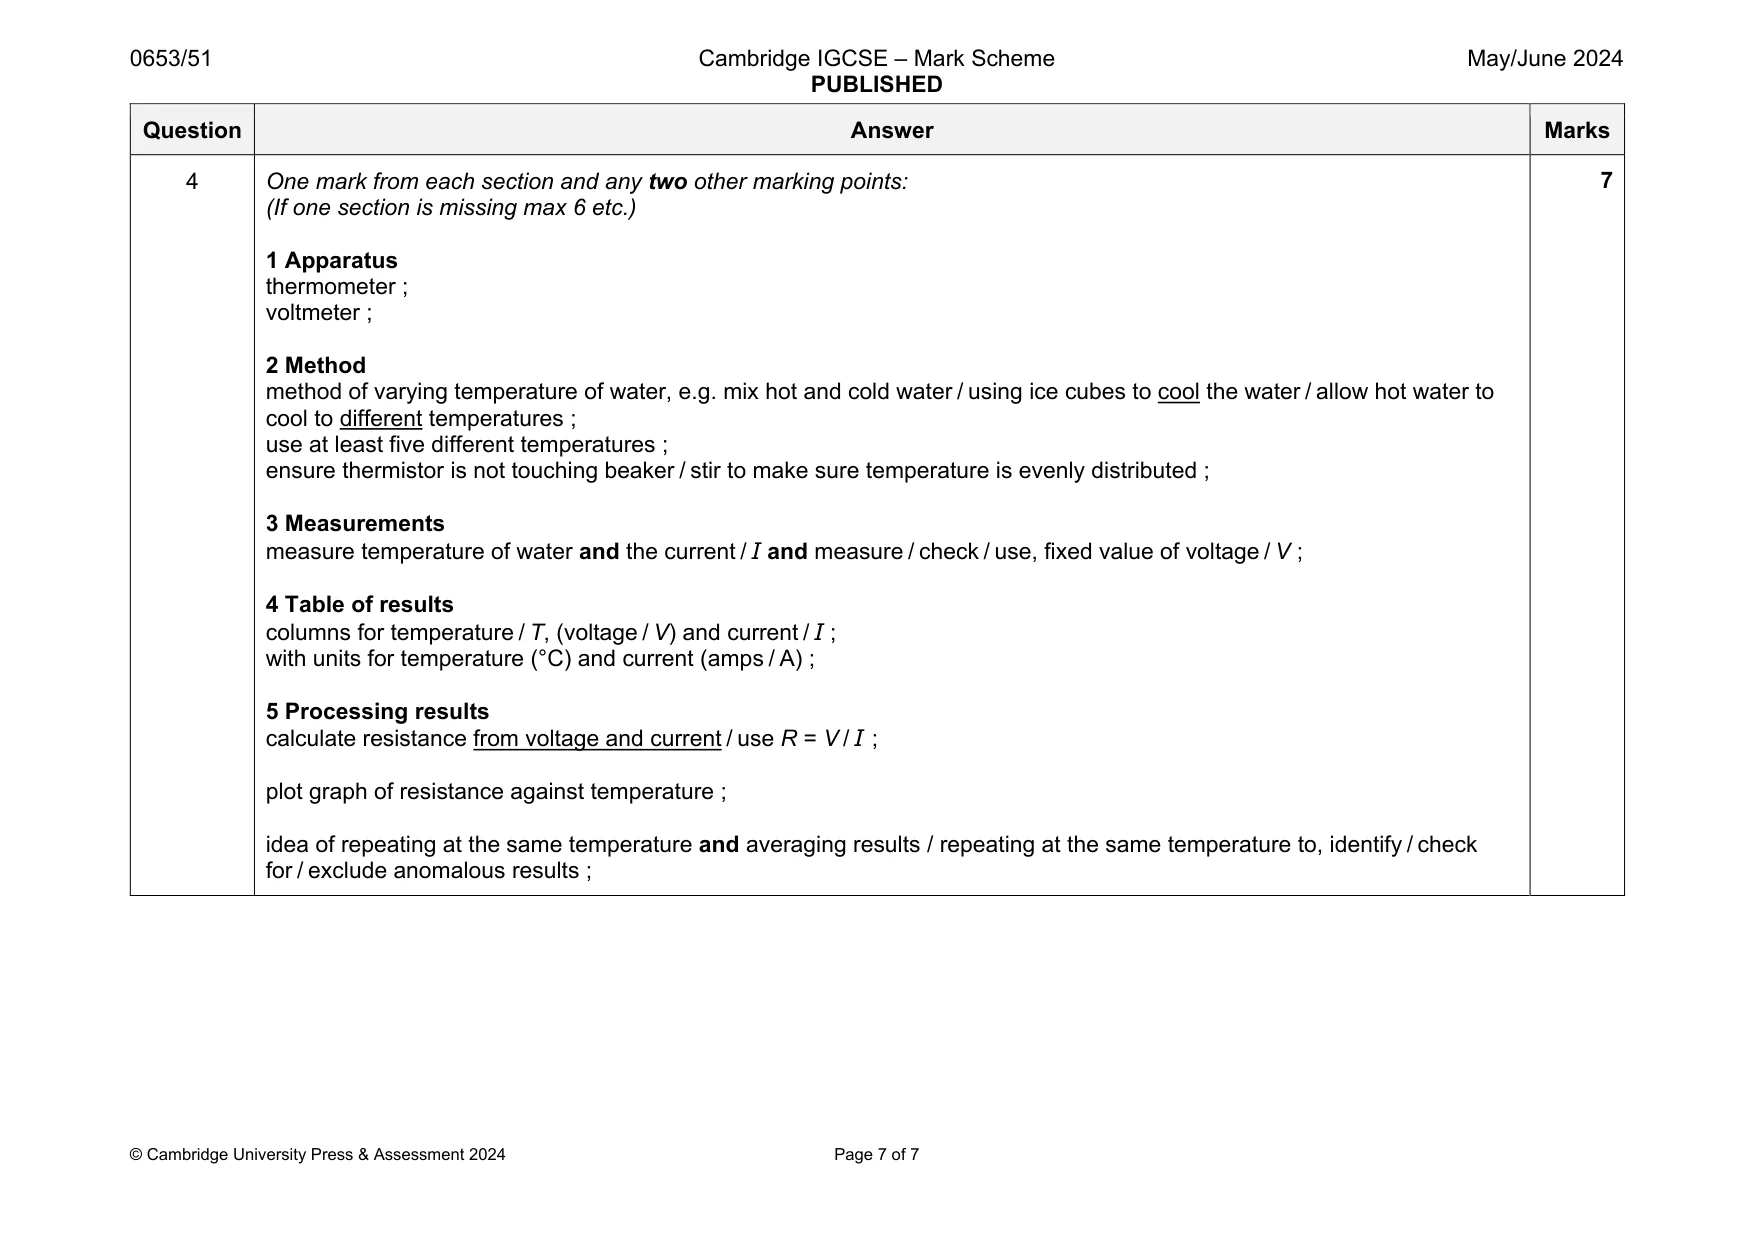
Mark scheme: 4 One mark from each section and any two other marking points: (If one section is missing max 6 etc.) 1 Apparatus thermometer ; voltmeter ; 2 Method method of varying temperature of water, e.g. mix hot and cold water / using ice cubes to cool the water / allow hot water to cool to different temperatures ; use at least five different temperatures ; ensure thermistor is not touching beaker / stir to make sure temperature is evenly distributed ; 3 Measurements measure temperature of water and the current / I and measure / check / use, fixed value of voltage / V ; 4 Table of results columns for temperature / T, (voltage / V) and current / I ; with units for temperature (°C) and current (amps / A) ; 5 Processing results calculate resistance from voltage and current / use R = V / I ; plot graph of resistance against temperature ; idea of repeating at the same temperature and averaging results / repeating at the same temperature to, identify / check for / exclude anomalous results ;
What was in this paper
The subtopics covered by these 4 questions, and how many questions each got. Open one in a new tab to see every Cambridge question on it.
What you needed in this session
Cambridge’s own grade thresholds for 2024 May/June, Paper 5 · Variant 1. A higher threshold means an easier paper — the bar moves with how the cohort did.