Cambridge IGCSE Science - Combined 0653 — 2018 Oct/Nov Paper 6 · Variant 2
0653/62/O/N/18 · 6 questions · 60 marks · ≈68 min
The question paper and its mark scheme, free to read here and free to download. This is Cambridge’s own paper, exactly as it was sat.
Question paper20 pages


Mark scheme9 pages
Answers below. Sit the paper first if you are practising.
Questions as text
Q1 · A student investigates the nutrient content of three solutions, A, B and C
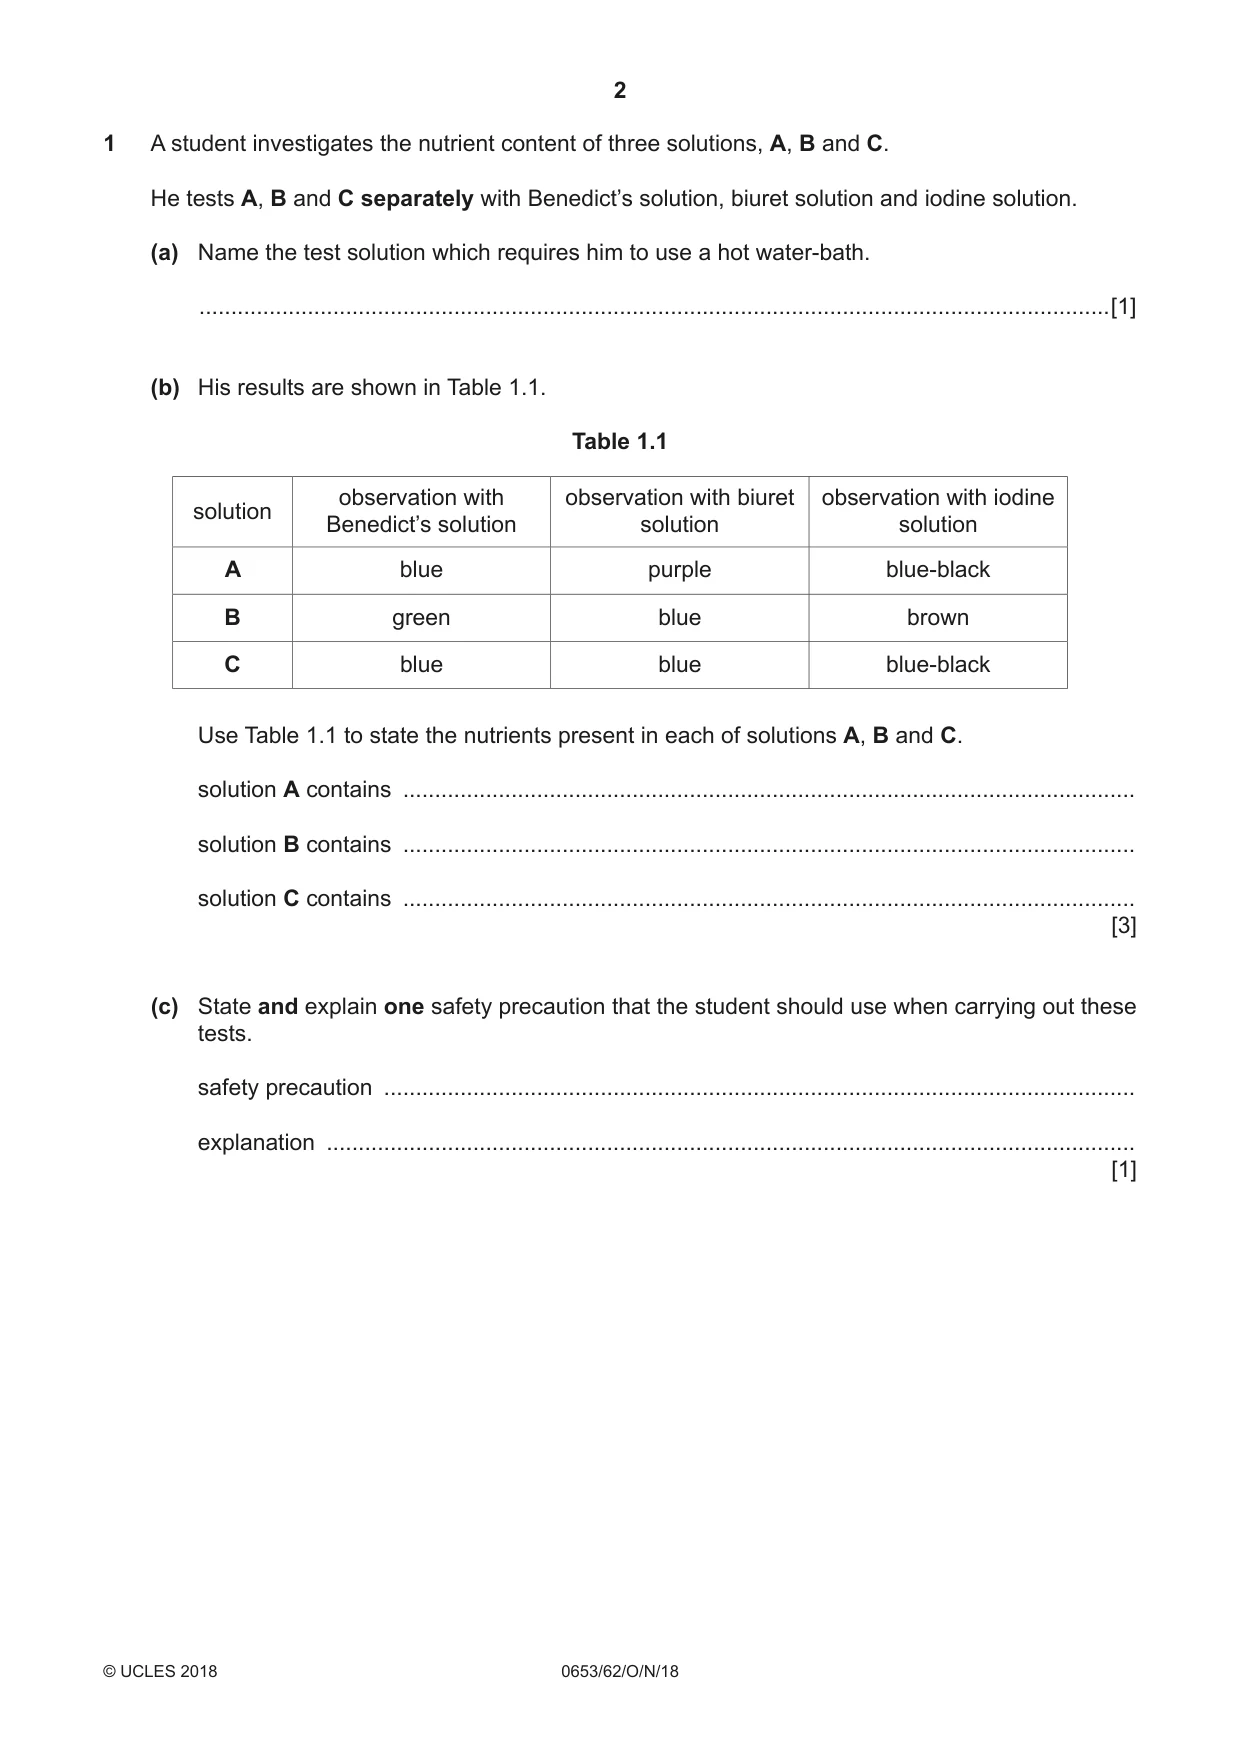
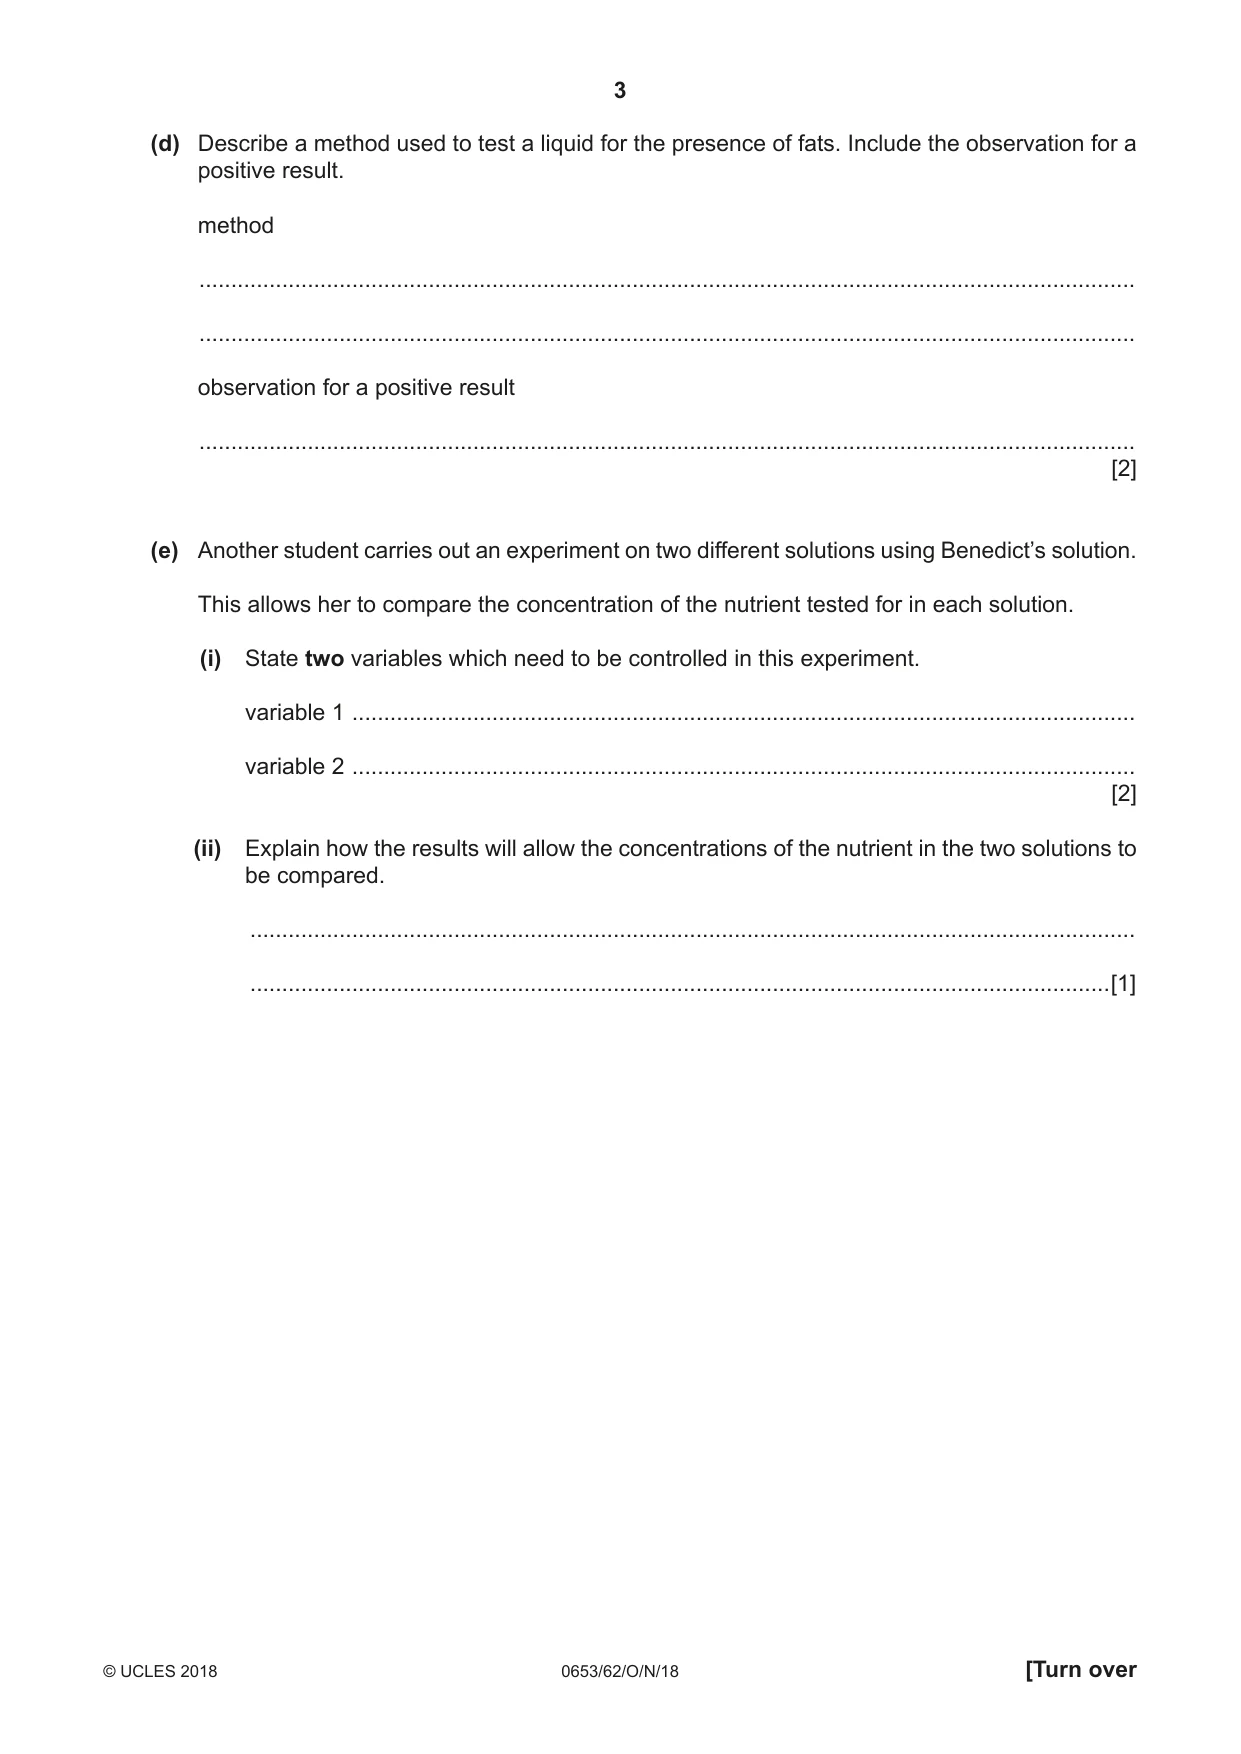
1 A student investigates the nutrient content of three solutions, A, B and C. He tests A, B and C separately with Benedict’s solution, biuret solution and iodine solution. (a) Name the test solution which requires him to use a hot water-bath. ...............................................................................................................................................[1] (b) His results are shown in Table 1.1. Table 1.1 observation with observation with biuret observation with iodine solution Benedict’s solution solution solution A blue purple blue-black B green blue brown C blue blue blue-black Use Table 1.1 to state the nutrients present in each of solutions A, B and C. solution A contains ................................................................................................................... solution B contains ................................................................................................................... solution C contains ................................................................................................................... [3] (c) State and explain one safety precaution that the student should use when carrying out these tests. safety precaution ...................................................................................................................... explanation ............................................................................................................................... [1] (d) Describe a method used to test a liquid for the presence of fats. Include the observation for a positive result. method ................................................................................................................................................... ................................................................................................................................................... observation for a positive result ................................................................................................................................................... [2] (e) Another student carries out an experiment on two different solutions using Benedict’s solution. This allows her to compare the concentration of the nutrient tested for in each solution. (i) State two variables which need to be controlled in this experiment. variable 1 ........................................................................................................................... variable 2 ........................................................................................................................... [2] (ii) Explain how the results will allow the concentrations of the nutrient in the two solutions to be compared. ........................................................................................................................................... .......................................................................................................................................[1]
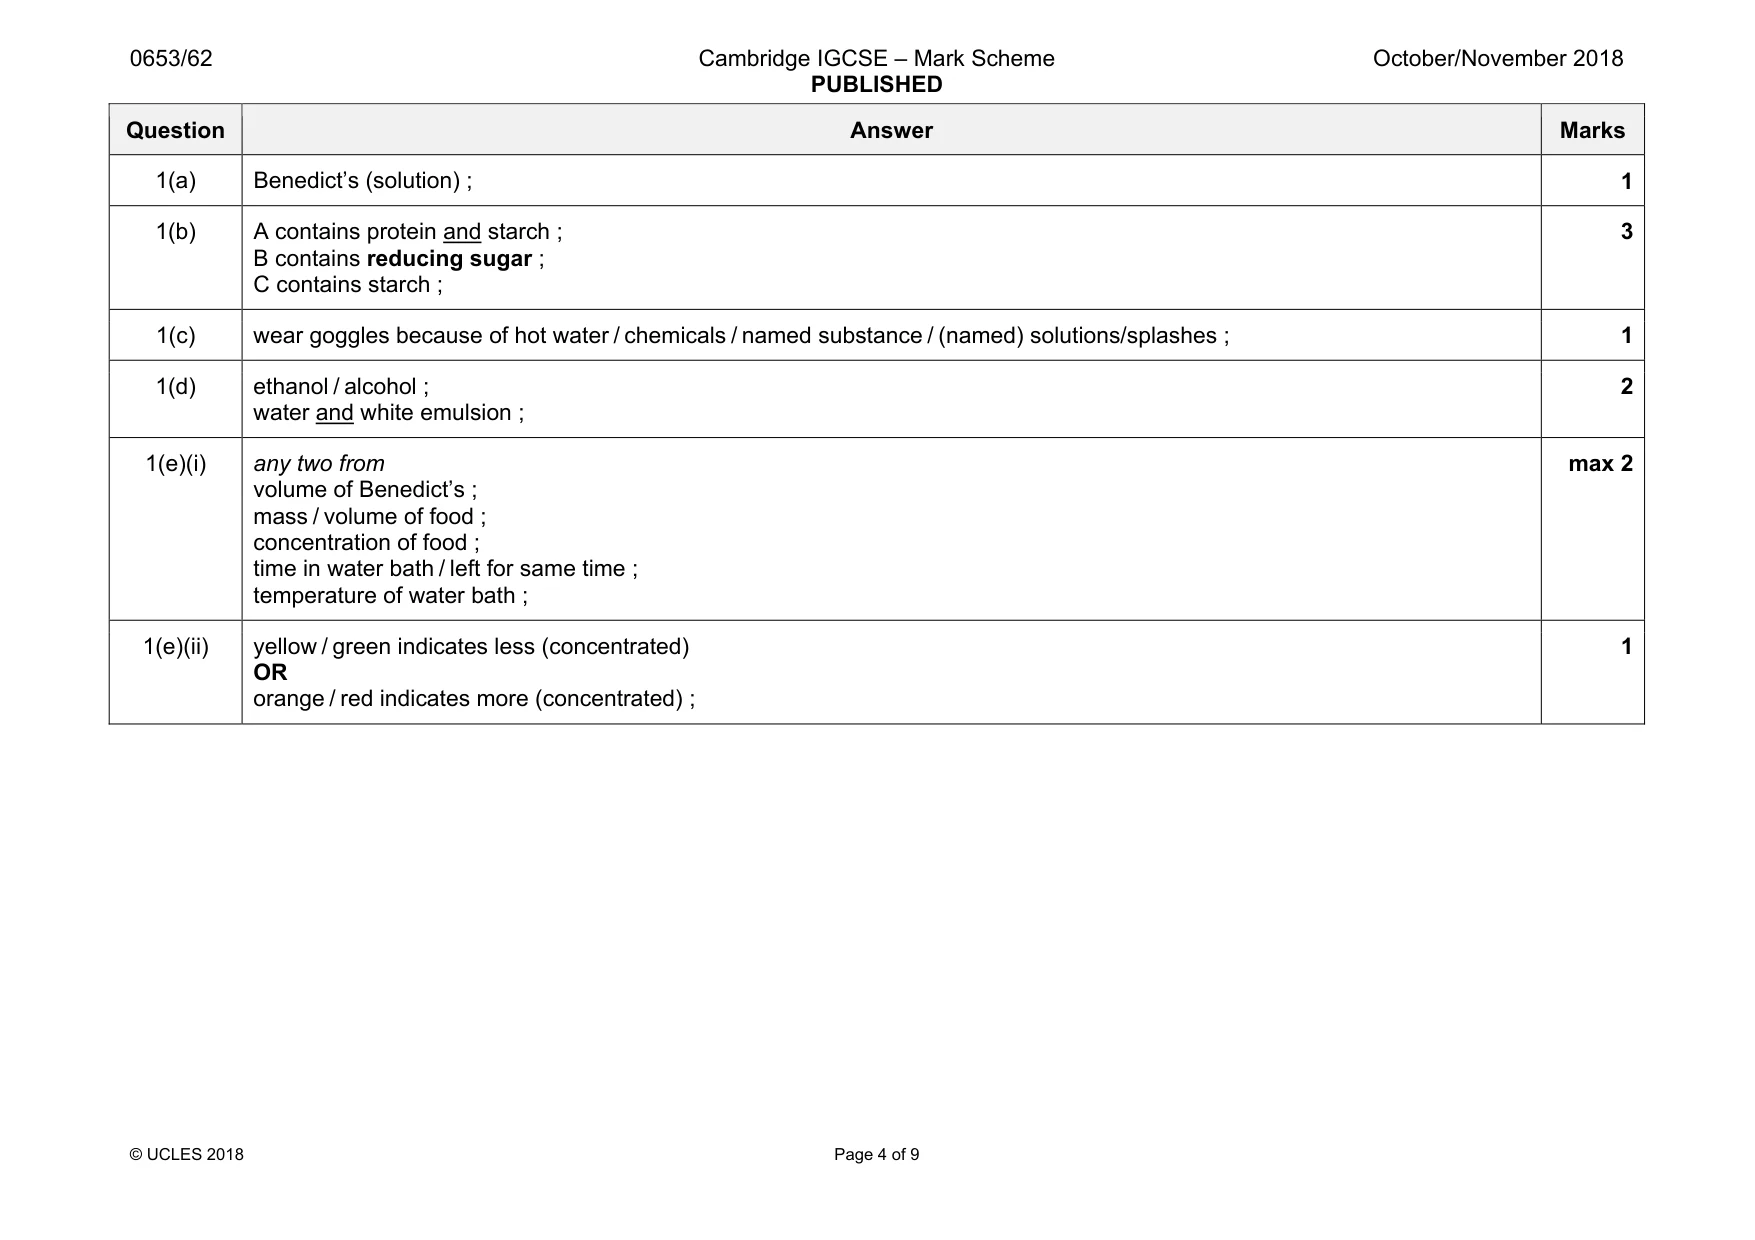
Mark scheme: 1(a) Benedict’s (solution) ; 1 1(b) A contains protein and starch ; B contains reducing sugar ; C contains starch ; 3 1(c) wear goggles because of hot water / chemicals / named substance / (named) solutions/splashes ; 1 1(d) ethanol / alcohol ; water and white emulsion ; 2 1(e)(i) any two from volume of Benedict’s ; mass / volume of food ; concentration of food ; time in water bath / left for same time ; temperature of water bath ; max 2 1(e)(ii) yellow / green indicates less (concentrated) OR orange / red indicates more (concentrated) ; 1
Q2 · A student investigates the thermal decomposition of metal carbonates
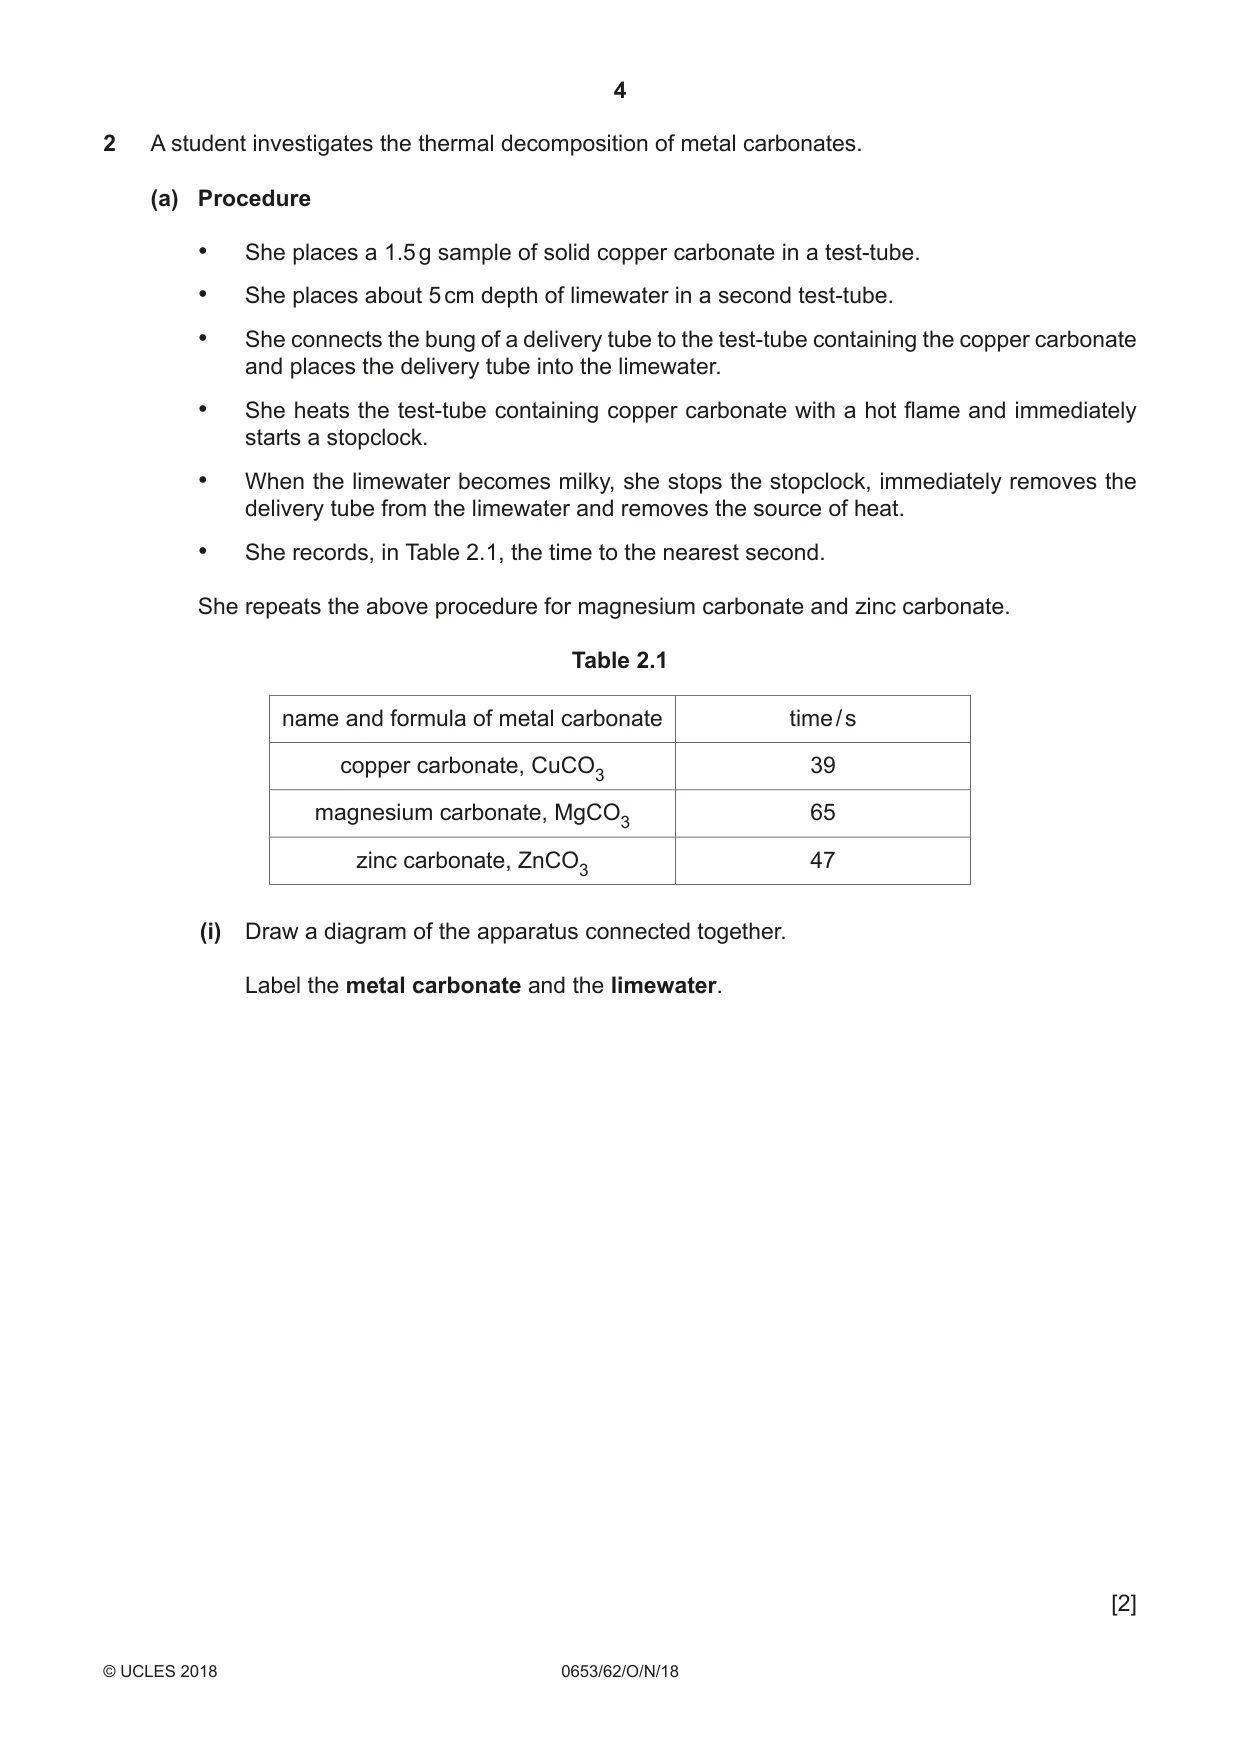
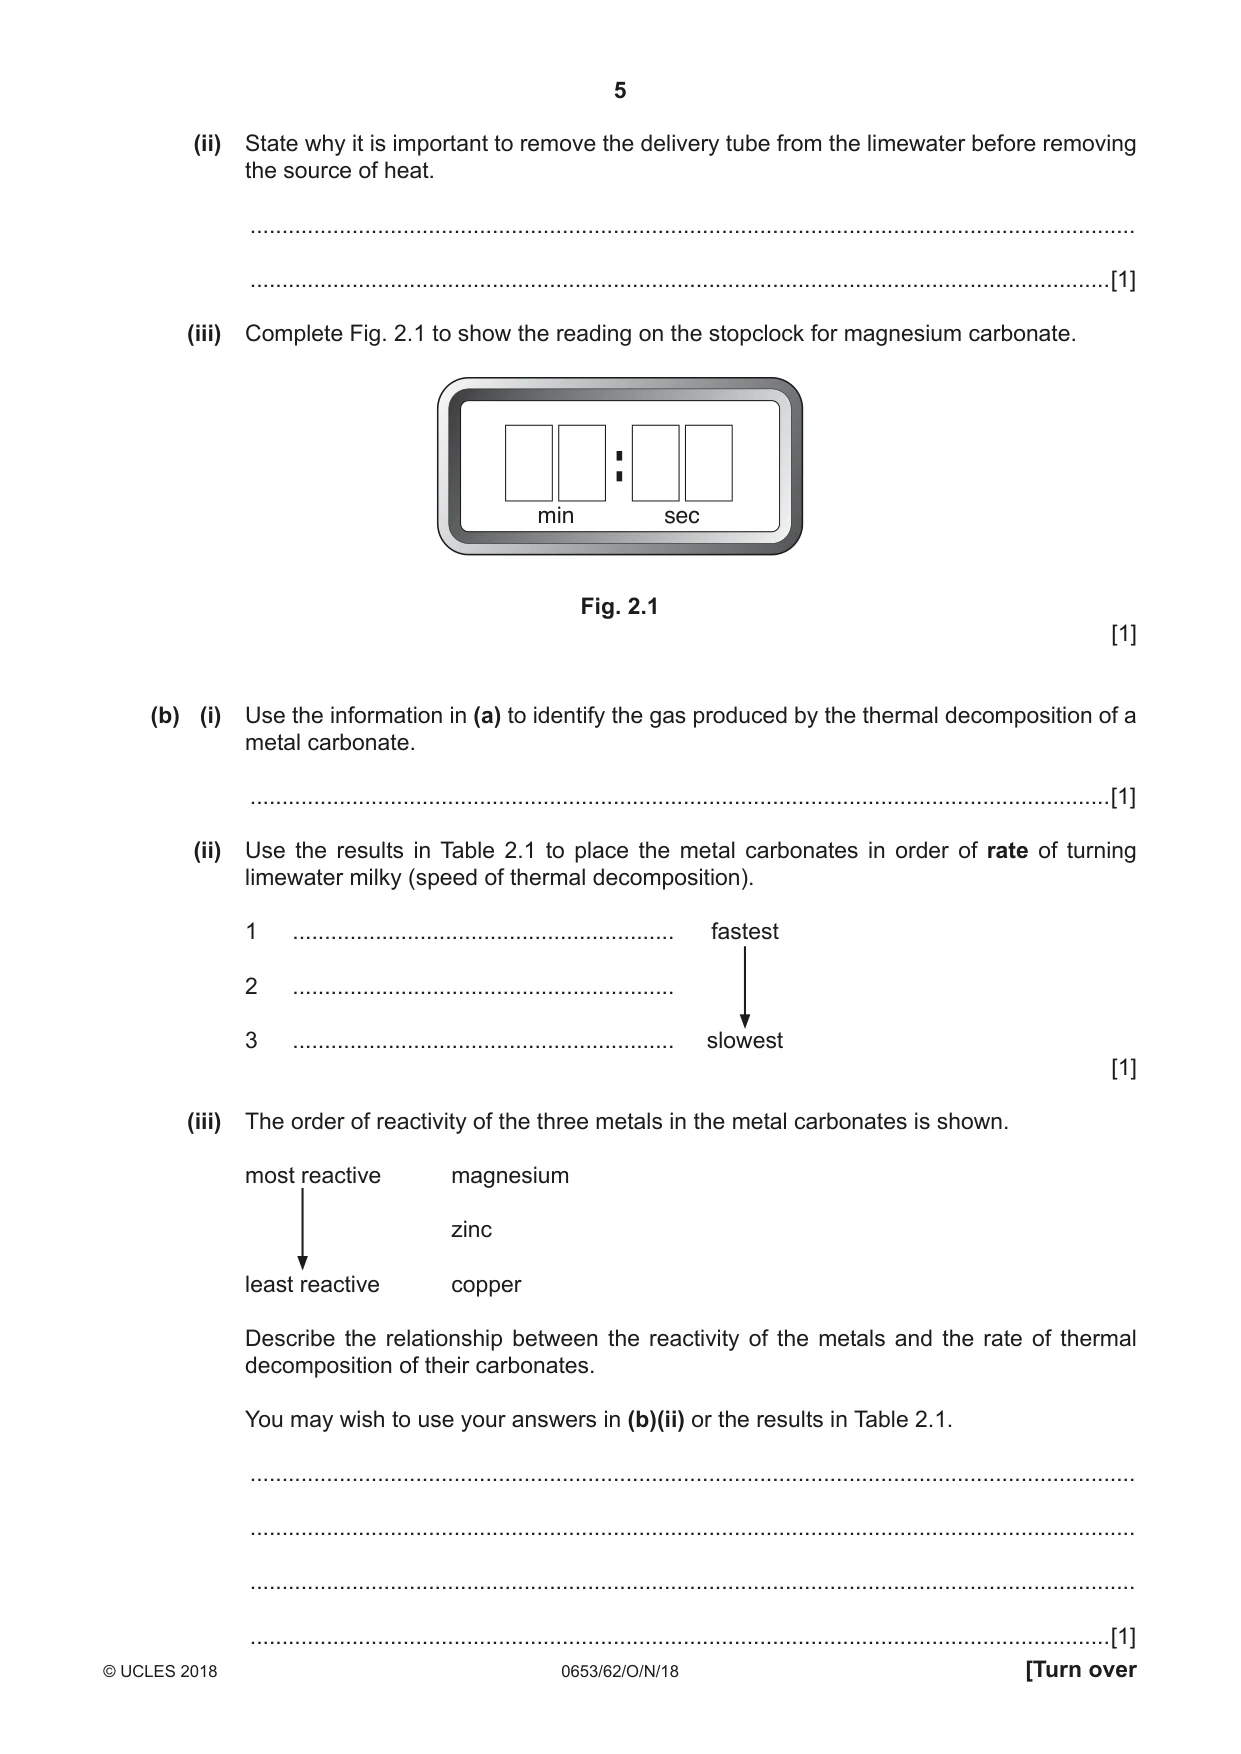
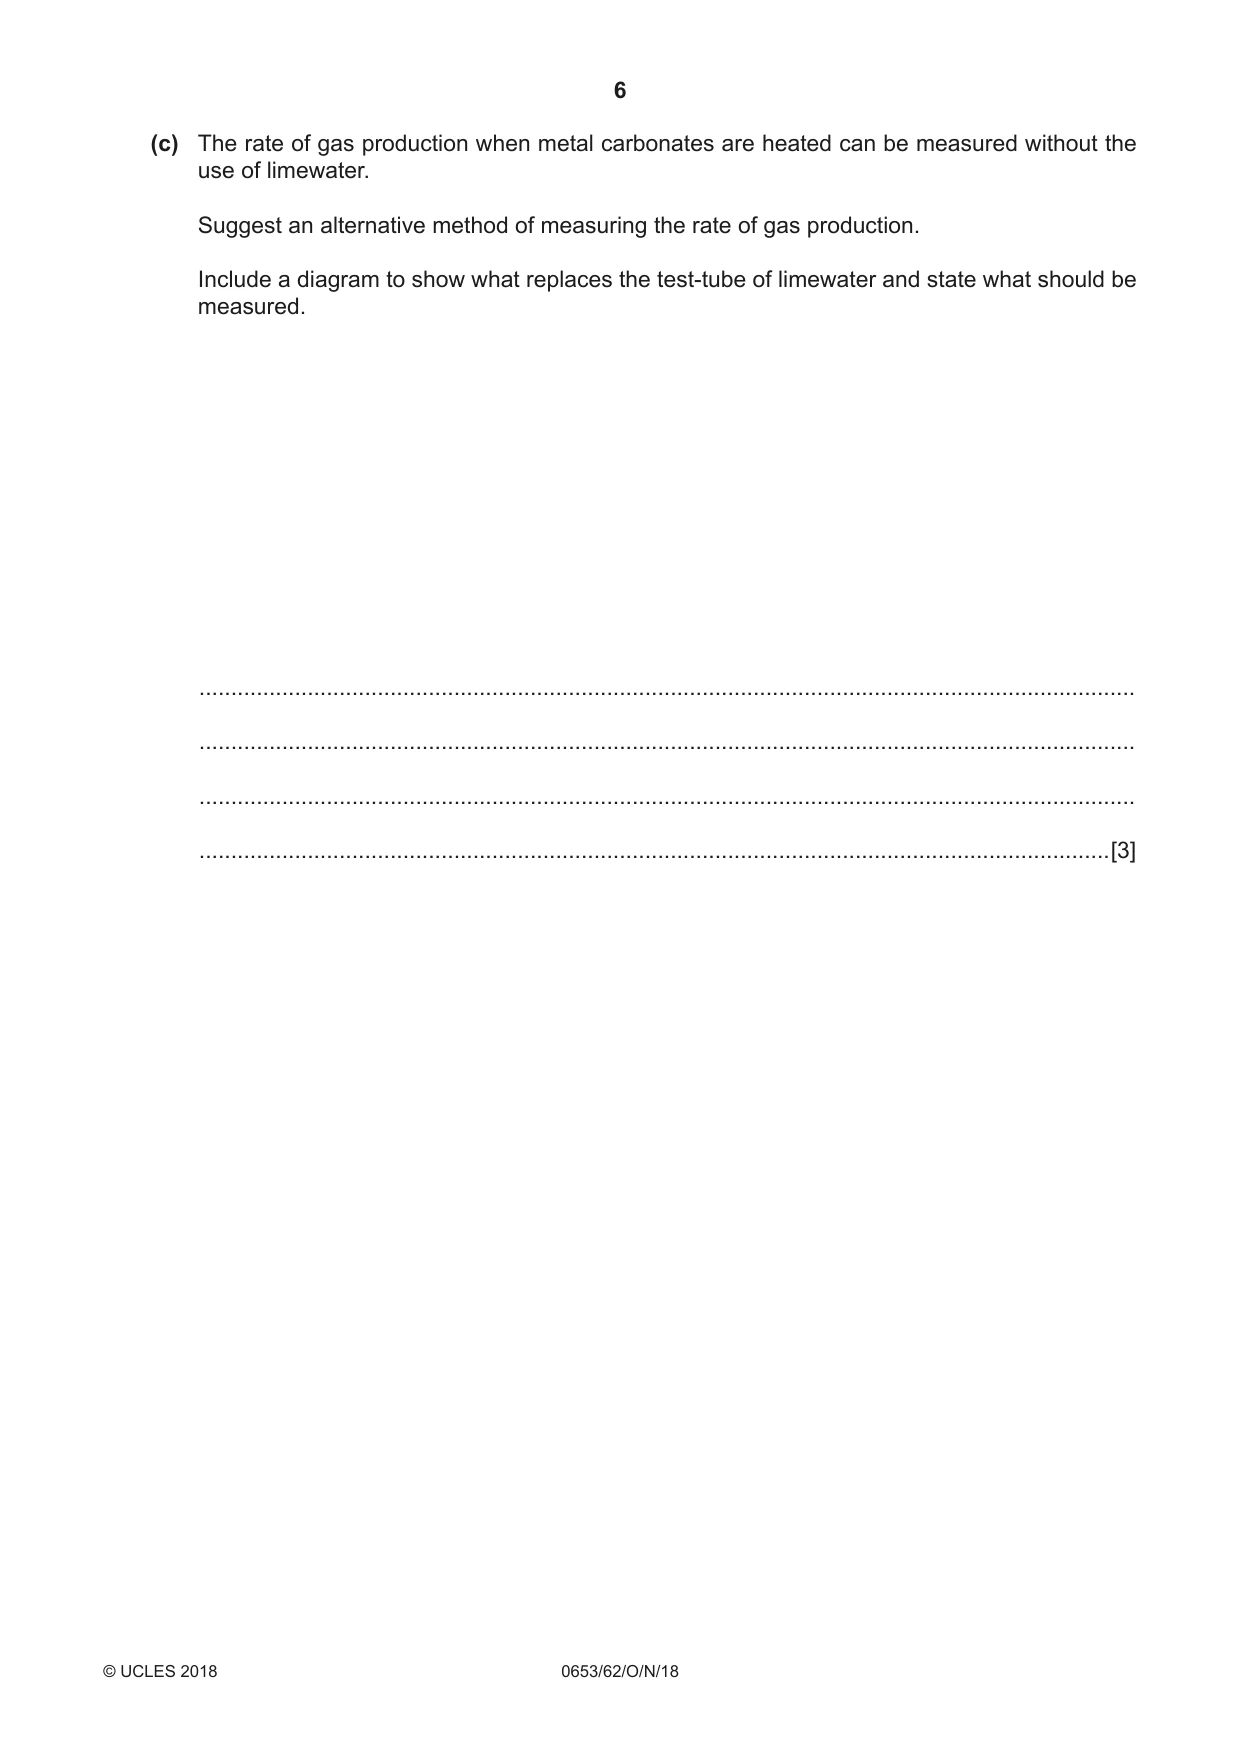
2 A student investigates the thermal decomposition of metal carbonates. (a) Procedure • She places a 1.5 g sample of solid copper carbonate in a test-tube. • She places about 5 cm depth of limewater in a second test-tube. • She connects the bung of a delivery tube to the test-tube containing the copper carbonate and places the delivery tube into the limewater. • She heats the test-tube containing copper carbonate with a hot flame and immediately starts a stopclock. • When the limewater becomes milky, she stops the stopclock, immediately removes the delivery tube from the limewater and removes the source of heat. • She records, in Table 2.1, the time to the nearest second. She repeats the above procedure for magnesium carbonate and zinc carbonate. Table 2.1 name and formula of metal carbonate time / s copper carbonate, CuCO3 39 magnesium carbonate, MgCO3 65 zinc carbonate, ZnCO3 47 (i) Draw a diagram of the apparatus connected together. Label the metal carbonate and the limewater. [2] (ii) State why it is important to remove the delivery tube from the limewater before removing the source of heat. ........................................................................................................................................... .......................................................................................................................................[1] (iii) Complete Fig. 2.1 to show the reading on the stopclock for magnesium carbonate. min sec Fig. 2.1 [1] (b) (i) Use the information in (a) to identify the gas produced by the thermal decomposition of a metal carbonate. .......................................................................................................................................[1] (ii) Use the results in Table 2.1 to place the metal carbonates in order of rate of turning limewater milky (speed of thermal decomposition). 1 ............................................................ fastest 2 ............................................................ 3 ............................................................ slowest [1] (iii) The order of reactivity of the three metals in the metal carbonates is shown. most reactive magnesium zinc least reactive copper Describe the relationship between the reactivity of the metals and the rate of thermal decomposition of their carbonates. You may wish to use your answers in (b)(ii) or the results in Table 2.1. ........................................................................................................................................... ........................................................................................................................................... ........................................................................................................................................... .......................................................................................................................................[1] (c) The rate of gas production when metal carbonates are heated can be measured without the use of limewater. Suggest an alternative method of measuring the rate of gas production. Include a diagram to show what replaces the test-tube of limewater and state what should be measured. ................................................................................................................................................... ................................................................................................................................................... ................................................................................................................................................... ...............................................................................................................................................[3]
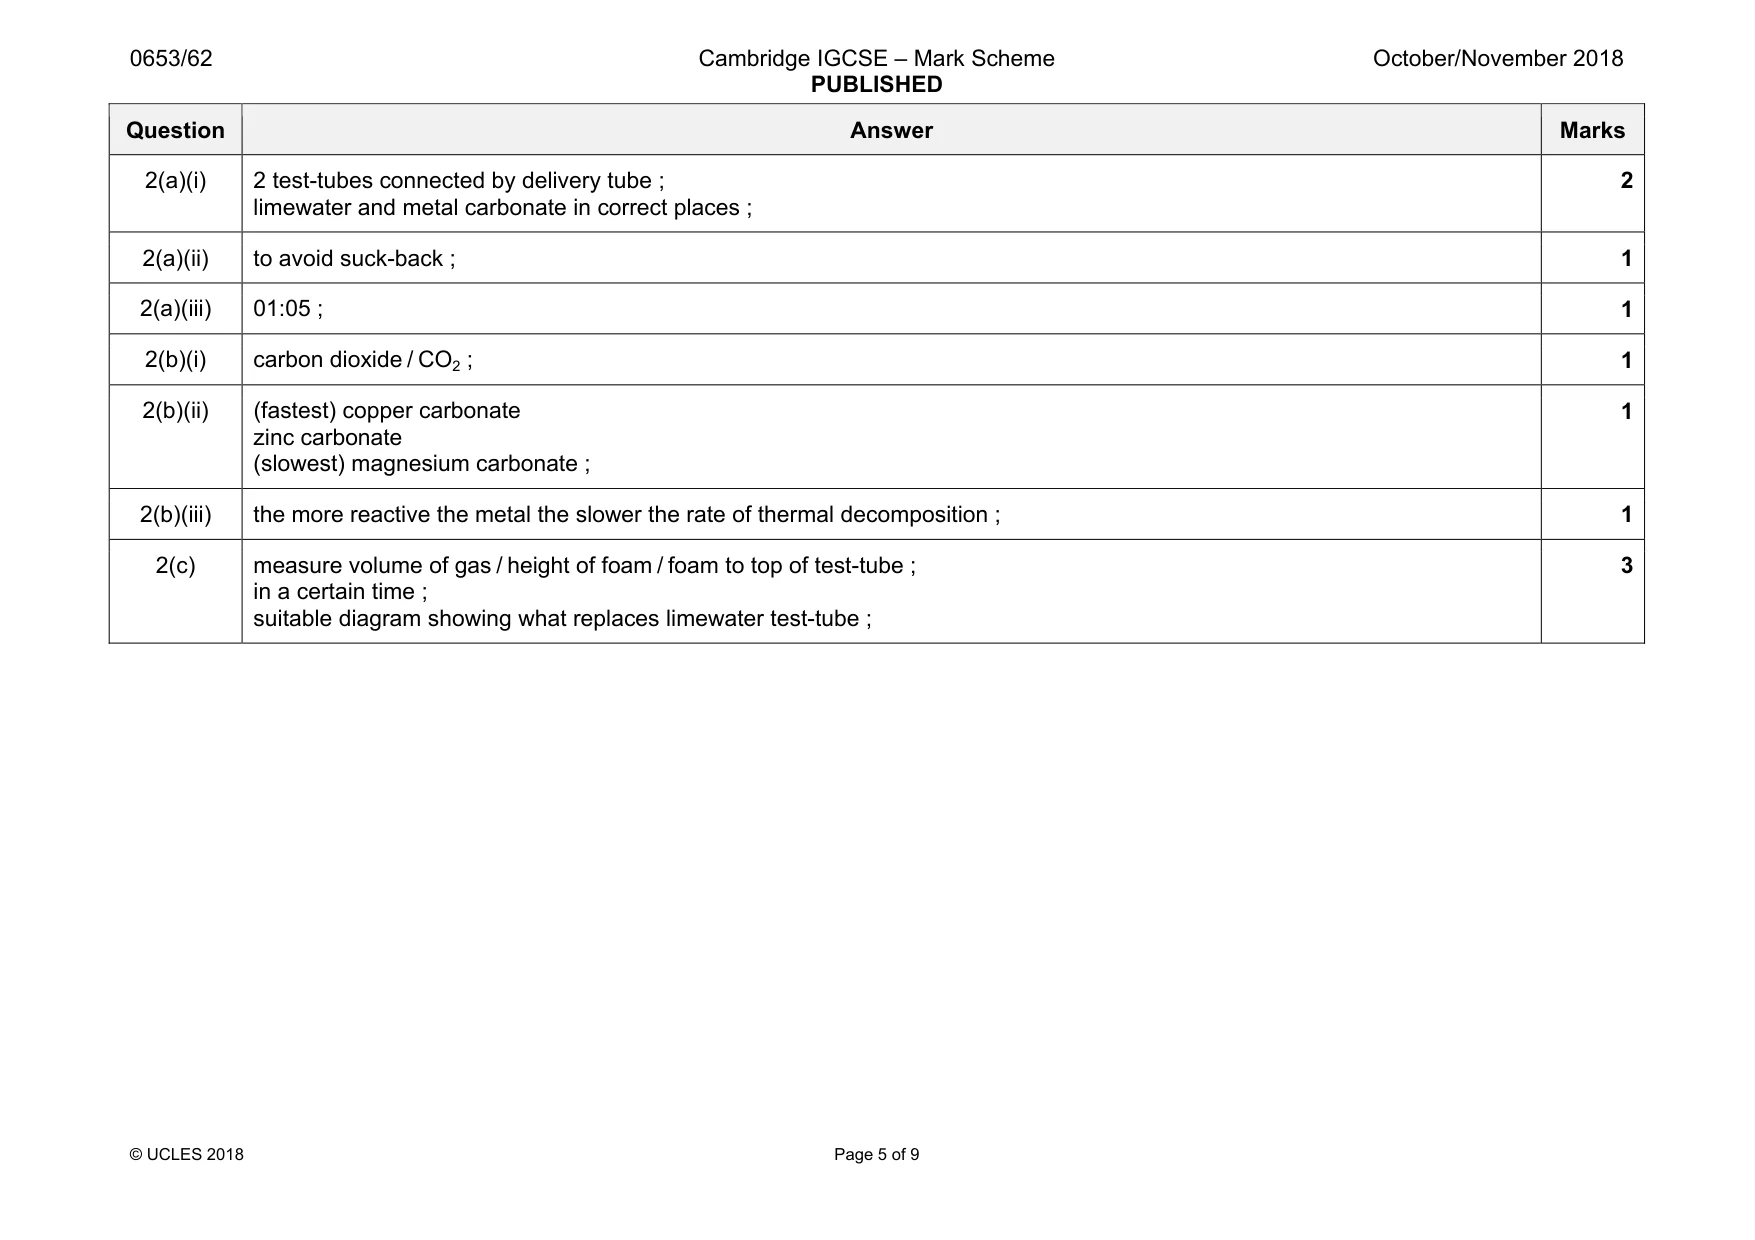
Mark scheme: 2(a)(i) 2 test-tubes connected by delivery tube ; limewater and metal carbonate in correct places ; 2 2(a)(ii) to avoid suck-back ; 1 2(a)(iii) 01:05 ; 1 2(b)(i) carbon dioxide / CO2 ; 1 2(b)(ii) (fastest) copper carbonate zinc carbonate (slowest) magnesium carbonate ; 1 2(b)(iii) the more reactive the metal the slower the rate of thermal decomposition ; 1 2(c) measure volume of gas / height of foam / foam to top of test-tube ; in a certain time ; suitable diagram showing what replaces limewater test-tube ; 3
Q3 · A student investigates how the power produced in a resistance wire XY depends upon its…
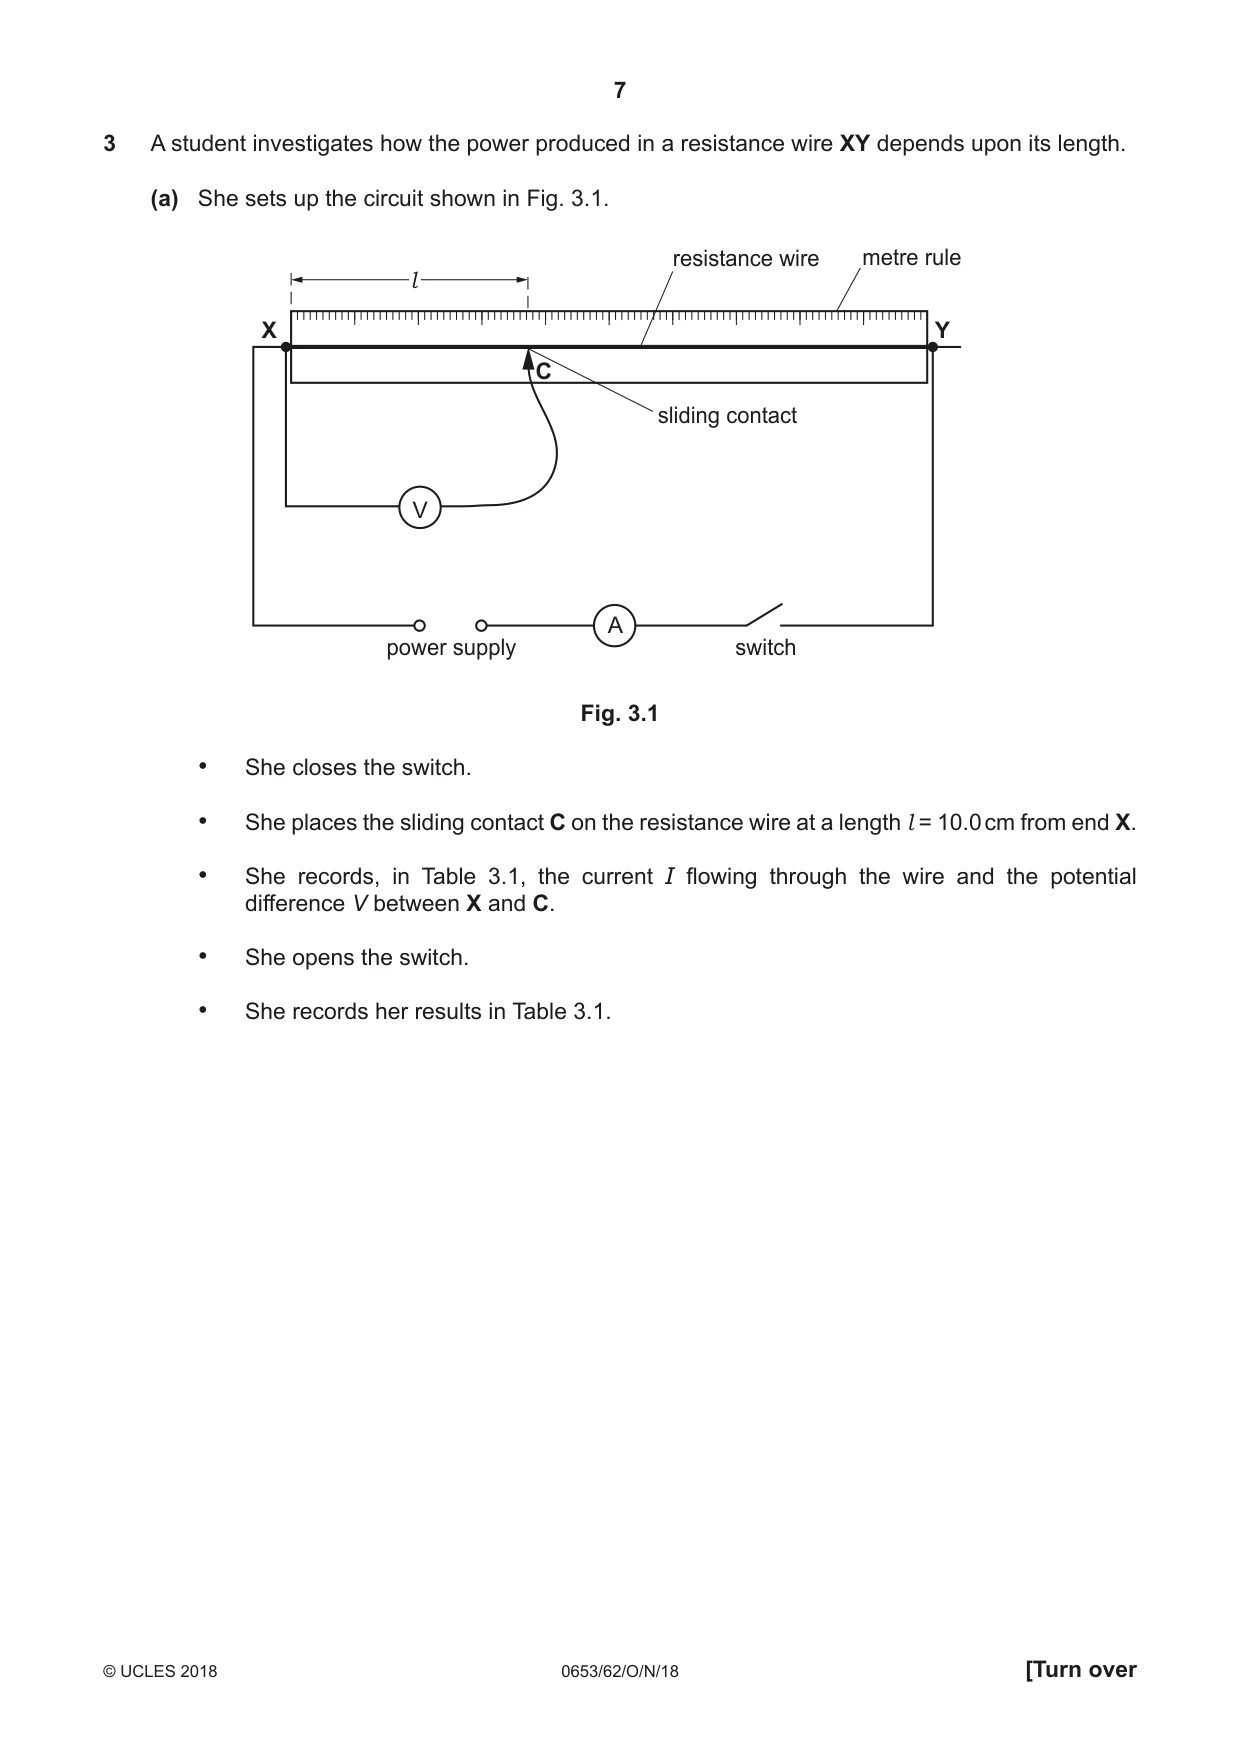
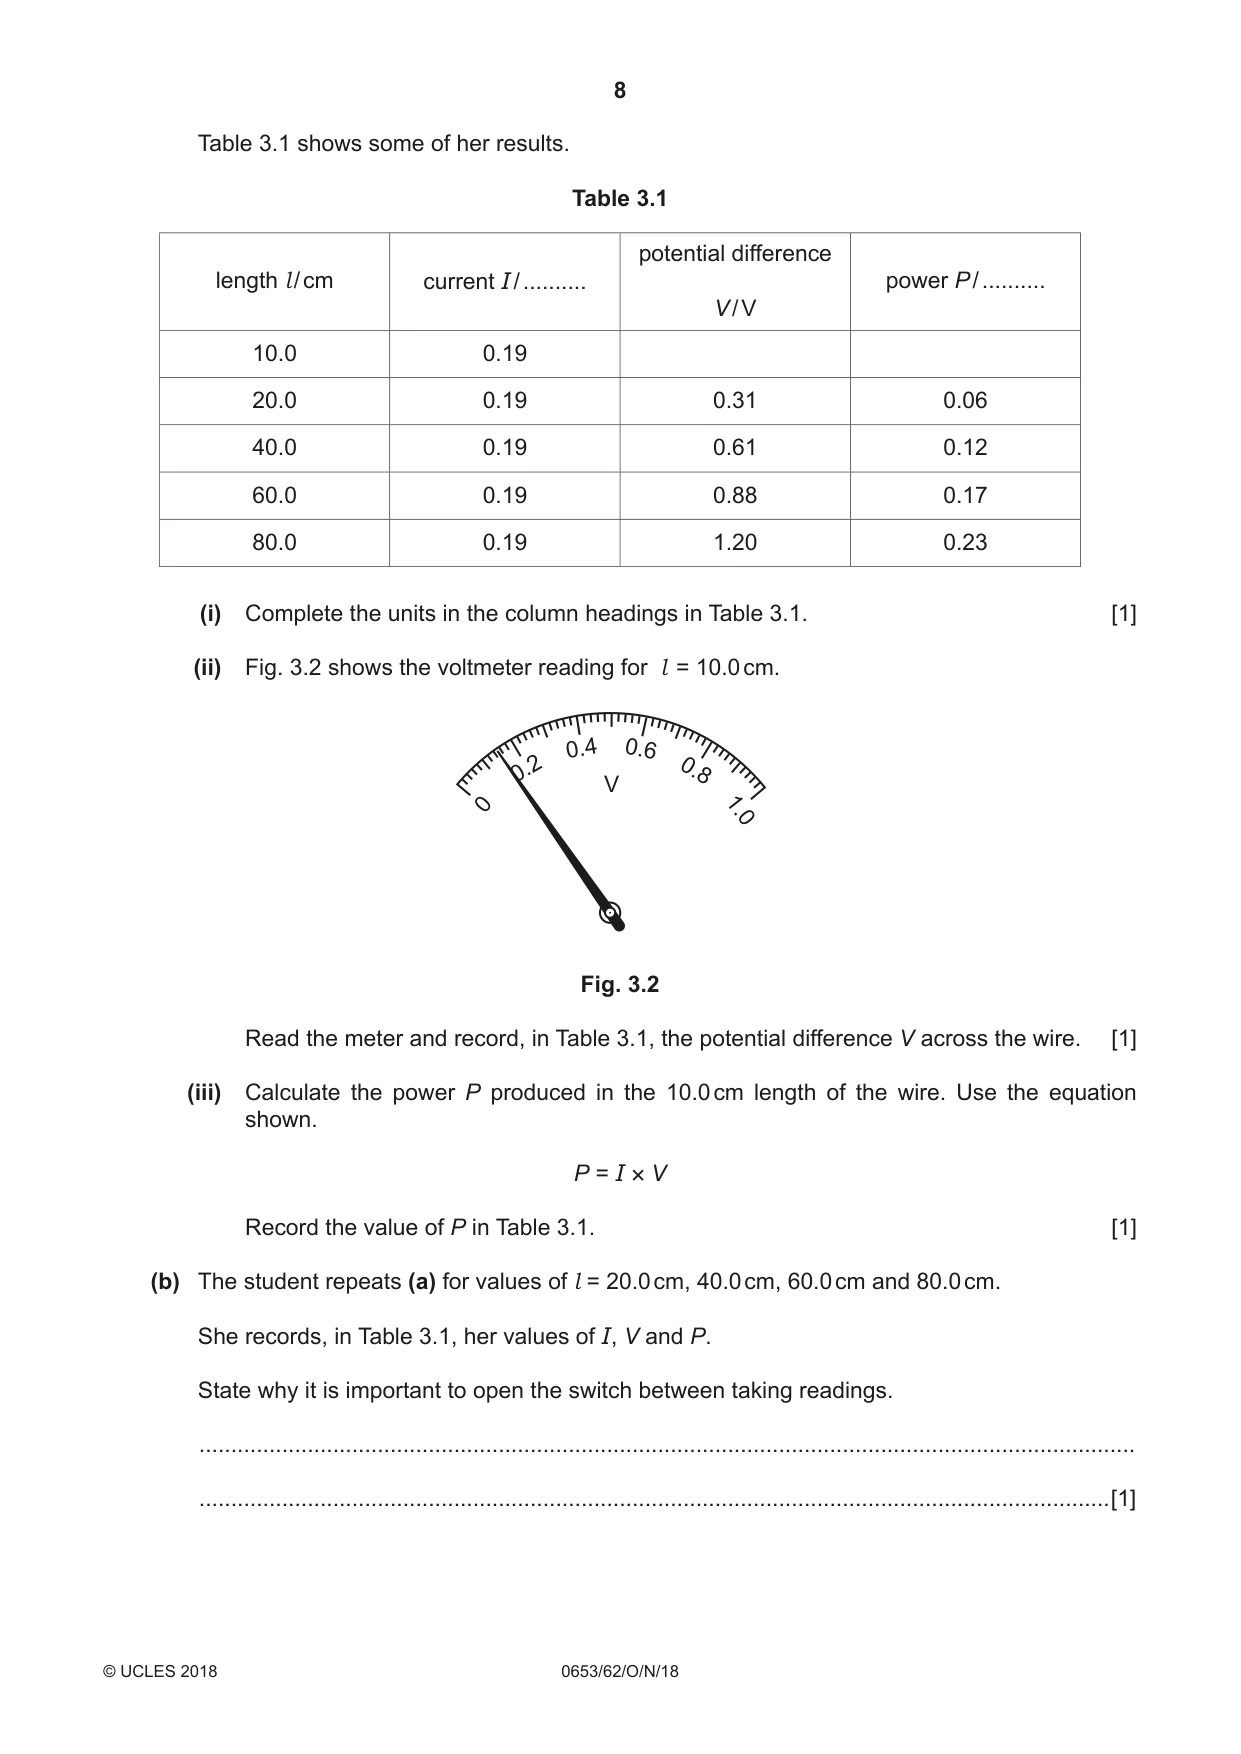
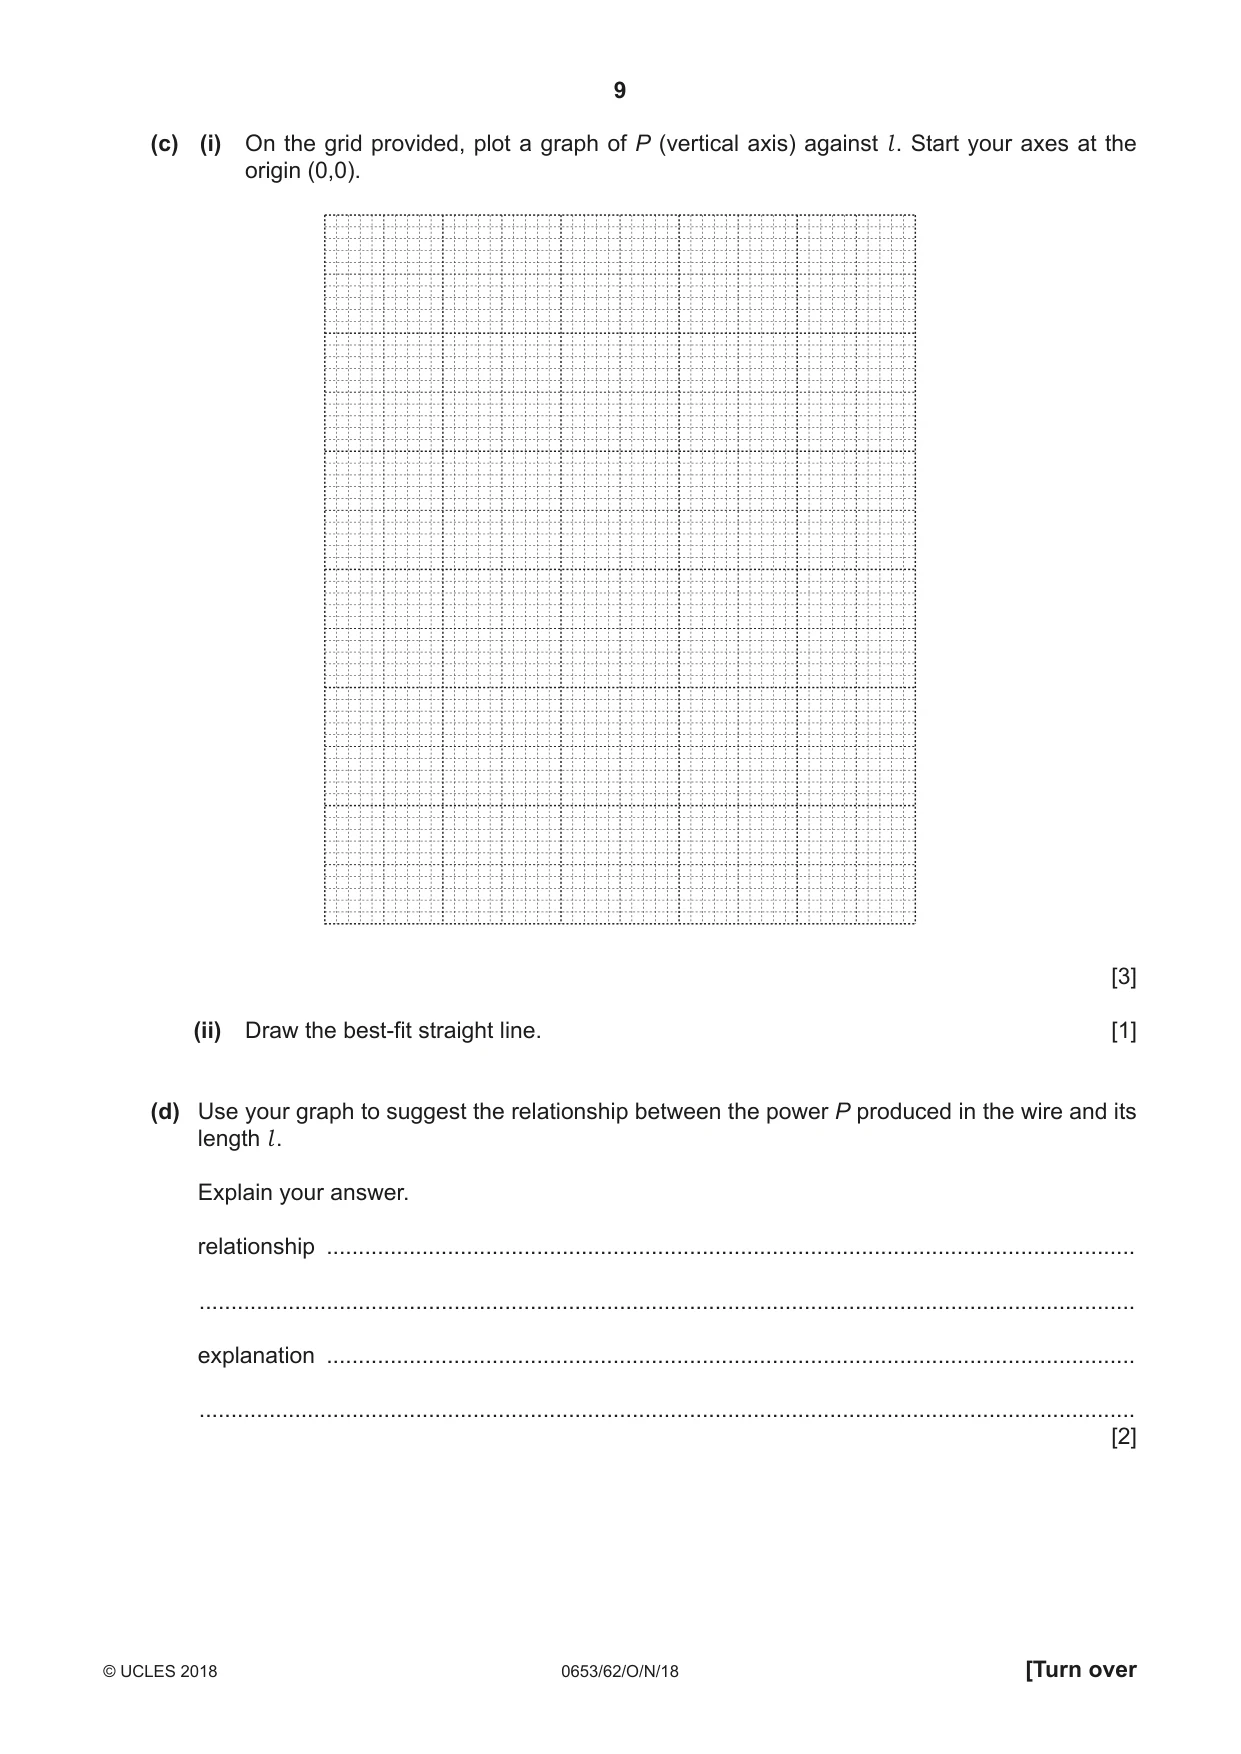
3 A student investigates how the power produced in a resistance wire XY depends upon its length. (a) She sets up the circuit shown in Fig. 3.1. resistance wire metre rule l X Y C sliding contact V A power supply switch Fig. 3.1 • She closes the switch. • She places the sliding contact C on the resistance wire at a length l = 10.0 cm from end X. • She records, in Table 3.1, the current I flowing through the wire and the potential difference V between X and C. • She opens the switch. • She records her results in Table 3.1. Table 3.1 shows some of her results. Table 3.1 potential difference length l / cm current I / .......... power P / .......... V / V 10.0 0.19 20.0 0.19 0.31 0.06 40.0 0.19 0.61 0.12 60.0 0.19 0.88 0.17 80.0 0.19 1.20 0.23 (i) Complete the units in the column headings in Table 3.1. [1] (ii) Fig. 3.2 shows the voltmeter reading for l = 10.0 cm. 0.4 0.6 0.2 0.8 V 0 1.0 Fig. 3.2 Read the meter and record, in Table 3.1, the potential difference V across the wire. [1] (iii) Calculate the power P produced in the 10.0 cm length of the wire. Use the equation shown. P = I × V Record the value of P in Table 3.1. [1] (b) The student repeats (a) for values of l = 20.0 cm, 40.0 cm, 60.0 cm and 80.0 cm. She records, in Table 3.1, her values of I, V and P. State why it is important to open the switch between taking readings. ................................................................................................................................................... ...............................................................................................................................................[1] (c) (i) On the grid provided, plot a graph of P (vertical axis) against l . Start your axes at the origin (0,0). [3] (ii) Draw the best-fit straight line. [1] (d) Use your graph to suggest the relationship between the power P produced in the wire and its length l . Explain your answer. relationship ............................................................................................................................... ................................................................................................................................................... explanation ............................................................................................................................... ................................................................................................................................................... [2]
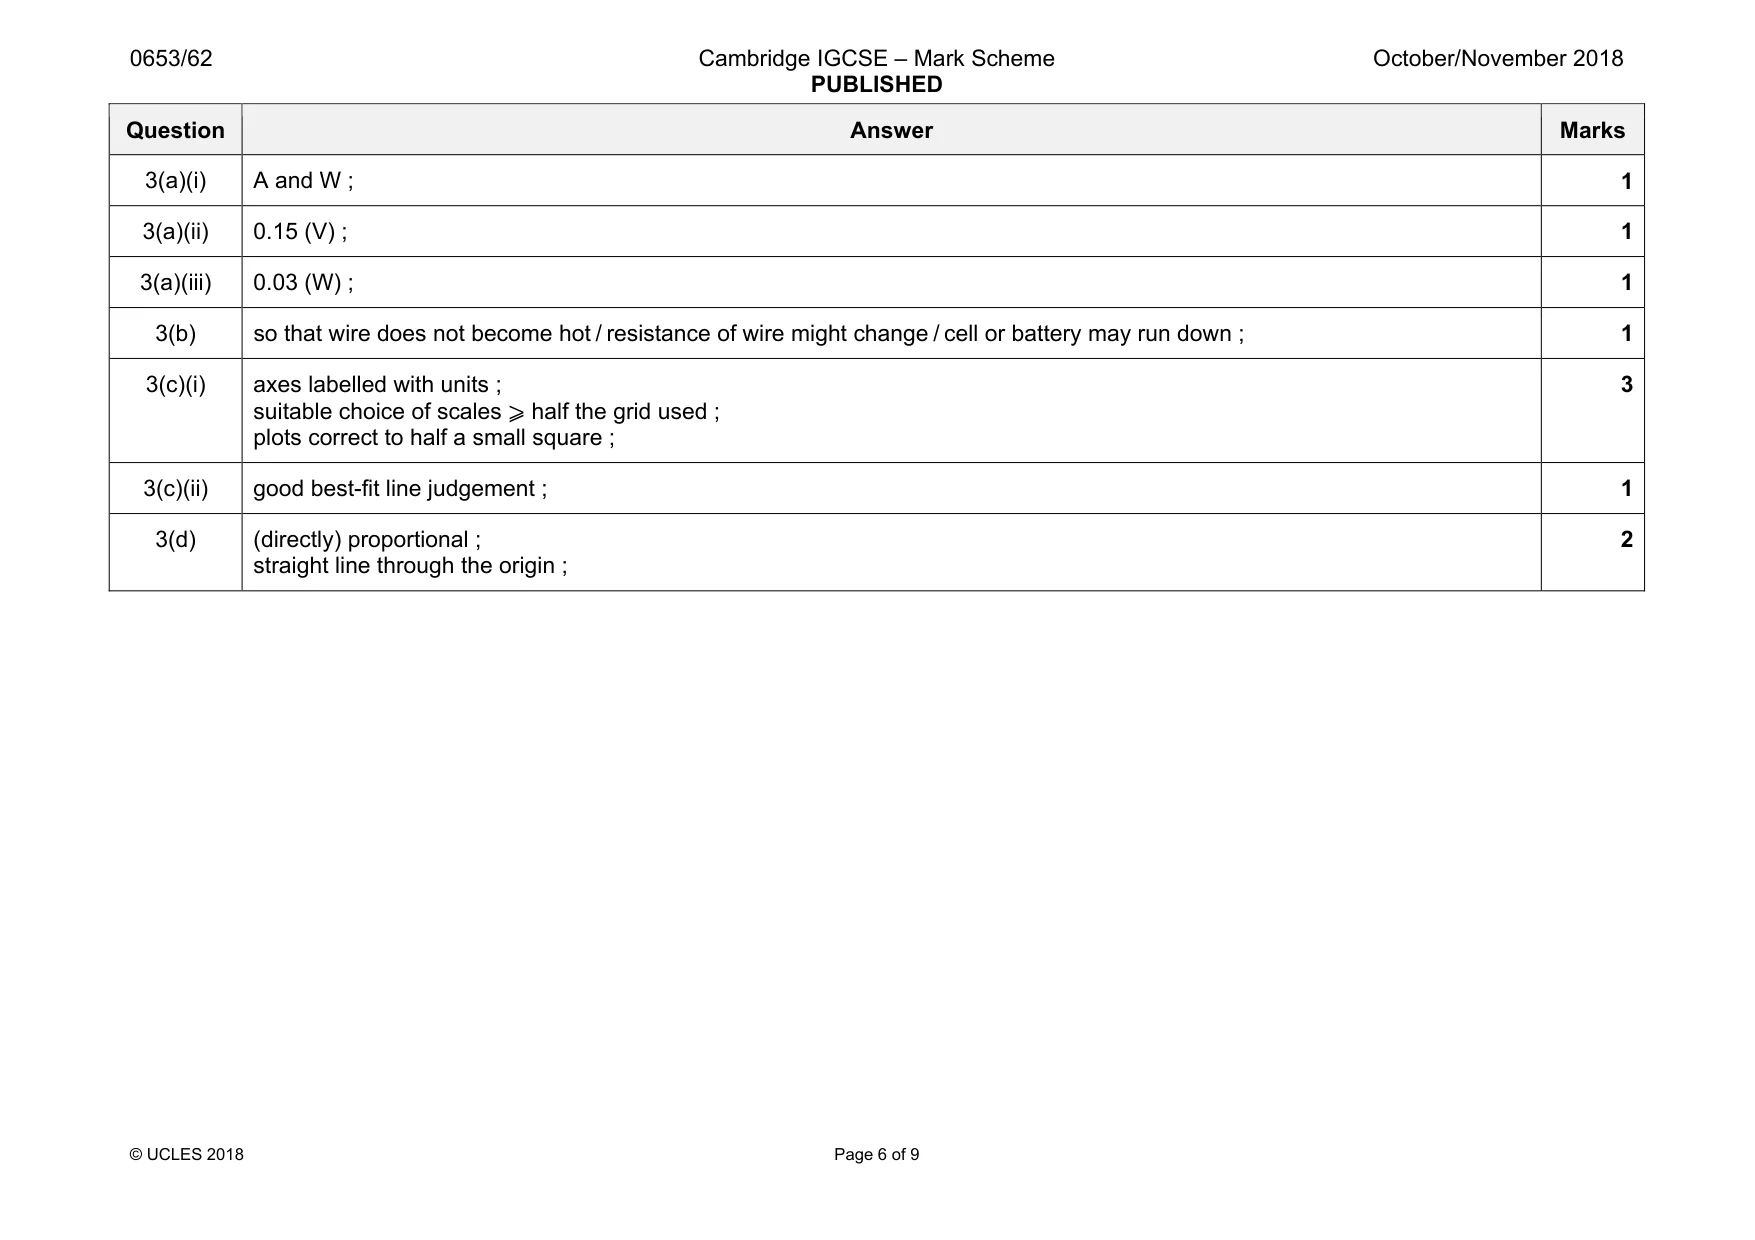
Mark scheme: 3(a)(i) A and W ; 1 3(a)(ii) 0.15 (V) ; 1 3(a)(iii) 0.03 (W) ; 1 3(b) so that wire does not become hot / resistance of wire might change / cell or battery may run down ; 1 3(c)(i) axes labelled with units ; suitable choice of scales ⩾ half the grid used ; plots correct to half a small square ; 3 3(c)(ii) good best-fit line judgement ; 1 3(d) (directly) proportional ; straight line through the origin ; 2
Q4 · A student investigates a blood sample using a microscope
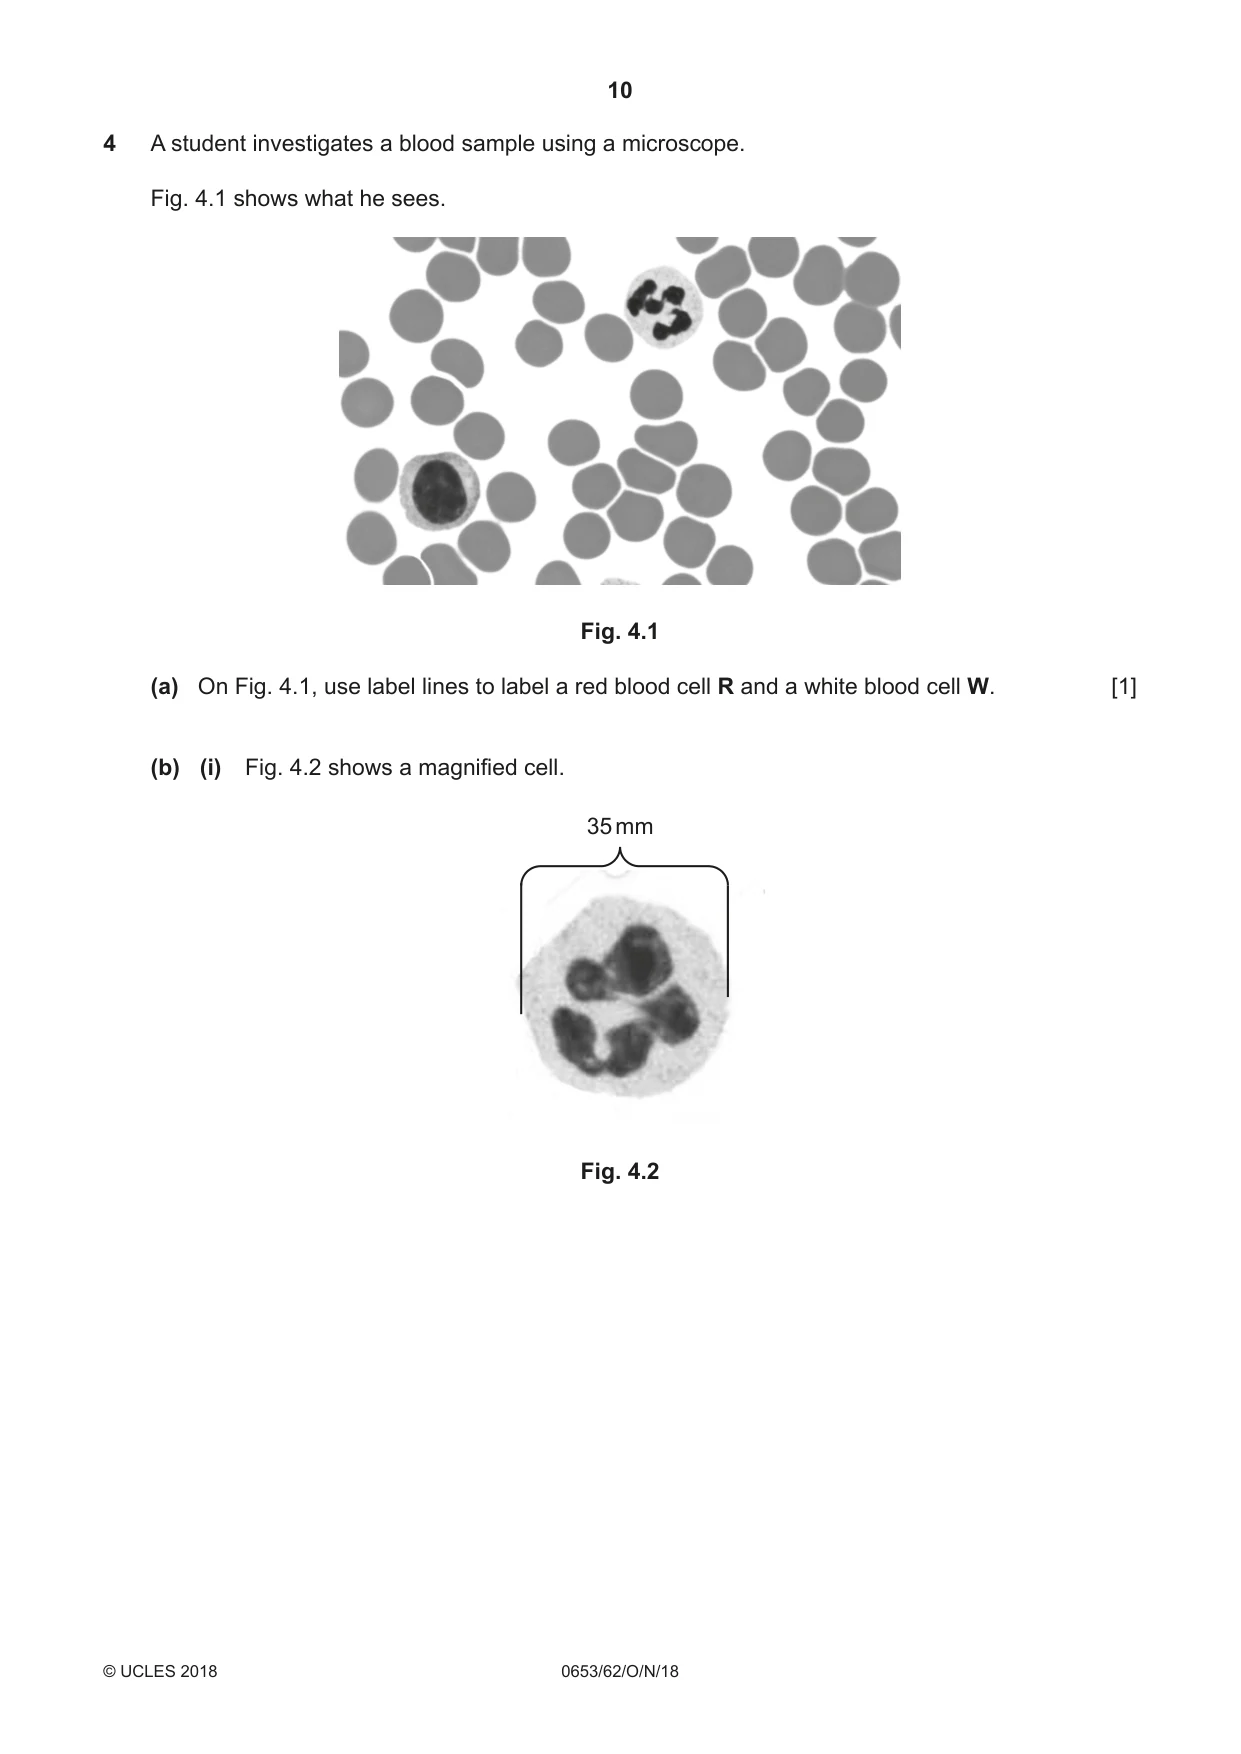
4 A student investigates a blood sample using a microscope. Fig. 4.1 shows what he sees. Fig. 4.1 (a) On Fig. 4.1, use label lines to label a red blood cell R and a white blood cell W. [1] (b) (i) Fig. 4.2 shows a magnified cell. 35 mm Fig. 4.2 In the box provided, make an enlarged drawing of the magnified cell shown in Fig. 4.2. [3] (ii) The width of the cell in Fig. 4.2 is 35 mm. Measure and record the equivalent width of the cell in your drawing. width of cell in drawing = ............................................................... Calculate the magnification of your drawing. magnification = ............................................................... [1] (c) (i) A 17-year-old student is training for a cycle race. Calculate his theoretical maximum heart rate during his training. Use the equation shown. theoretical maximum heart rate in beats per minute = (220 – age in years) student’s theoretical maximum heart rate = .............................. beats per minute [1] (ii) The student wants to find his resting heart rate. The student does not have a heart rate monitor but does have a stopwatch. Describe how the student determines his resting heart rate. ........................................................................................................................................... ........................................................................................................................................... ........................................................................................................................................... ........................................................................................................................................... ........................................................................................................................................... .......................................................................................................................................[4]
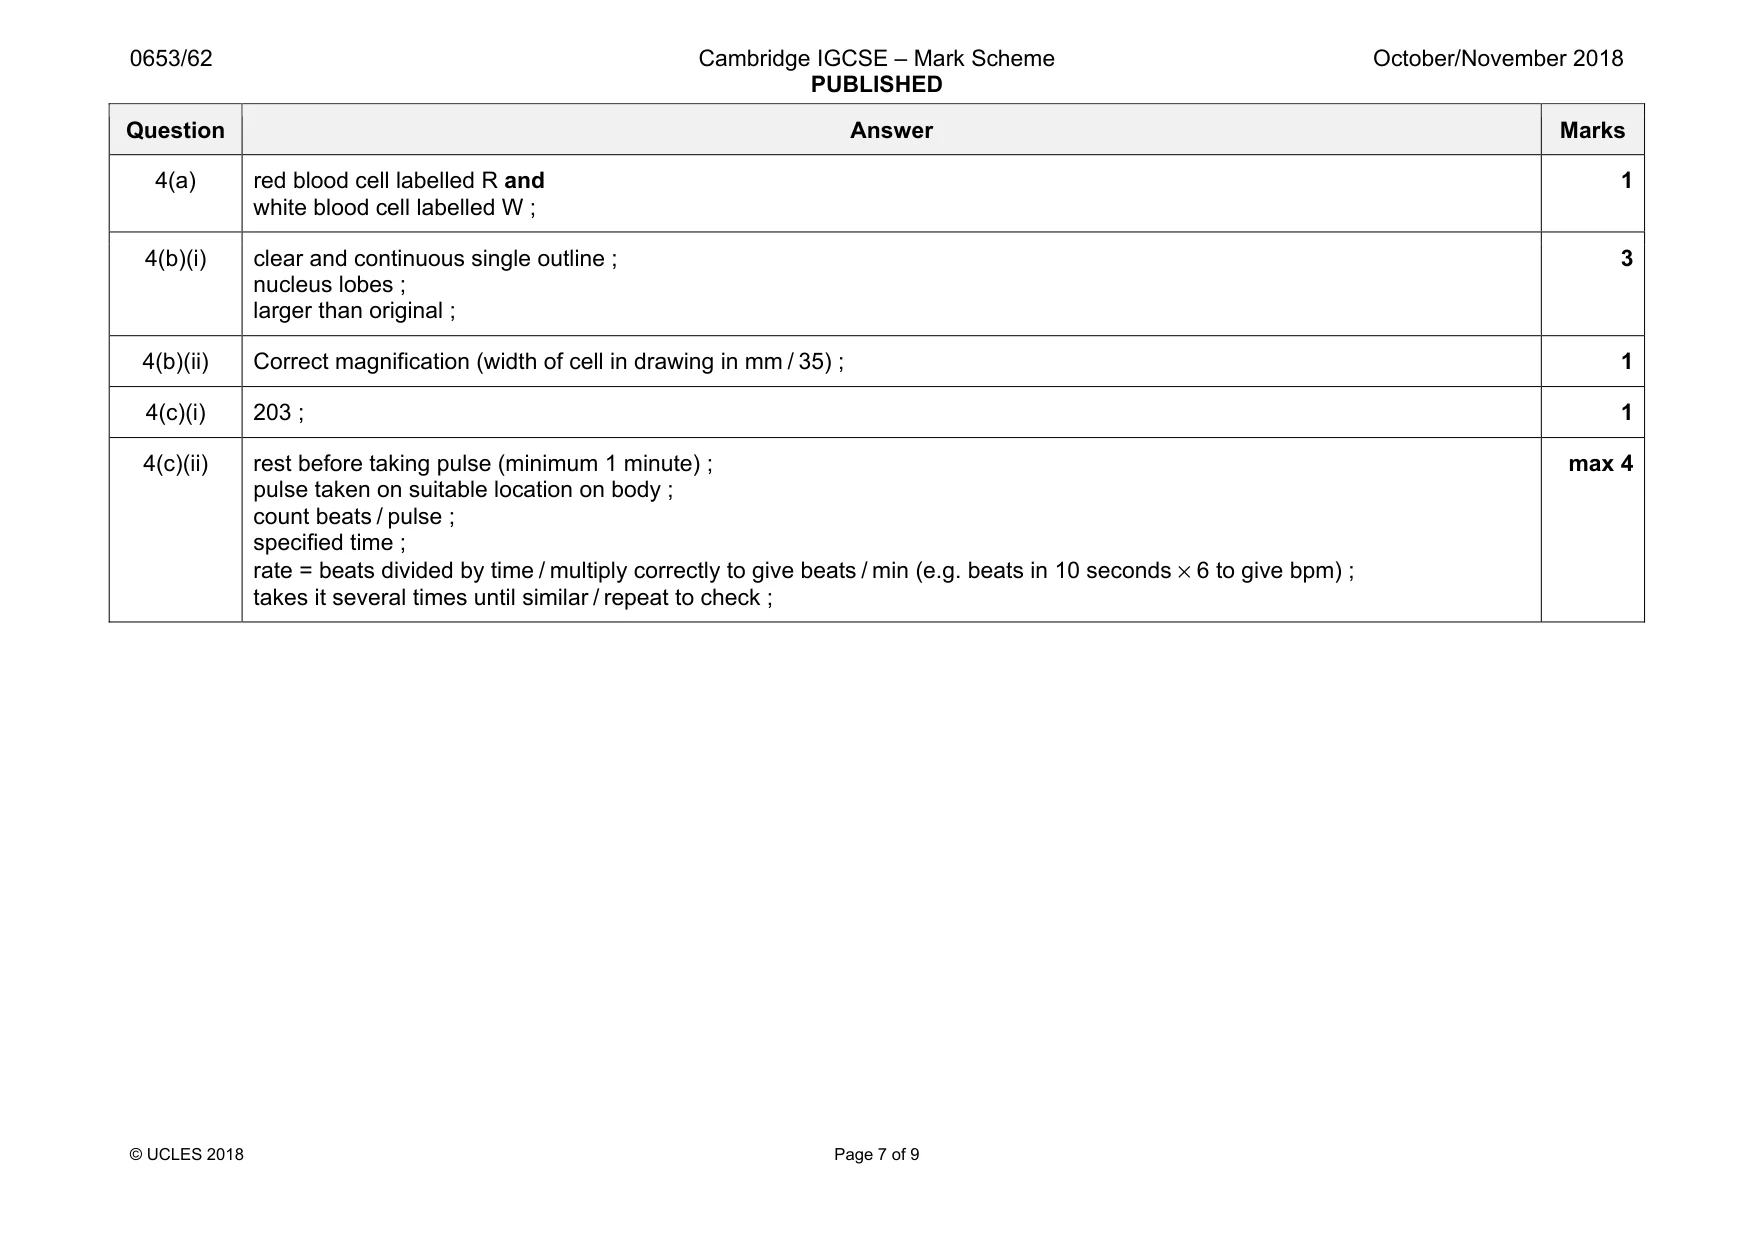
Mark scheme: 4(a) red blood cell labelled R and white blood cell labelled W ; 1 4(b)(i) clear and continuous single outline ; nucleus lobes ; larger than original ; 3 4(b)(ii) Correct magnification (width of cell in drawing in mm / 35) ; 1 4(c)(i) 203 ; 1 4(c)(ii) rest before taking pulse (minimum 1 minute) ; pulse taken on suitable location on body ; count beats / pulse ; specified time ; rate = beats divided by time / multiply correctly to give beats / min (e.g. beats in 10 seconds × 6 to give bpm) ; takes it several times until similar / repeat to check ; max 4
Q5 · A student investigates the coloured inks in a permanent black marker pen using…
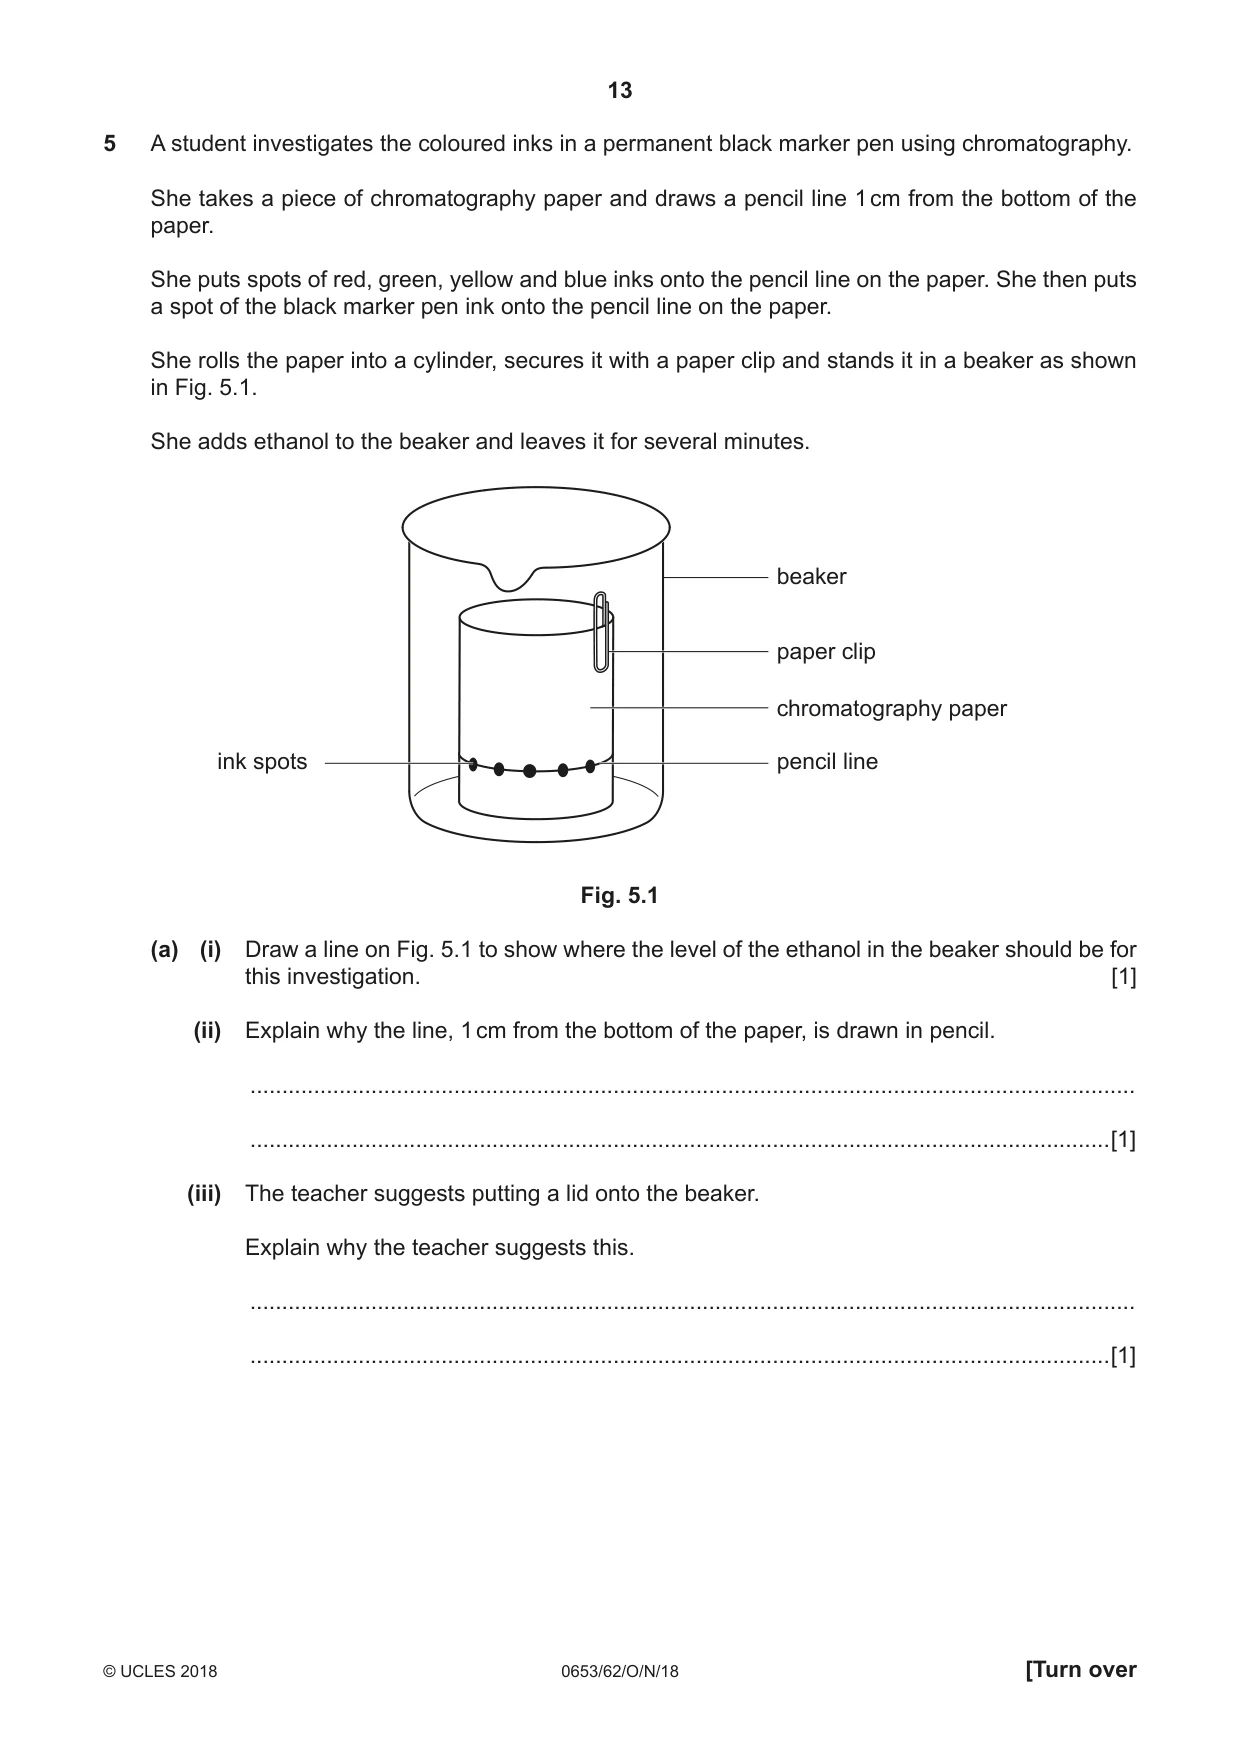
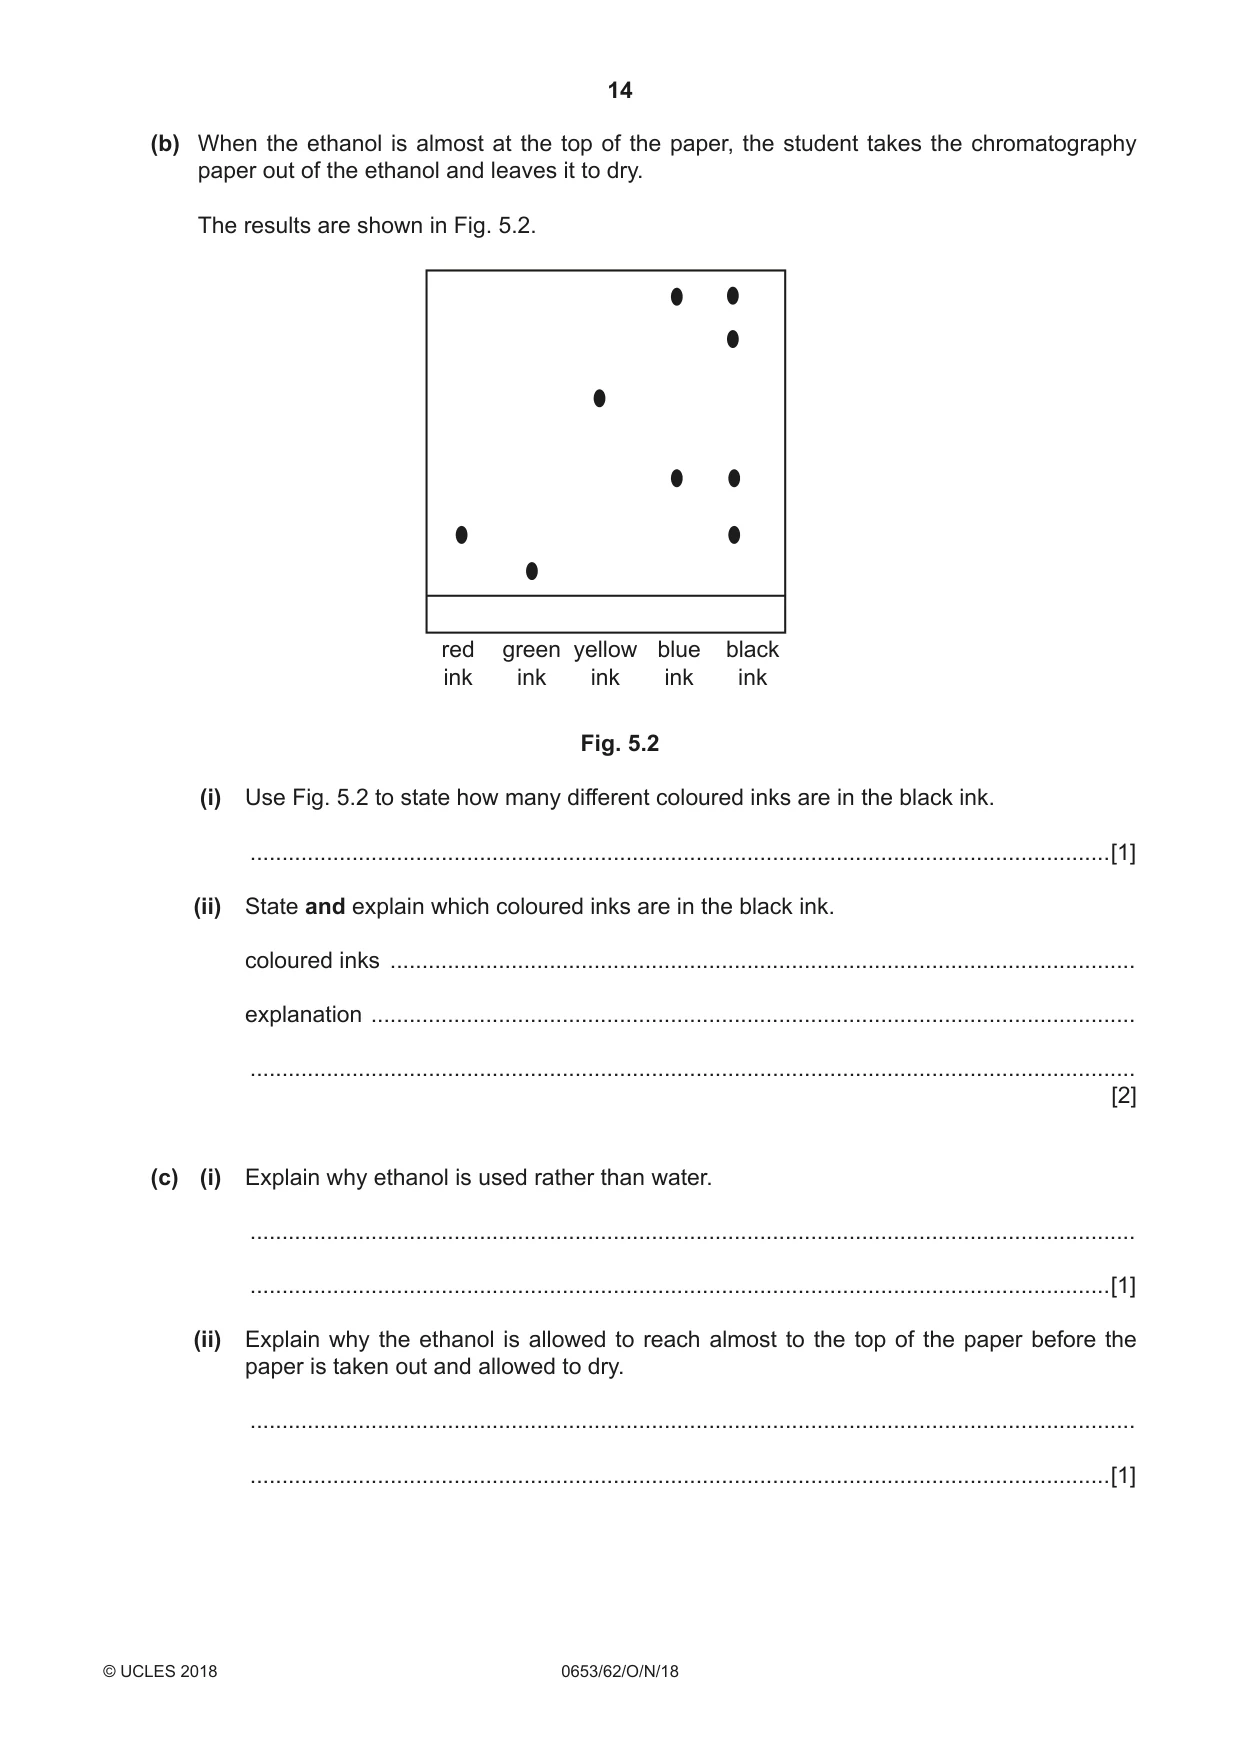
5 A student investigates the coloured inks in a permanent black marker pen using chromatography. She takes a piece of chromatography paper and draws a pencil line 1 cm from the bottom of the paper. She puts spots of red, green, yellow and blue inks onto the pencil line on the paper. She then puts a spot of the black marker pen ink onto the pencil line on the paper. She rolls the paper into a cylinder, secures it with a paper clip and stands it in a beaker as shown in Fig. 5.1. She adds ethanol to the beaker and leaves it for several minutes. beaker paper clip chromatography paper ink spots pencil line Fig. 5.1 (a) (i) Draw a line on Fig. 5.1 to show where the level of the ethanol in the beaker should be for this investigation. [1] (ii) Explain why the line, 1 cm from the bottom of the paper, is drawn in pencil. ........................................................................................................................................... .......................................................................................................................................[1] (iii) The teacher suggests putting a lid onto the beaker. Explain why the teacher suggests this. ........................................................................................................................................... .......................................................................................................................................[1] (b) When the ethanol is almost at the top of the paper, the student takes the chromatography paper out of the ethanol and leaves it to dry. The results are shown in Fig. 5.2. red green yellow blue black ink ink ink ink ink Fig. 5.2 (i) Use Fig. 5.2 to state how many different coloured inks are in the black ink. .......................................................................................................................................[1] (ii) State and explain which coloured inks are in the black ink. coloured inks ..................................................................................................................... explanation ........................................................................................................................ ........................................................................................................................................... [2] (c) (i) Explain why ethanol is used rather than water. ........................................................................................................................................... .......................................................................................................................................[1] (ii) Explain why the ethanol is allowed to reach almost to the top of the paper before the paper is taken out and allowed to dry. ........................................................................................................................................... .......................................................................................................................................[1] (d) The student thinks that the red-coloured ink is the same colour as the coloured ink in one of her sweets. Explain how she can use chromatography to test her prediction. Include in your answer: • how the student would extract the red colour from the sweets • what spots she should put on her chromatography paper. ................................................................................................................................................... ................................................................................................................................................... ...............................................................................................................................................[2]
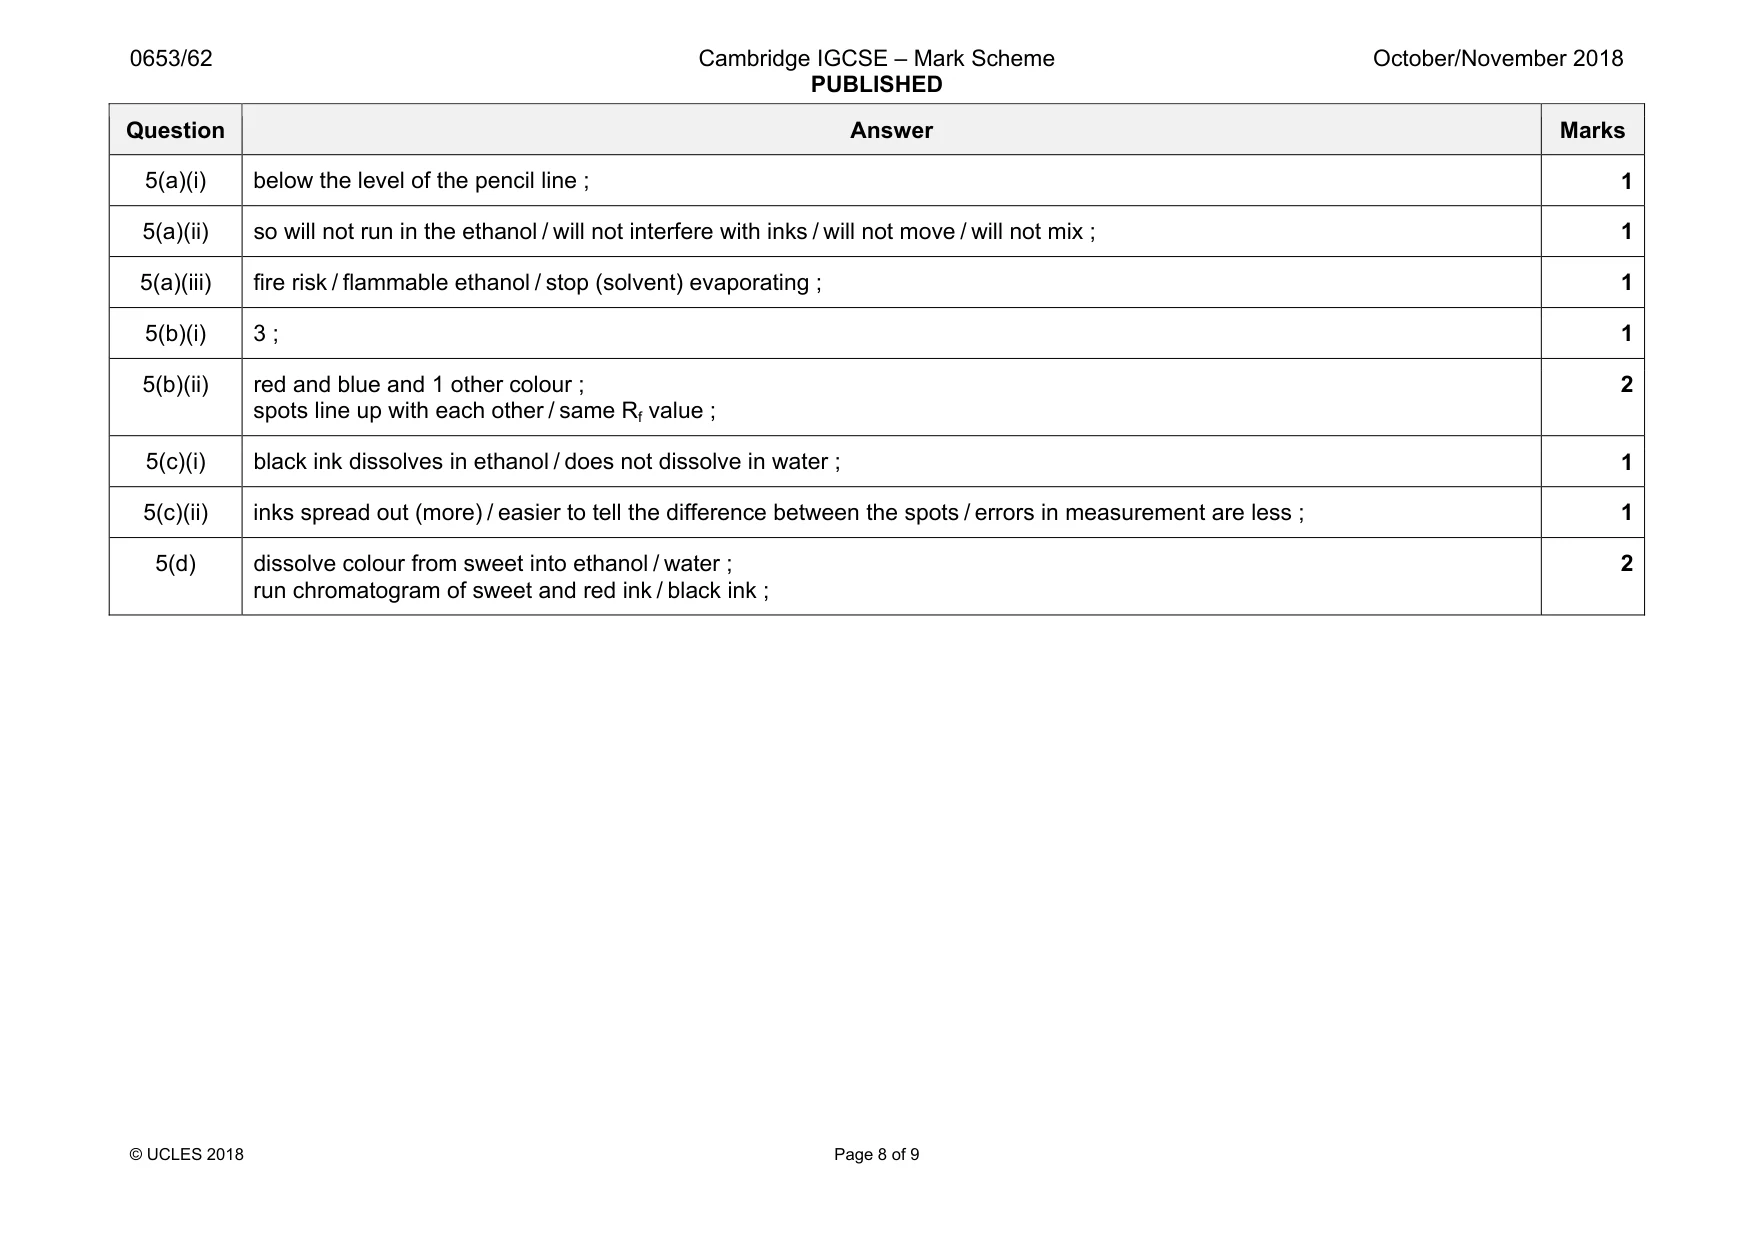
Mark scheme: 5(a)(i) below the level of the pencil line ; 1 5(a)(ii) so will not run in the ethanol / will not interfere with inks / will not move / will not mix ; 1 5(a)(iii) fire risk / flammable ethanol / stop (solvent) evaporating ; 1 5(b)(i) 3 ; 1 5(b)(ii) red and blue and 1 other colour ; spots line up with each other / same Rf value ; 2 5(c)(i) black ink dissolves in ethanol / does not dissolve in water ; 1 5(c)(ii) inks spread out (more) / easier to tell the difference between the spots / errors in measurement are less ; 1 5(d) dissolve colour from sweet into ethanol / water ; run chromatogram of sweet and red ink / black ink ; 2
Q6 · A student carries out an experiment to measure her personal power
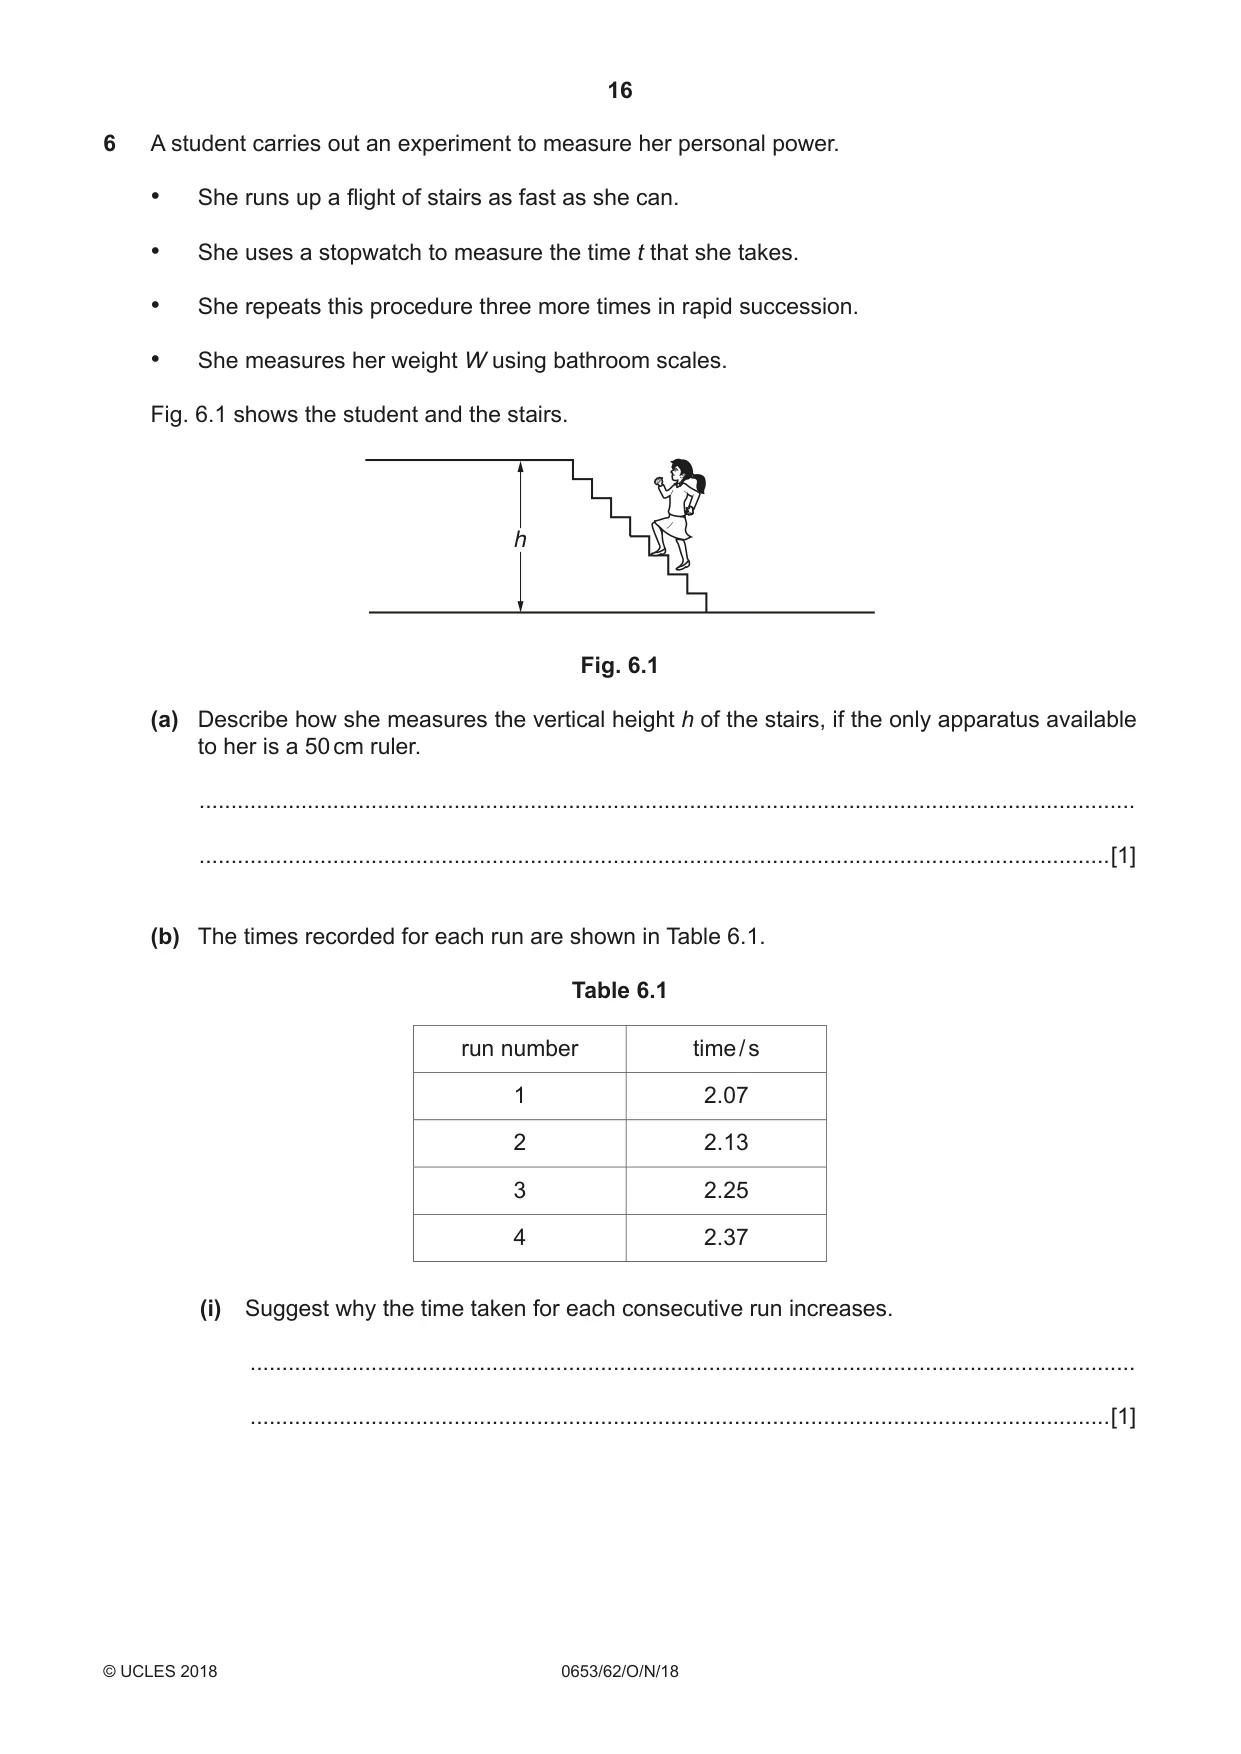
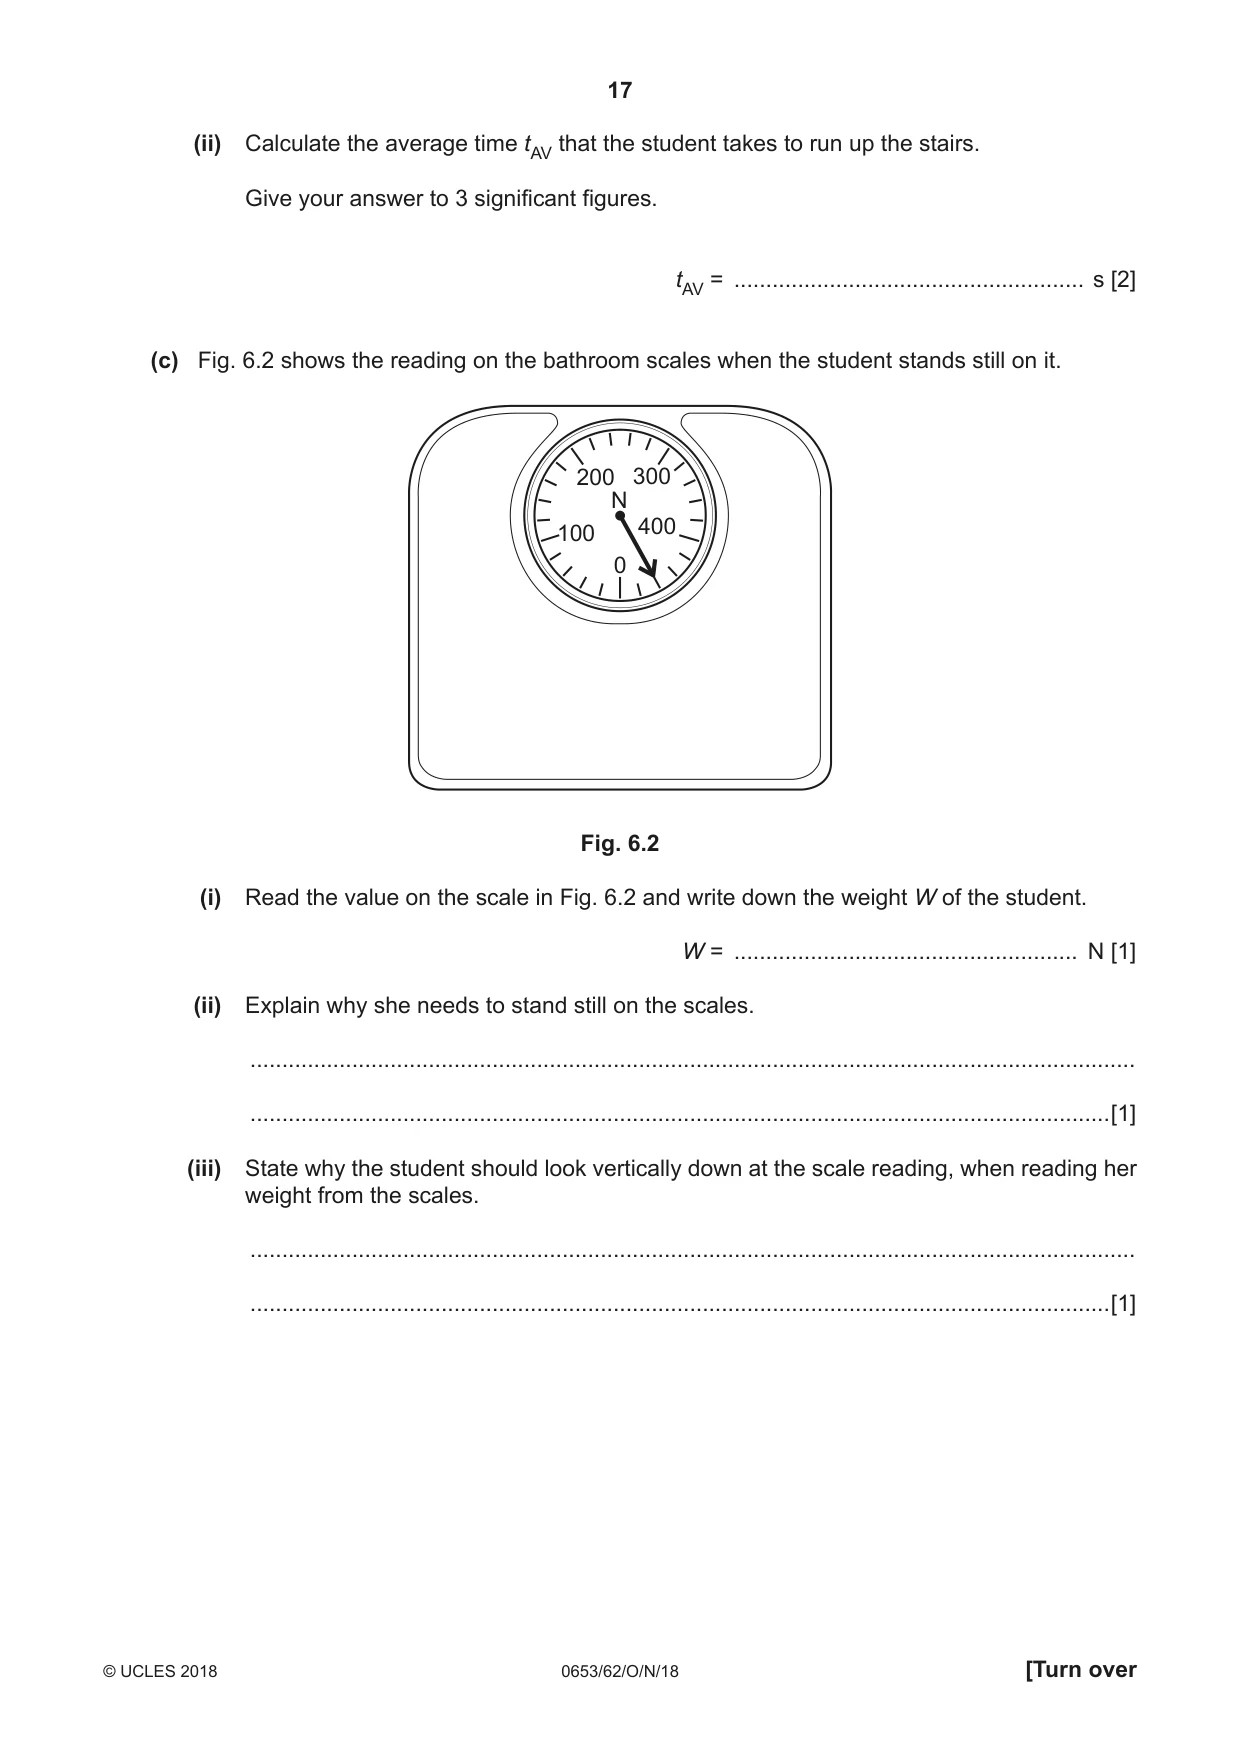
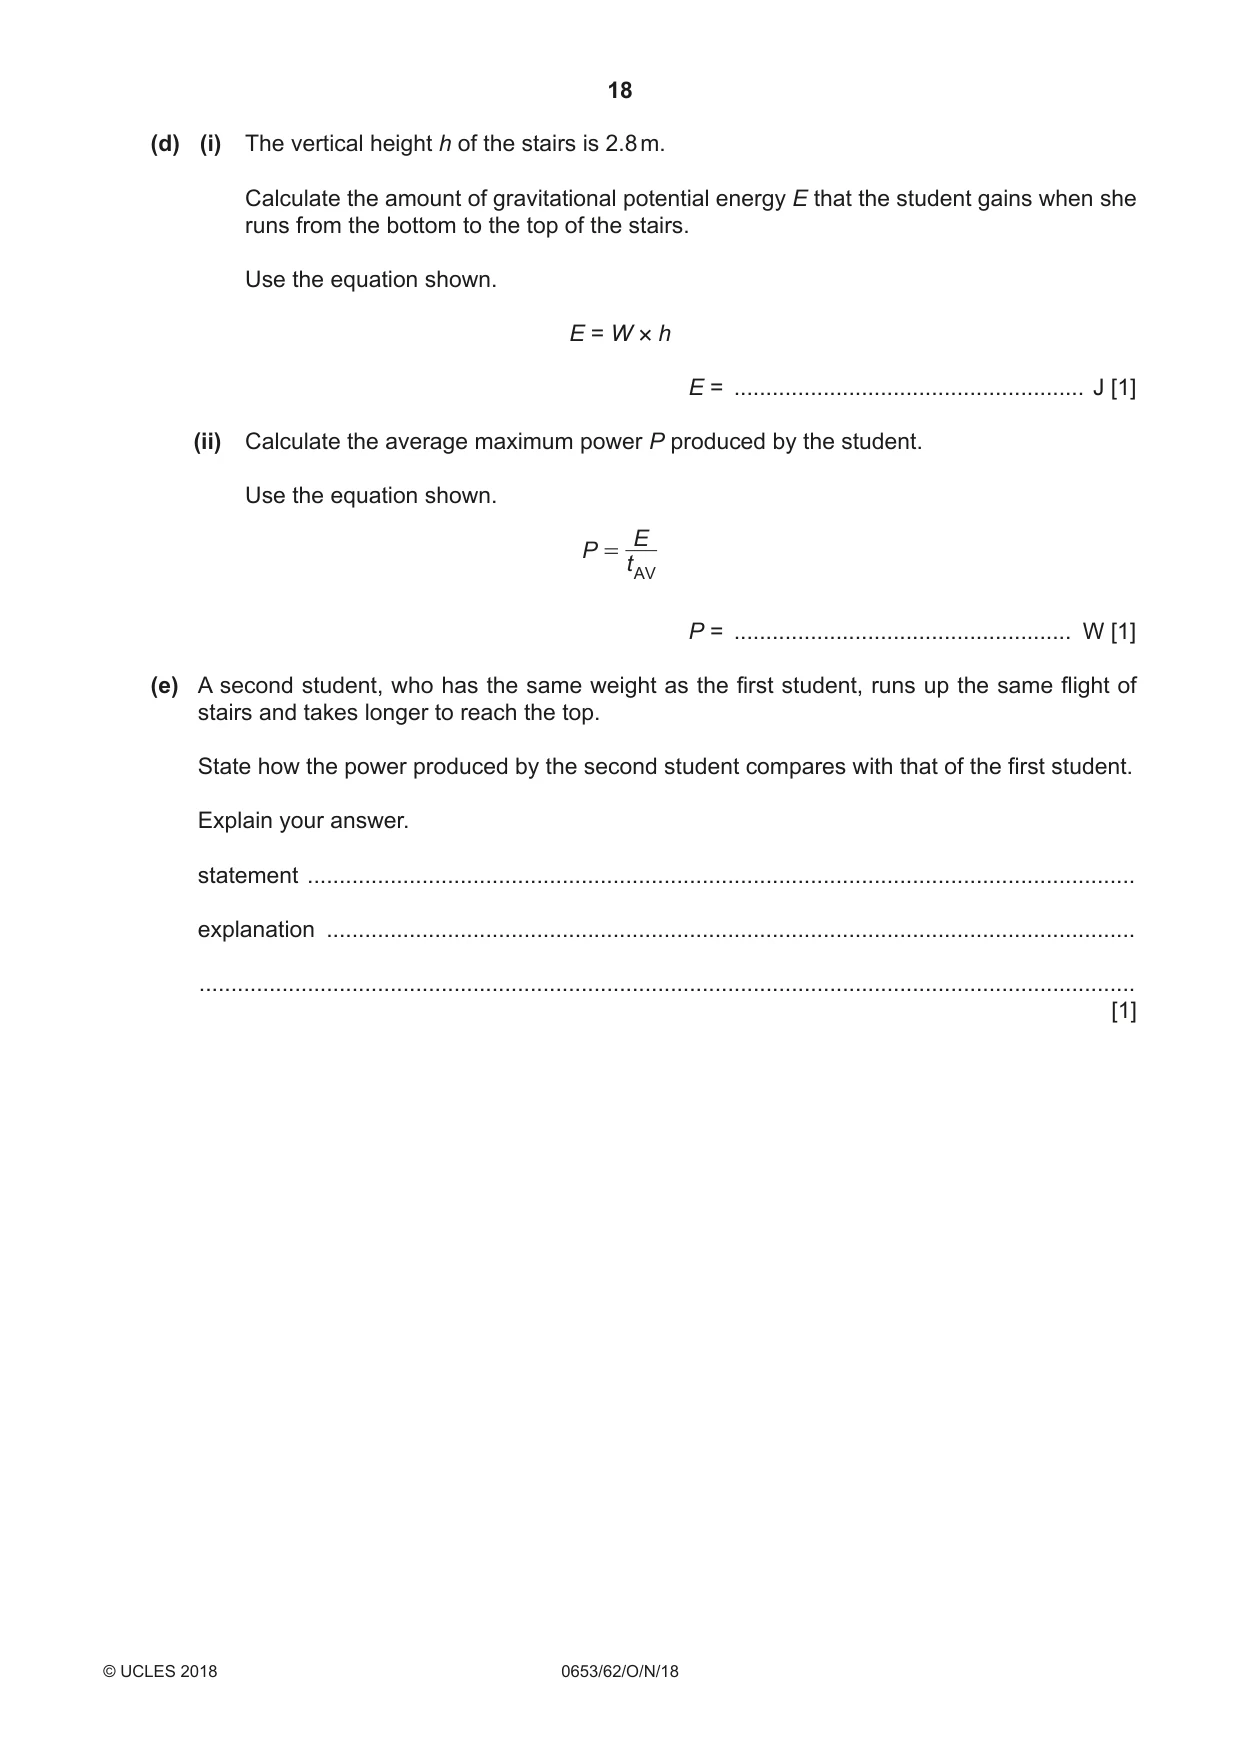
6 A student carries out an experiment to measure her personal power. • She runs up a flight of stairs as fast as she can. • She uses a stopwatch to measure the time t that she takes. • She repeats this procedure three more times in rapid succession. • She measures her weight W using bathroom scales. Fig. 6.1 shows the student and the stairs. h Fig. 6.1 (a) Describe how she measures the vertical height h of the stairs, if the only apparatus available to her is a 50 cm ruler. ................................................................................................................................................... ...............................................................................................................................................[1] (b) The times recorded for each run are shown in Table 6.1. Table 6.1 run number time / s 1 2.07 2 2.13 3 2.25 4 2.37 (i) Suggest why the time taken for each consecutive run increases. ........................................................................................................................................... .......................................................................................................................................[1] (ii) Calculate the average time tAV that the student takes to run up the stairs. Give your answer to 3 significant figures. tAV = ....................................................... s [2] (c) Fig. 6.2 shows the reading on the bathroom scales when the student stands still on it. 200 300 N 400 100 0 Fig. 6.2 (i) Read the value on the scale in Fig. 6.2 and write down the weight W of the student. W = ...................................................... N [1] (ii) Explain why she needs to stand still on the scales. ........................................................................................................................................... .......................................................................................................................................[1] (iii) State why the student should look vertically down at the scale reading, when reading her weight from the scales. ........................................................................................................................................... .......................................................................................................................................[1] (d) (i) The vertical height h of the stairs is 2.8 m. Calculate the amount of gravitational potential energy E that the student gains when she runs from the bottom to the top of the stairs. Use the equation shown. E = W × h E = ....................................................... J [1] (ii) Calculate the average maximum power P produced by the student. Use the equation shown. E P = t AV P = ..................................................... W [1] (e) A second student, who has the same weight as the first student, runs up the same flight of stairs and takes longer to reach the top. State how the power produced by the second student compares with that of the first student. Explain your answer. statement .................................................................................................................................. explanation ............................................................................................................................... ................................................................................................................................................... [1]
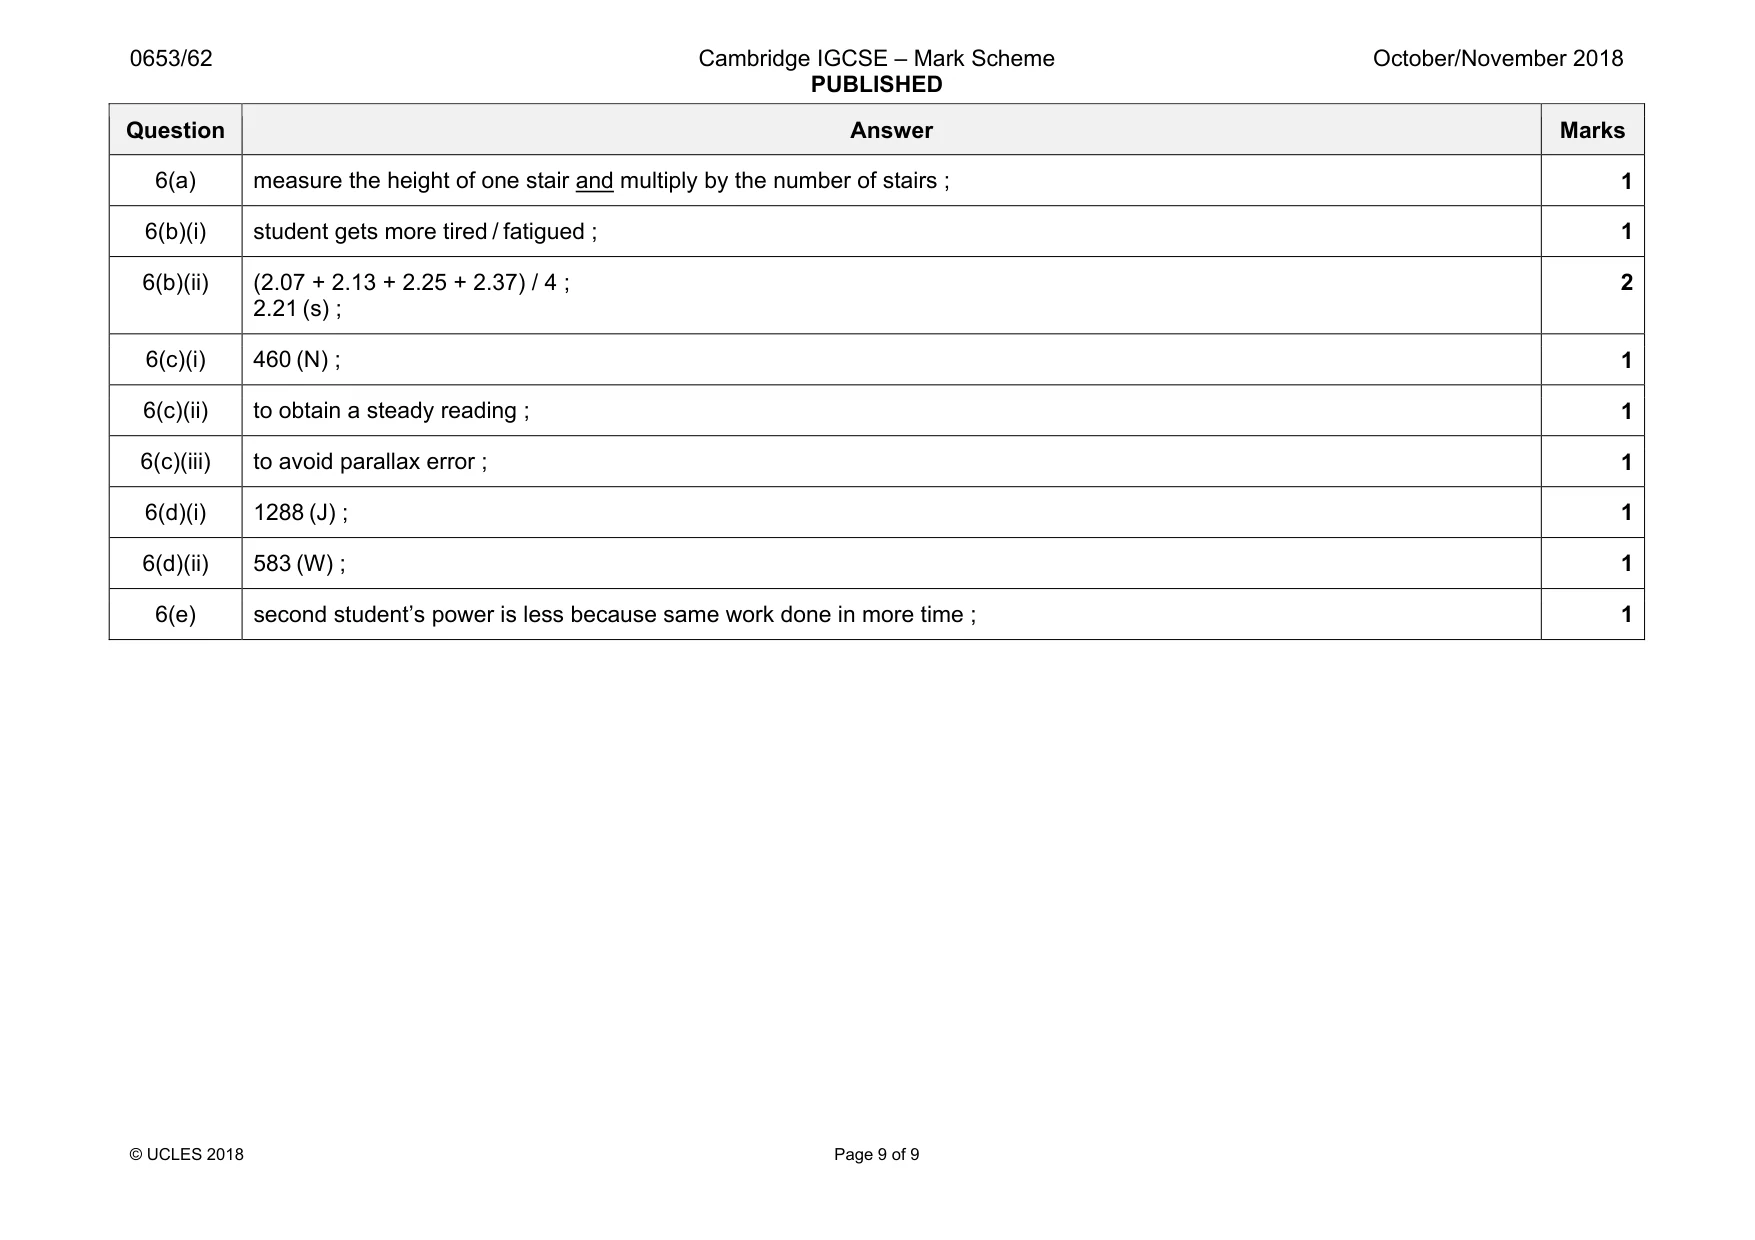
Mark scheme: 6(a) measure the height of one stair and multiply by the number of stairs ; 1 6(b)(i) student gets more tired / fatigued ; 1 6(b)(ii) (2.07 + 2.13 + 2.25 + 2.37) / 4 ; 2.21 (s) ; 2 6(c)(i) 460 (N) ; 1 6(c)(ii) to obtain a steady reading ; 1 6(c)(iii) to avoid parallax error ; 1 6(d)(i) 1288 (J) ; 1 6(d)(ii) 583 (W) ; 1 6(e) second student’s power is less because same work done in more time ; 1
What was in this paper
The subtopics covered by these 6 questions, and how many questions each got. Open one in a new tab to see every Cambridge question on it.
What you needed in this session
Cambridge’s own grade thresholds for 2018 Oct/Nov, Paper 6 · Variant 2. A higher threshold means an easier paper — the bar moves with how the cohort did.