Cambridge IGCSE Science - Combined 0653 — 2018 Oct/Nov Paper 6 · Variant 1
0653/61/O/N/18 · 6 questions · 60 marks · ≈68 min
The question paper and its mark scheme, free to read here and free to download. This is Cambridge’s own paper, exactly as it was sat.
Question paper20 pages

Mark scheme9 pages
Answers below. Sit the paper first if you are practising.
Questions as text
Q1 · A student investigates a leaf
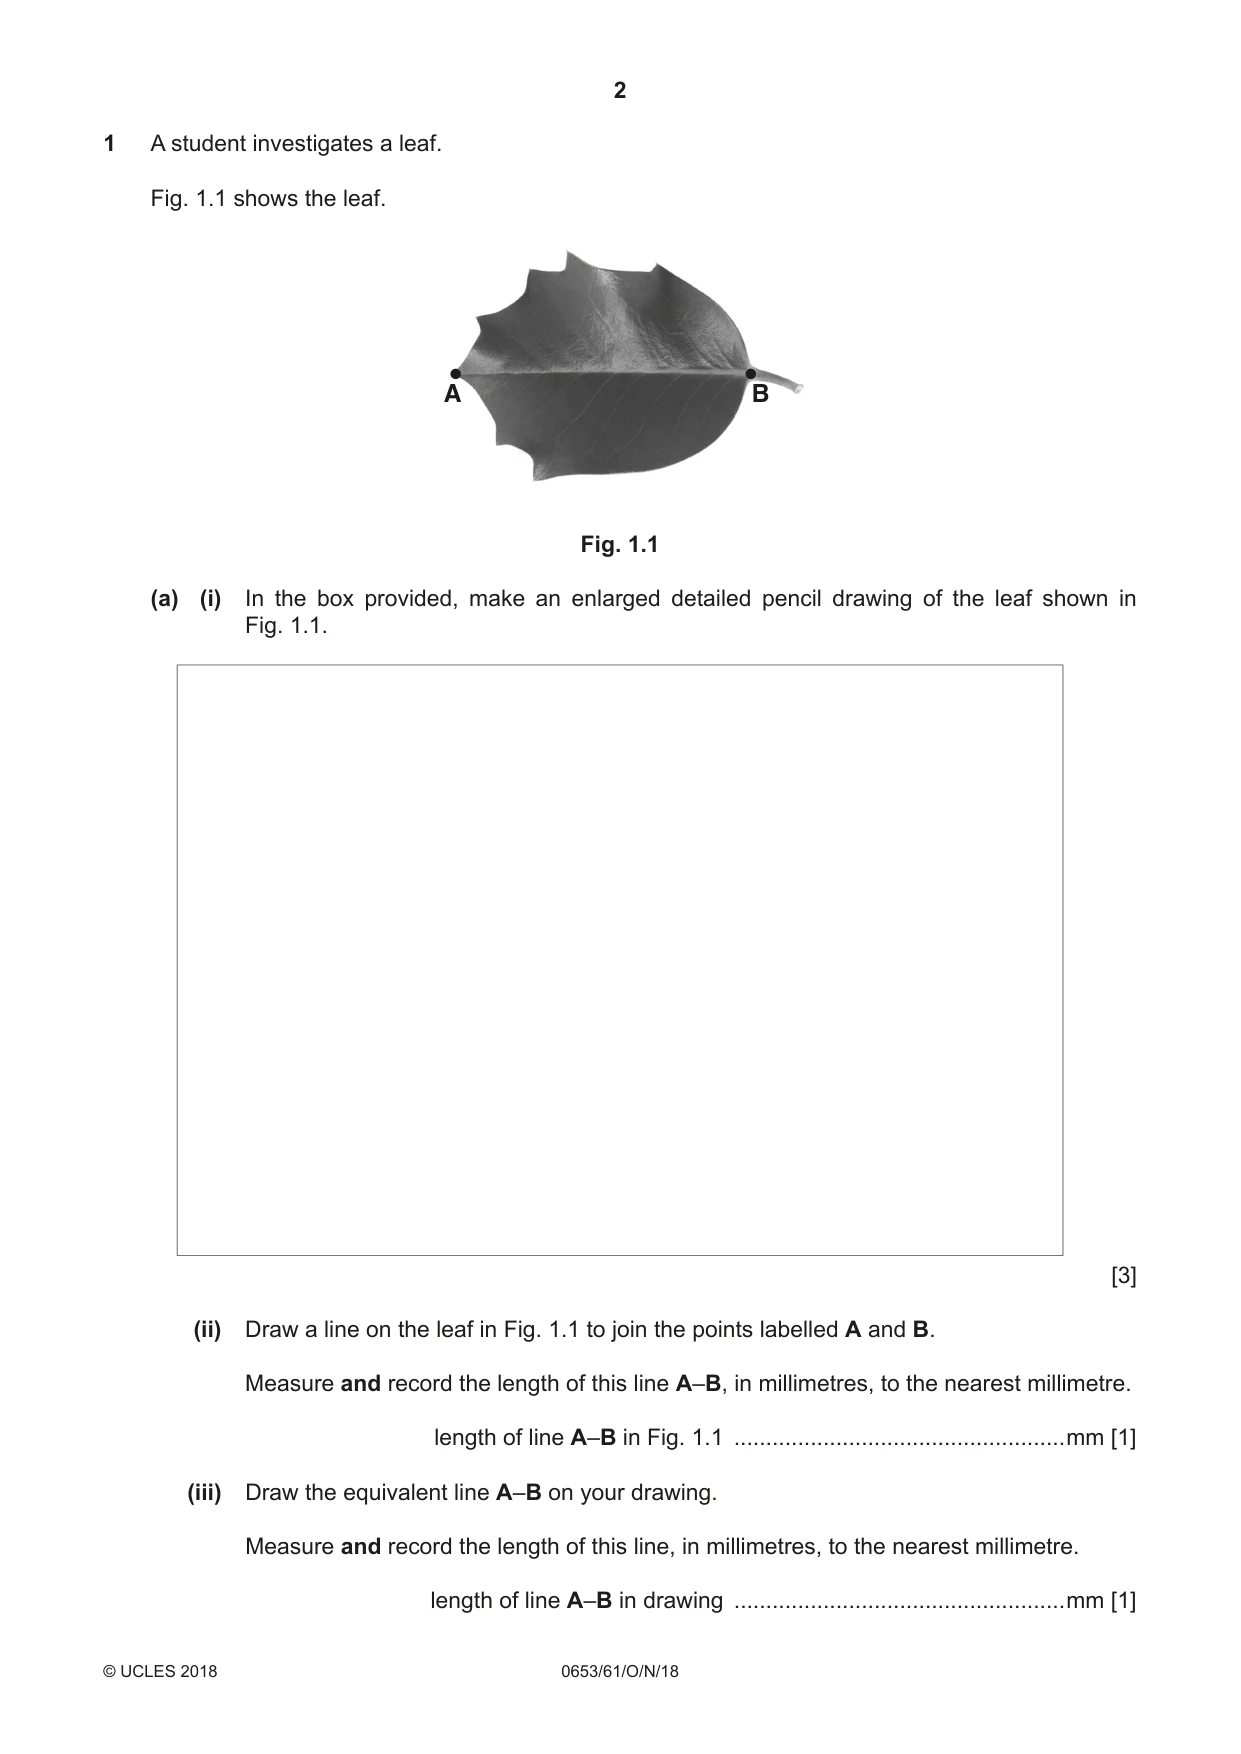
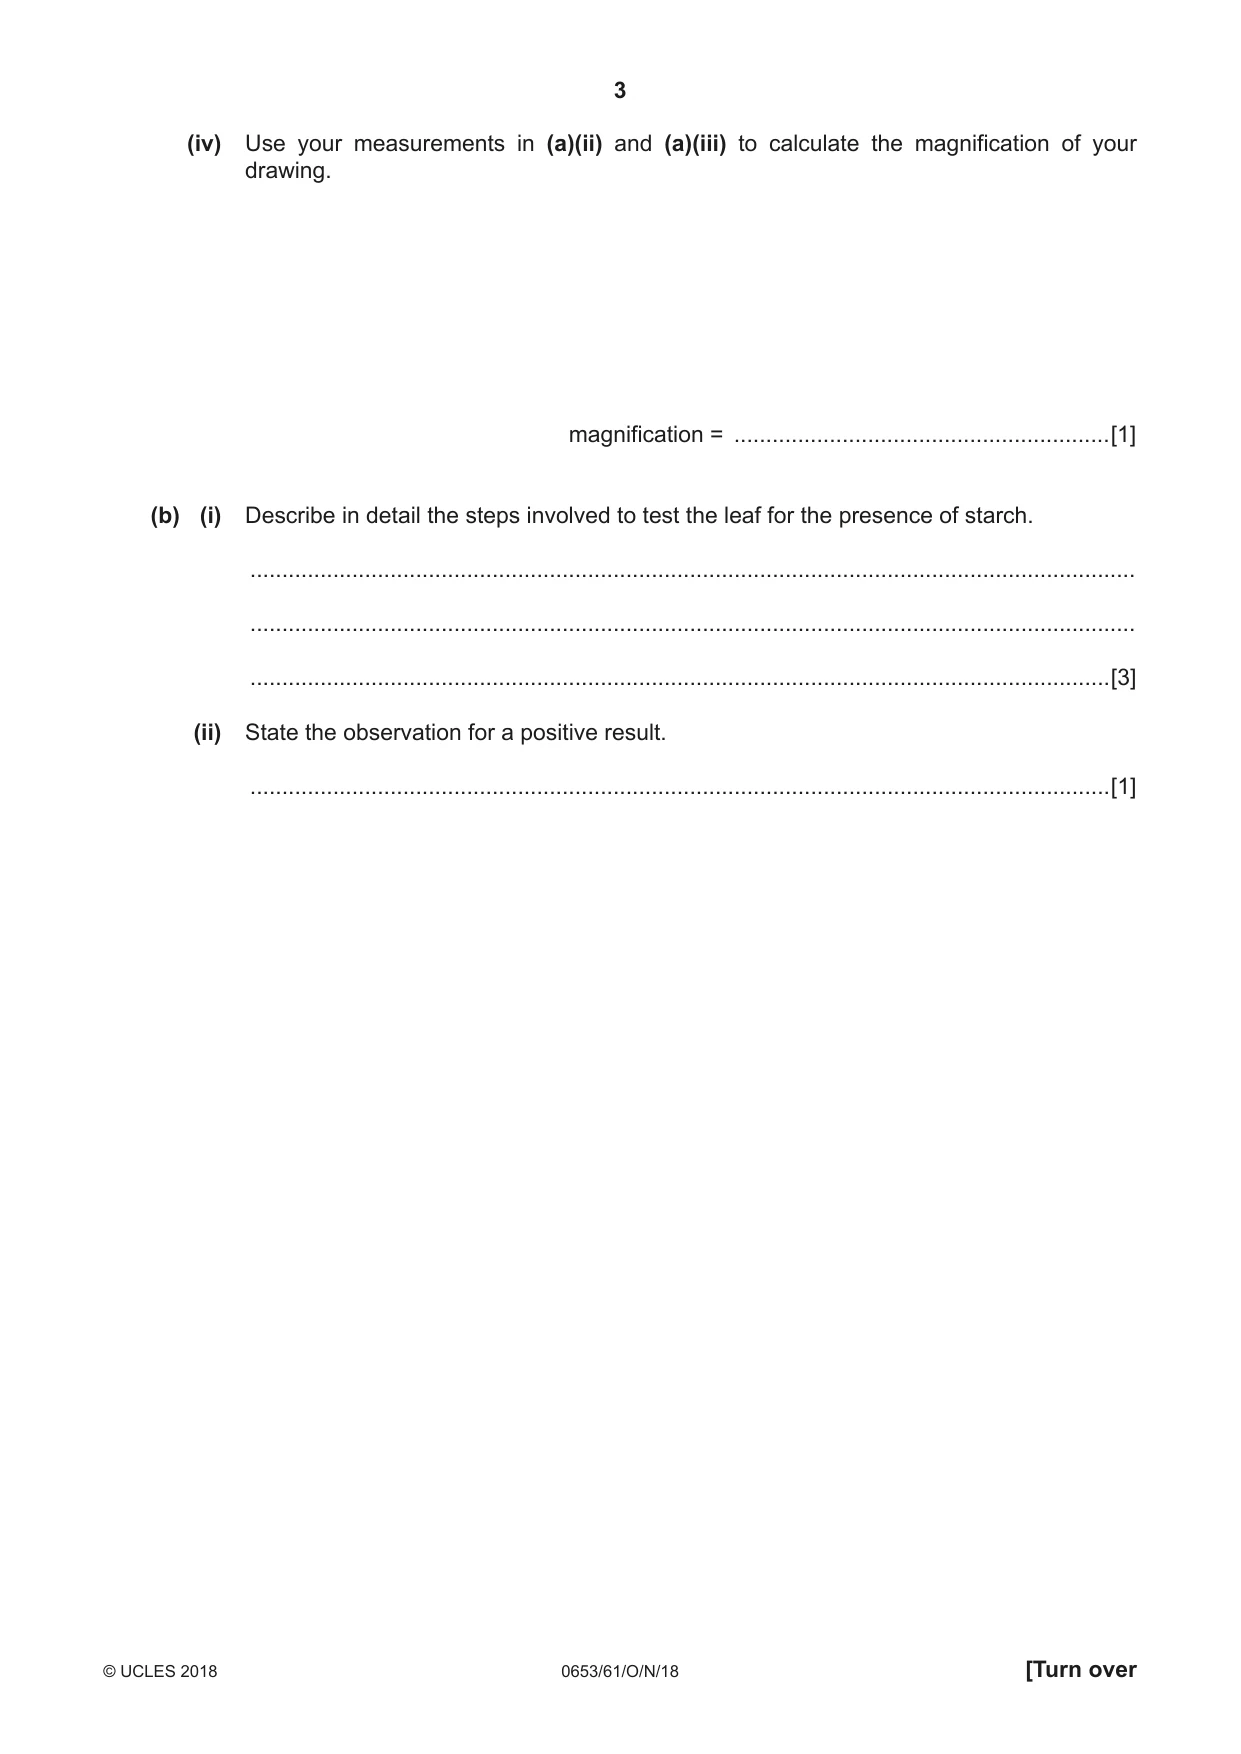
1 A student investigates a leaf. Fig. 1.1 shows the leaf. A B Fig. 1.1 (a) (i) In the box provided, make an enlarged detailed pencil drawing of the leaf shown in Fig. 1.1. [3] (ii) Draw a line on the leaf in Fig. 1.1 to join the points labelled A and B. Measure and record the length of this line A–B, in millimetres, to the nearest millimetre. length of line A–B in Fig. 1.1 ....................................................mm [1] (iii) Draw the equivalent line A–B on your drawing. Measure and record the length of this line, in millimetres, to the nearest millimetre. length of line A–B in drawing ....................................................mm [1] (iv) Use your measurements in (a)(ii) and (a)(iii) to calculate the magnification of your drawing. magnification = ...........................................................[1] (b) (i) Describe in detail the steps involved to test the leaf for the presence of starch. ........................................................................................................................................... ........................................................................................................................................... .......................................................................................................................................[3] (ii) State the observation for a positive result. .......................................................................................................................................[1]
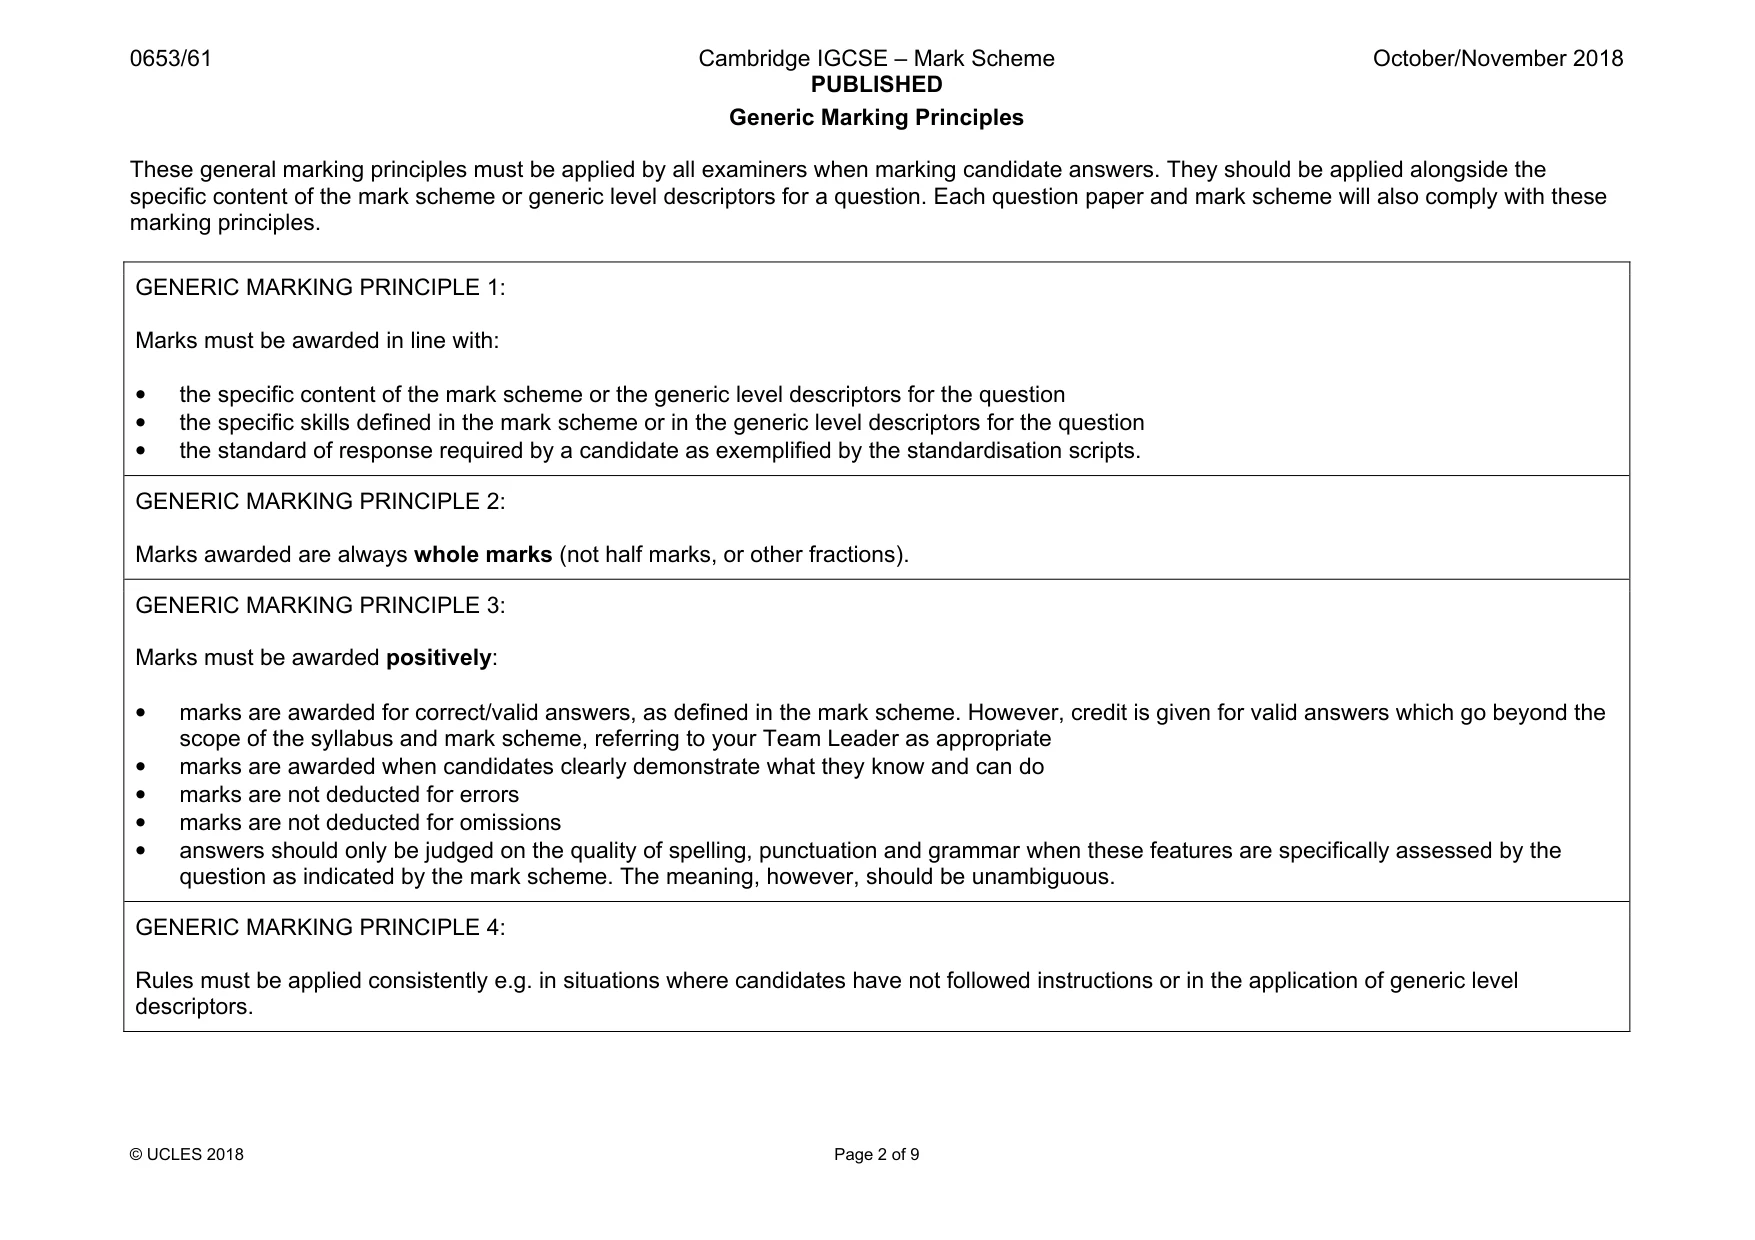
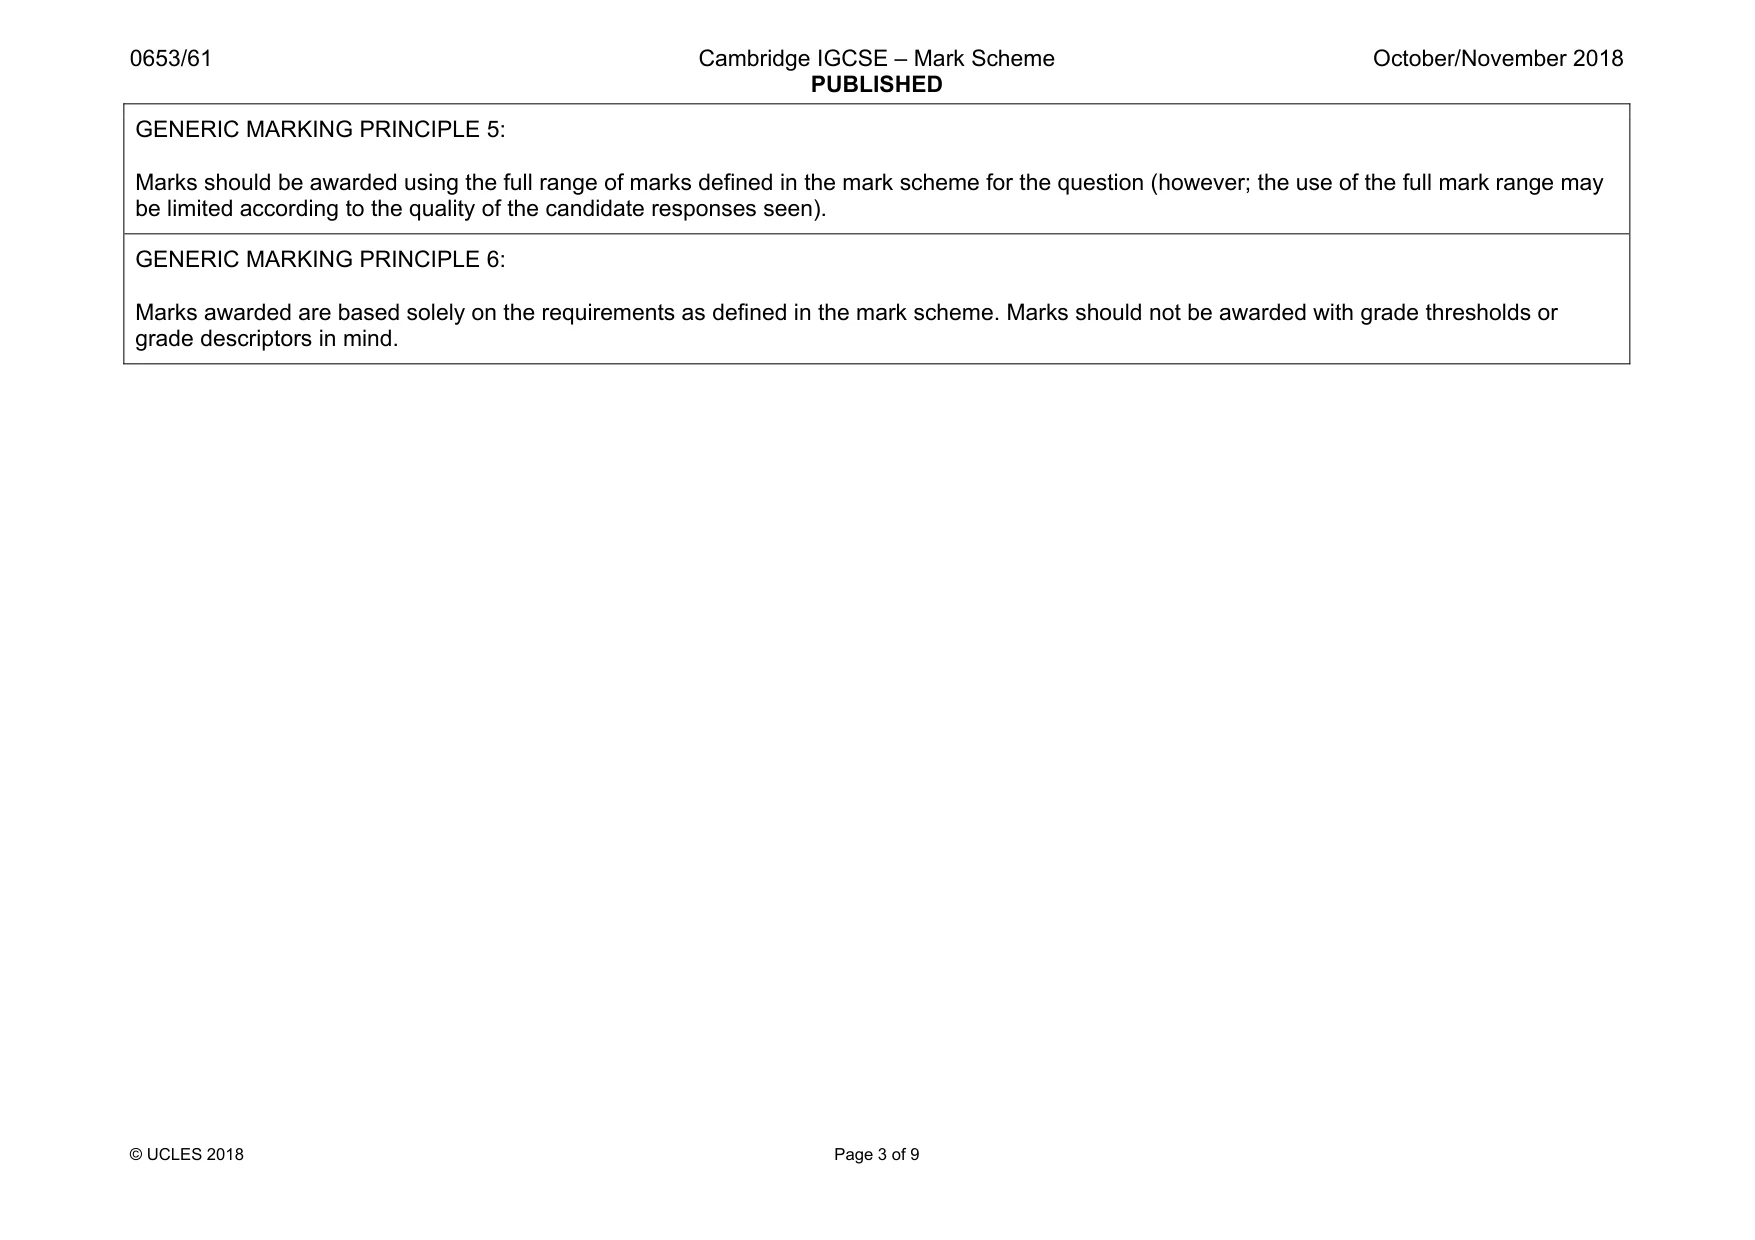
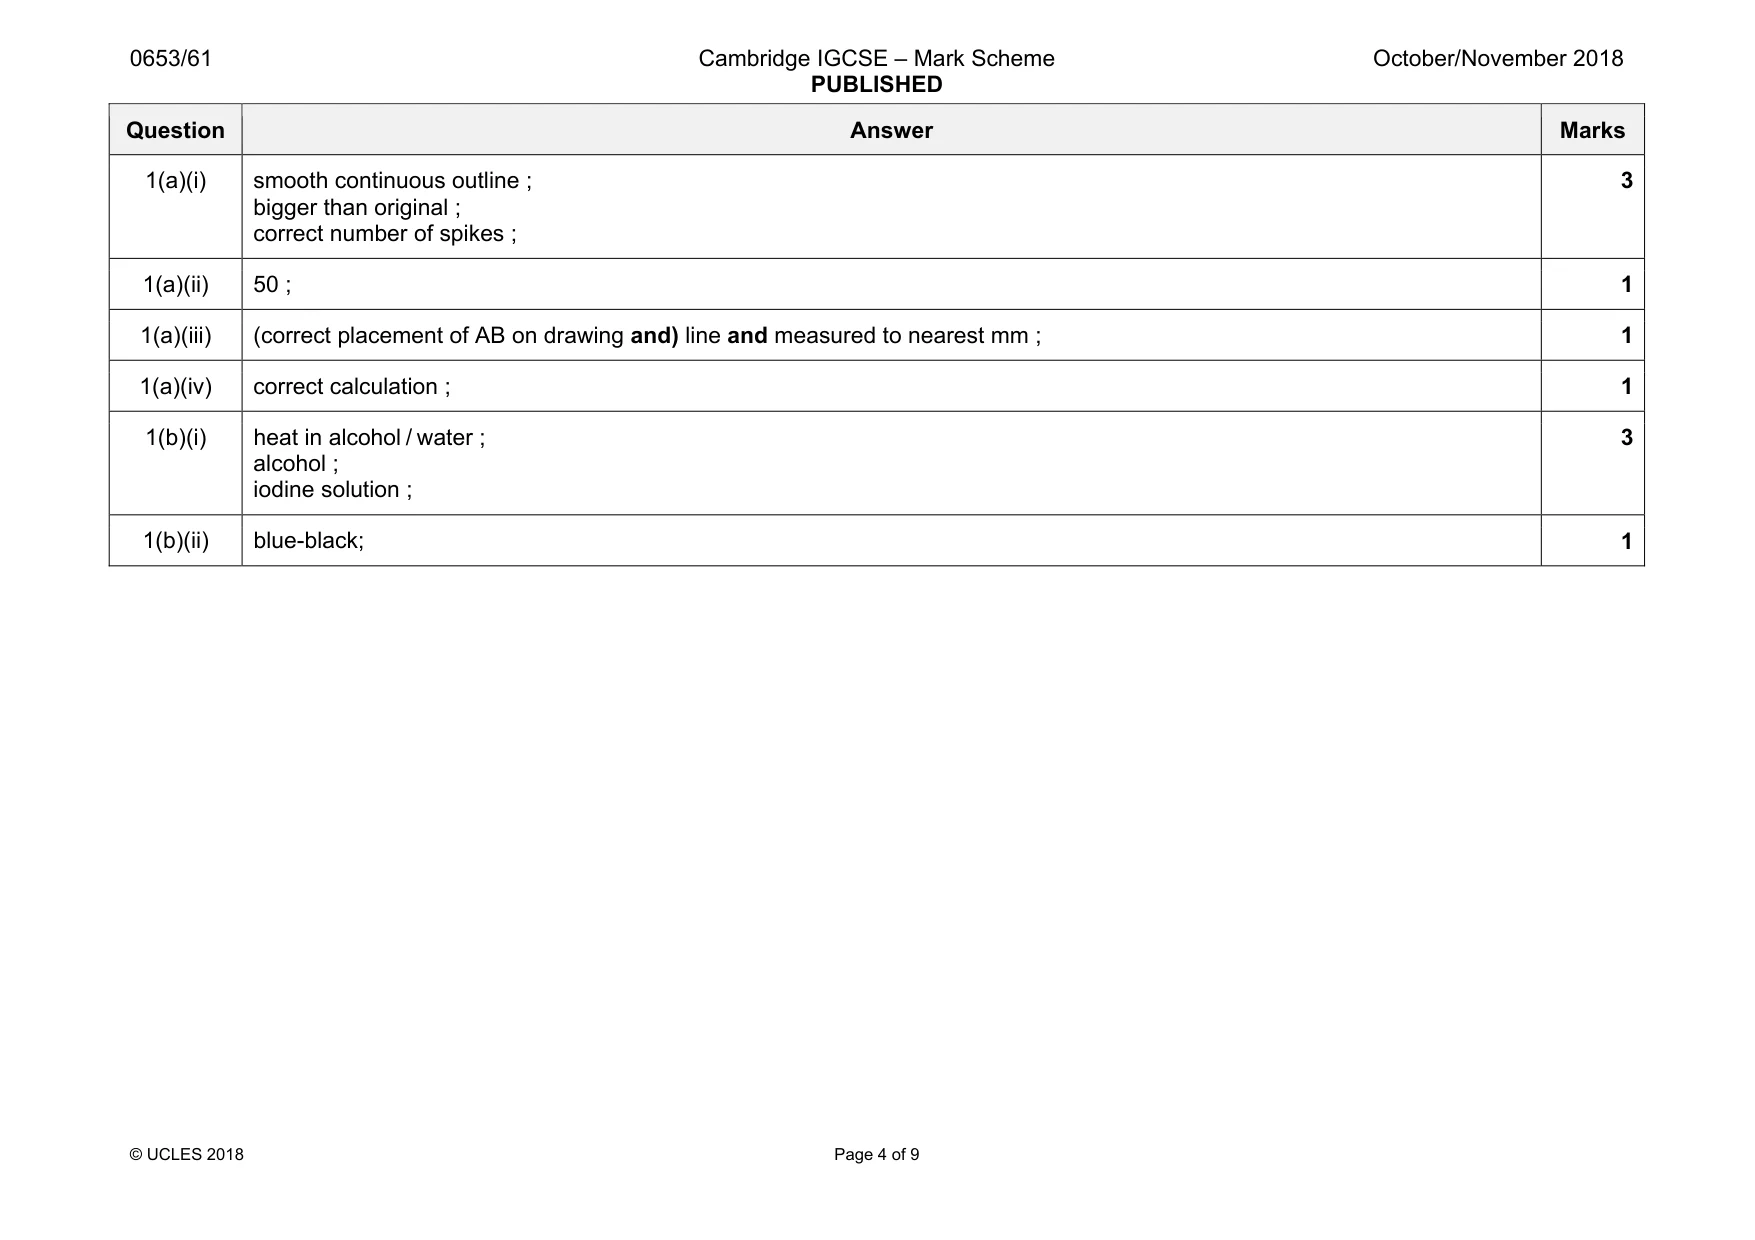
Mark scheme: 1(a)(i) smooth continuous outline ; bigger than original ; correct number of spikes ; 3 1(a)(ii) 50 ; 1 1(a)(iii) (correct placement of AB on drawing and) line and measured to nearest mm ; 1 1(a)(iv) correct calculation ; 1 1(b)(i) heat in alcohol / water ; alcohol ; iodine solution ; 3 1(b)(ii) blue-black; 1
Q2 · A student investigates the temperature changes when solid H reacts with solution J
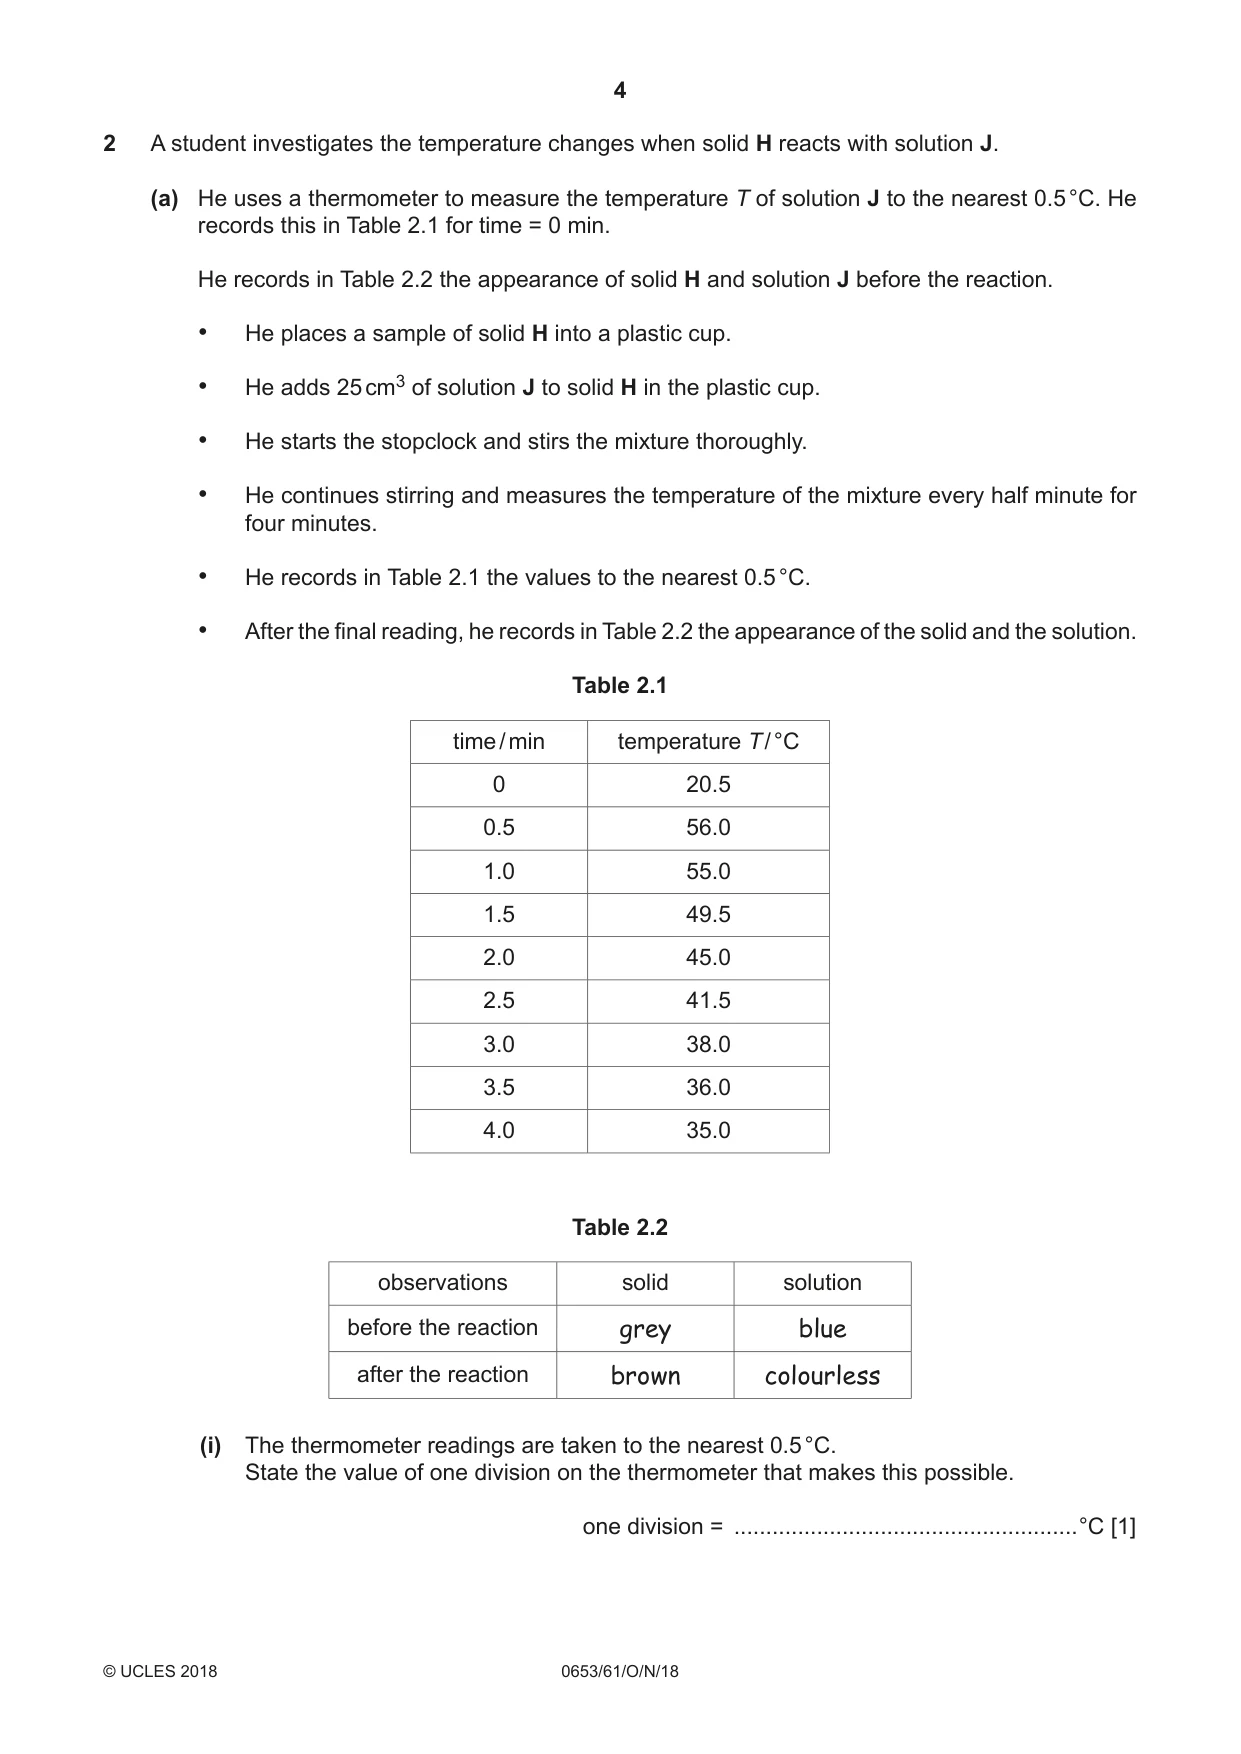
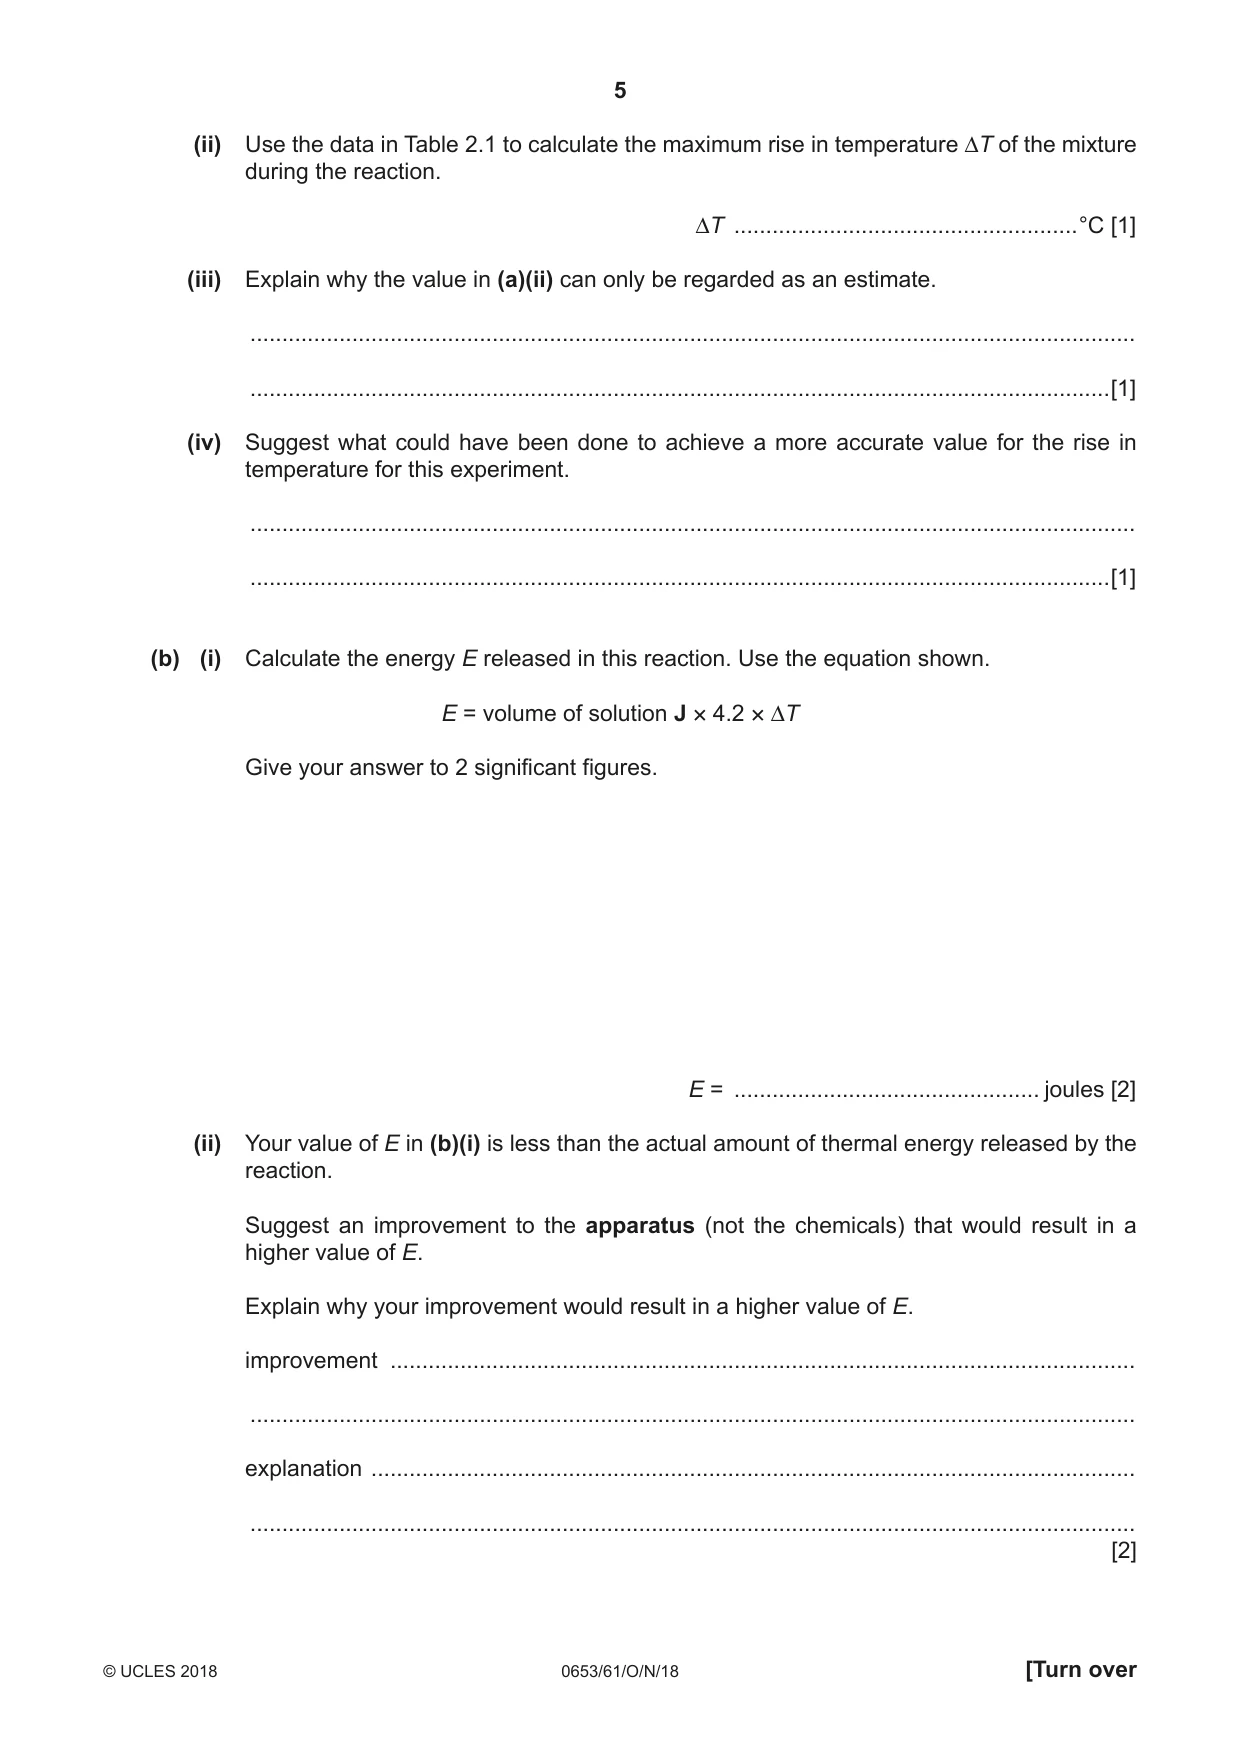
2 A student investigates the temperature changes when solid H reacts with solution J. (a) He uses a thermometer to measure the temperature T of solution J to the nearest 0.5 °C. He records this in Table 2.1 for time = 0 min. He records in Table 2.2 the appearance of solid H and solution J before the reaction. • He places a sample of solid H into a plastic cup. • He adds 25 cm3 of solution J to solid H in the plastic cup. • He starts the stopclock and stirs the mixture thoroughly. • He continues stirring and measures the temperature of the mixture every half minute for four minutes. • He records in Table 2.1 the values to the nearest 0.5 °C. • After the final reading, he records in Table 2.2 the appearance of the solid and the solution. Table 2.1 time / min temperature T / °C 0 20.5 0.5 56.0 1.0 55.0 1.5 49.5 2.0 45.0 2.5 41.5 3.0 38.0 3.5 36.0 4.0 35.0 Table 2.2 observations solid solution before the reaction grey blue after the reaction brown colourless (i) The thermometer readings are taken to the nearest 0.5 °C. State the value of one division on the thermometer that makes this possible. one division = ......................................................°C [1] (ii) Use the data in Table 2.1 to calculate the maximum rise in temperature ΔT of the mixture during the reaction. ΔT ......................................................°C [1] (iii) Explain why the value in (a)(ii) can only be regarded as an estimate. ........................................................................................................................................... .......................................................................................................................................[1] (iv) Suggest what could have been done to achieve a more accurate value for the rise in temperature for this experiment. ........................................................................................................................................... .......................................................................................................................................[1] (b) (i) Calculate the energy E released in this reaction. Use the equation shown. E = volume of solution J × 4.2 × ΔT Give your answer to 2 significant figures. E = ................................................ joules [2] (ii) Your value of E in (b)(i) is less than the actual amount of thermal energy released by the reaction. Suggest an improvement to the apparatus (not the chemicals) that would result in a higher value of E. Explain why your improvement would result in a higher value of E. improvement ..................................................................................................................... ........................................................................................................................................... explanation ........................................................................................................................ ........................................................................................................................................... [2] (c) Using the observations in Table 2.2, the student concludes that solution J contains the copper(II) ion, Cu2+. Describe a test that the student could use to confirm that solution J contains the copper(II) ion, Cu2+. Include the observations for a positive test. test ............................................................................................................................................ ................................................................................................................................................... observations ............................................................................................................................. ................................................................................................................................................... [2]
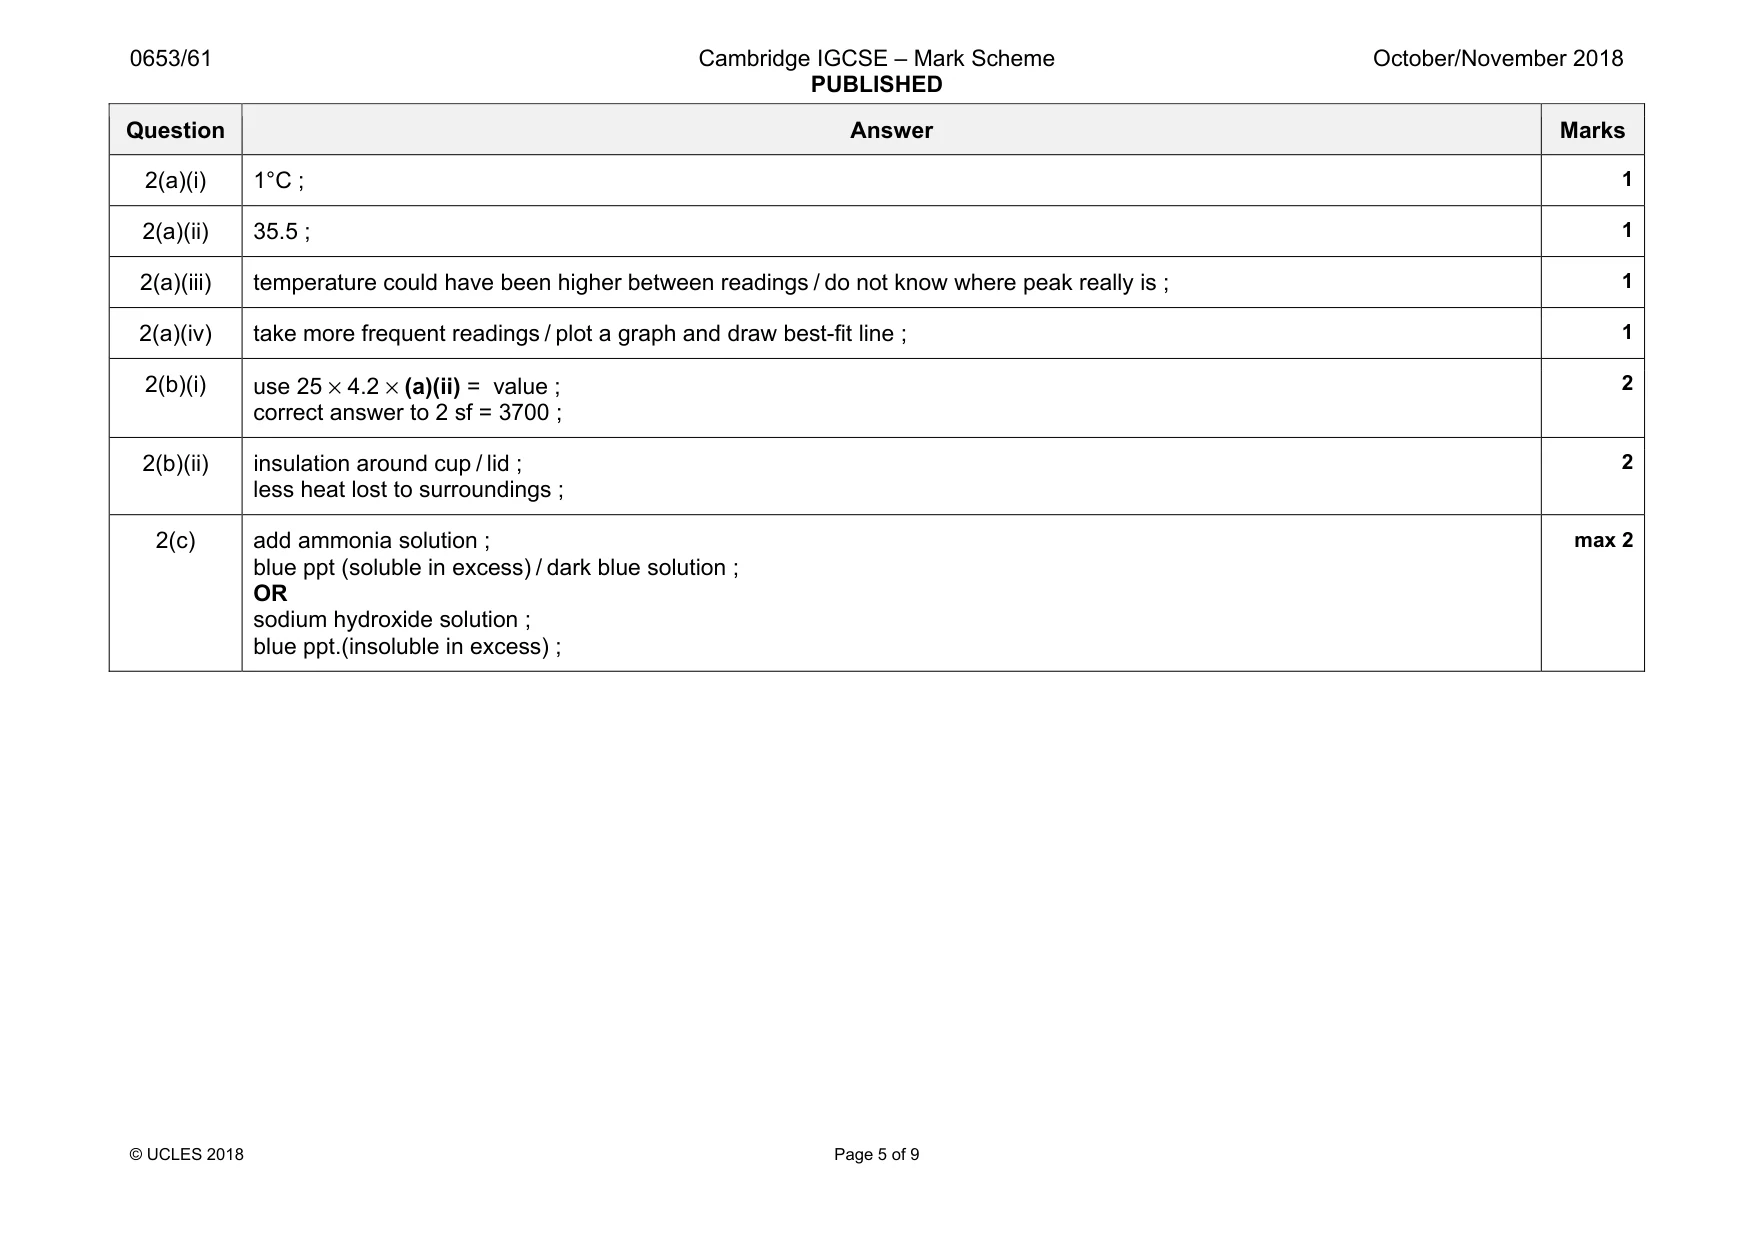
Mark scheme: 2(a)(i) 1°C ; 2(a)(ii) 35.5 ; 1 2(a)(iii) temperature could have been higher between readings / do not know where peak really is ; 1 2(a)(iv) take more frequent readings / plot a graph and draw best-fit line ; 1 2(b)(i) use 25 × 4.2 × (a)(ii) = value ; correct answer to 2 sf = 3700 ; 2 2(b)(ii) insulation around cup / lid ; less heat lost to surroundings ; 2 2(c) add ammonia solution ; blue ppt (soluble in excess) / dark blue solution ; OR sodium hydroxide solution ; blue ppt.(insoluble in excess) ; max 2
More questions on Physical quantities and measurement techniques
Q3 · A student measures the acceleration of free fall g using a spring
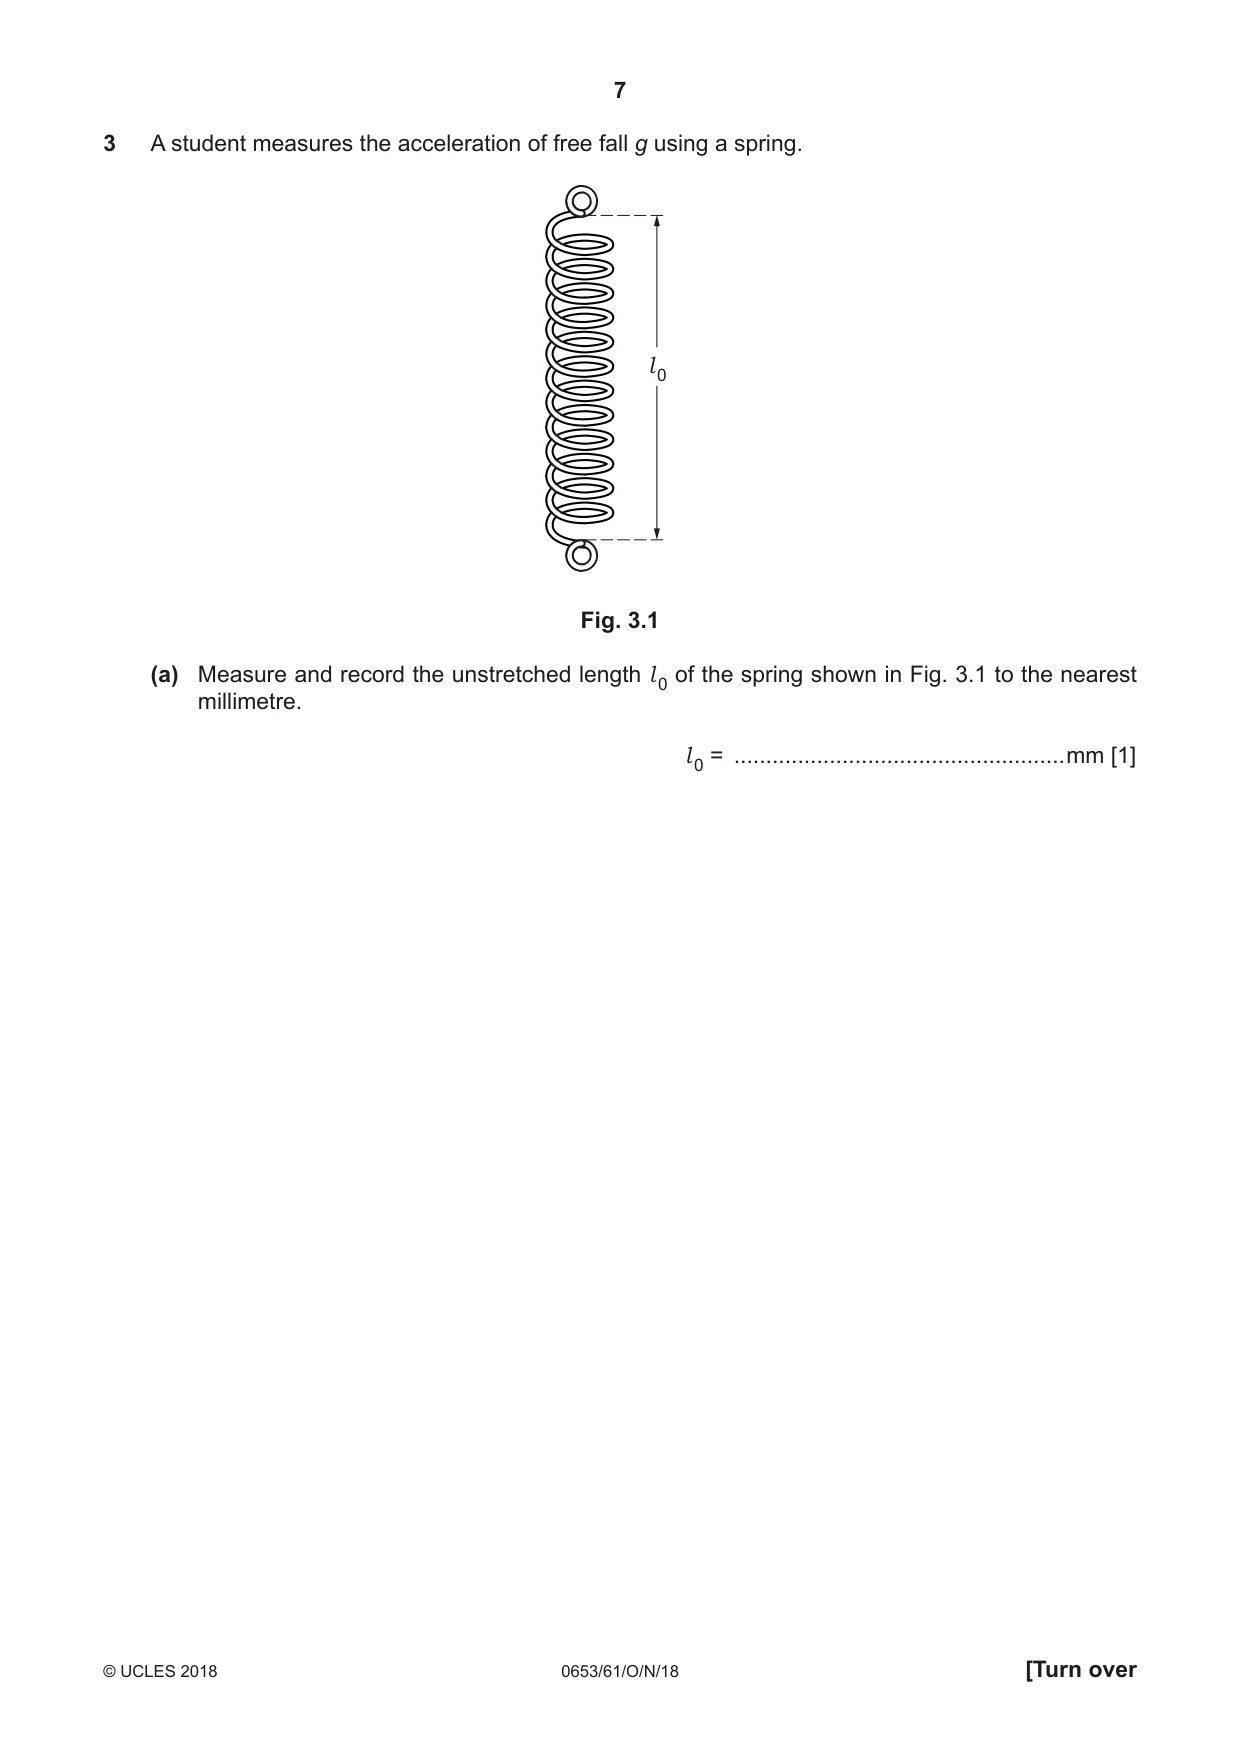
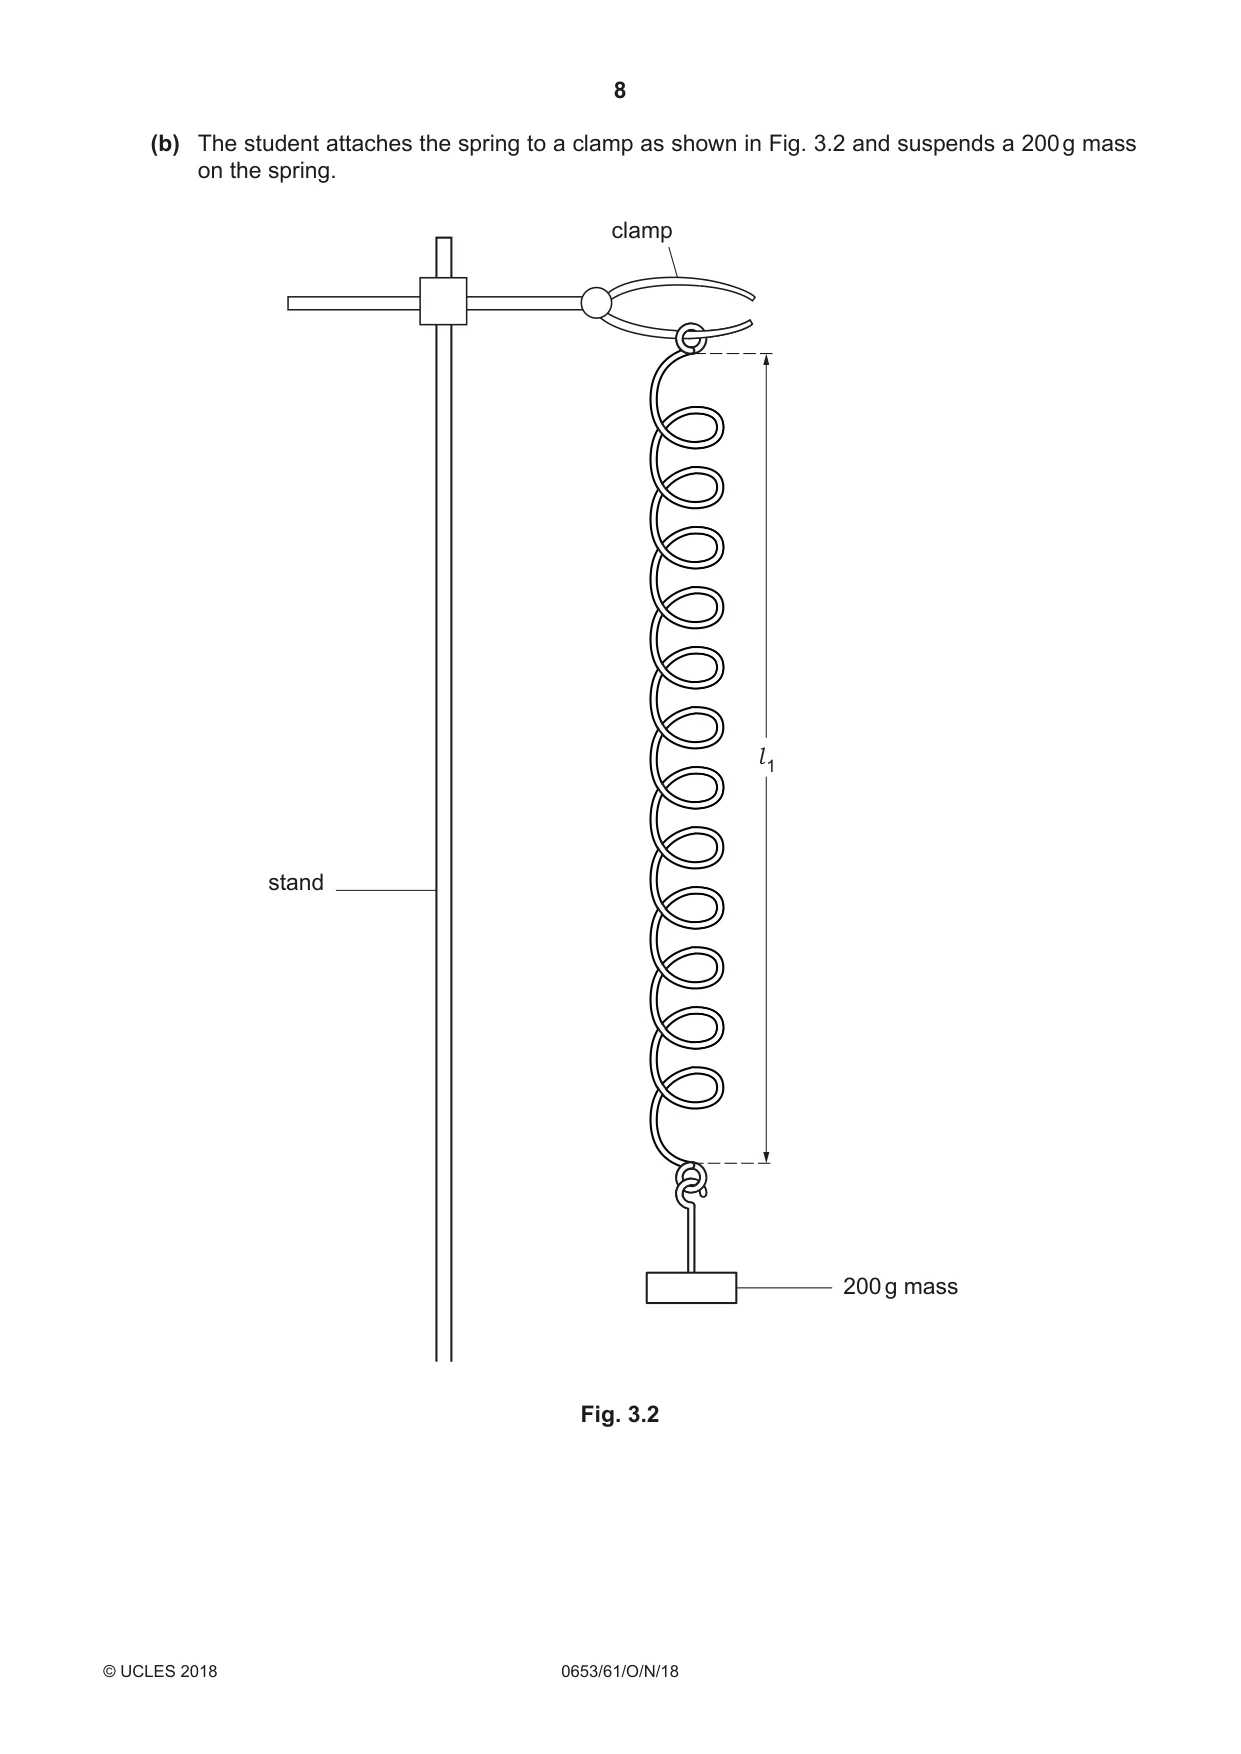
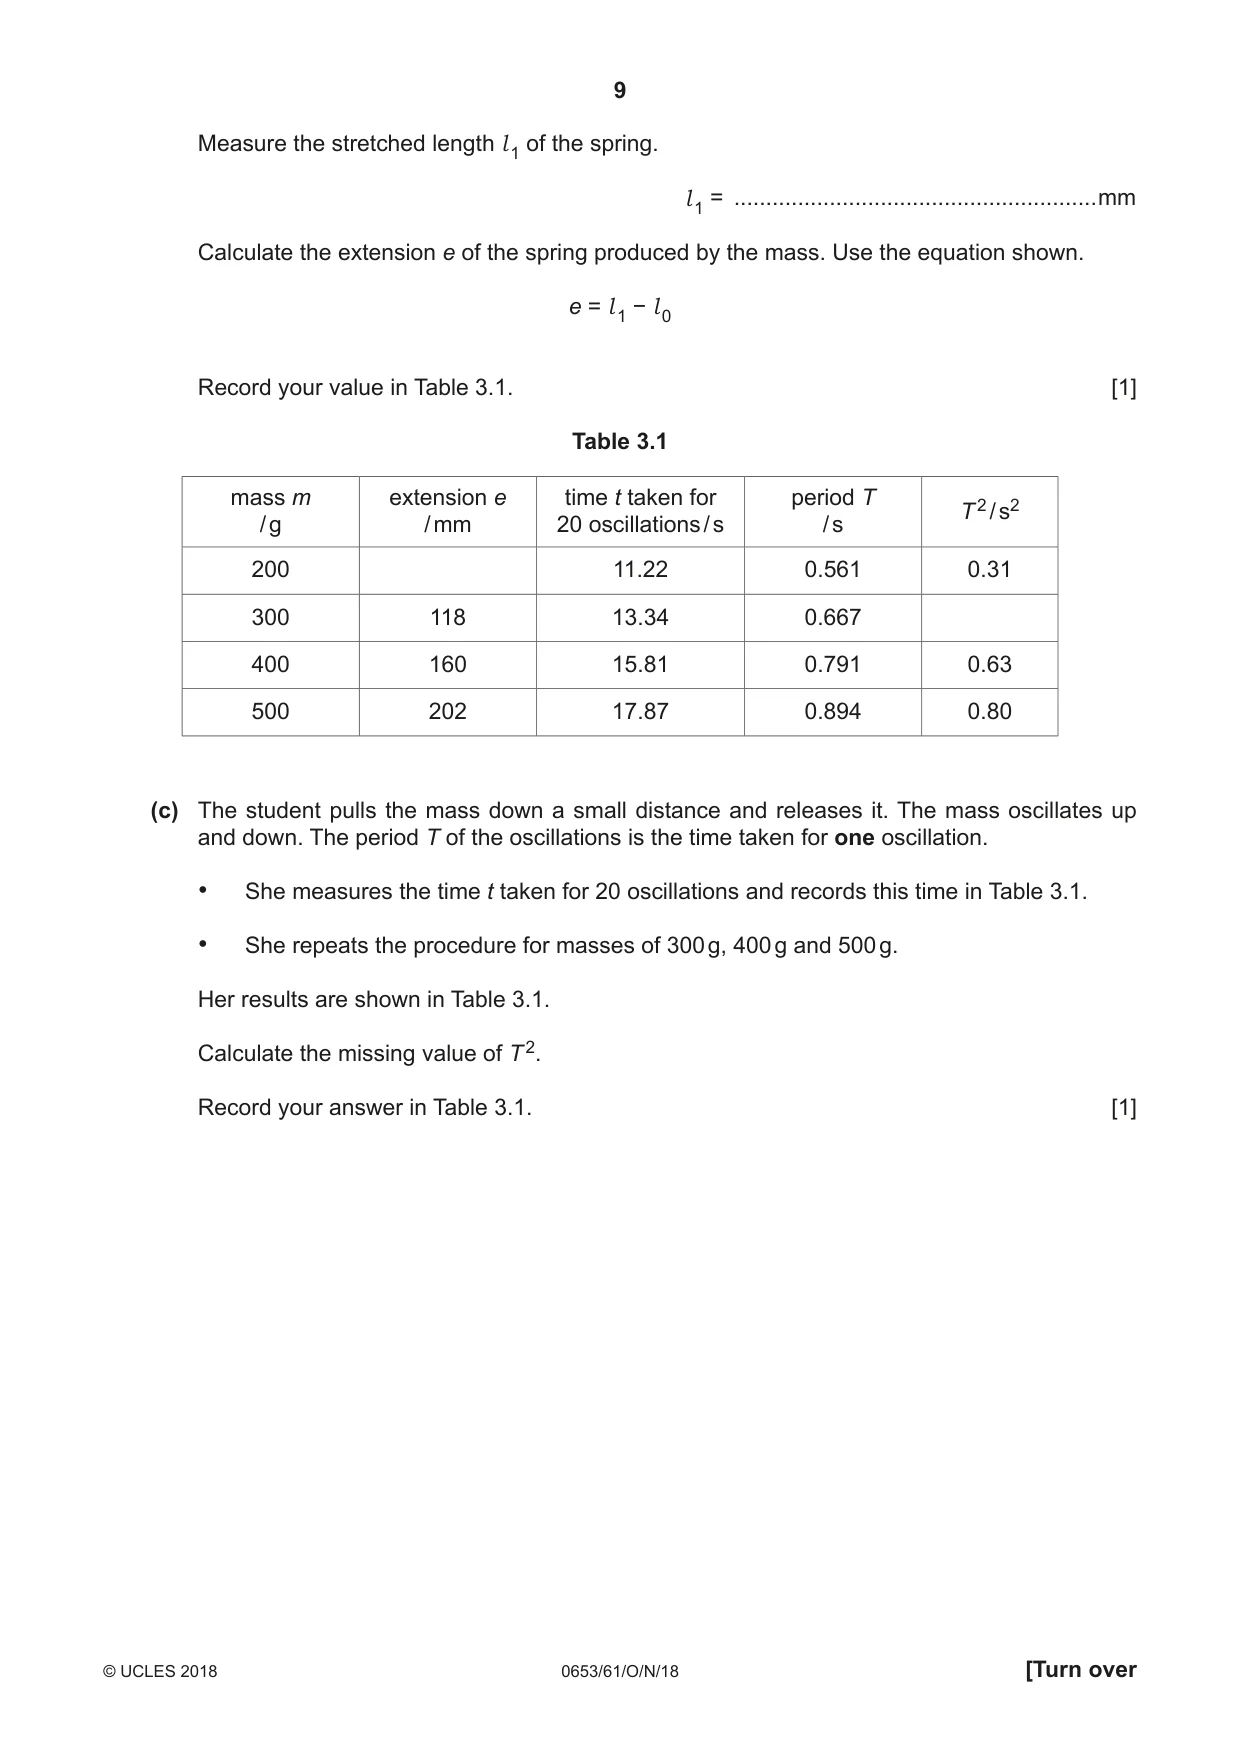
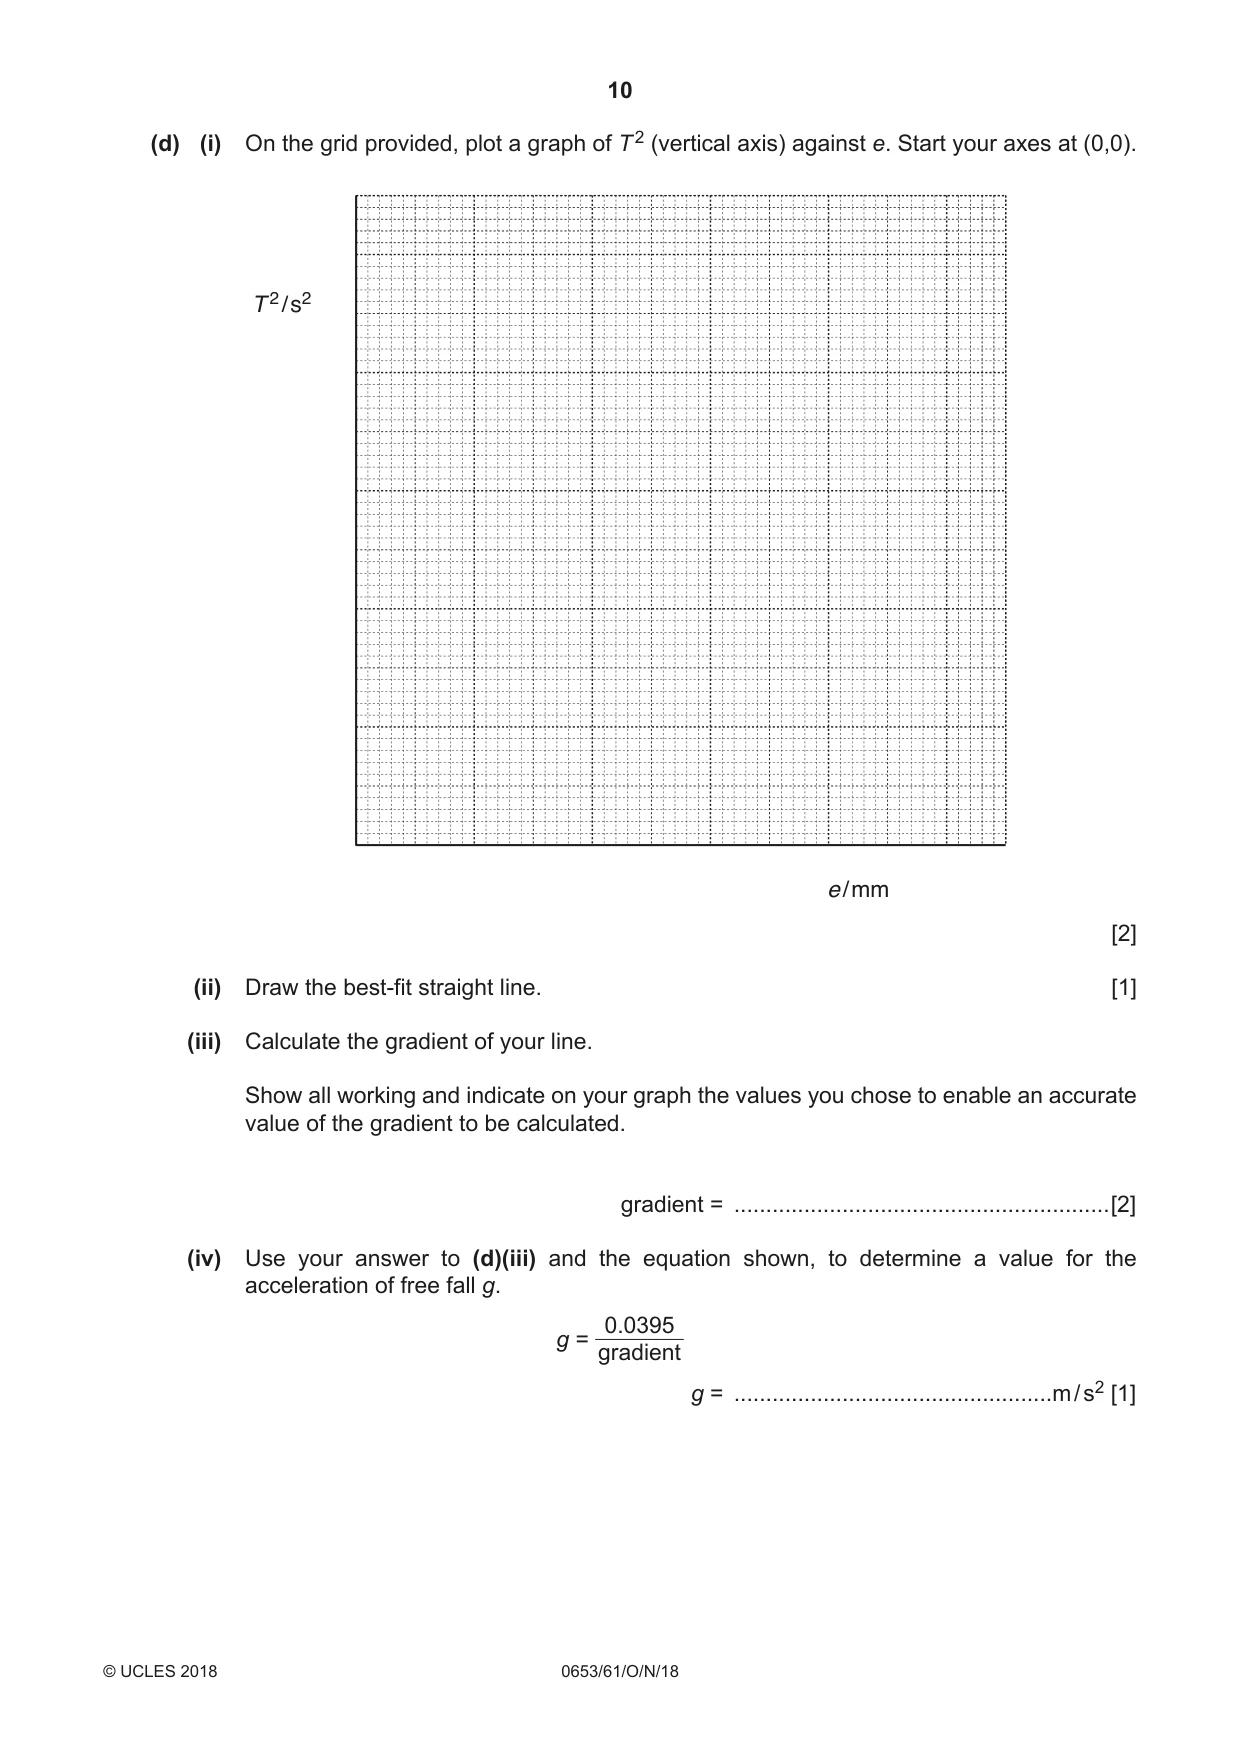
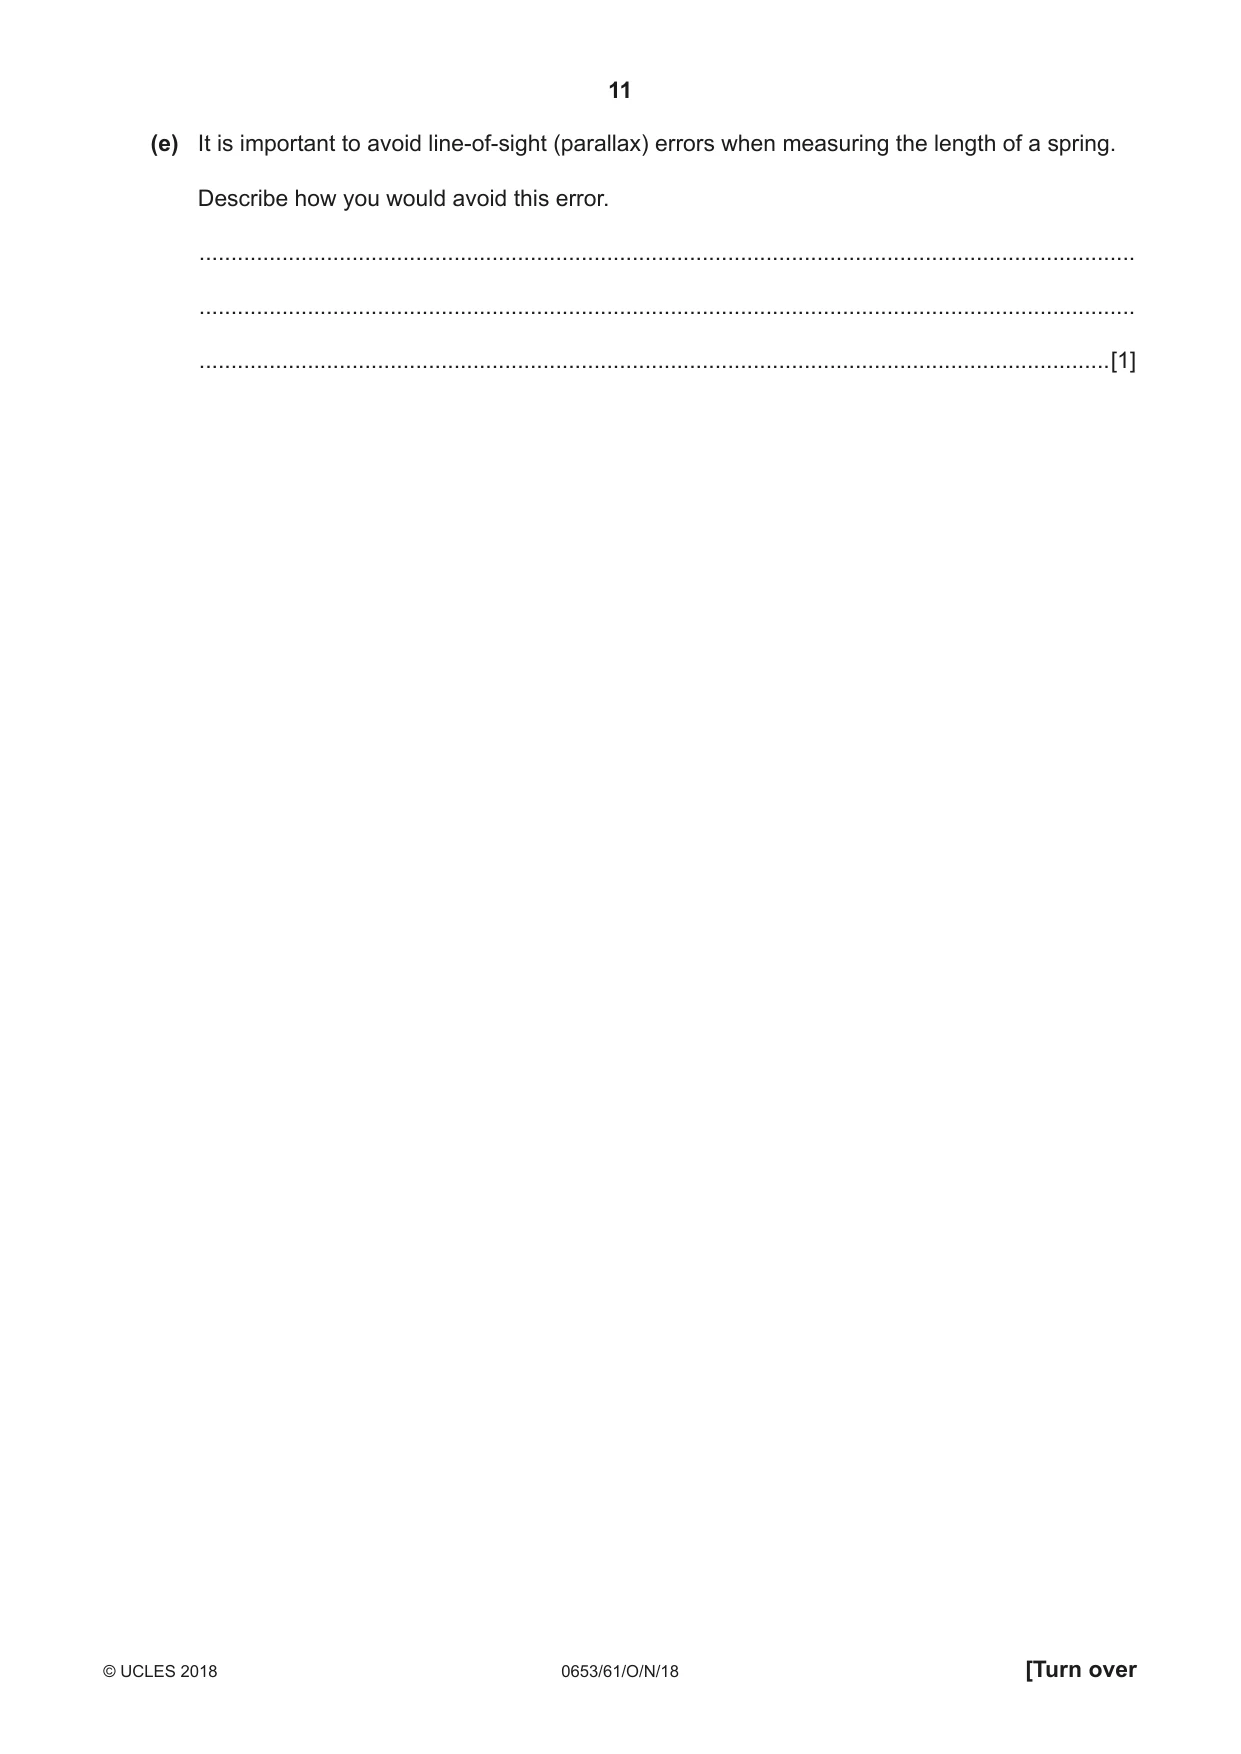
3 A student measures the acceleration of free fall g using a spring. l 0 Fig. 3.1 (a) Measure and record the unstretched length l 0 of the spring shown in Fig. 3.1 to the nearest millimetre. l 0 = ....................................................mm [1] spring to a clamp as shown in Fig. 3.2 and suspends a 200 g mass clamp l 1 200 g mass Fig. 3.2 Measure the stretched length l 1 of the spring. l 1 = .........................................................mm Calculate the extension e of the spring produced by the mass. Use the equation shown. e = l 1 − l 0 Record your value in Table 3.1. [1] Table 3.1 mass m extension e time t taken for period T 2 T / s2 / g / mm 20 oscillations / s / s 200 11.22 0.561 0.31 300 118 13.34 0.667 400 160 15.81 0.791 0.63 500 202 17.87 0.894 0.80 (c) The student pulls the mass down a small distance and releases it. The mass oscillates up and down. The period T of the oscillations is the time taken for one oscillation. • She measures the time t taken for 20 oscillations and records this time in Table 3.1. • She repeats the procedure for masses of 300 g, 400 g and 500 g. Her results are shown in Table 3.1. Calculate the missing value of T 2. Record your answer in Table 3.1. [1] (d) (i) On the grid provided, plot a graph of T 2 (vertical axis) against e. Start your axes at (0,0). T 2 / s2 e / mm [2] (ii) Draw the best-fit straight line. [1] (iii) Calculate the gradient of your line. Show all working and indicate on your graph the values you chose to enable an accurate value of the gradient to be calculated. gradient = ...........................................................[2] (iv) Use your answer to (d)(iii) and the equation shown, to determine a value for the acceleration of free fall g. 0.0395 g = gradient g = ..................................................m / s2 [1] (e) It is important to avoid line-of-sight (parallax) errors when measuring the length of a spring. Describe how you would avoid this error. ................................................................................................................................................... ................................................................................................................................................... ...............................................................................................................................................[1]
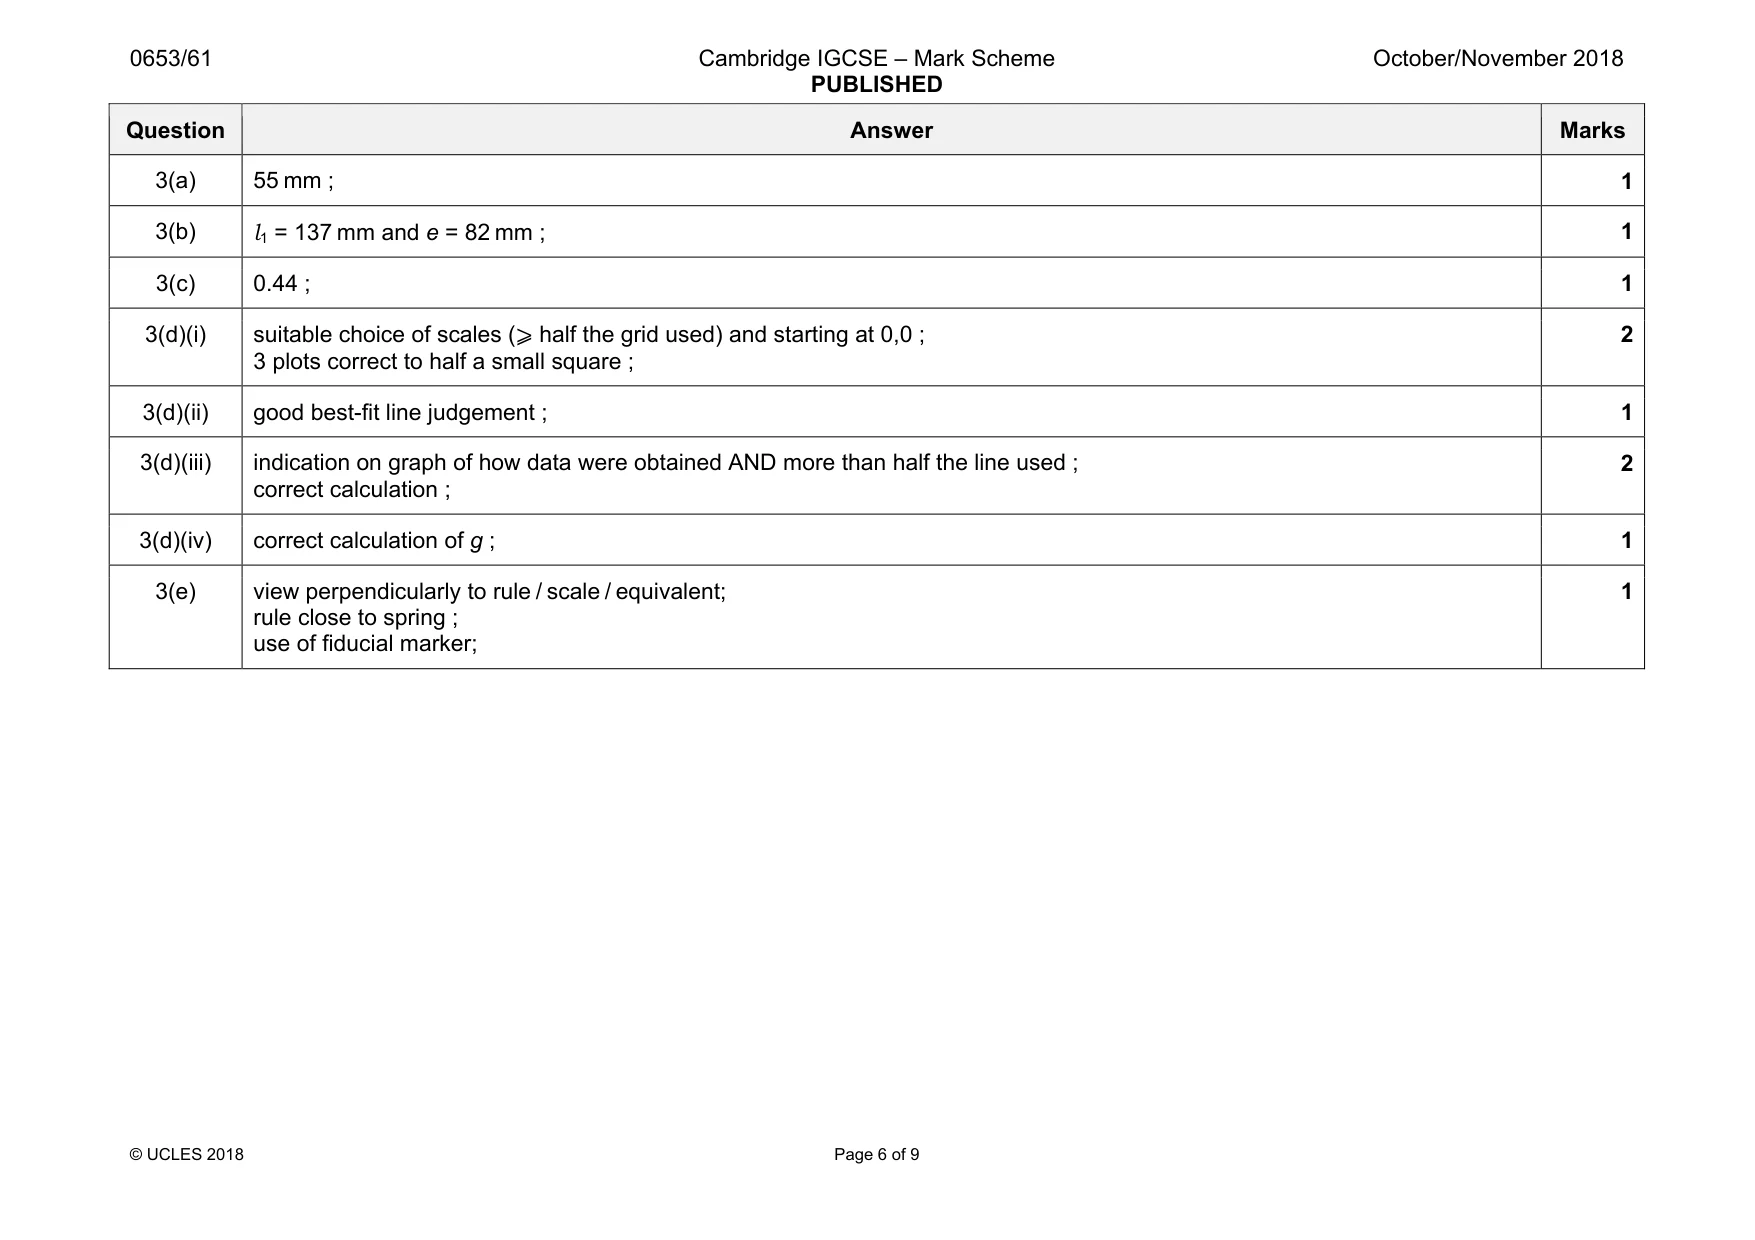
Mark scheme: 3(a) 55 mm ; 1 3(b) l1 = 137 mm and e = 82 mm ; 1 3(c) 0.44 ; 1 3(d)(i) suitable choice of scales (⩾ half the grid used) and starting at 0,0 ; 3 plots correct to half a small square ; 2 3(d)(ii) good best-fit line judgement ; 1 3(d)(iii) indication on graph of how data were obtained AND more than half the line used ; correct calculation ; 2 3(d)(iv) correct calculation of g ; 1 3(e) view perpendicularly to rule / scale / equivalent; rule close to spring ; use of fiducial marker; 1
Q4 · A student investigates oxygen consumption in respiring maggots
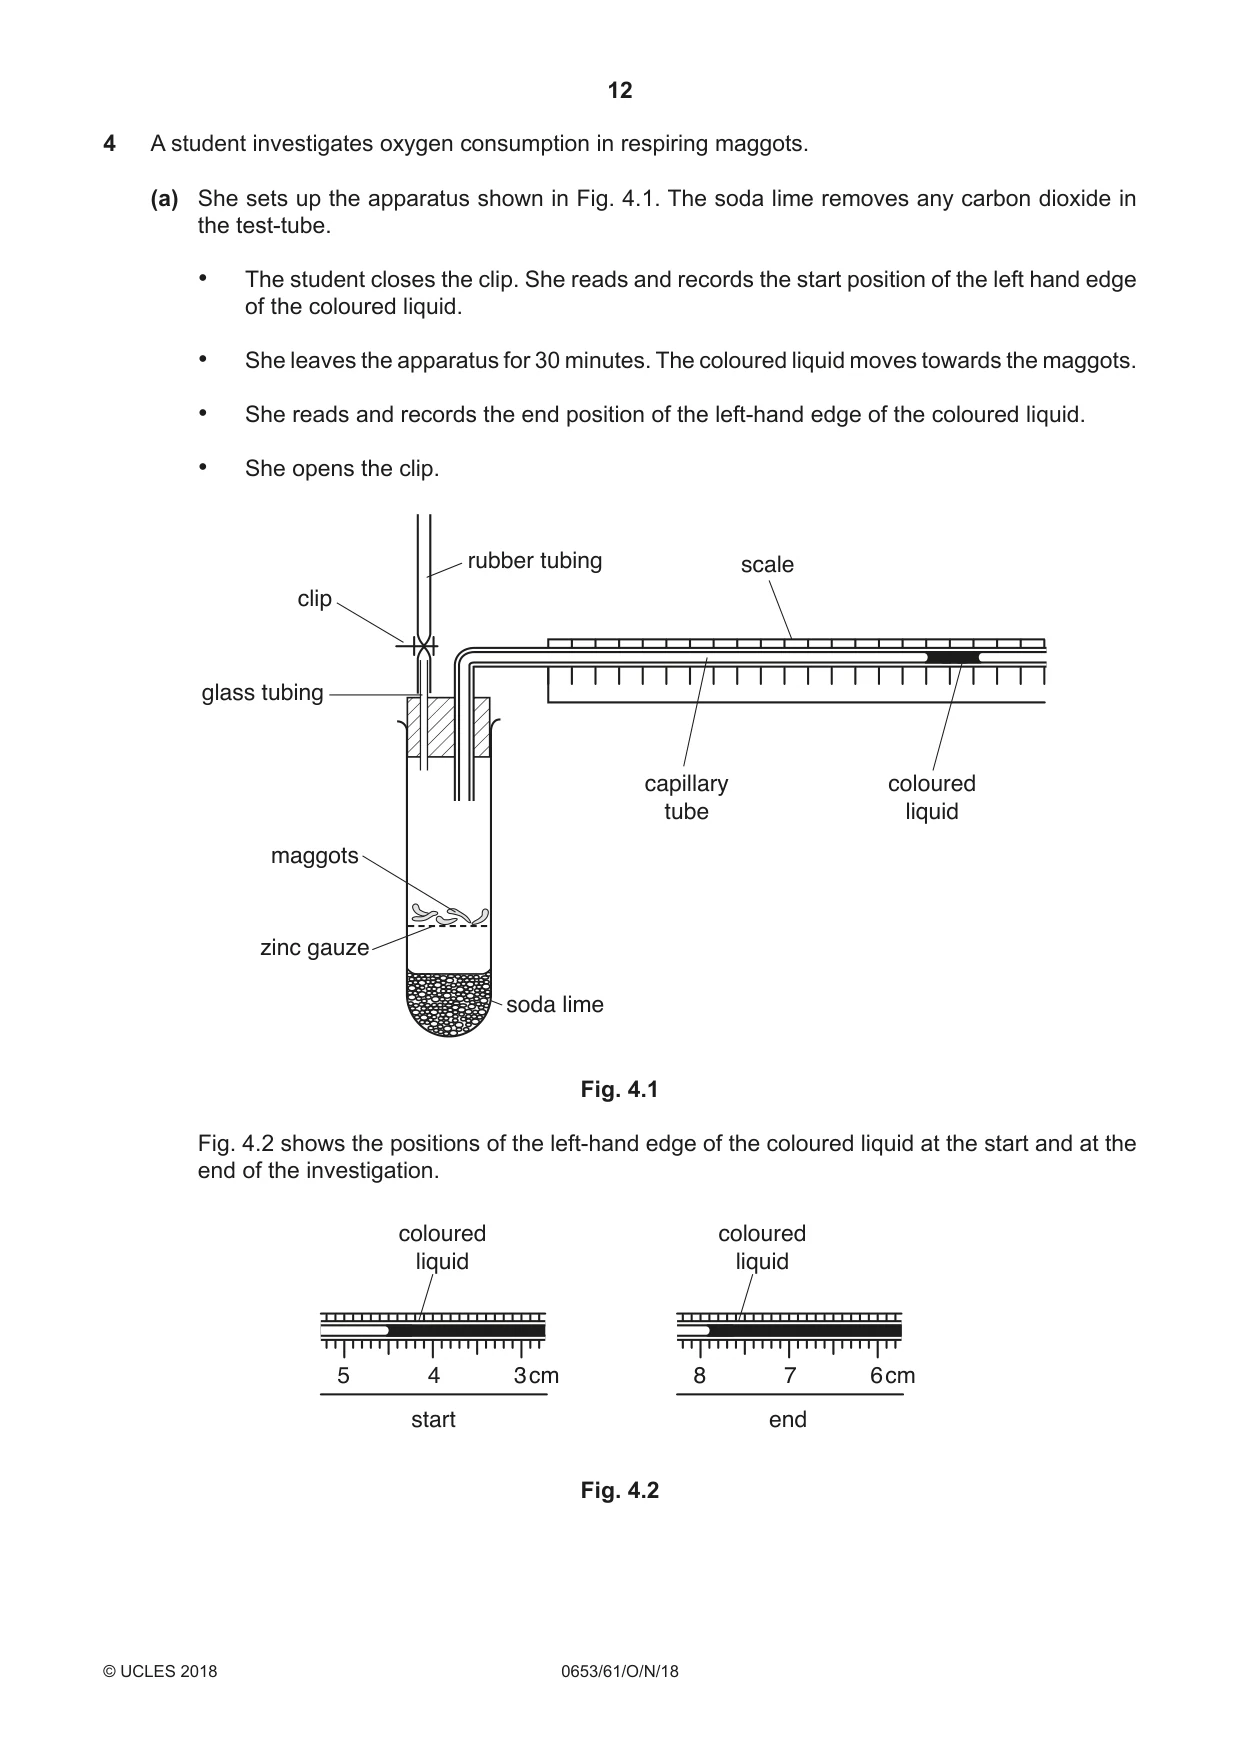
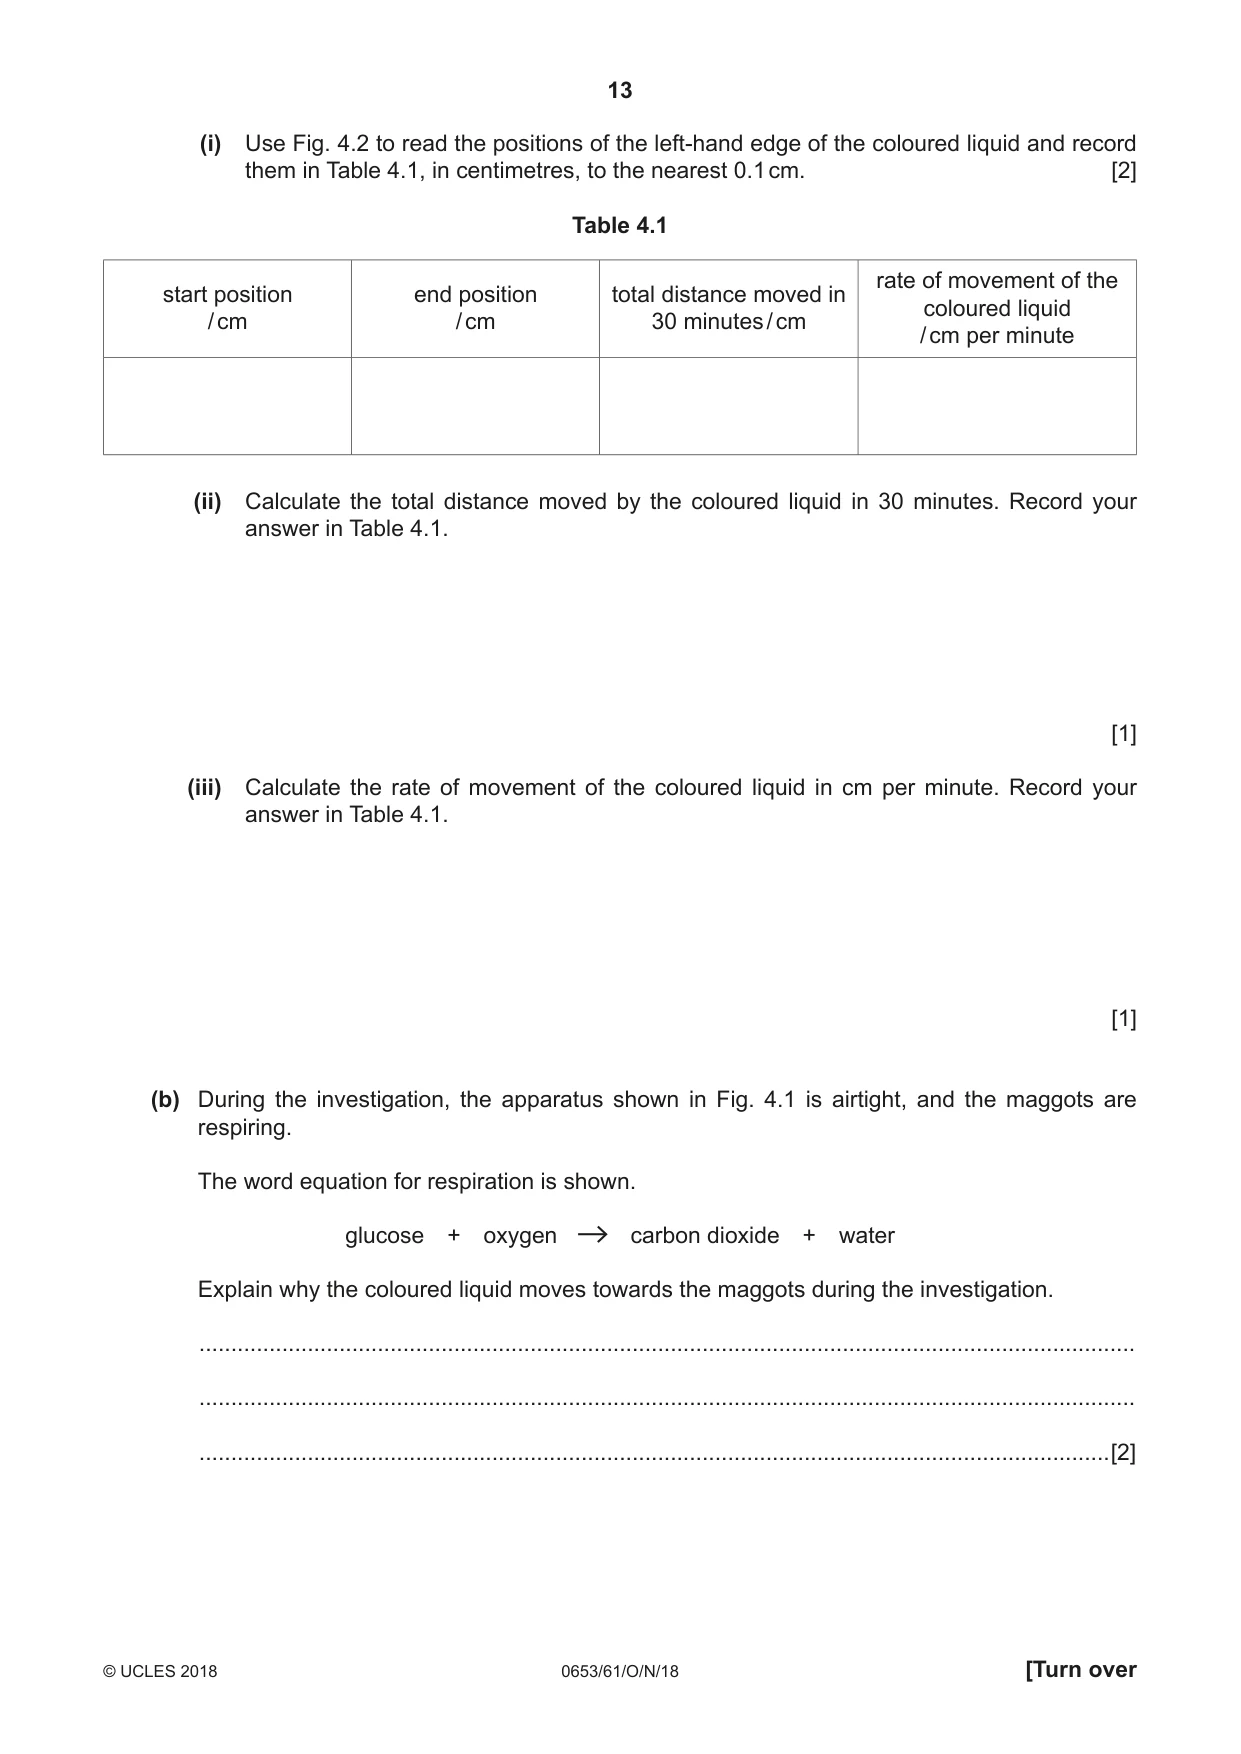
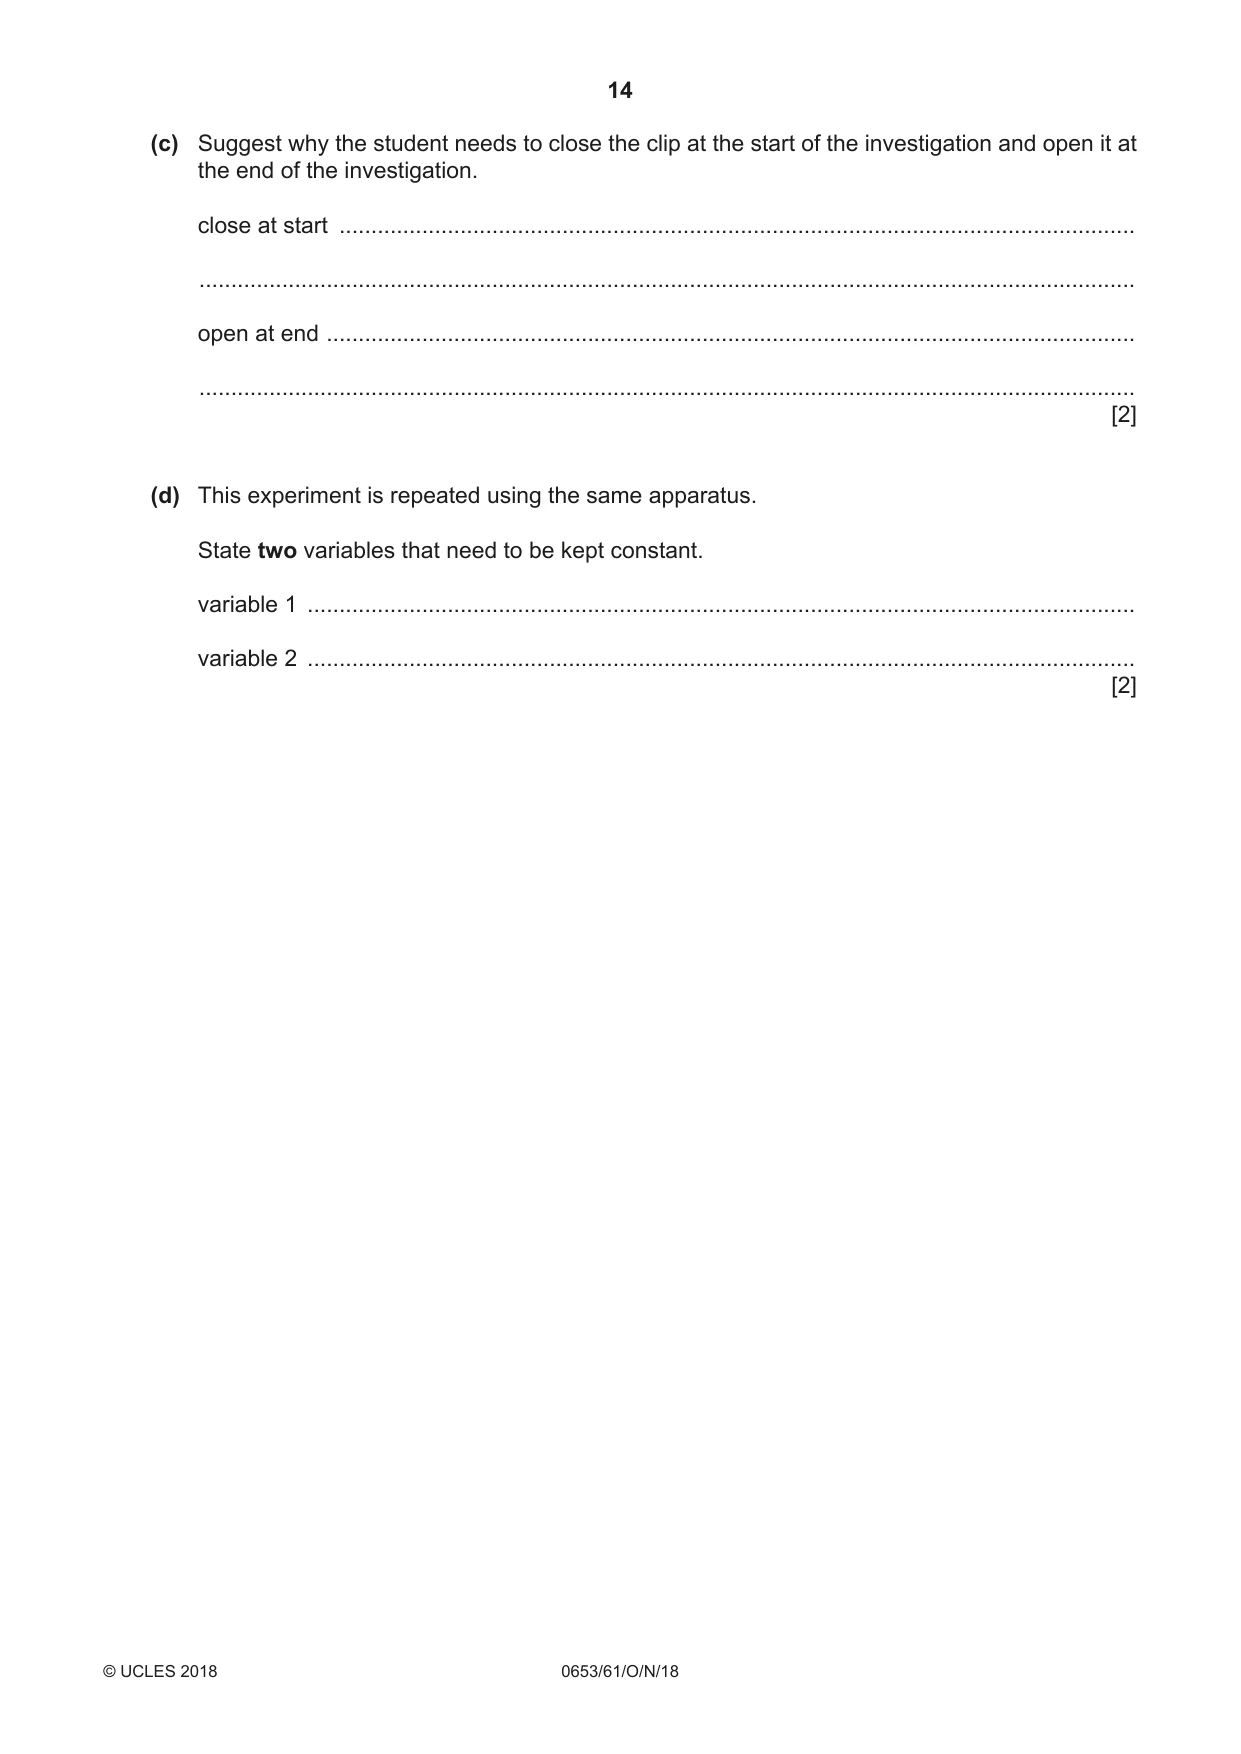
4 A student investigates oxygen consumption in respiring maggots. (a) She sets up the apparatus shown in Fig. 4.1. The soda lime removes any carbon dioxide in the test-tube. • The student closes the clip. She reads and records the start position of the left hand edge of the coloured liquid. • She leaves the apparatus for 30 minutes. The coloured liquid moves towards the maggots. • She reads and records the end position of the left-hand edge of the coloured liquid. • She opens the clip. rubber tubing scale clip glass tubing capillary coloured tube liquid maggots zinc gauze soda lime Fig. 4.1 Fig. 4.2 shows the positions of the left-hand edge of the coloured liquid at the start and at the end of the investigation. coloured coloured liquid liquid 5 4 3 cm 8 7 6 cm start end Fig. 4.2 (i) Use Fig. 4.2 to read the positions of the left-hand edge of the coloured liquid and record them in Table 4.1, in centimetres, to the nearest 0.1 cm. [2] Table 4.1 rate of movement of the start position end position total distance moved in coloured liquid / cm / cm 30 minutes / cm / cm per minute (ii) Calculate the total distance moved by the coloured liquid in 30 minutes. Record your answer in Table 4.1. [1] (iii) Calculate the rate of movement of the coloured liquid in cm per minute. Record your answer in Table 4.1. [1] (b) During the investigation, the apparatus shown in Fig. 4.1 is airtight, and the maggots are respiring. The word equation for respiration is shown. glucose + oxygen carbon dioxide + water Explain why the coloured liquid moves towards the maggots during the investigation. ................................................................................................................................................... ................................................................................................................................................... ...............................................................................................................................................[2] (c) Suggest why the student needs to close the clip at the start of the investigation and open it at the end of the investigation. close at start ............................................................................................................................. ................................................................................................................................................... open at end ............................................................................................................................... ................................................................................................................................................... [2] (d) This experiment is repeated using the same apparatus. State two variables that need to be kept constant. variable 1 .................................................................................................................................. variable 2 .................................................................................................................................. [2]
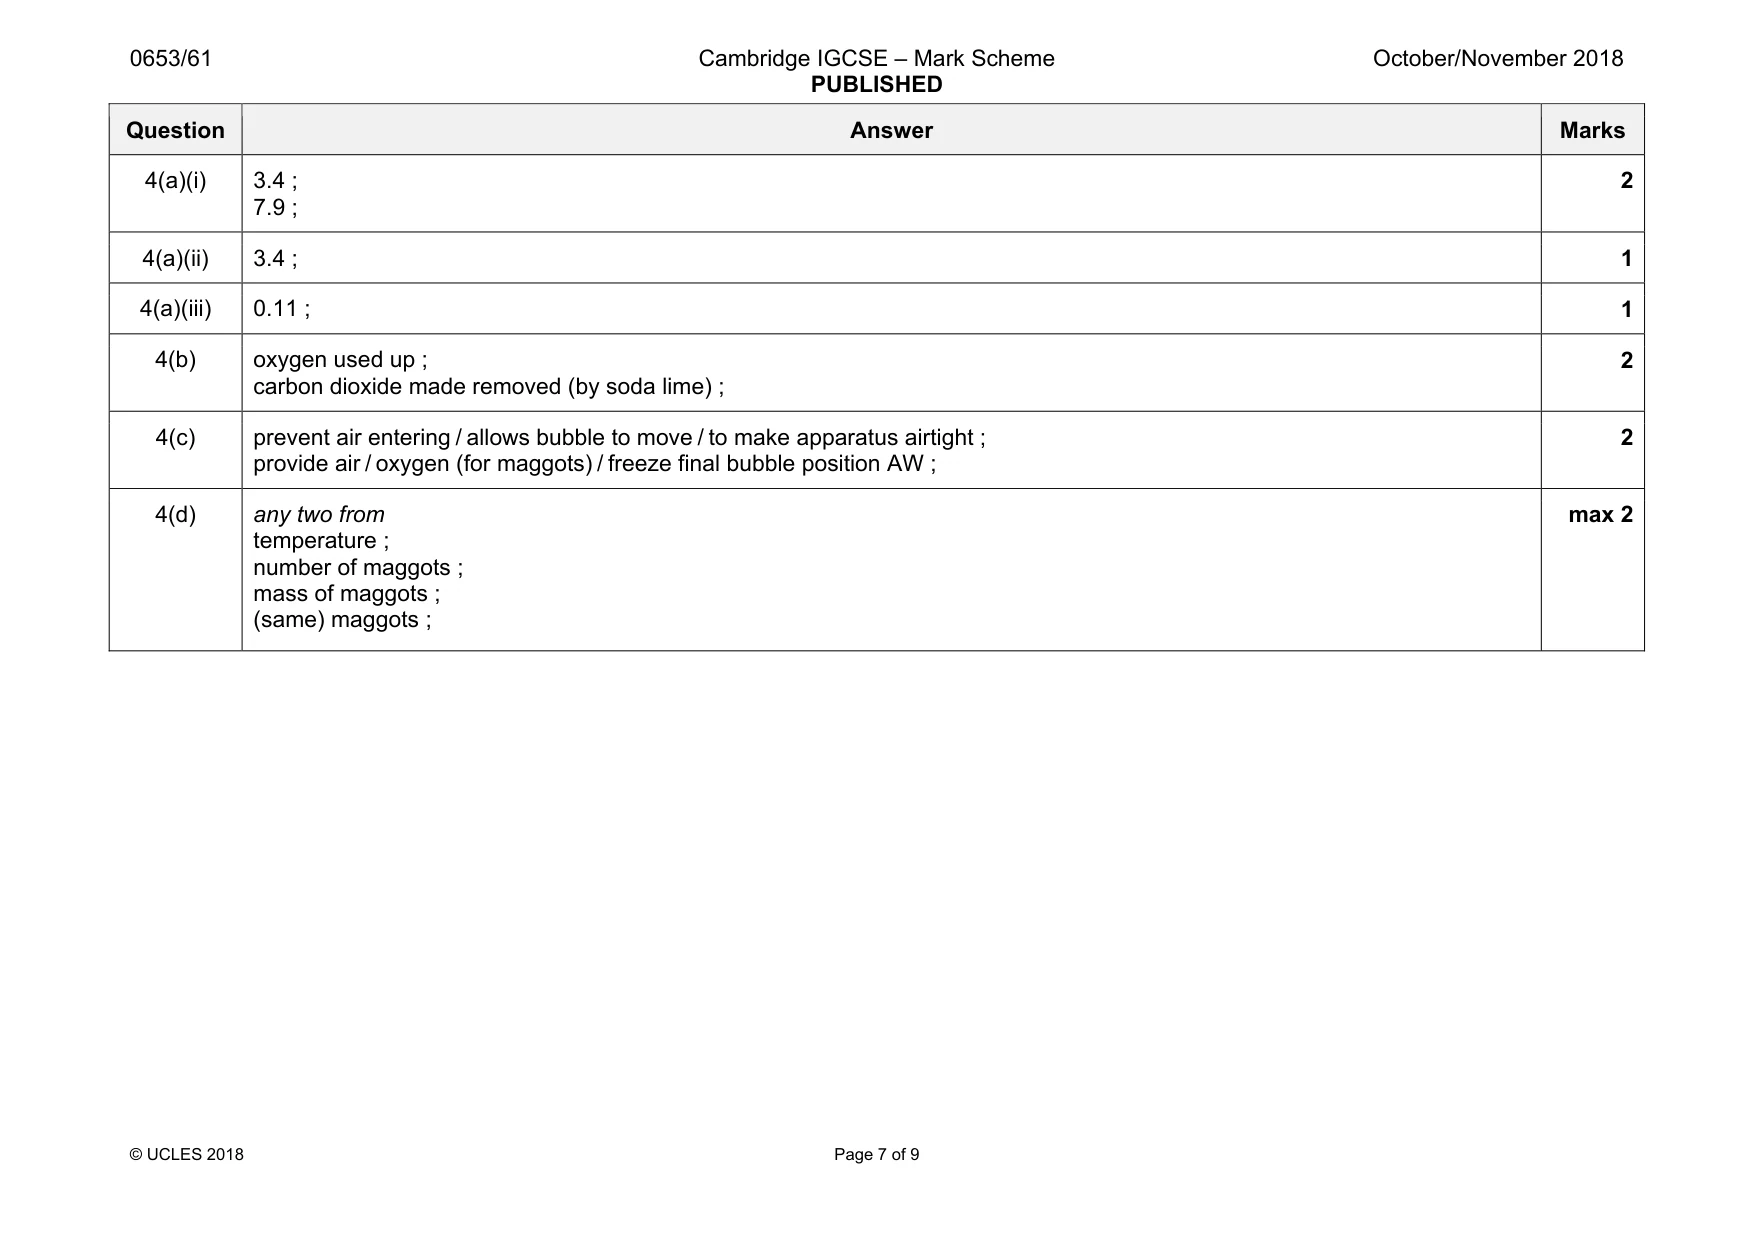
Mark scheme: 4(a)(i) 3.4 ; 7.9 ; 2 4(a)(ii) 3.4 ; 1 4(a)(iii) 0.11 ; 1 4(b) oxygen used up ; carbon dioxide made removed (by soda lime) ; 2 4(c) prevent air entering / allows bubble to move / to make apparatus airtight ; provide air / oxygen (for maggots) / freeze final bubble position AW ; 2 4(d) any two from temperature ; number of maggots ; mass of maggots ; (same) maggots ; max 2
Q5 · A student prepares a pure sample of blue copper sulfate crystals using black copper oxide…
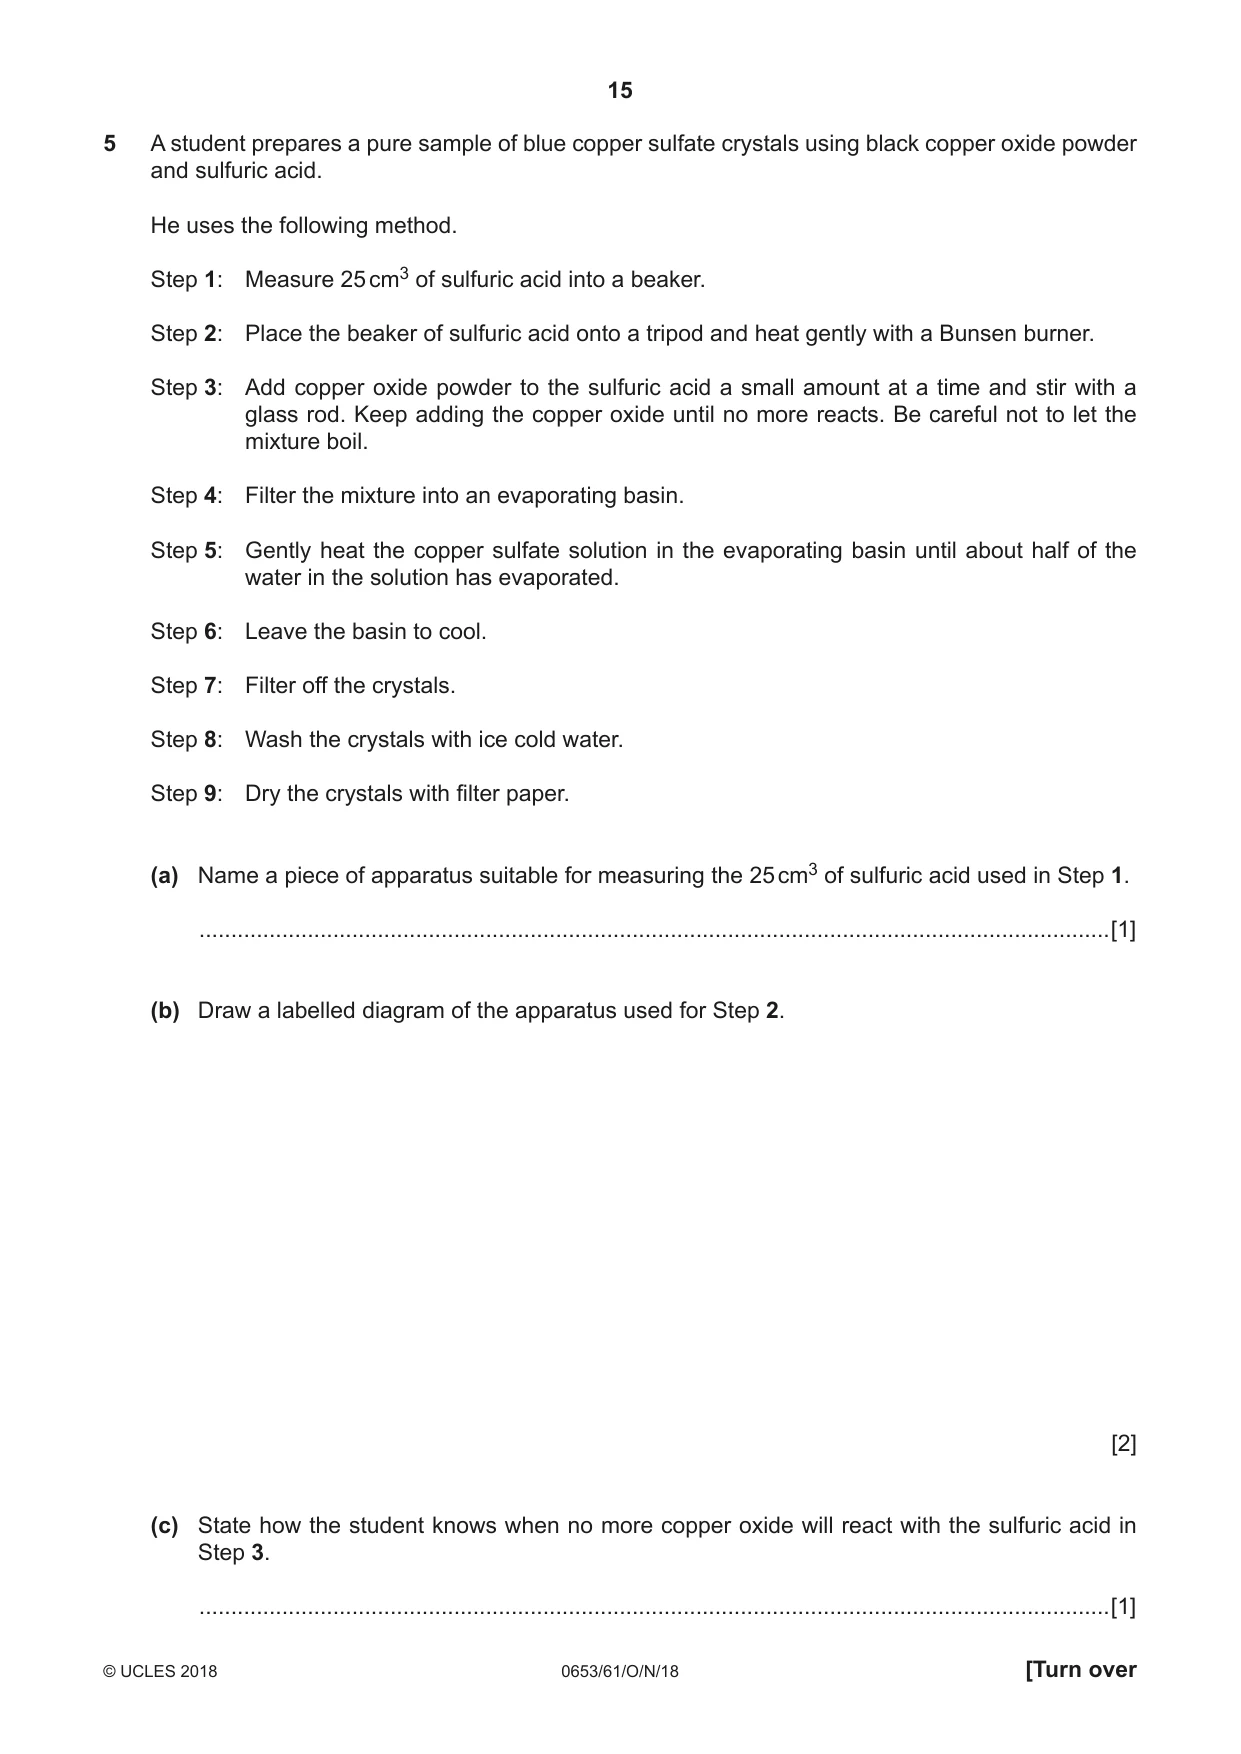
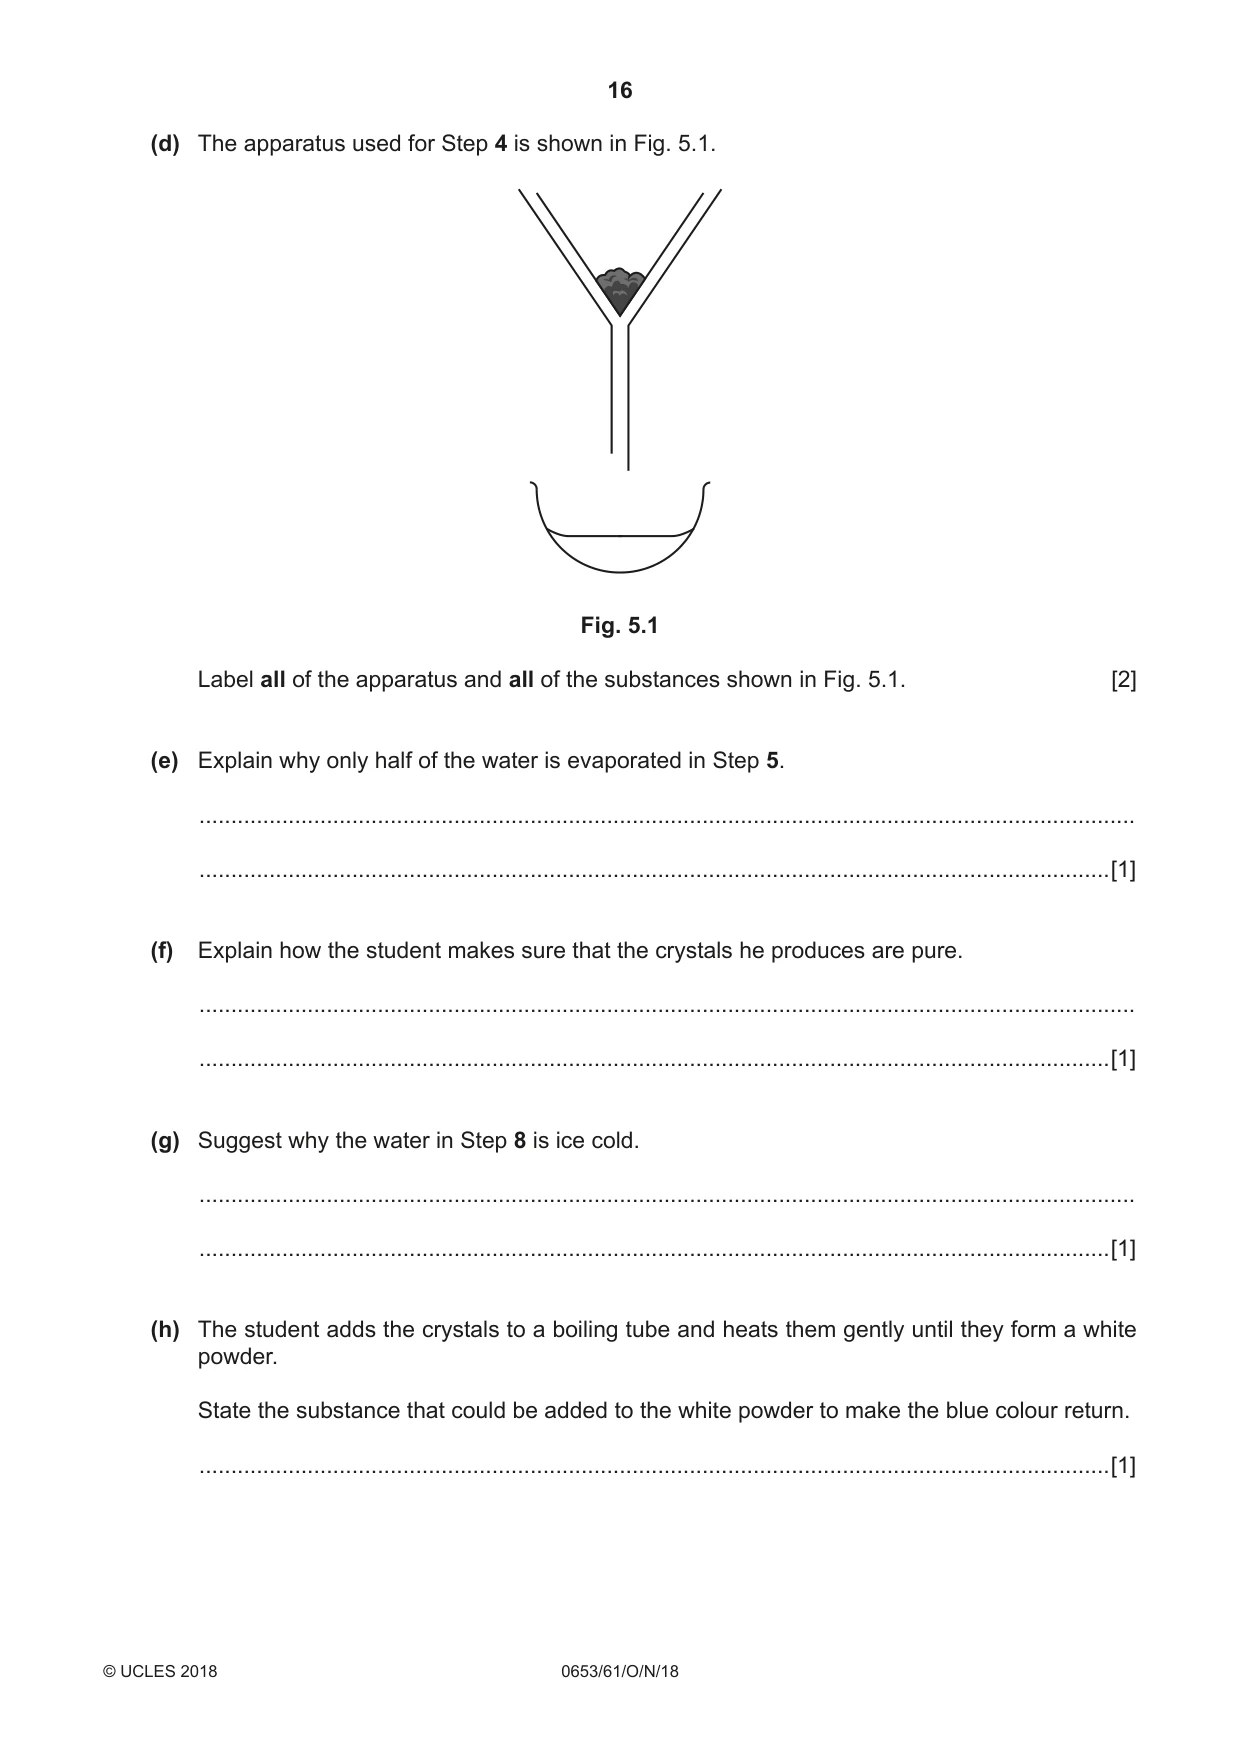
5 A student prepares a pure sample of blue copper sulfate crystals using black copper oxide powder and sulfuric acid. He uses the following method. Step 1: Measure 25 cm3 of sulfuric acid into a beaker. Step 2: Place the beaker of sulfuric acid onto a tripod and heat gently with a Bunsen burner. Step 3: Add copper oxide powder to the sulfuric acid a small amount at a time and stir with a glass rod. Keep adding the copper oxide until no more reacts. Be careful not to let the mixture boil. Step 4: Filter the mixture into an evaporating basin. Step 5: Gently heat the copper sulfate solution in the evaporating basin until about half of the water in the solution has evaporated. Step 6: Leave the basin to cool. Step 7: Filter off the crystals. Step 8: Wash the crystals with ice cold water. Step 9: Dry the crystals with filter paper. (a) Name a piece of apparatus suitable for measuring the 25 cm3 of sulfuric acid used in Step 1. ...............................................................................................................................................[1] (b) Draw a labelled diagram of the apparatus used for Step 2. [2] (c) State how the student knows when no more copper oxide will react with the sulfuric acid in Step 3. ...............................................................................................................................................[1] (d) The apparatus used for Step 4 is shown in Fig. 5.1. Fig. 5.1 Label all of the apparatus and all of the substances shown in Fig. 5.1. [2] (e) Explain why only half of the water is evaporated in Step 5. ................................................................................................................................................... ...............................................................................................................................................[1] (f) Explain how the student makes sure that the crystals he produces are pure. ................................................................................................................................................... ...............................................................................................................................................[1] (g) Suggest why the water in Step 8 is ice cold. ................................................................................................................................................... ...............................................................................................................................................[1] (h) The student adds the crystals to a boiling tube and heats them gently until they form a white powder. State the substance that could be added to the white powder to make the blue colour return. ...............................................................................................................................................[1]
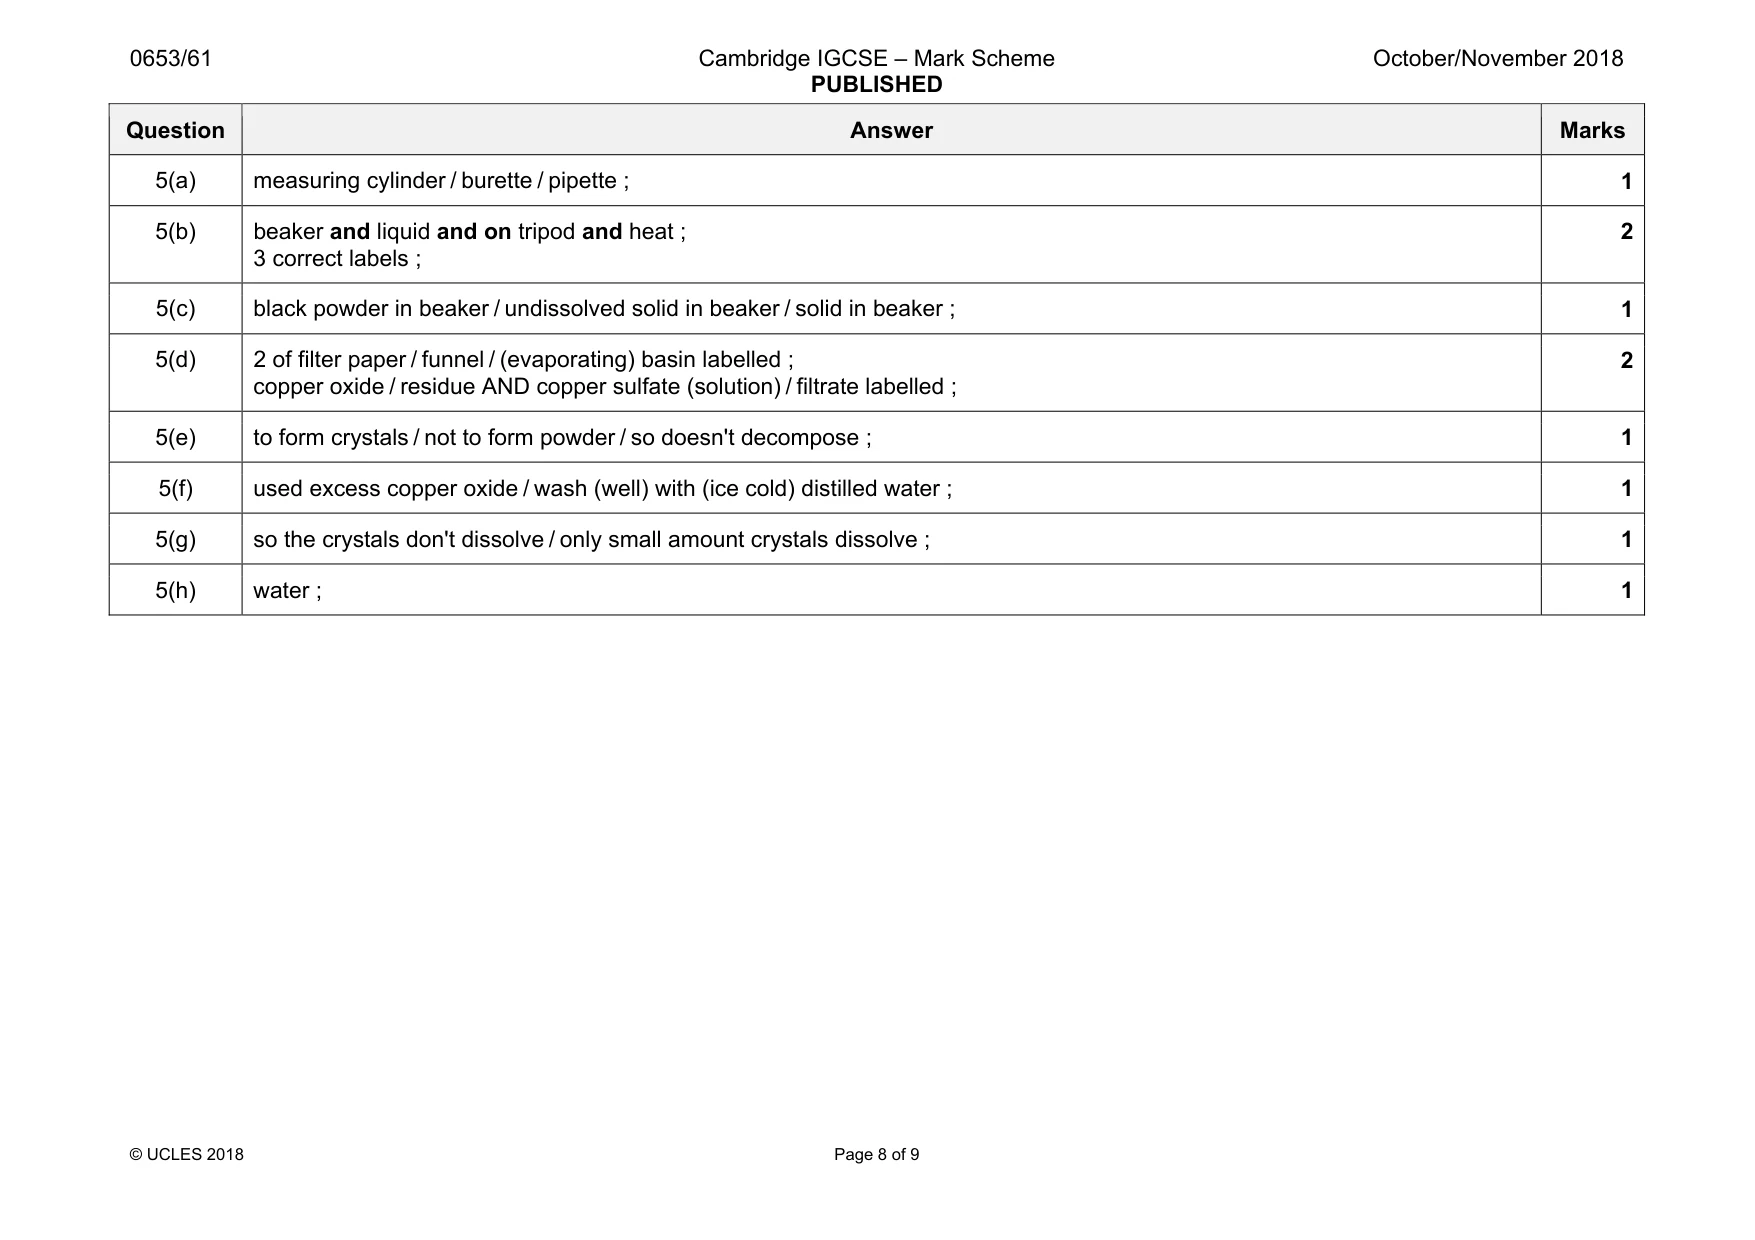
Mark scheme: 5(a) measuring cylinder / burette / pipette ; 1 5(b) beaker and liquid and on tripod and heat ; 3 correct labels ; 2 5(c) black powder in beaker / undissolved solid in beaker / solid in beaker ; 1 5(d) 2 of filter paper / funnel / (evaporating) basin labelled ; copper oxide / residue AND copper sulfate (solution) / filtrate labelled ; 2 5(e) to form crystals / not to form powder / so doesn't decompose ; 1 5(f) used excess copper oxide / wash (well) with (ice cold) distilled water ; 1 5(g) so the crystals don't dissolve / only small amount crystals dissolve ; 1 5(h) water ; 1
Q6 · A student investigates the alcohol content of wine
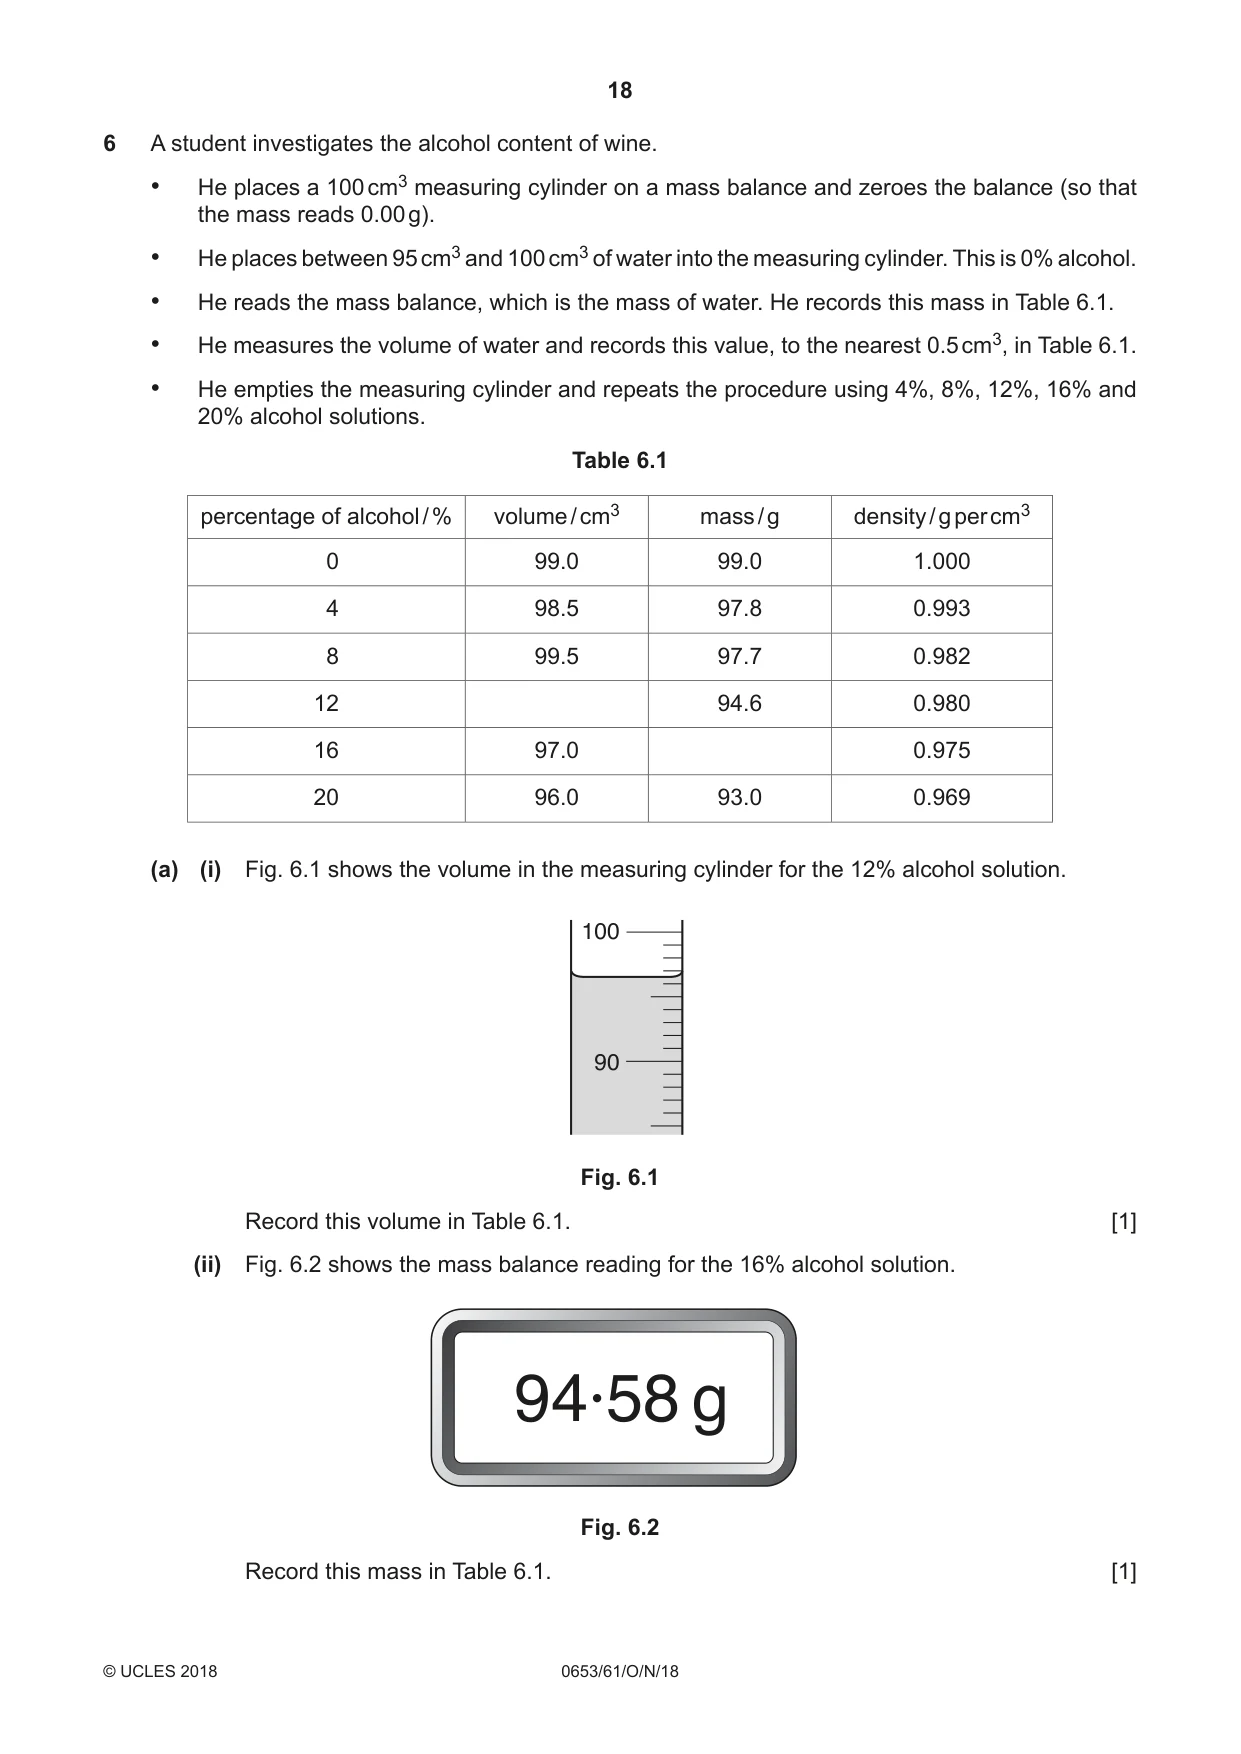
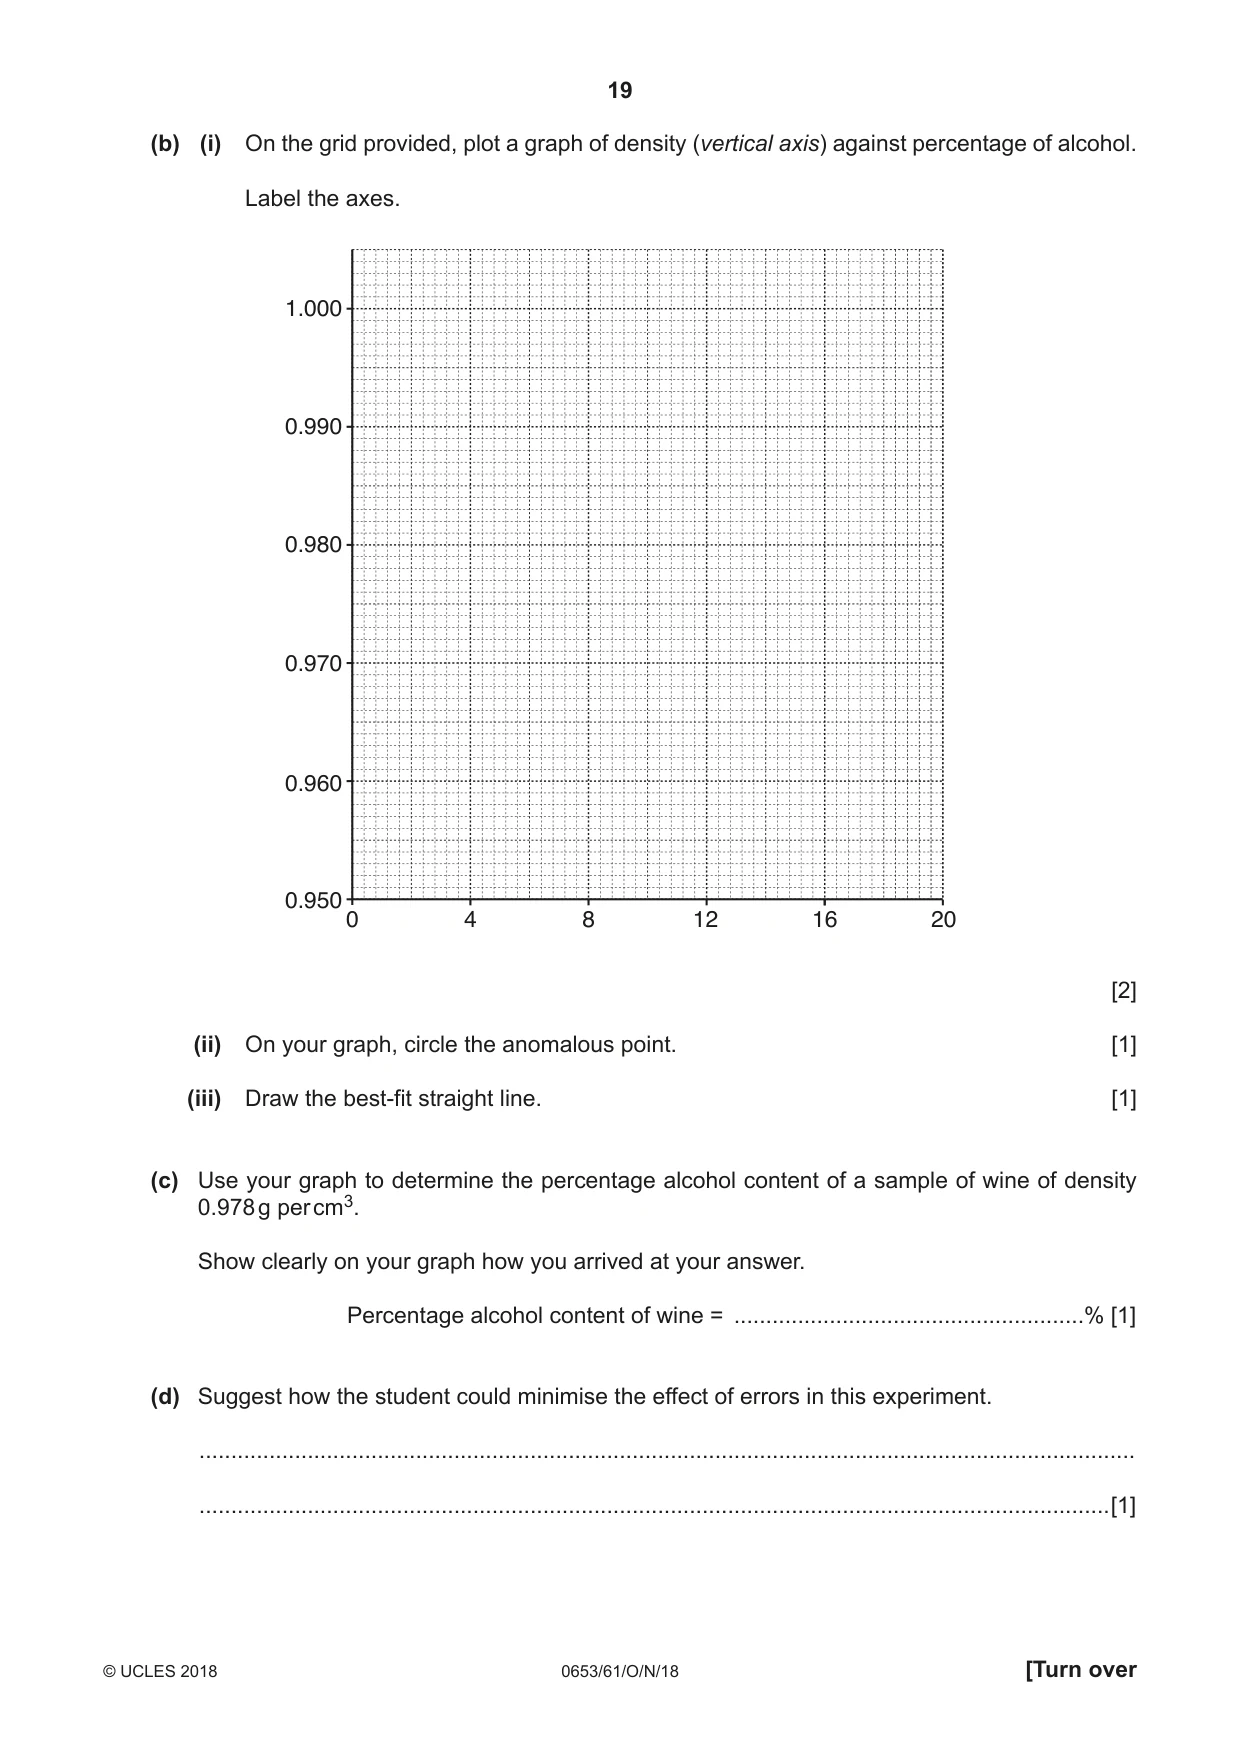
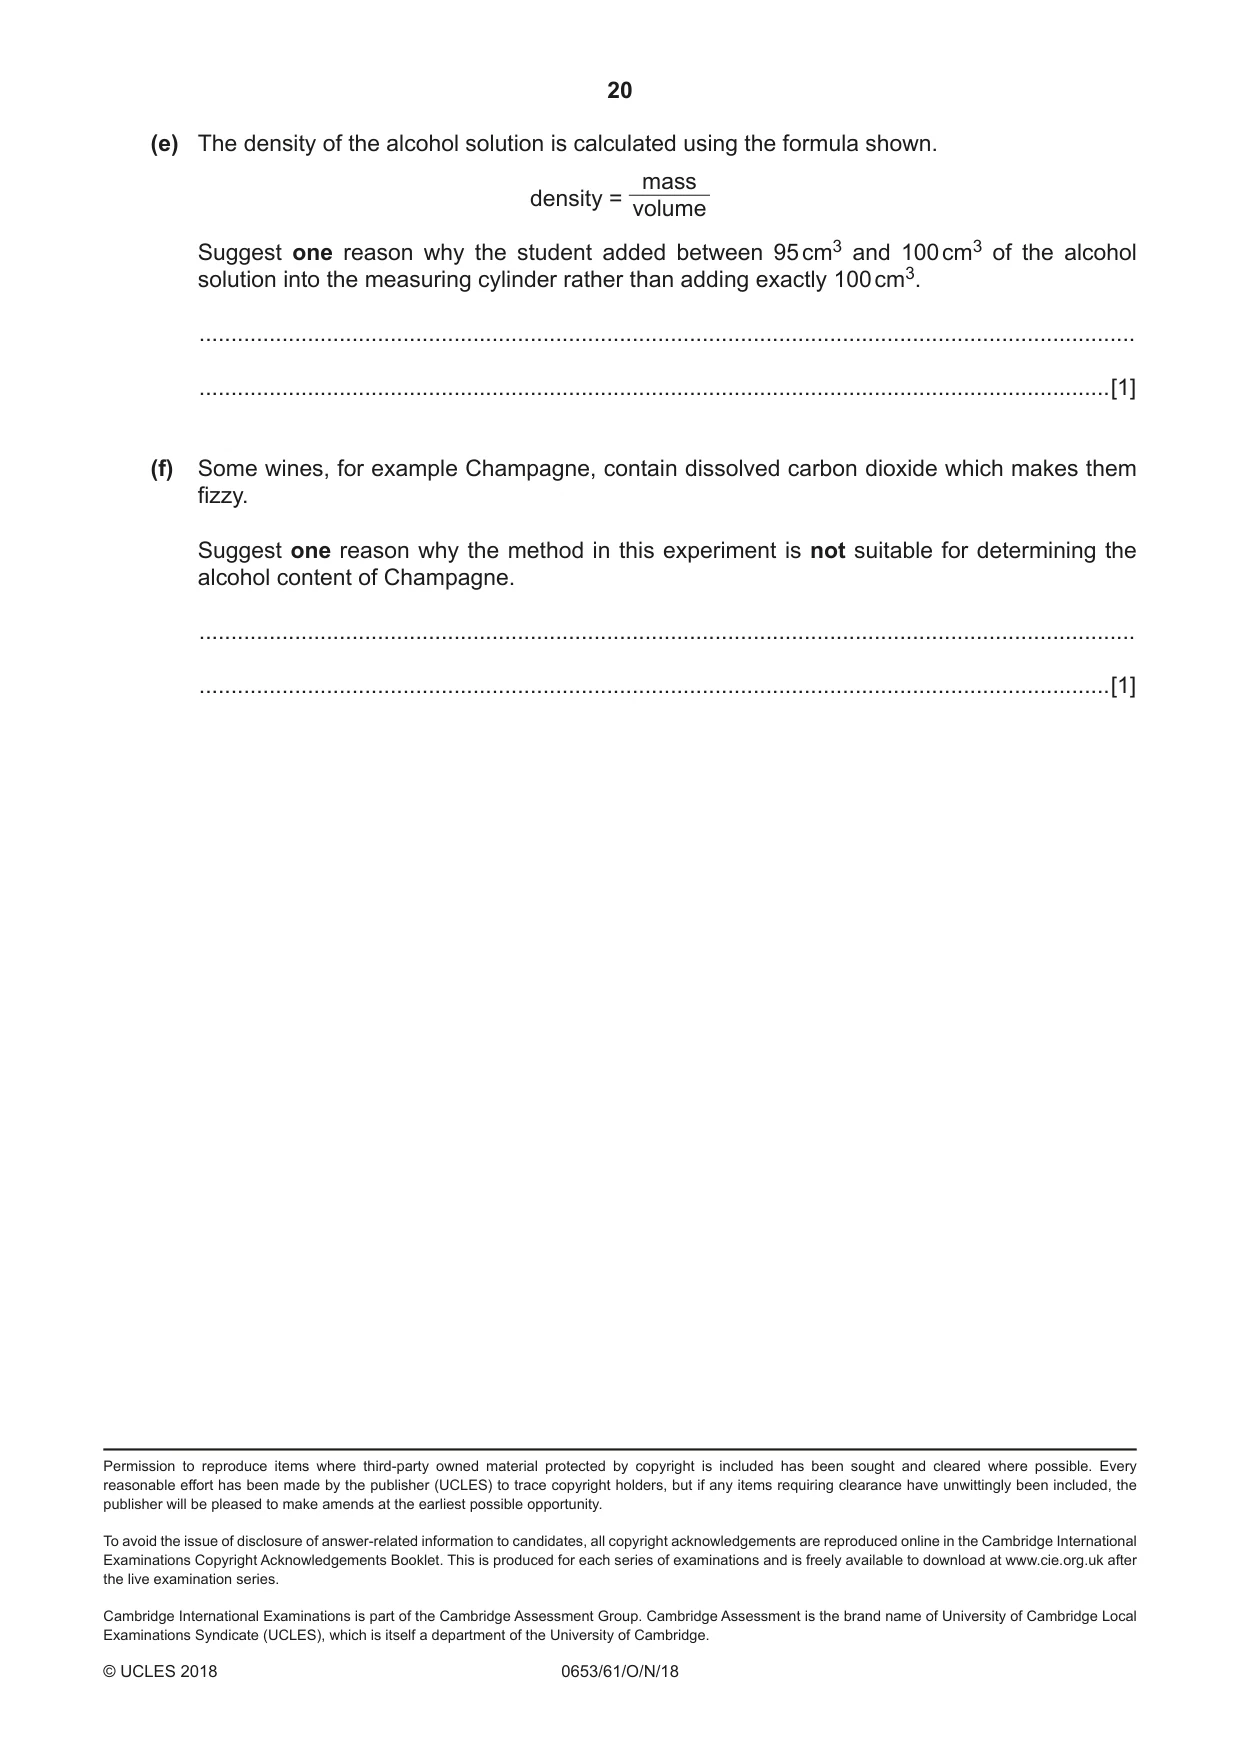
6 A student investigates the alcohol content of wine. • He places a 100 cm3 measuring cylinder on a mass balance and zeroes the balance (so that the mass reads 0.00 g). • He places between 95 cm3 and 100 cm3 of water into the measuring cylinder. This is 0% alcohol. • He reads the mass balance, which is the mass of water. He records this mass in Table 6.1. • He measures the volume of water and records this value, to the nearest 0.5 cm3, in Table 6.1. • He empties the measuring cylinder and repeats the procedure using 4%, 8%, 12%, 16% and 20% alcohol solutions. Table 6.1 percentage of alcohol / % volume / cm3 mass / g density / g per cm3 0 99.0 99.0 1.000 4 98.5 97.8 0.993 8 99.5 97.7 0.982 12 94.6 0.980 16 97.0 0.975 20 96.0 93.0 0.969 (a) (i) Fig. 6.1 shows the volume in the measuring cylinder for the 12% alcohol solution. 100 90 Fig. 6.1 Record this volume in Table 6.1. [1] (ii) Fig. 6.2 shows the mass balance reading for the 16% alcohol solution. 94·58 g Fig. 6.2 Record this mass in Table 6.1. [1] (b) (i) On the grid provided, plot a graph of density (vertical axis) against percentage of alcohol. Label the axes. 1.000 0.990 0.980 0.970 0.960 0.950 0 4 8 12 16 20 [2] (ii) On your graph, circle the anomalous point. [1] (iii) Draw the best-fit straight line. [1] (c) Use your graph to determine the percentage alcohol content of a sample of wine of density 0.978 g per cm3. Show clearly on your graph how you arrived at your answer. Percentage alcohol content of wine = .......................................................% [1] (d) Suggest how the student could minimise the effect of errors in this experiment. ................................................................................................................................................... ...............................................................................................................................................[1] (e) The density of the alcohol solution is calculated using the formula shown. mass density = volume Suggest one reason why the student added between 95 cm3 and 100 cm3 of the alcohol solution into the measuring cylinder rather than adding exactly 100 cm3. ................................................................................................................................................... ...............................................................................................................................................[1] (f) Some wines, for example Champagne, contain dissolved carbon dioxide which makes them fizzy. Suggest one reason why the method in this experiment is not suitable for determining the alcohol content of Champagne. ................................................................................................................................................... ...............................................................................................................................................[1]
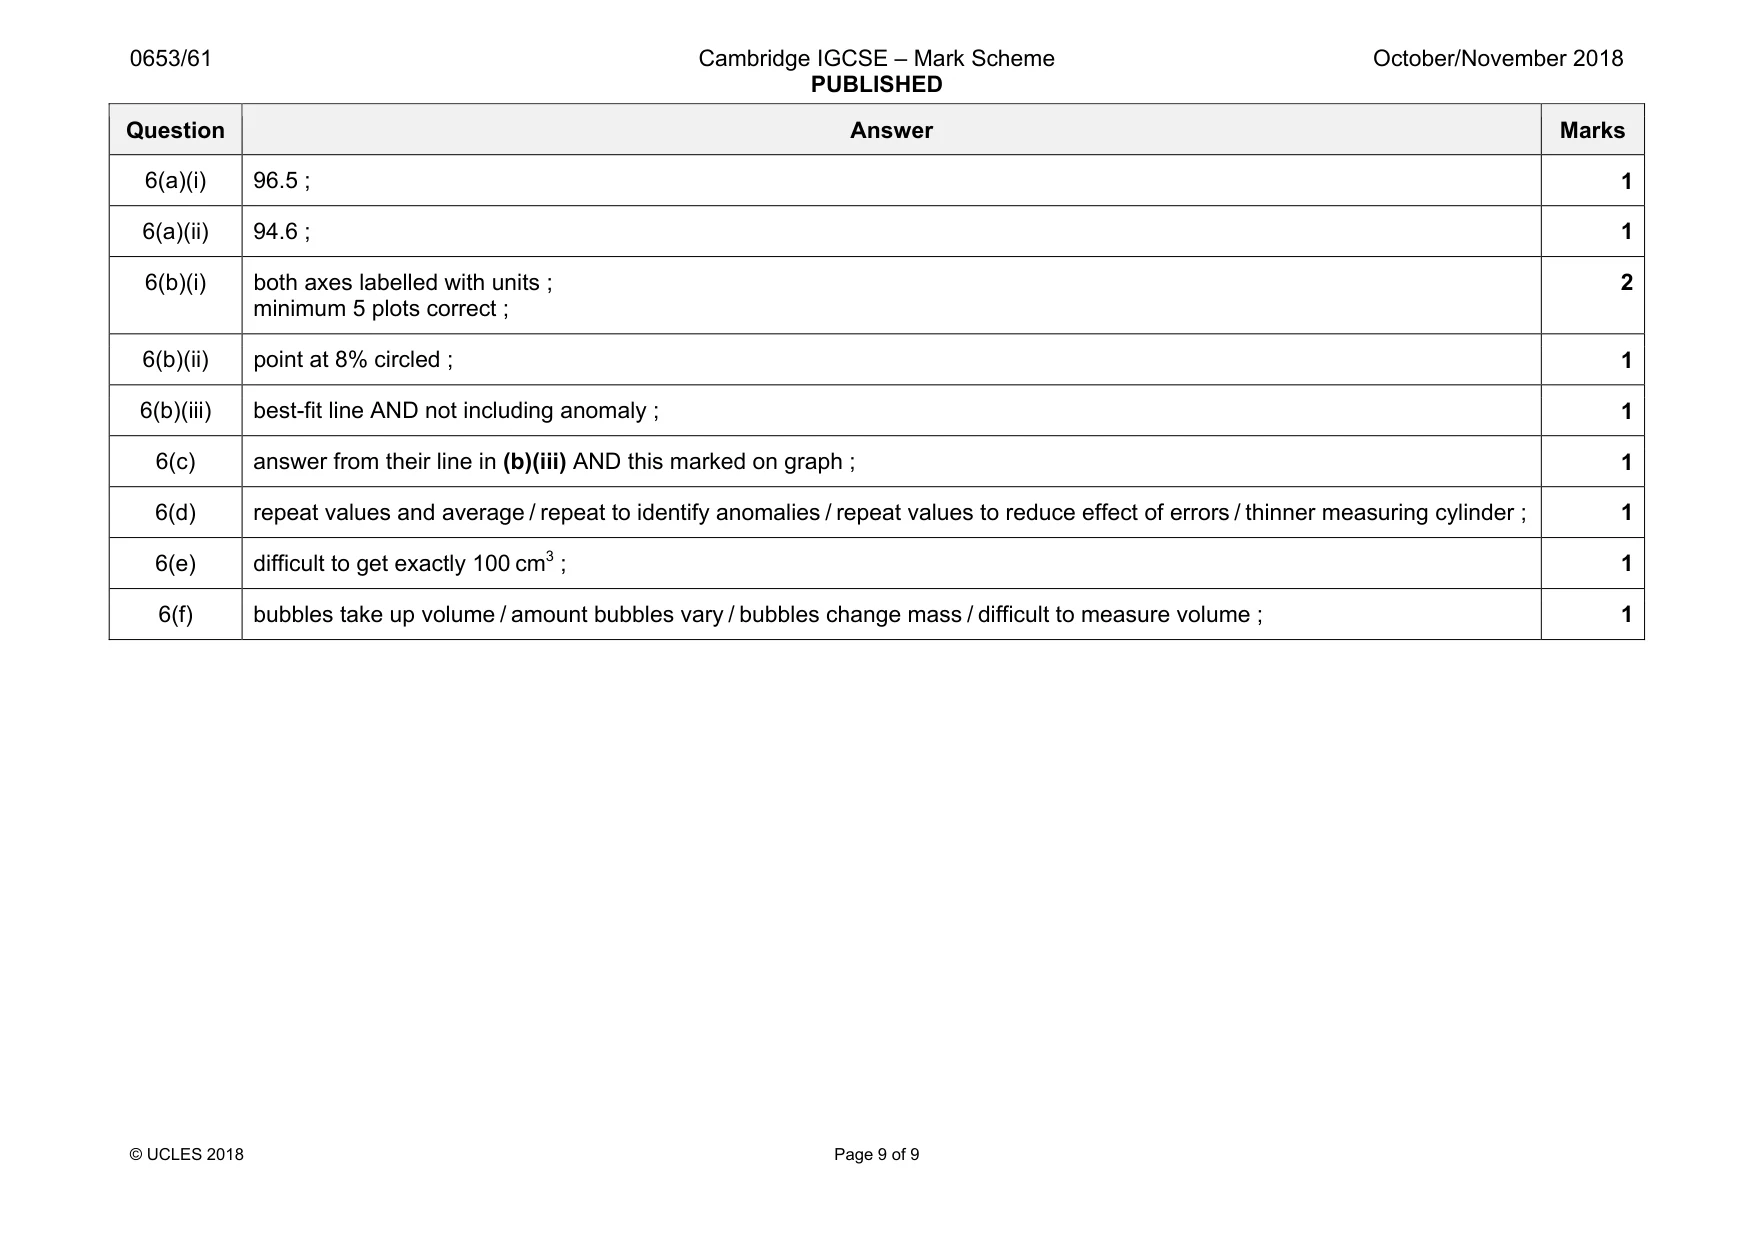
Mark scheme: 6(a)(i) 96.5 ; 1 6(a)(ii) 94.6 ; 1 6(b)(i) both axes labelled with units ; minimum 5 plots correct ; 2 6(b)(ii) point at 8% circled ; 1 6(b)(iii) best-fit line AND not including anomaly ; 1 6(c) answer from their line in (b)(iii) AND this marked on graph ; 1 6(d) repeat values and average / repeat to identify anomalies / repeat values to reduce effect of errors / thinner measuring cylinder ; 1 6(e) difficult to get exactly 100 cm3 ; 1 6(f) bubbles take up volume / amount bubbles vary / bubbles change mass / difficult to measure volume ; 1
More questions on Physical quantities and measurement techniques
What was in this paper
The subtopics covered by these 6 questions, and how many questions each got. Open one in a new tab to see every Cambridge question on it.
What you needed in this session
Cambridge’s own grade thresholds for 2018 Oct/Nov, Paper 6 · Variant 1. A higher threshold means an easier paper — the bar moves with how the cohort did.