Cambridge IGCSE Science - Combined 0653 — 2018 May/June Paper 5 · Variant 1
0653/51/M/J/18 · 3 questions · 30 marks · ≈34 min
The question paper and its mark scheme, free to read here and free to download. This is Cambridge’s own paper, exactly as it was sat.
Question paper8 pages
Mark scheme6 pages
Answers below. Sit the paper first if you are practising.
Questions as text
Q1 · You are going to investigate an enzyme-catalysed reaction
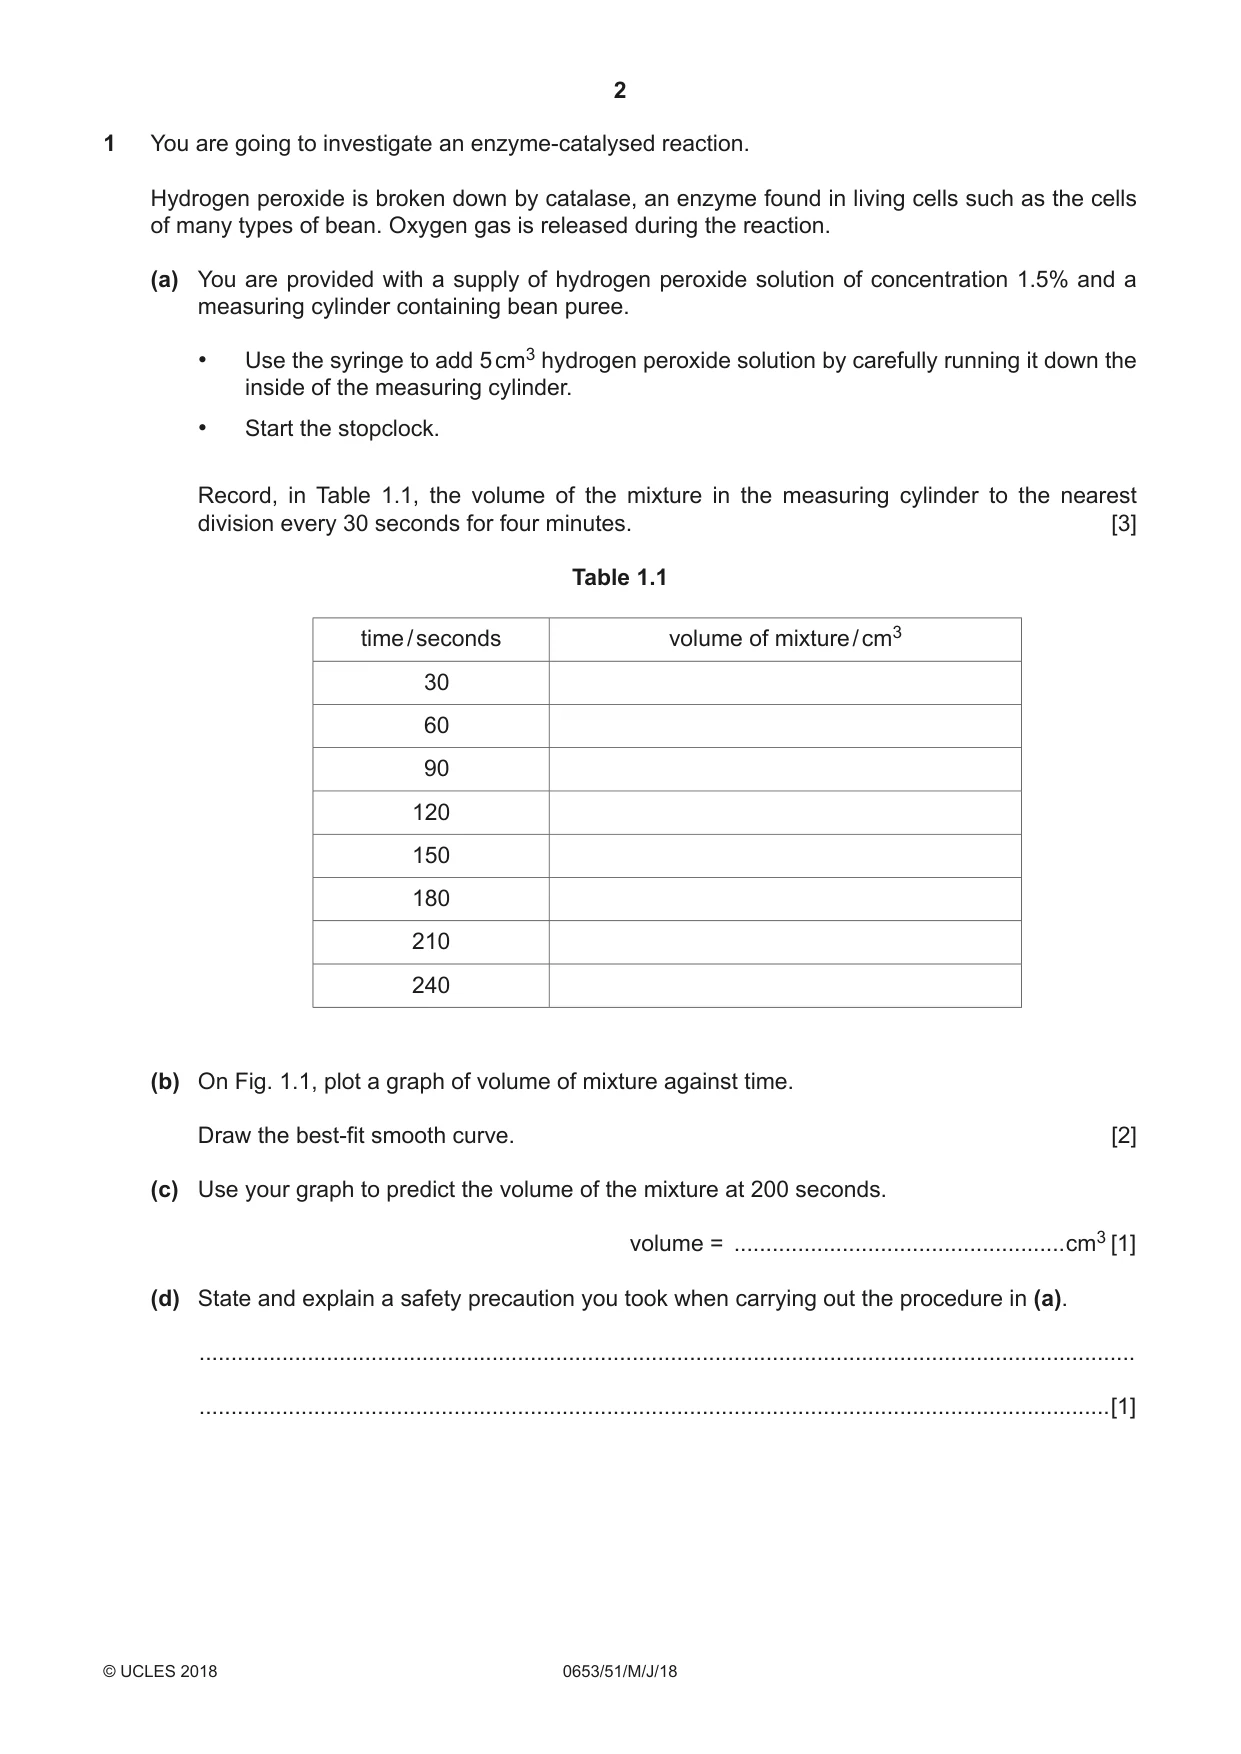
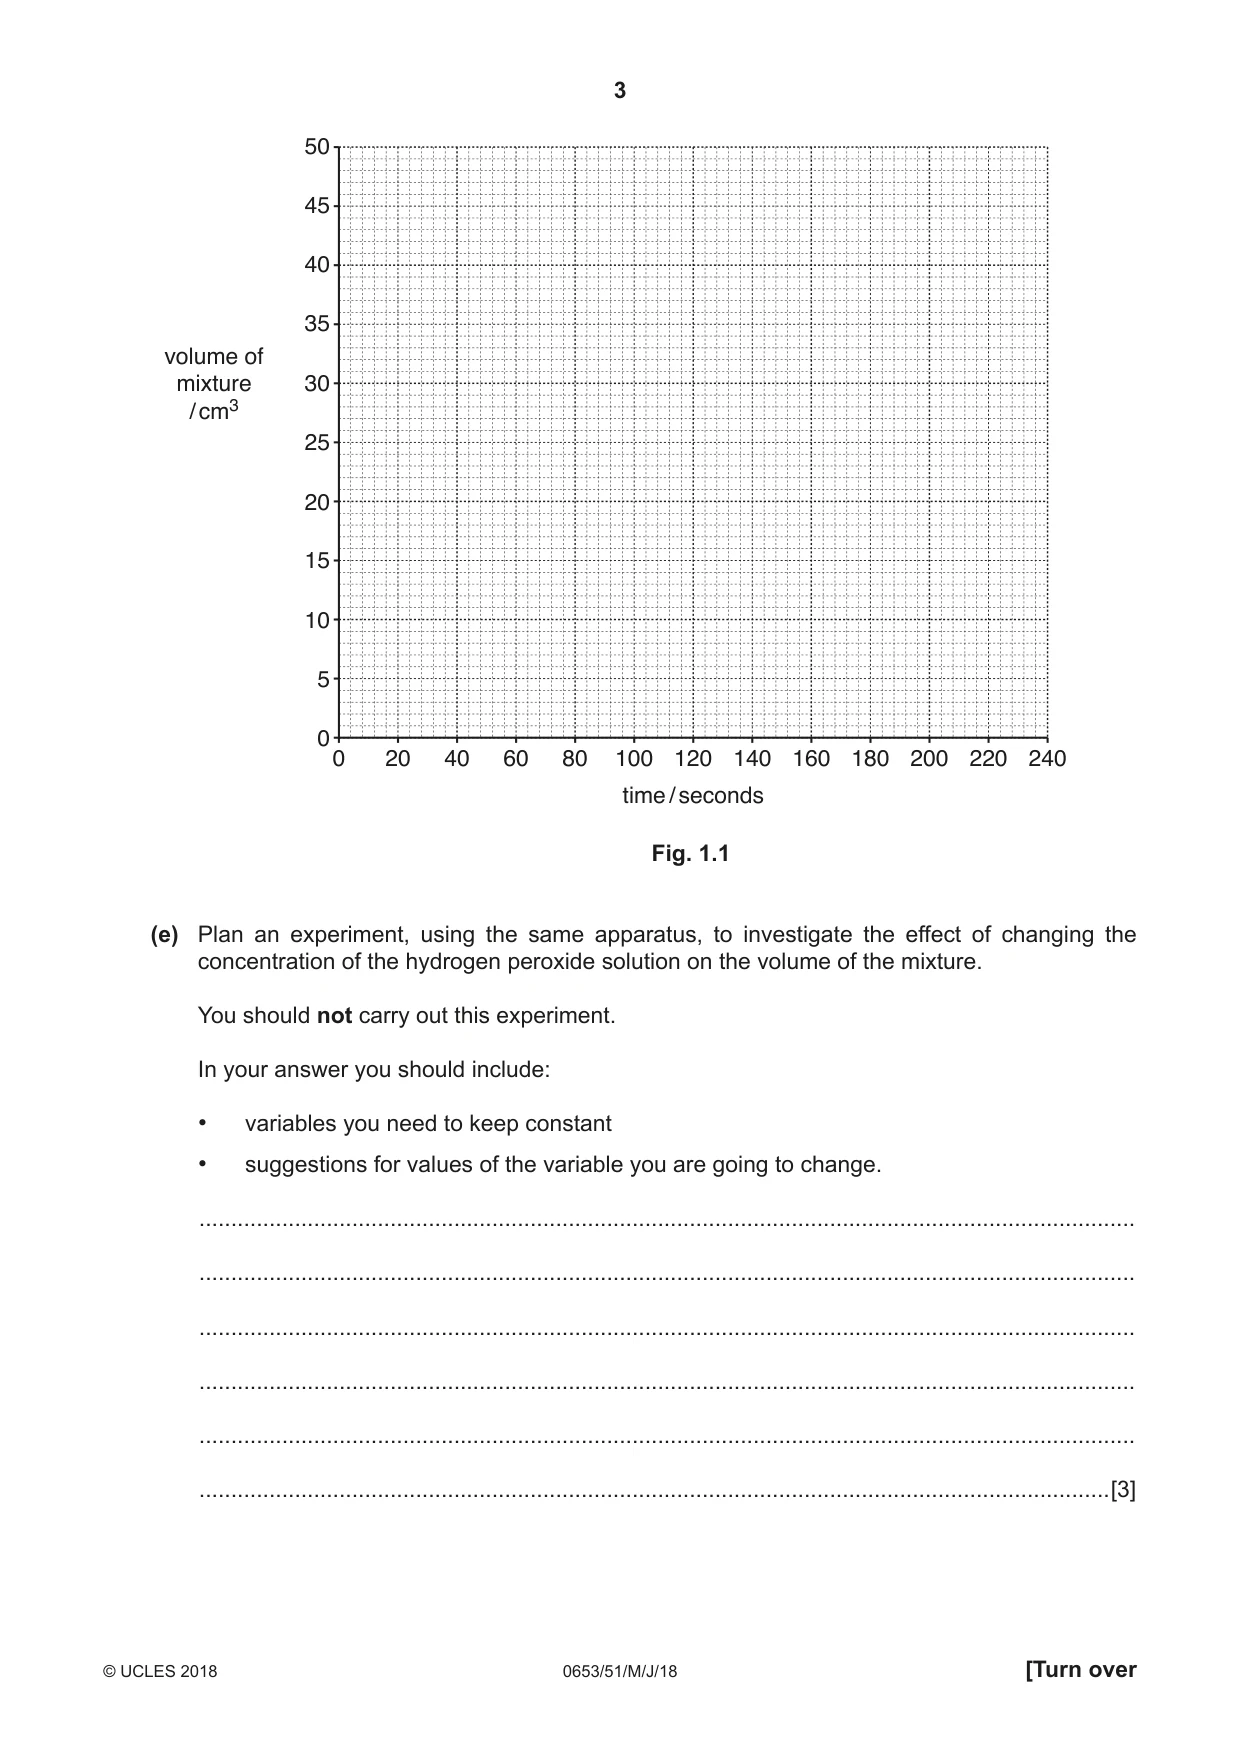
1 You are going to investigate an enzyme-catalysed reaction. Hydrogen peroxide is broken down by catalase, an enzyme found in living cells such as the cells of many types of bean. Oxygen gas is released during the reaction. (a) You are provided with a supply of hydrogen peroxide solution of concentration 1.5% and a measuring cylinder containing bean puree. • Use the syringe to add 5 cm3 hydrogen peroxide solution by carefully running it down the inside of the measuring cylinder. • Start the stopclock. Record, in Table 1.1, the volume of the mixture in the measuring cylinder to the nearest division every 30 seconds for four minutes. [3] Table 1.1 time / seconds volume of mixture / cm3 30 60 90 120 150 180 210 240 (b) On Fig. 1.1, plot a graph of volume of mixture against time. Draw the best-fit smooth curve. [2] (c) Use your graph to predict the volume of the mixture at 200 seconds. volume = ....................................................cm3 [1] (d) State and explain a safety precaution you took when carrying out the procedure in (a). ................................................................................................................................................... ...............................................................................................................................................[1] 50 45 40 35 volume of mixture 30 / cm3 25 20 15 10 5 0 0 20 40 60 80 100 120 140 160 180 200 220 240 time / seconds Fig. 1.1 (e) Plan an experiment, using the same apparatus, to investigate the effect of changing the concentration of the hydrogen peroxide solution on the volume of the mixture. You should not carry out this experiment. In your answer you should include: • variables you need to keep constant • suggestions for values of the variable you are going to change. ................................................................................................................................................... ................................................................................................................................................... ................................................................................................................................................... ................................................................................................................................................... ................................................................................................................................................... ...............................................................................................................................................[3]
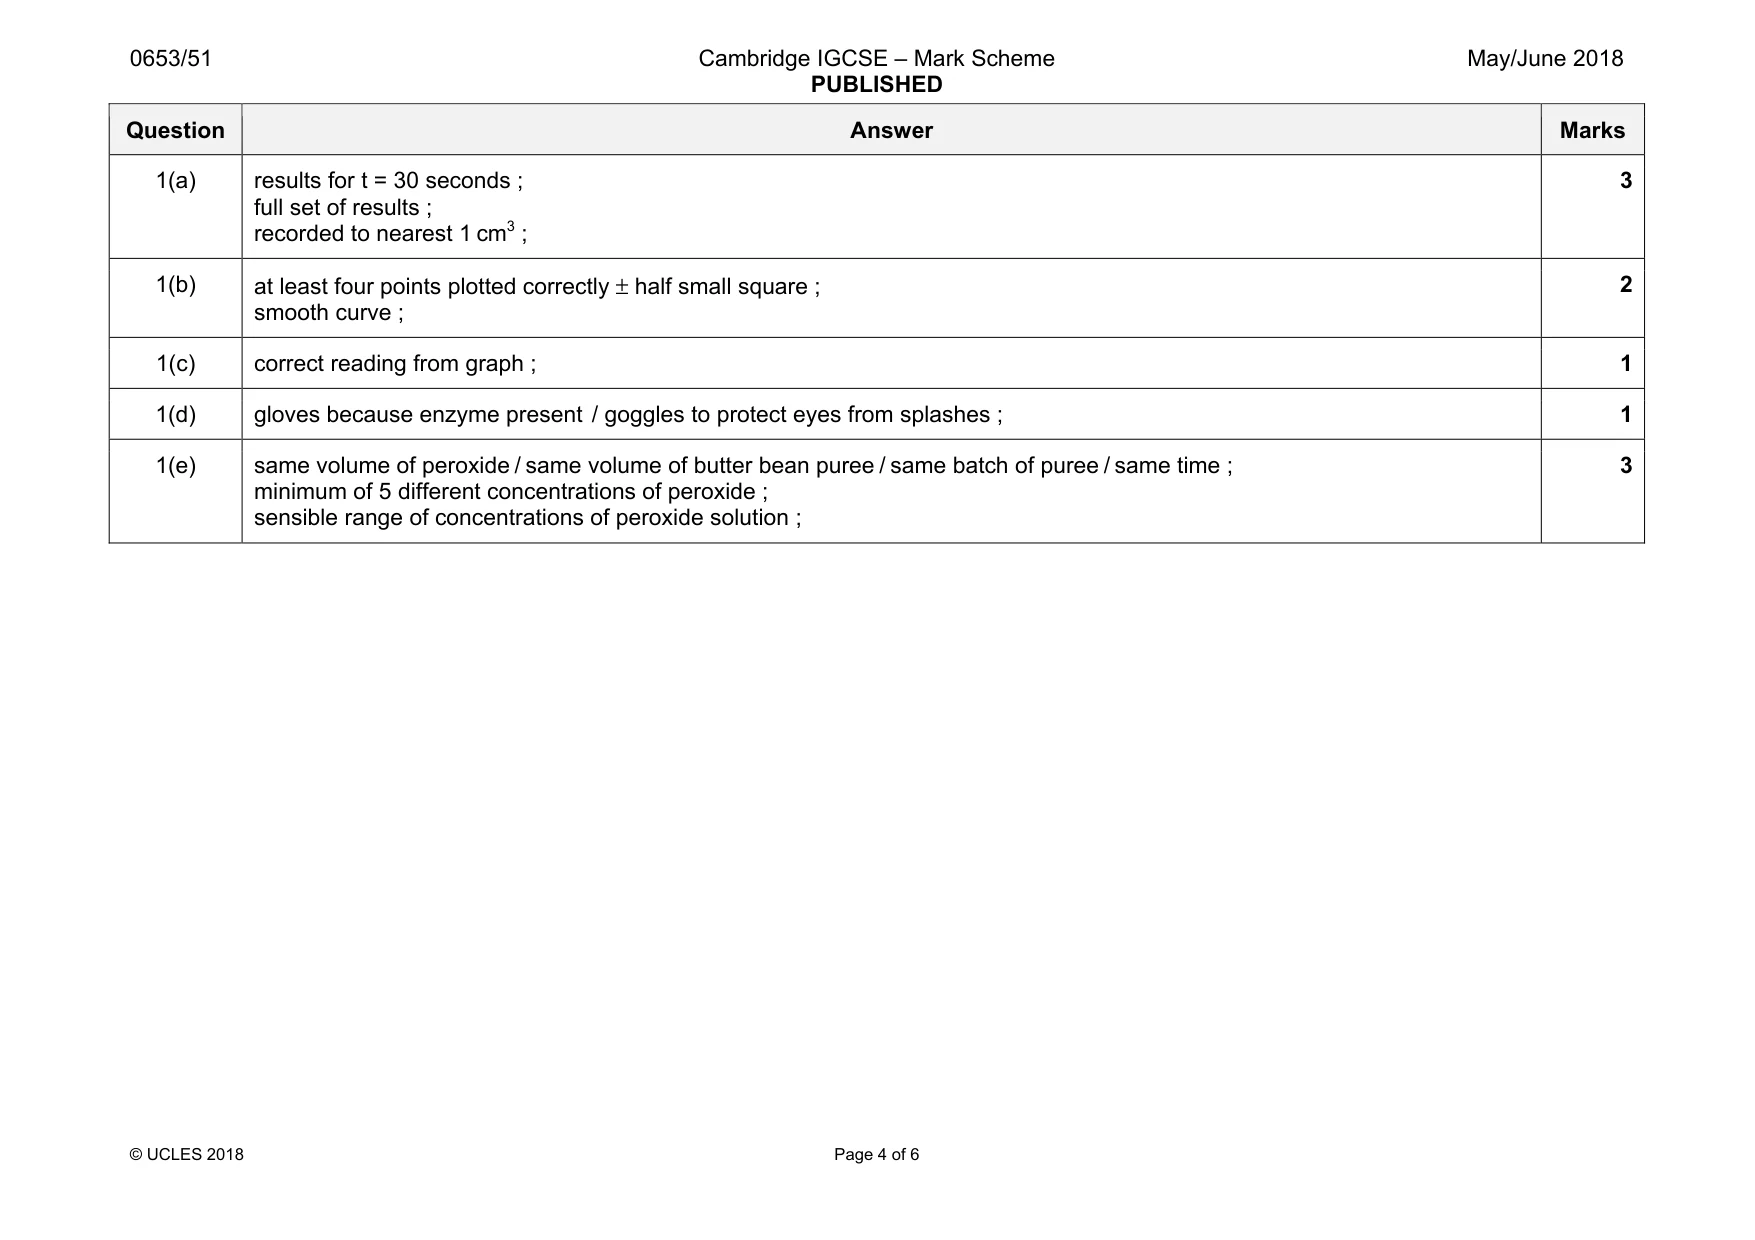
Mark scheme: 1(a) results for t = 30 seconds ; full set of results ; recorded to nearest 1 cm3 ; 3 1(b) at least four points plotted correctly ± half small square ; smooth curve ; 2 1(c) correct reading from graph ; 1 1(d) gloves because enzyme present / goggles to protect eyes from splashes ; 1 1(e) same volume of peroxide / same volume of butter bean puree / same batch of puree / same time ; minimum of 5 different concentrations of peroxide ; sensible range of concentrations of peroxide solution ; 3
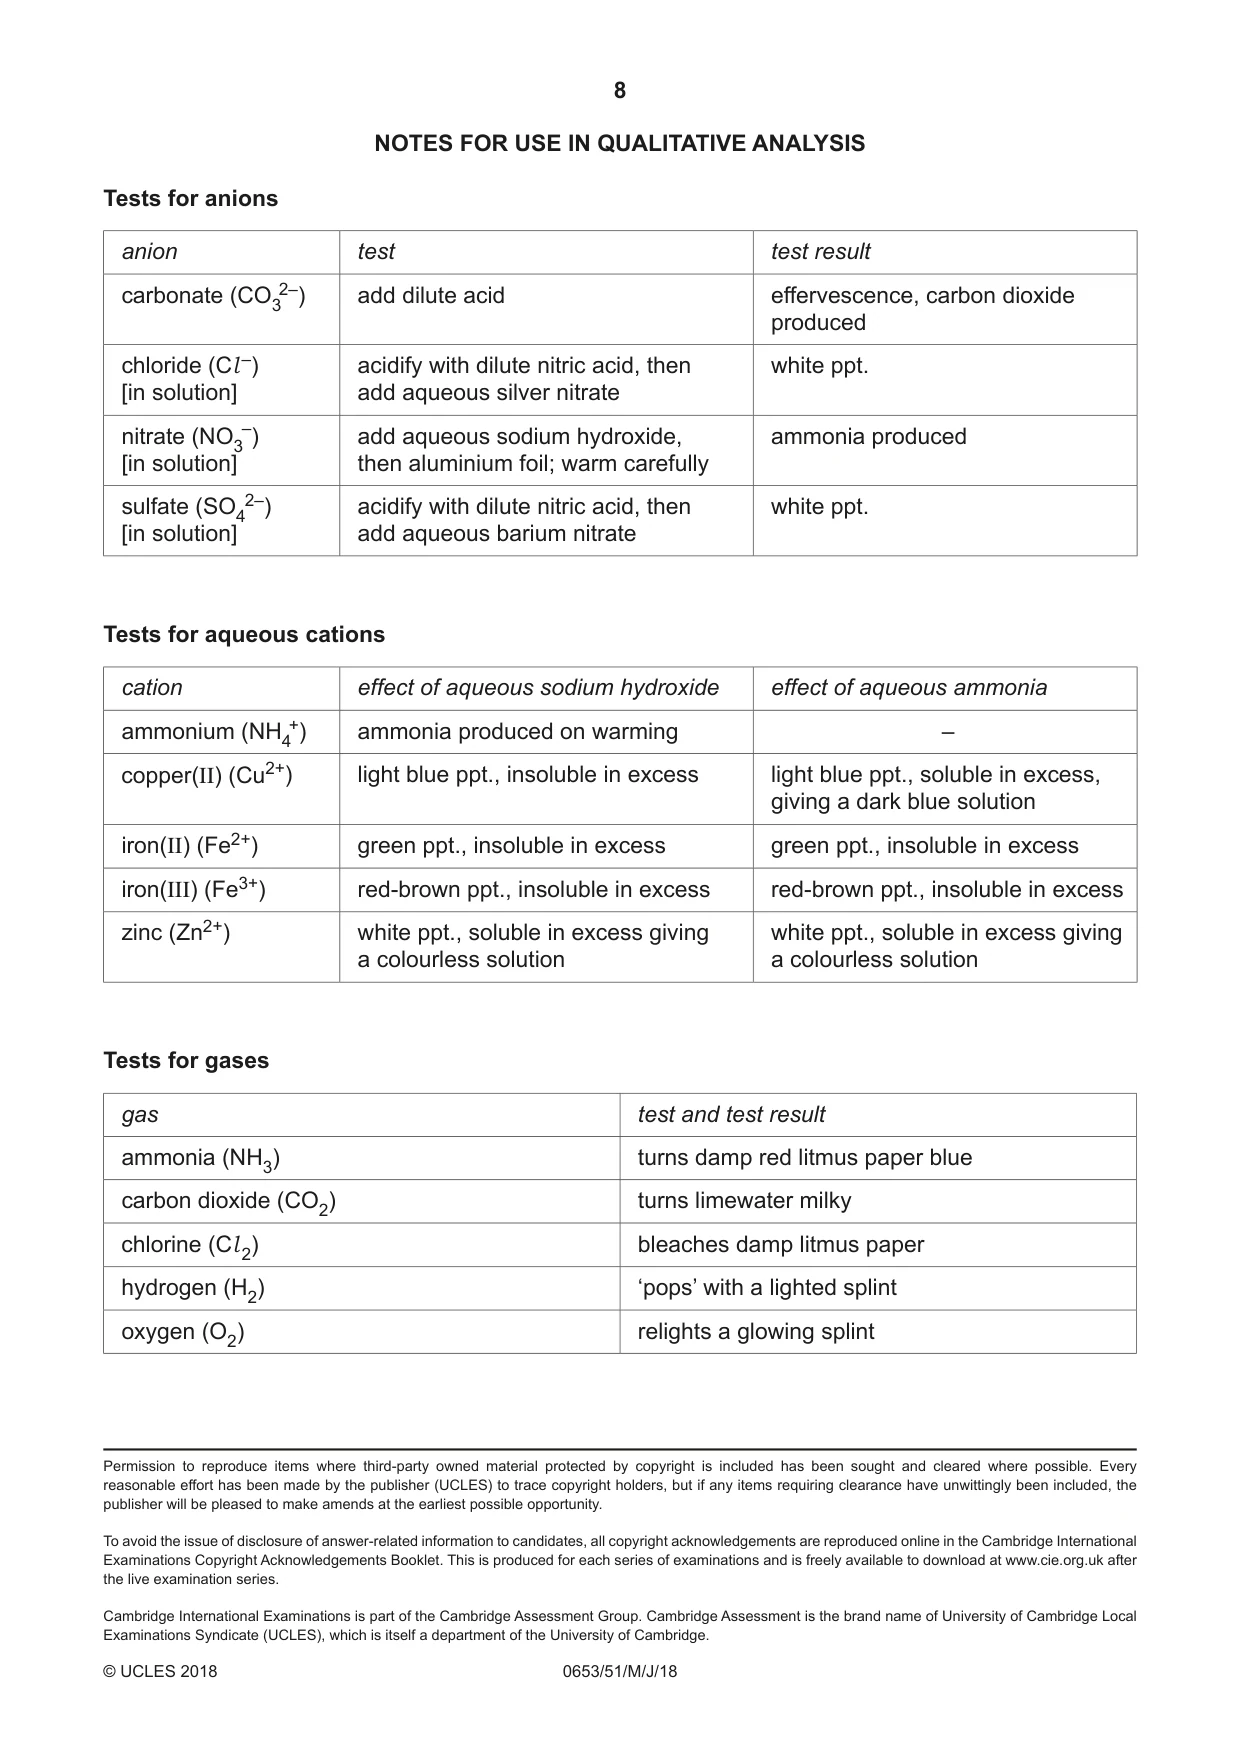
Q2 · Notes for use in Qualitative Analysis for this question are printed on page 8
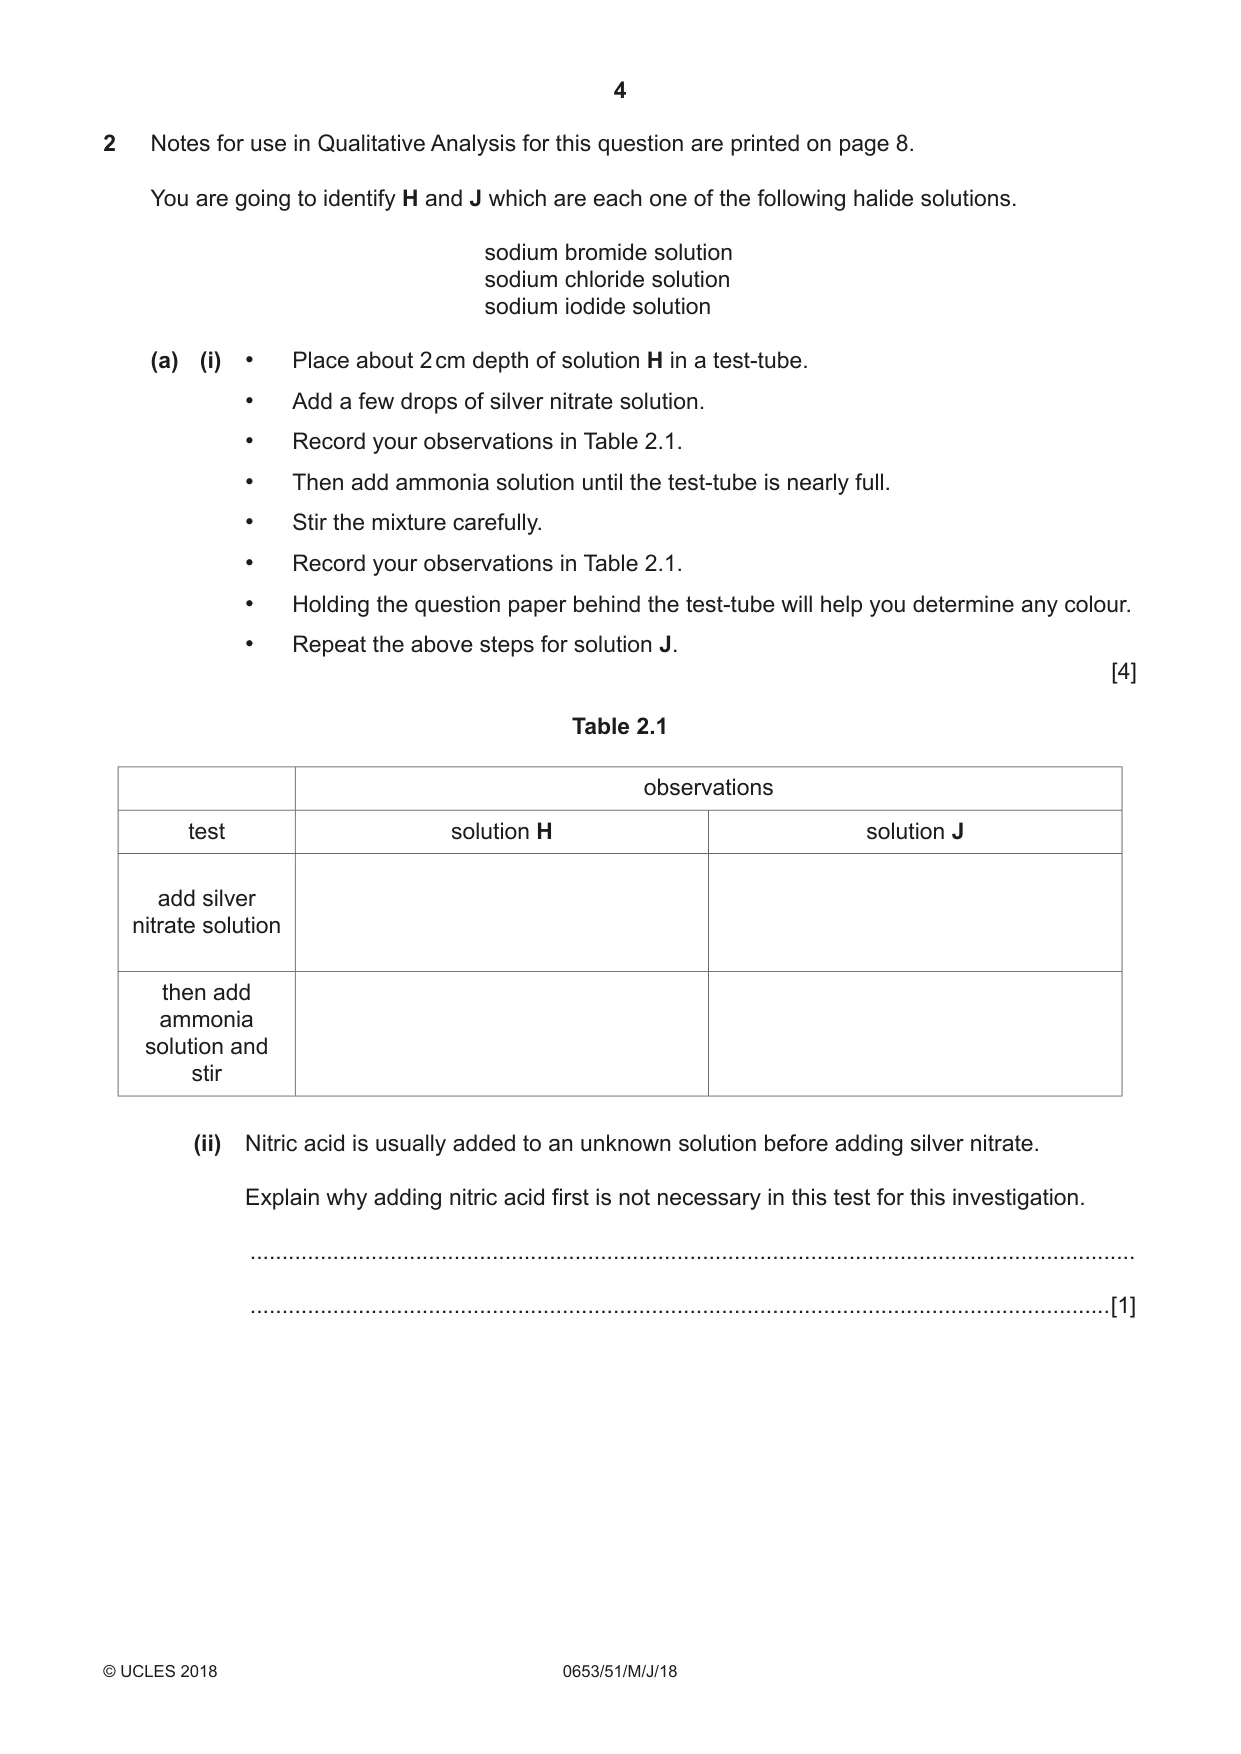
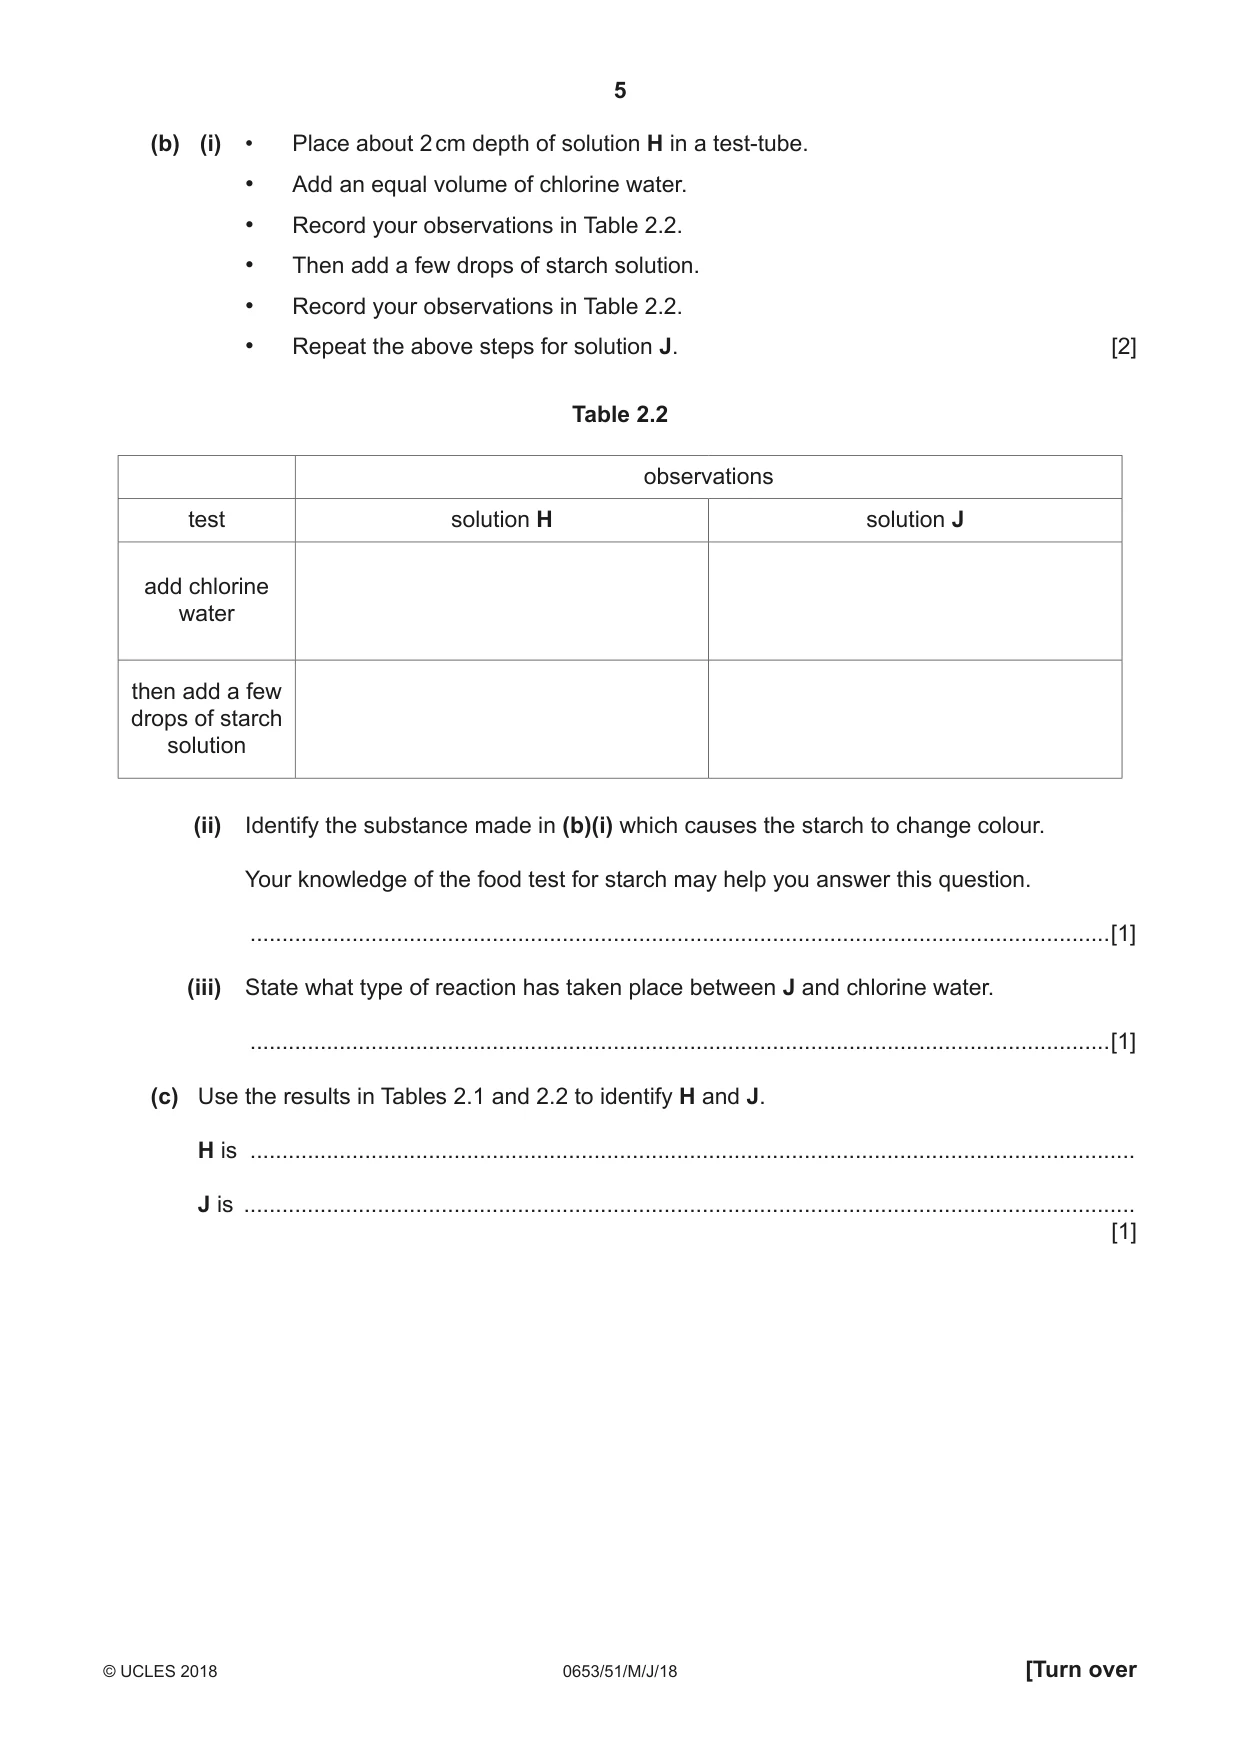
2 Notes for use in Qualitative Analysis for this question are printed on page 8. You are going to identify H and J which are each one of the following halide solutions. sodium bromide solution sodium chloride solution sodium iodide solution (a) (i) • Place about 2 cm depth of solution H in a test-tube. • Add a few drops of silver nitrate solution. • Record your observations in Table 2.1. • Then add ammonia solution until the test-tube is nearly full. • Stir the mixture carefully. • Record your observations in Table 2.1. • Holding the question paper behind the test-tube will help you determine any colour. • Repeat the above steps for solution J. [4] Table 2.1 observations test solution H solution J add silver nitrate solution then add ammonia solution and stir (ii) Nitric acid is usually added to an unknown solution before adding silver nitrate. Explain why adding nitric acid first is not necessary in this test for this investigation. ........................................................................................................................................... .......................................................................................................................................[1] (b) (i) • Place about 2 cm depth of solution H in a test-tube. • Add an equal volume of chlorine water. • Record your observations in Table 2.2. • Then add a few drops of starch solution. • Record your observations in Table 2.2. • Repeat the above steps for solution J. [2] Table 2.2 observations test solution H solution J add chlorine water then add a few drops of starch solution (ii) Identify the substance made in (b)(i) which causes the starch to change colour. Your knowledge of the food test for starch may help you answer this question. .......................................................................................................................................[1] (iii) State what type of reaction has taken place between J and chlorine water. .......................................................................................................................................[1] (c) Use the results in Tables 2.1 and 2.2 to identify H and J. H is ........................................................................................................................................... J is ............................................................................................................................................ [1]
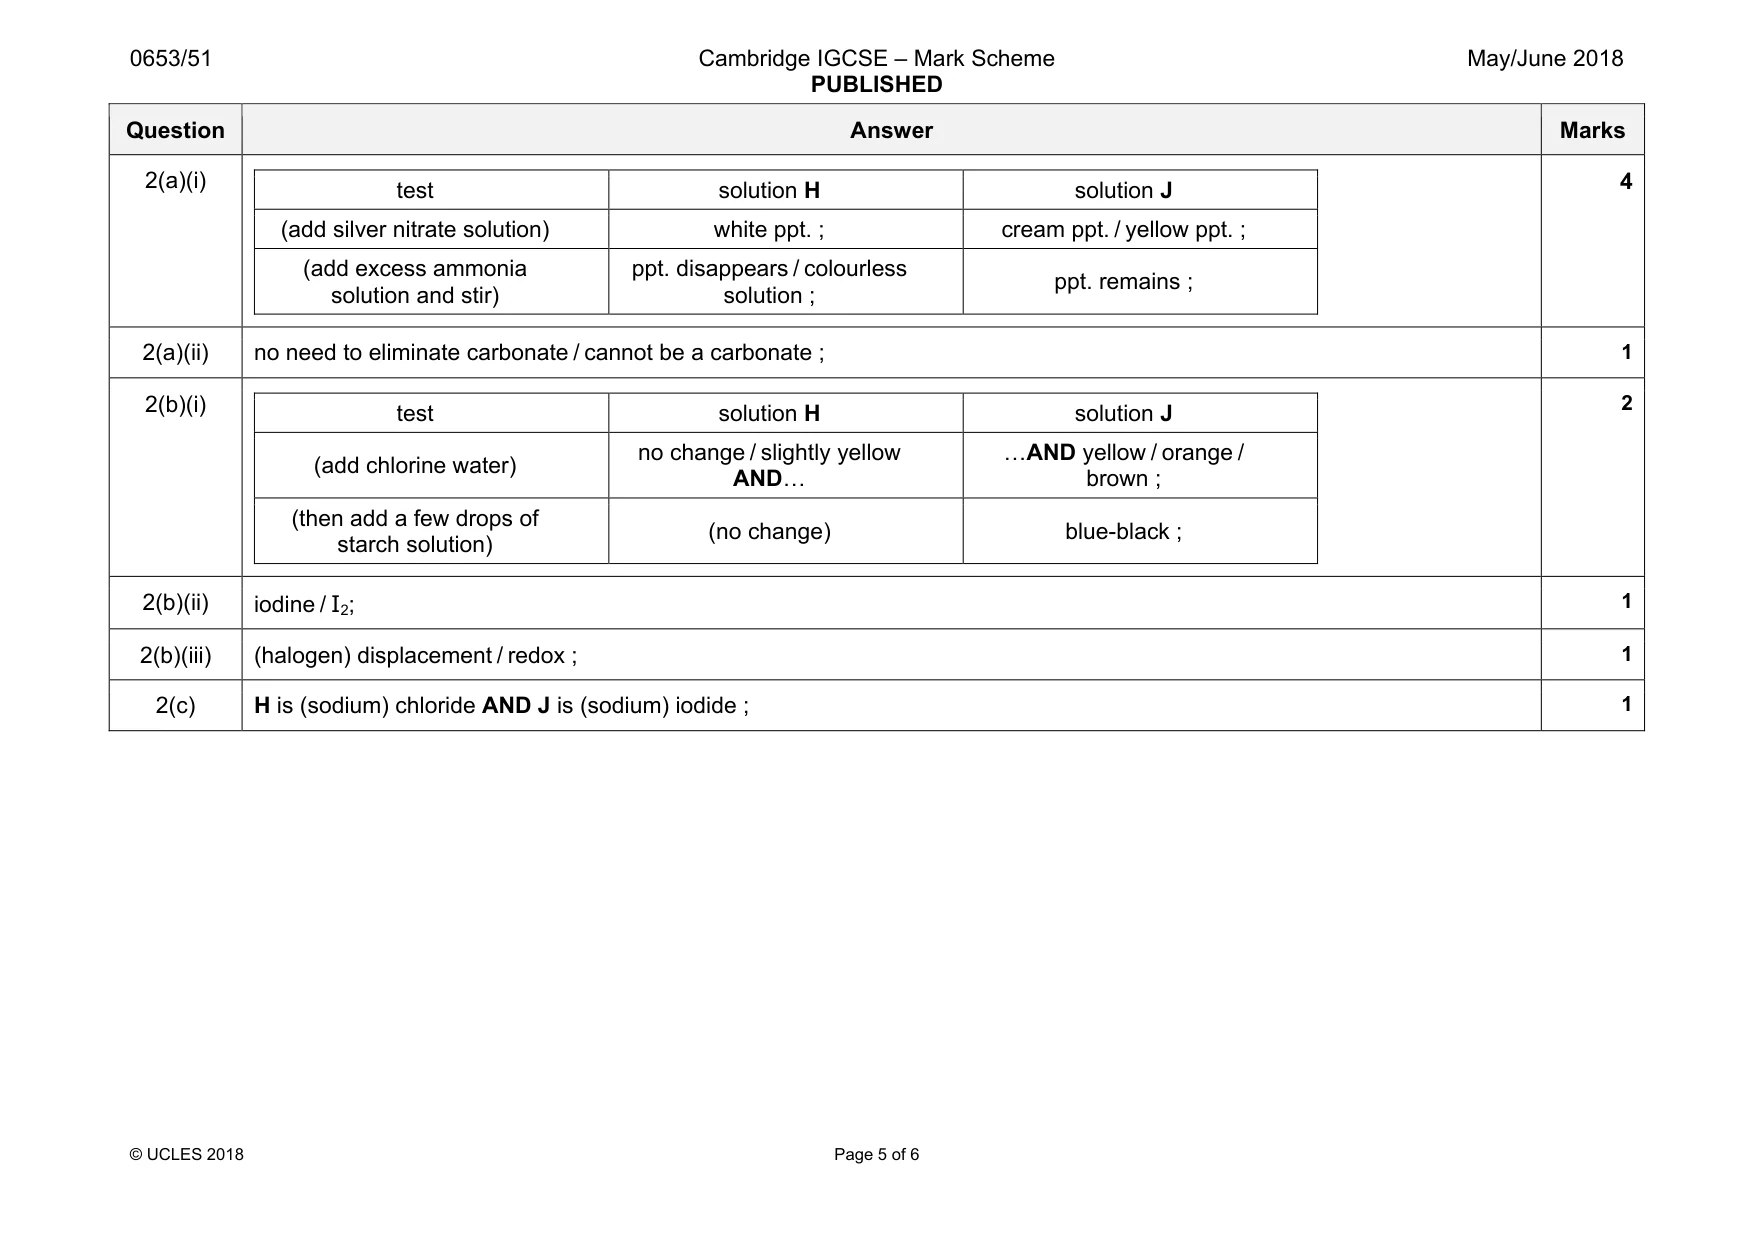
Mark scheme: 2(a)(i) test solution H solution J (add silver nitrate solution) white ppt. ; cream ppt. / yellow ppt. ; (add excess ammonia solution and stir) ppt. disappears / colourless solution ; ppt. remains ; 4 2(a)(ii) no need to eliminate carbonate / cannot be a carbonate ; 1 2(b)(i) test solution H solution J (add chlorine water) no change / slightly yellow AND« «AND yellow / orange / brown ; (then add a few drops of starch solution) (no change) blue-black ; 2 2(b)(ii) iodine / I2; 1 2(b)(iii) (halogen) displacement / redox ; 1 2(c) H is (sodium) chloride AND J is (sodium) iodide ; 1
Q3 · You are going to measure the length l of a spring when different loads L are added to it…
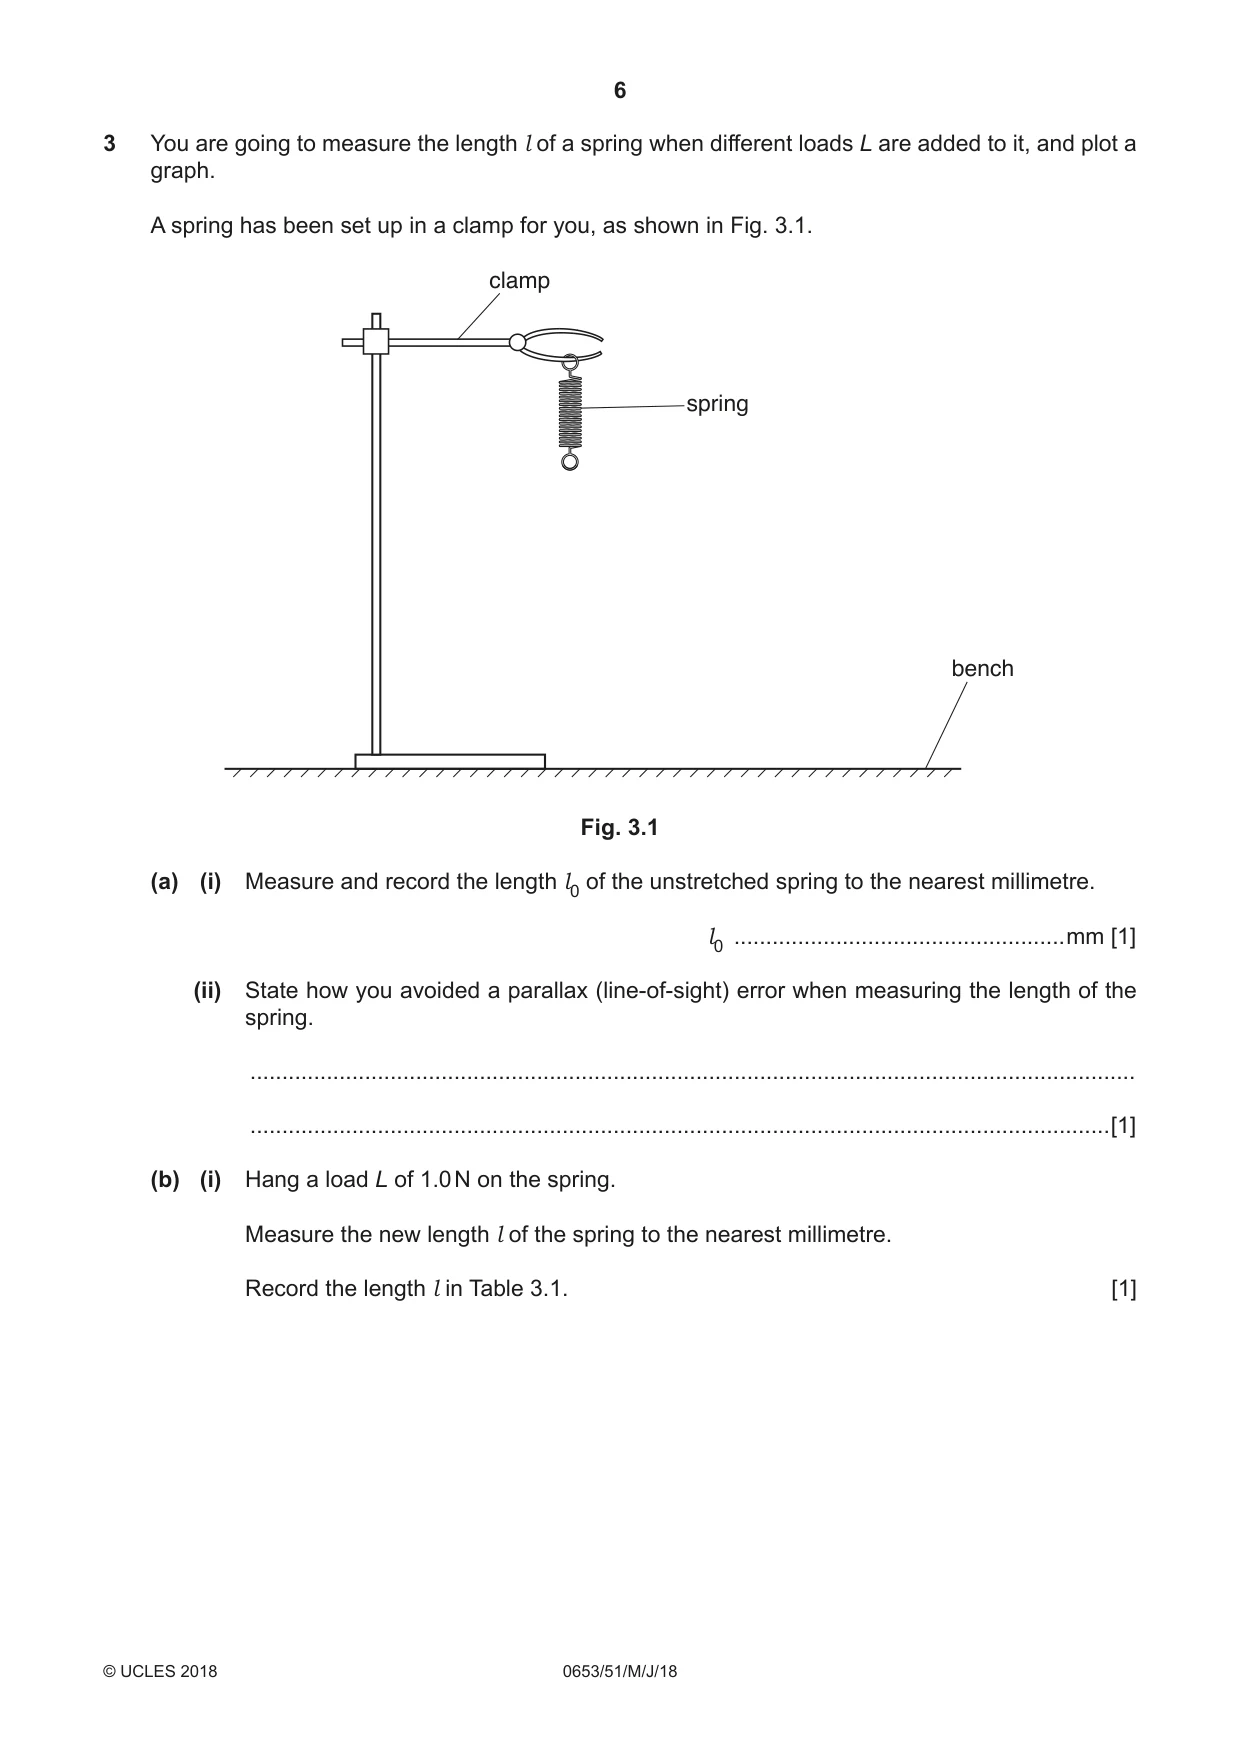
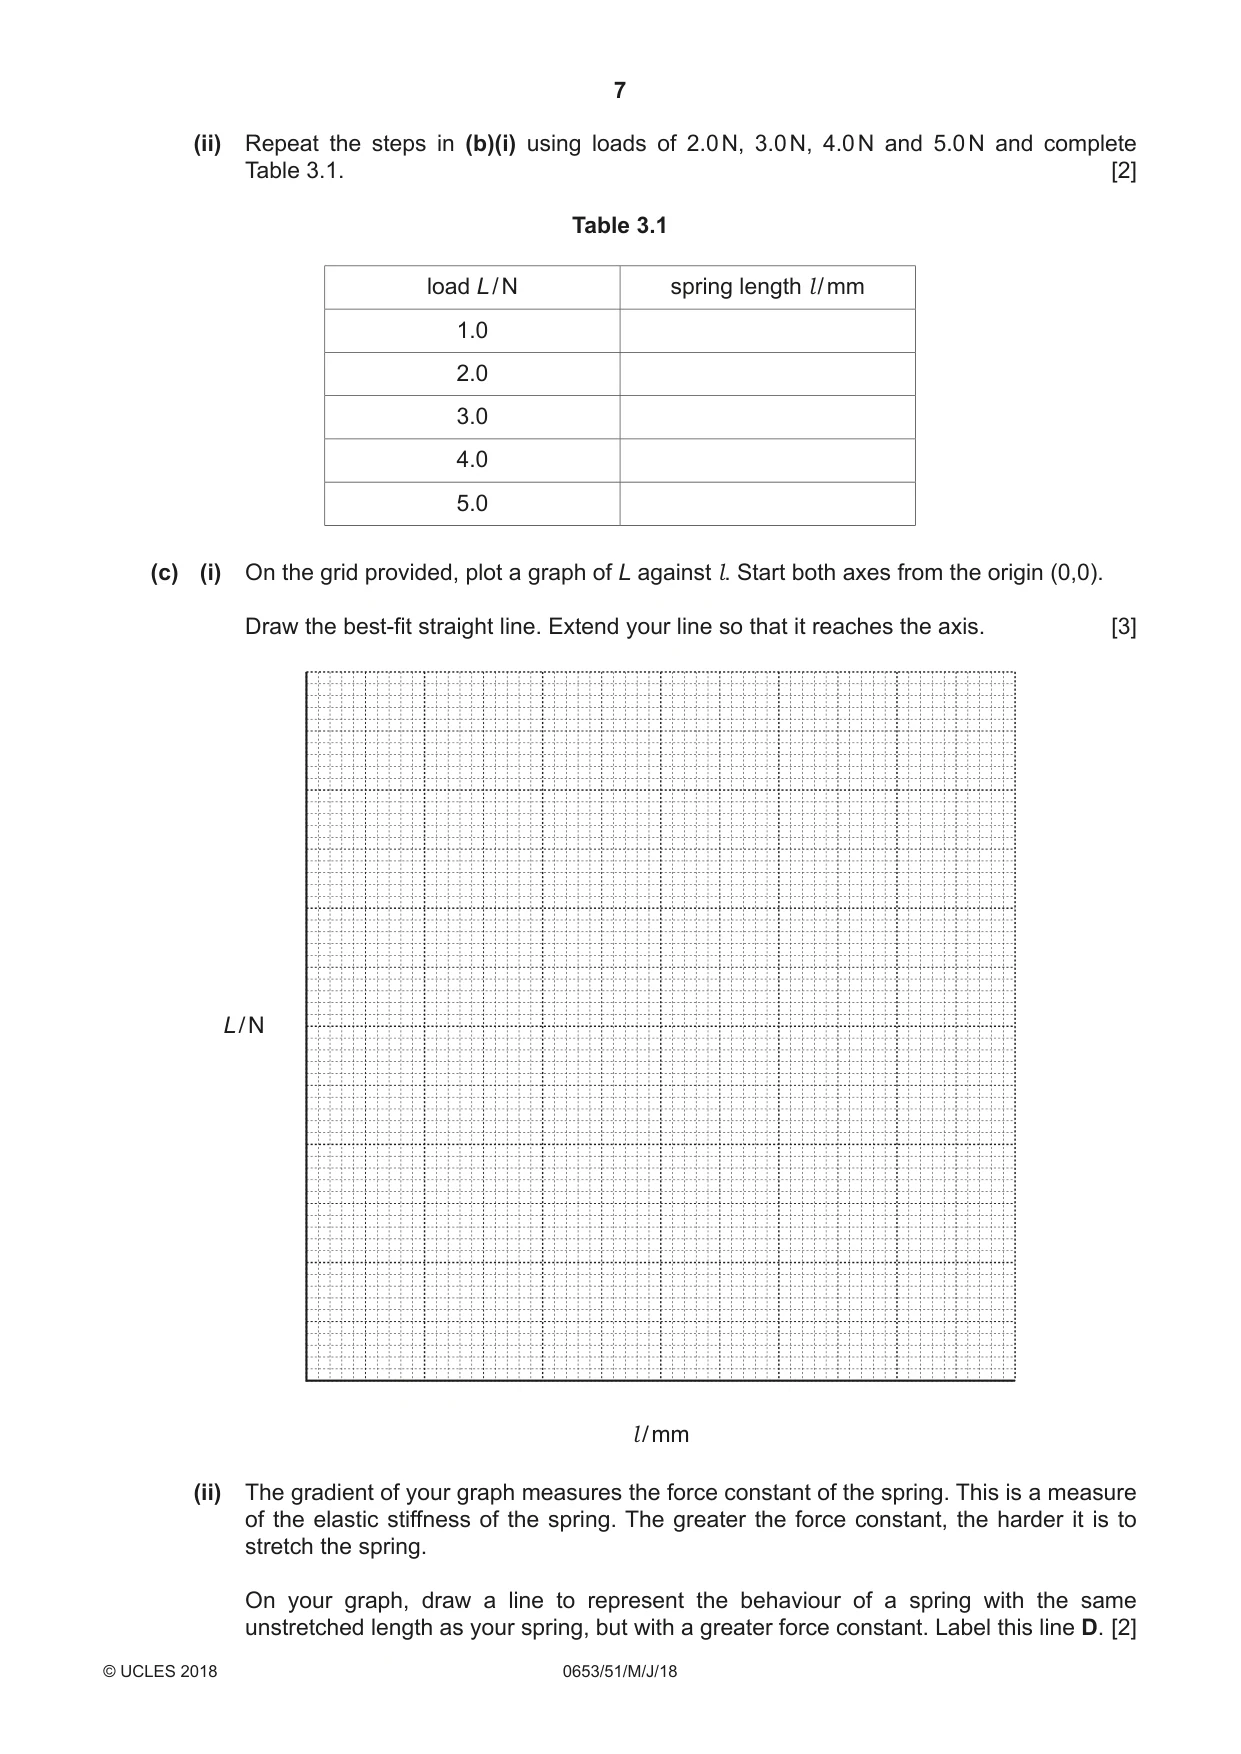
3 You are going to measure the length l of a spring when different loads L are added to it, and plot a graph. A spring has been set up in a clamp for you, as shown in Fig. 3.1. clamp spring bench Fig. 3.1 (a) (i) Measure and record the length l0 of the unstretched spring to the nearest millimetre. l0 ....................................................mm [1] (ii) State how you avoided a parallax (line-of-sight) error when measuring the length of the spring. ........................................................................................................................................... .......................................................................................................................................[1] (b) (i) Hang a load L of 1.0 N on the spring. Measure the new length l of the spring to the nearest millimetre. Record the length l in Table 3.1. [1] (ii) Repeat the steps in (b)(i) using loads of 2.0 N, 3.0 N, 4.0 N and 5.0 N and complete Table 3.1. [2] Table 3.1 load L / N spring length l / mm 1.0 2.0 3.0 4.0 5.0 (c) (i) On the grid provided, plot a graph of L against l. Start both axes from the origin (0,0). Draw the best-fit straight line. Extend your line so that it reaches the axis. [3] L / N l / mm (ii) The gradient of your graph measures the force constant of the spring. This is a measure of the elastic stiffness of the spring. The greater the force constant, the harder it is to stretch the spring. On your graph, draw a line to represent the behaviour of a spring with the same unstretched length as your spring, but with a greater force constant. Label this line D. [2] NOTES FOR USE IN QUALITATIVE ANALYSIS Tests for anions anion test test result carbonate (CO32–) add dilute acid effervescence, carbon dioxide produced chloride (Cl –) acidify with dilute nitric acid, then white ppt. [in solution] add aqueous silver nitrate nitrate (NO3–) add aqueous sodium hydroxide, ammonia produced [in solution] then aluminium foil; warm carefully sulfate (SO42–) acidify with dilute nitric acid, then white ppt. [in solution] add aqueous barium nitrate Tests for aqueous cations cation effect of aqueous sodium hydroxide effect of aqueous ammonia ammonium (NH4+) ammonia produced on warming – copper(II) (Cu2+) light blue ppt., insoluble in excess light blue ppt., soluble in excess, giving a dark blue solution iron(II) (Fe2+) green ppt., insoluble in excess green ppt., insoluble in excess iron(III) (Fe3+) red-brown ppt., insoluble in excess red-brown ppt., insoluble in excess zinc (Zn2+) white ppt., soluble in excess giving white ppt., soluble in excess giving a colourless solution a colourless solution Tests for gases gas test and test result ammonia (NH3) turns damp red litmus paper blue carbon dioxide (CO2) turns limewater milky chlorine (Cl 2) bleaches damp litmus paper hydrogen (H2) ‘pops’ with a lighted splint oxygen (O2) relights a glowing splint
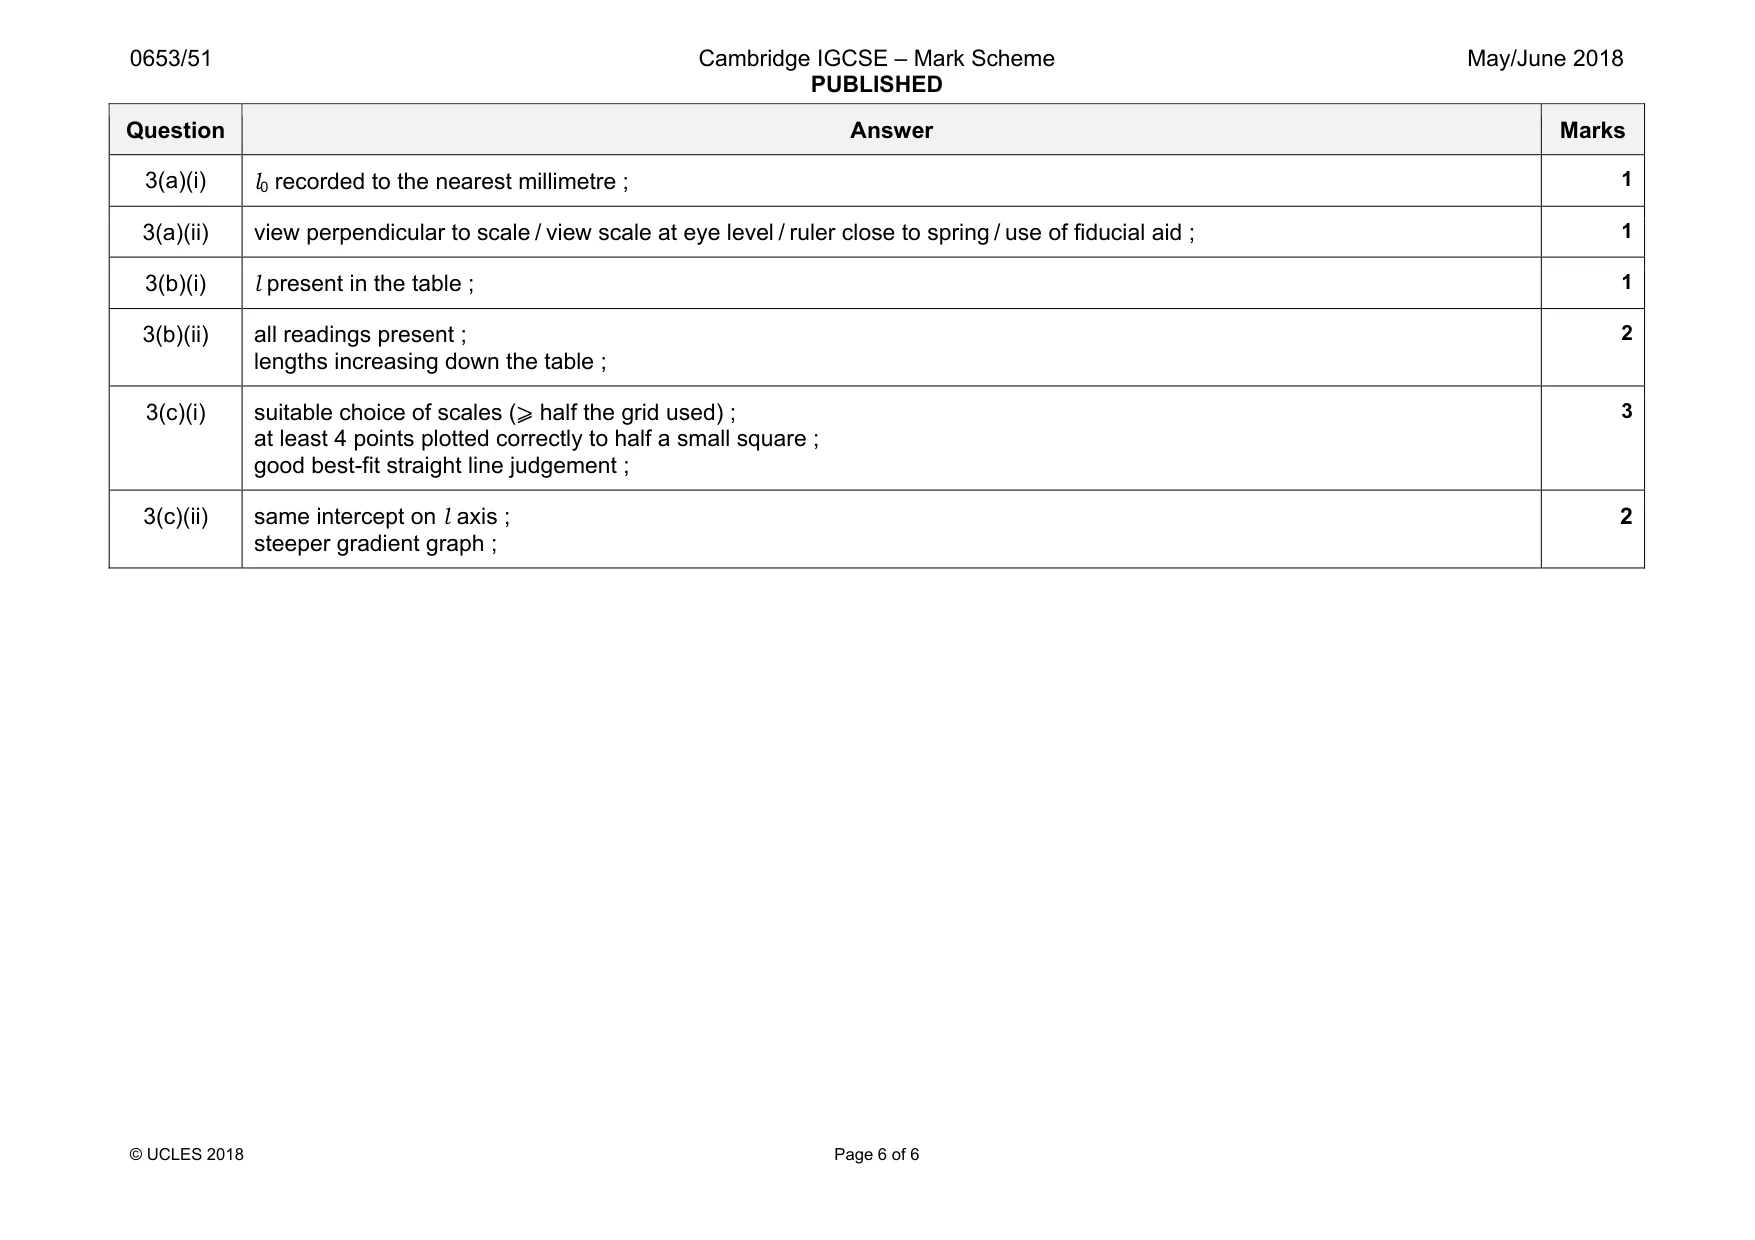
Mark scheme: 3(a)(i) 3(a)(ii) view perpendicular to scale / view scale at eye level / ruler close to spring / use of fiducial aid ; 1 3(b)(i) l present in the table ; 1 3(b)(ii) all readings present ; lengths increasing down the table ; 2 3(c)(i) suitable choice of scales (⩾ half the grid used) ; at least 4 points plotted correctly to half a small square ; good best-fit straight line judgement ; 3 3(c)(ii) same intercept on l axis ; steeper gradient graph ; 2
More questions on Physical quantities and measurement techniques
What was in this paper
The subtopics covered by these 3 questions, and how many questions each got. Open one in a new tab to see every Cambridge question on it.
What you needed in this session
Cambridge’s own grade thresholds for 2018 May/June, Paper 5 · Variant 1. A higher threshold means an easier paper — the bar moves with how the cohort did.