Cambridge IGCSE Science - Combined 0653 — 2017 Oct/Nov Paper 5 · Variant 1
0653/51/O/N/17 · 3 questions · 30 marks · ≈34 min
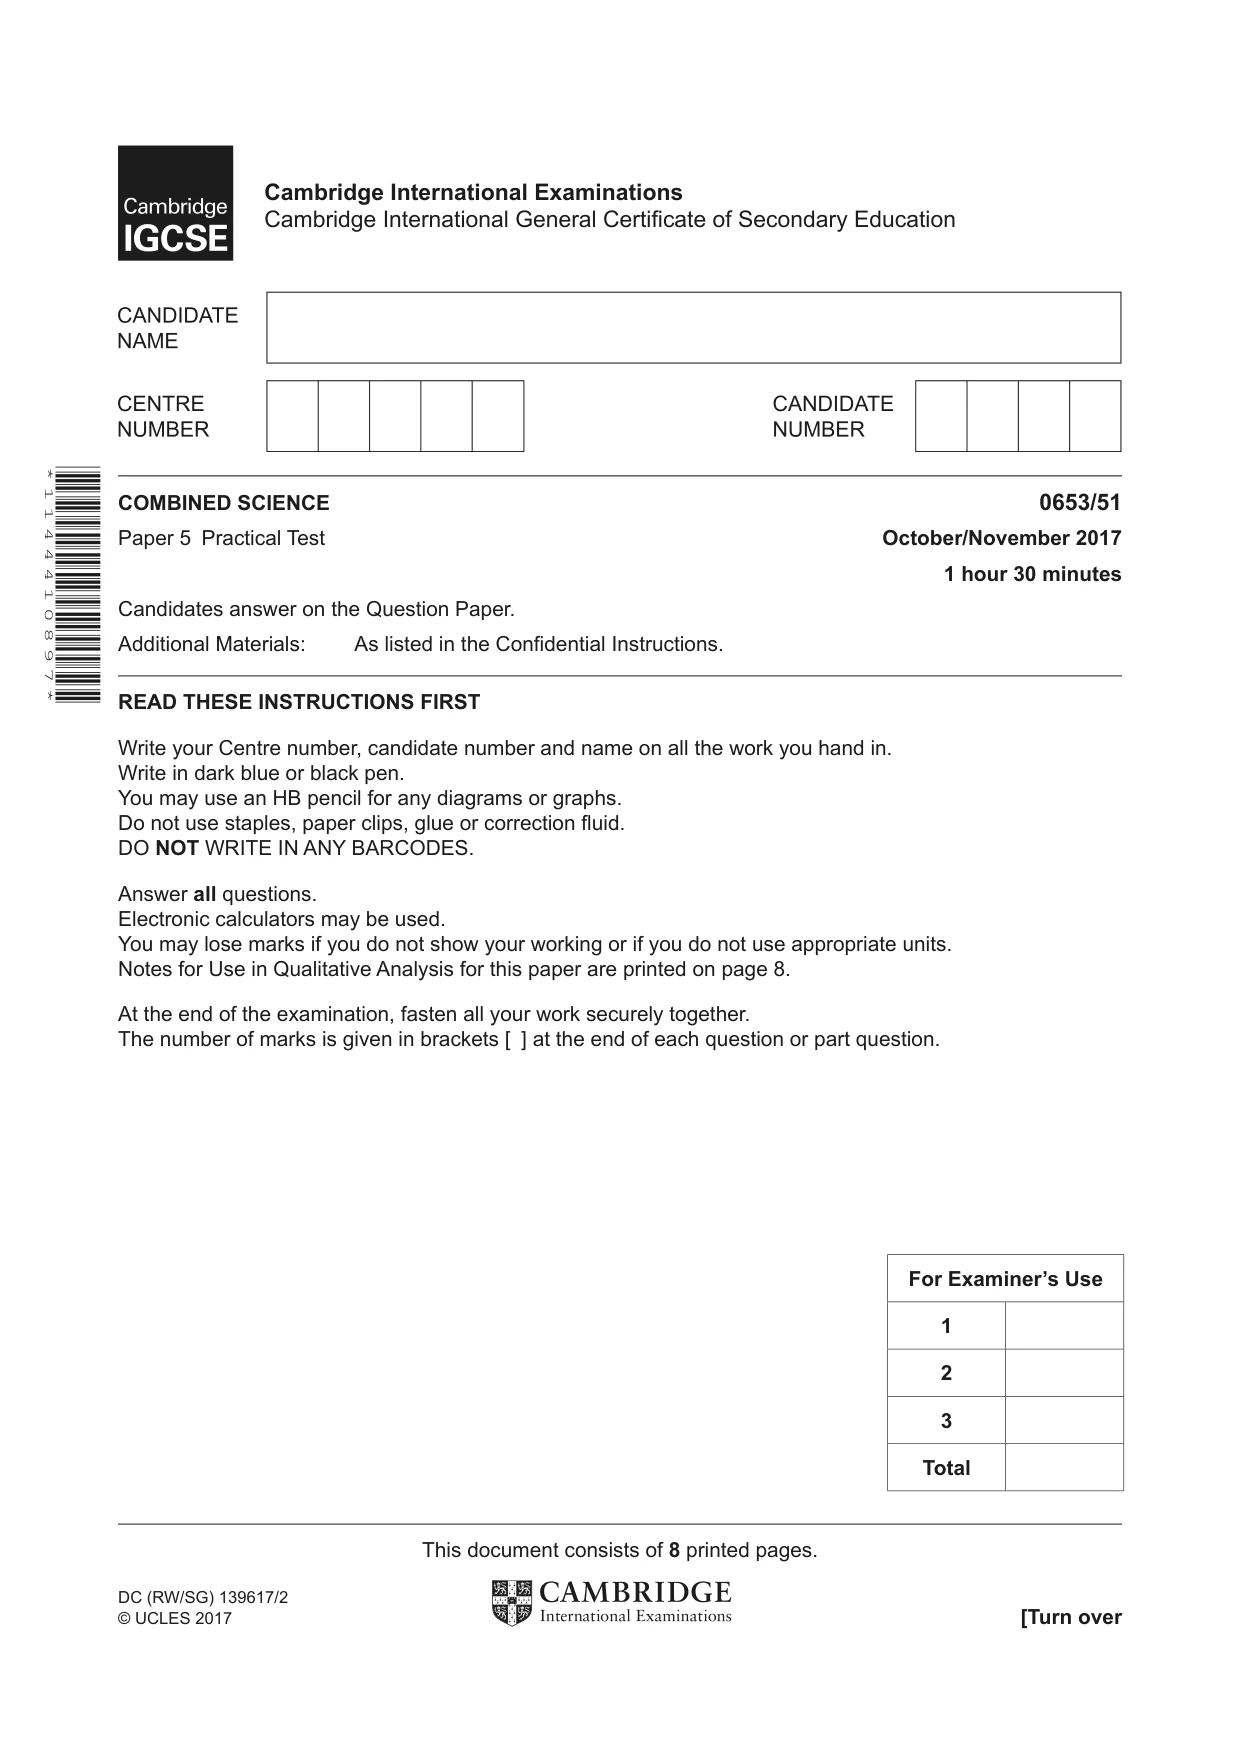
The question paper and its mark scheme, free to read here and free to download. This is Cambridge’s own paper, exactly as it was sat.
Question paper8 pages
Mark scheme3 pages
Answers below. Sit the paper first if you are practising.
Questions as text
Q1 · You are going to investigate the action of four different concentrations of an enzyme on…
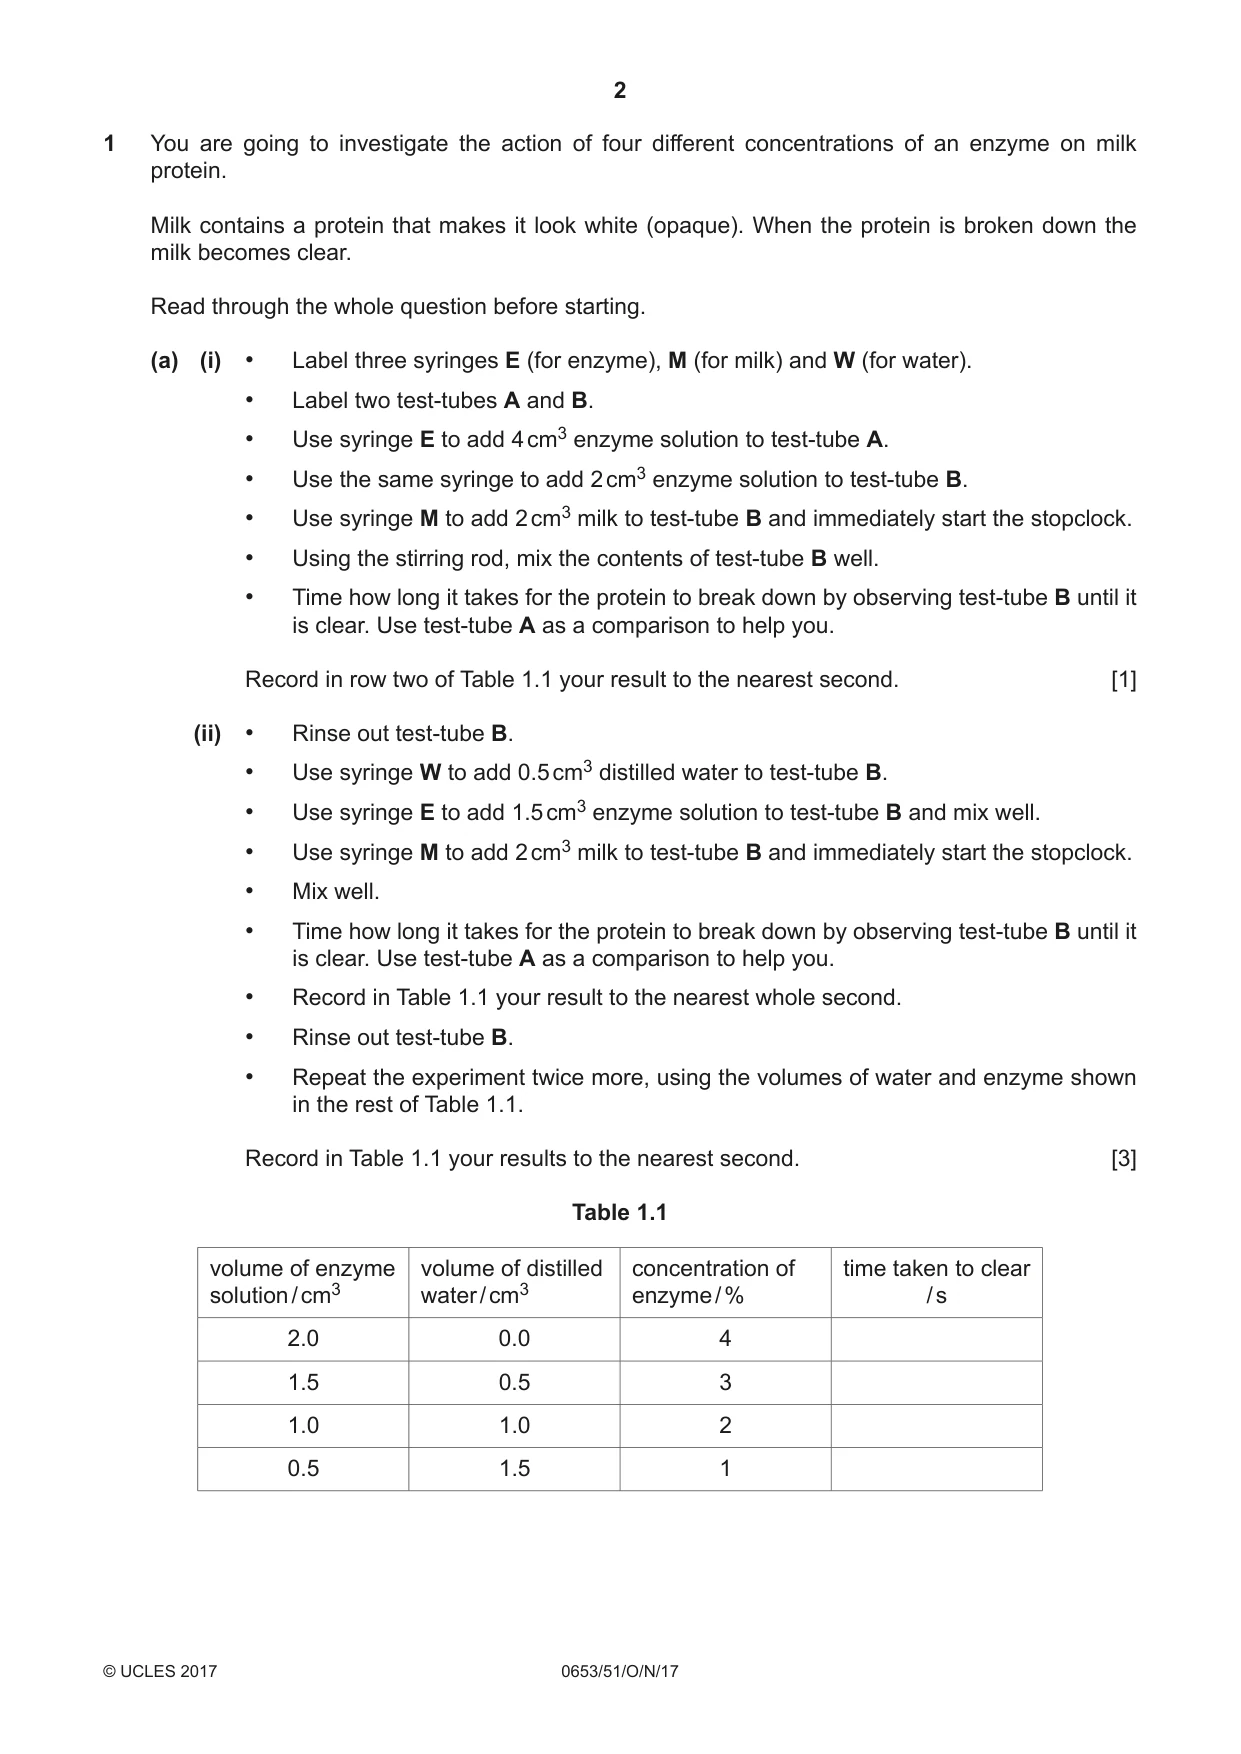
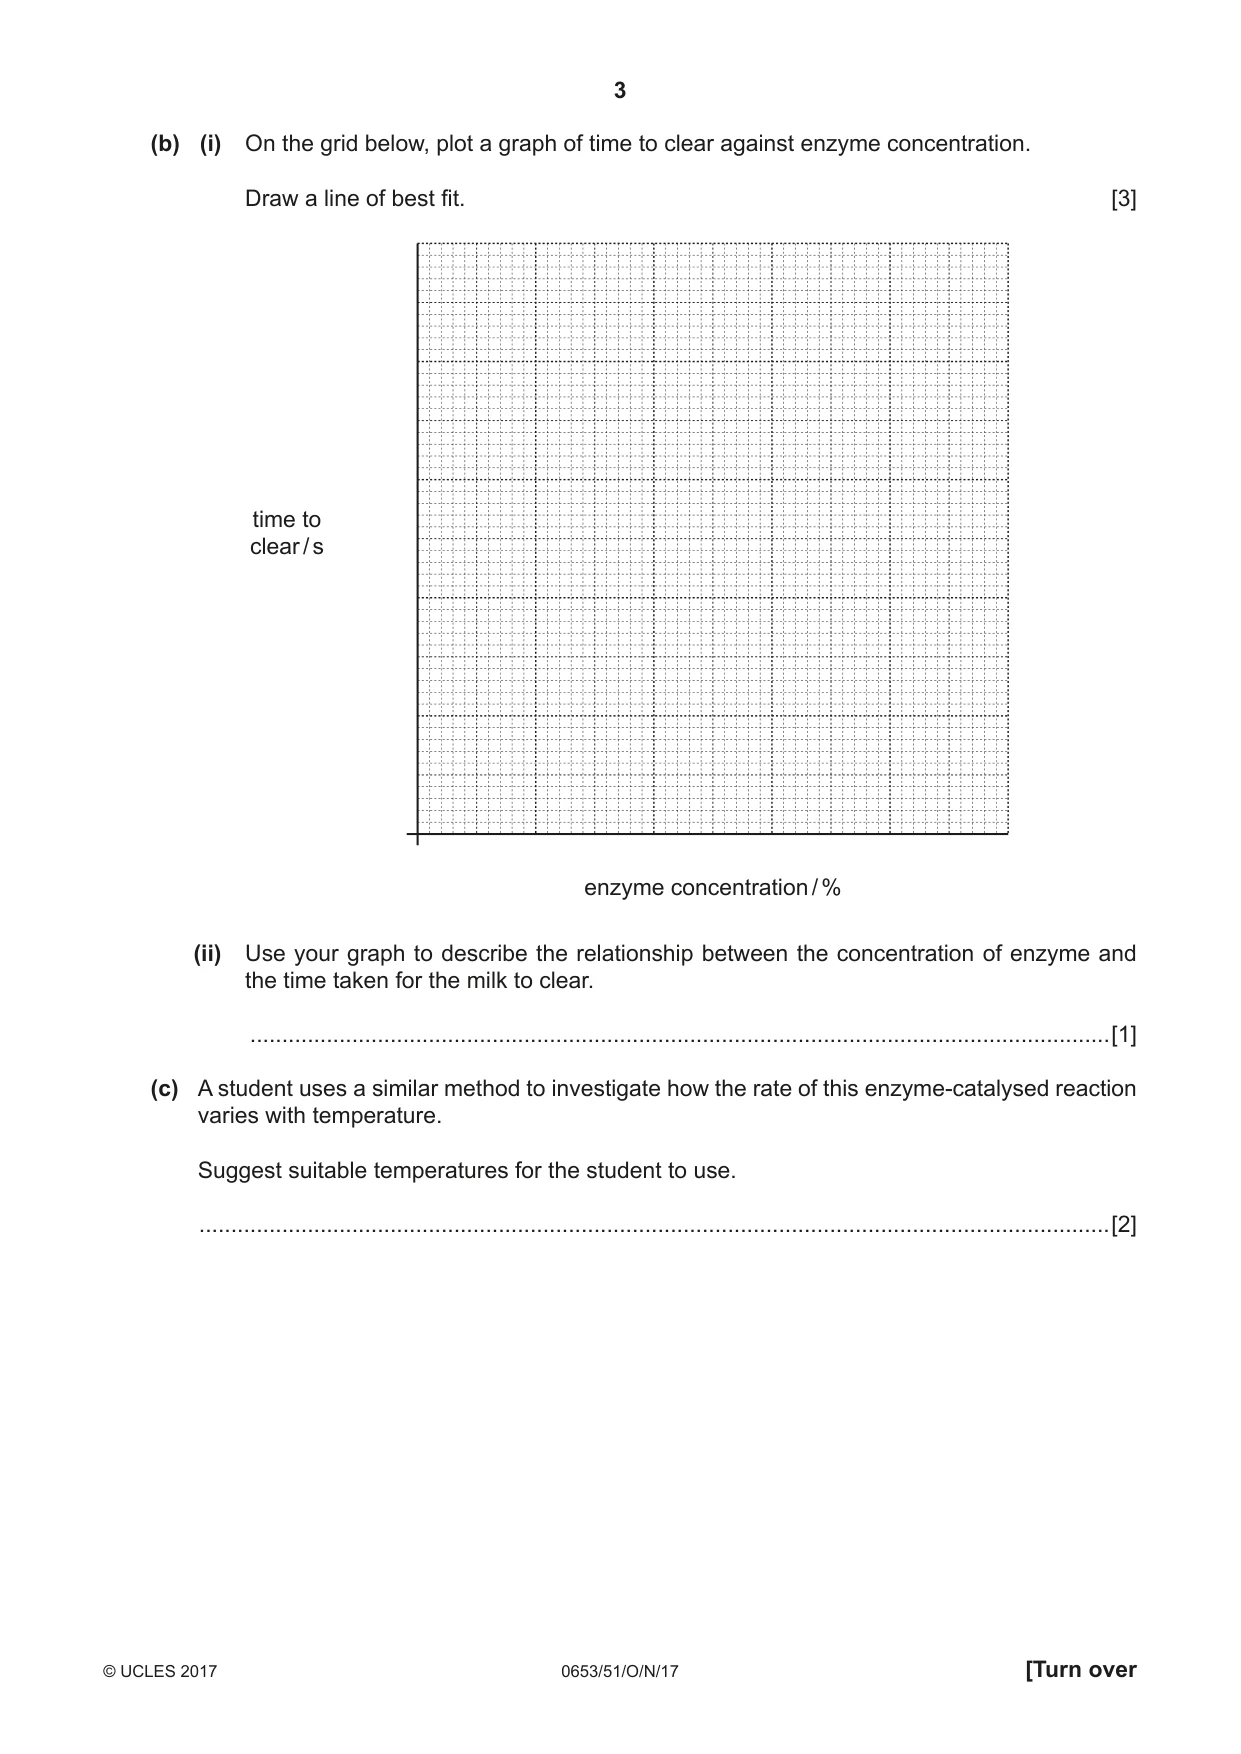
1 You are going to investigate the action of four different concentrations of an enzyme on milk protein. Milk contains a protein that makes it look white (opaque). When the protein is broken down the milk becomes clear. Read through the whole question before starting. (a) (i) • Label three syringes E (for enzyme), M (for milk) and W (for water). • Label two test-tubes A and B. • Use syringe E to add 4 cm3 enzyme solution to test-tube A. • Use the same syringe to add 2 cm3 enzyme solution to test-tube B. • Use syringe M to add 2 cm3 milk to test-tube B and immediately start the stopclock. • Using the stirring rod, mix the contents of test-tube B well. • Time how long it takes for the protein to break down by observing test-tube B until it is clear. Use test-tube A as a comparison to help you. Record in row two of Table 1.1 your result to the nearest second. [1] (ii) • Rinse out test-tube B. • Use syringe W to add 0.5 cm3 distilled water to test-tube B. • Use syringe E to add 1.5 cm3 enzyme solution to test-tube B and mix well. • Use syringe M to add 2 cm3 milk to test-tube B and immediately start the stopclock. • Mix well. • Time how long it takes for the protein to break down by observing test-tube B until it is clear. Use test-tube A as a comparison to help you. • Record in Table 1.1 your result to the nearest whole second. • Rinse out test-tube B. • Repeat the experiment twice more, using the volumes of water and enzyme shown in the rest of Table 1.1. Record in Table 1.1 your results to the nearest second. [3] Table 1.1 volume of enzyme volume of distilled concentration of time taken to clear solution / cm3 water / cm3 enzyme / % / s 2.0 0.0 4 1.5 0.5 3 1.0 1.0 2 0.5 1.5 1 (b) (i) On the grid below, plot a graph of time to clear against enzyme concentration. Draw a line of best fit. [3] time to clear / s enzyme concentration / % (ii) Use your graph to describe the relationship between the concentration of enzyme and the time taken for the milk to clear. .......................................................................................................................................[1] (c) A student uses a similar method to investigate how the rate of this enzyme-catalysed reaction varies with temperature. Suggest suitable temperatures for the student to use. ...............................................................................................................................................[2]
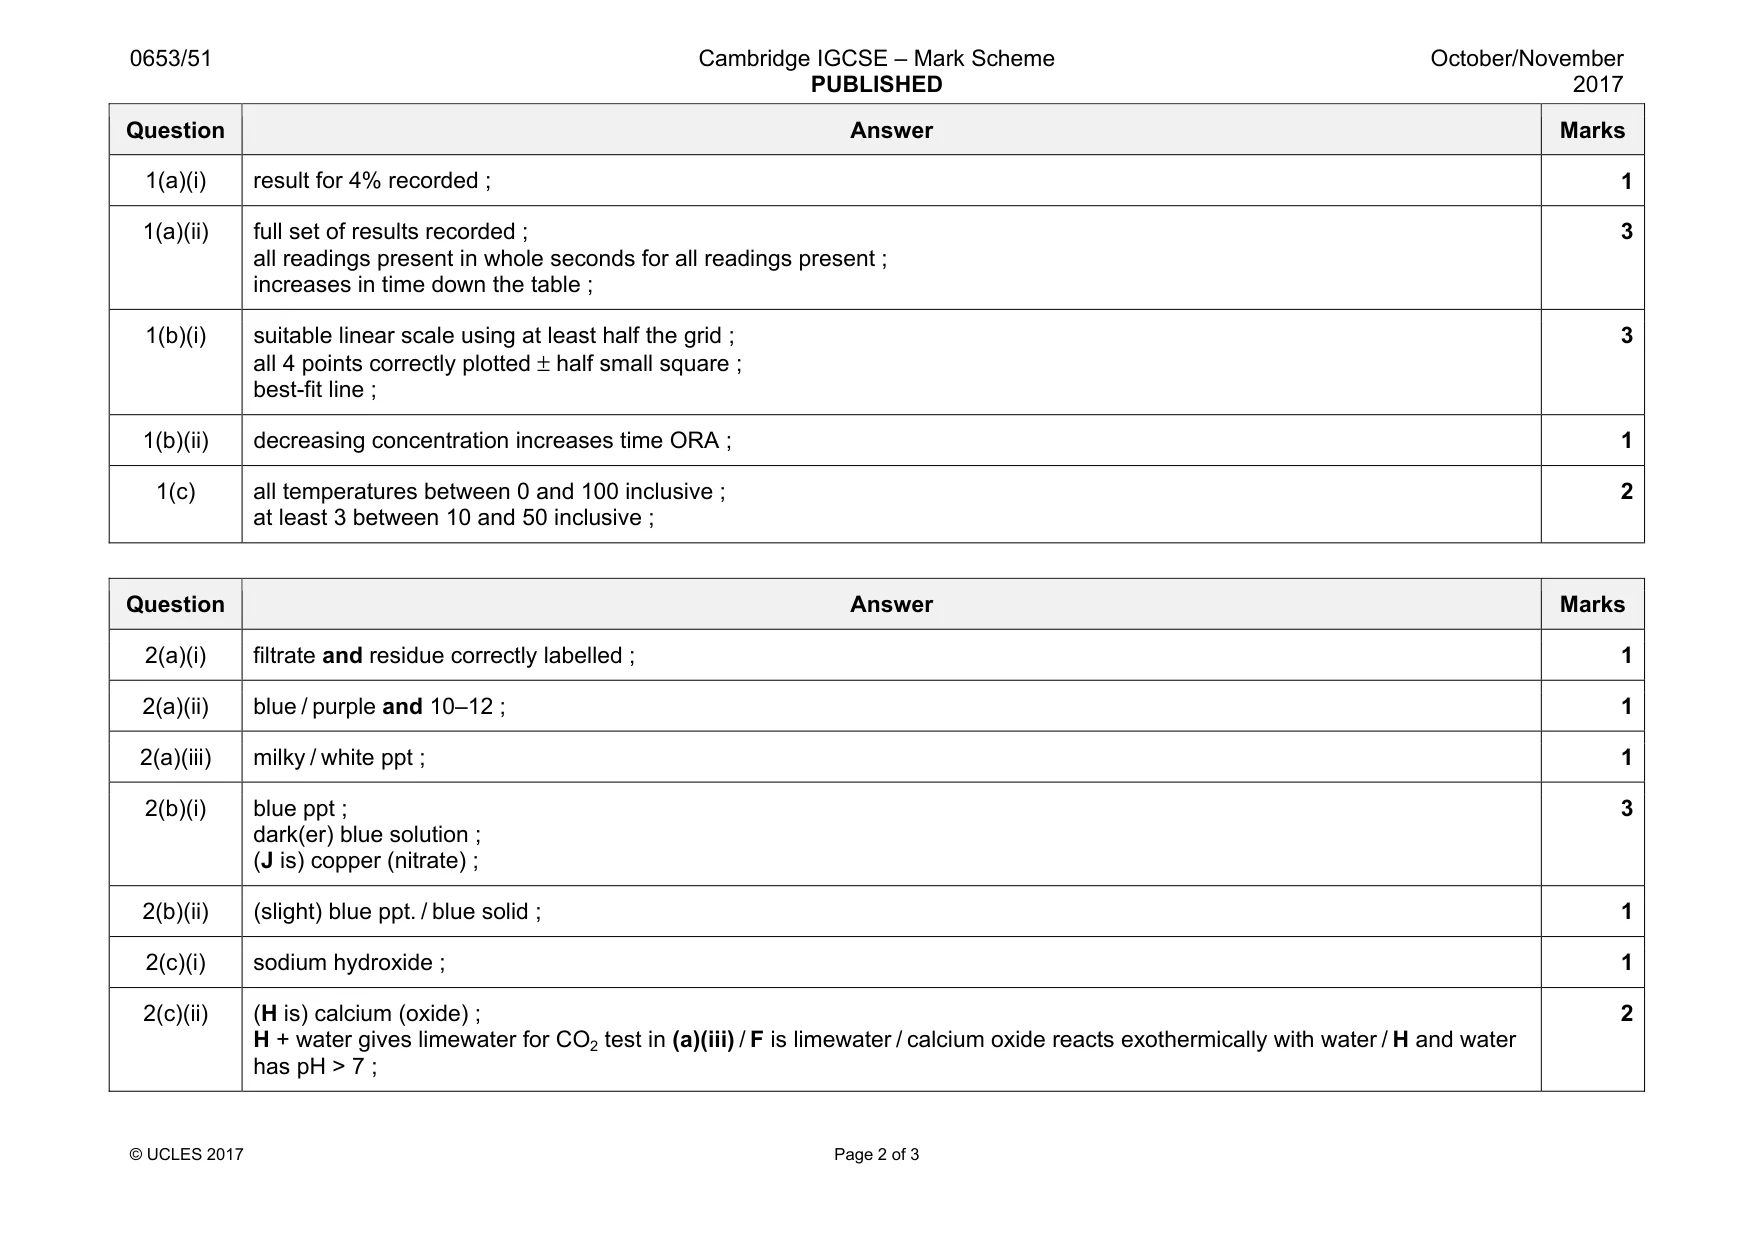
Mark scheme: 1(a)(i) result for 4% recorded ; 1 1(a)(ii) full set of results recorded ; all readings present in whole seconds for all readings present ; increases in time down the table ; 3 1(b)(i) suitable linear scale using at least half the grid ; all 4 points correctly plotted ± half small square ; best-fit line ; 3 1(b)(ii) decreasing concentration increases time ORA ; 1 1(c) all temperatures between 0 and 100 inclusive ; at least 3 between 10 and 50 inclusive ; 2
Q2 · Notes for use in Qualitative Analysis for this section are printed on page 8
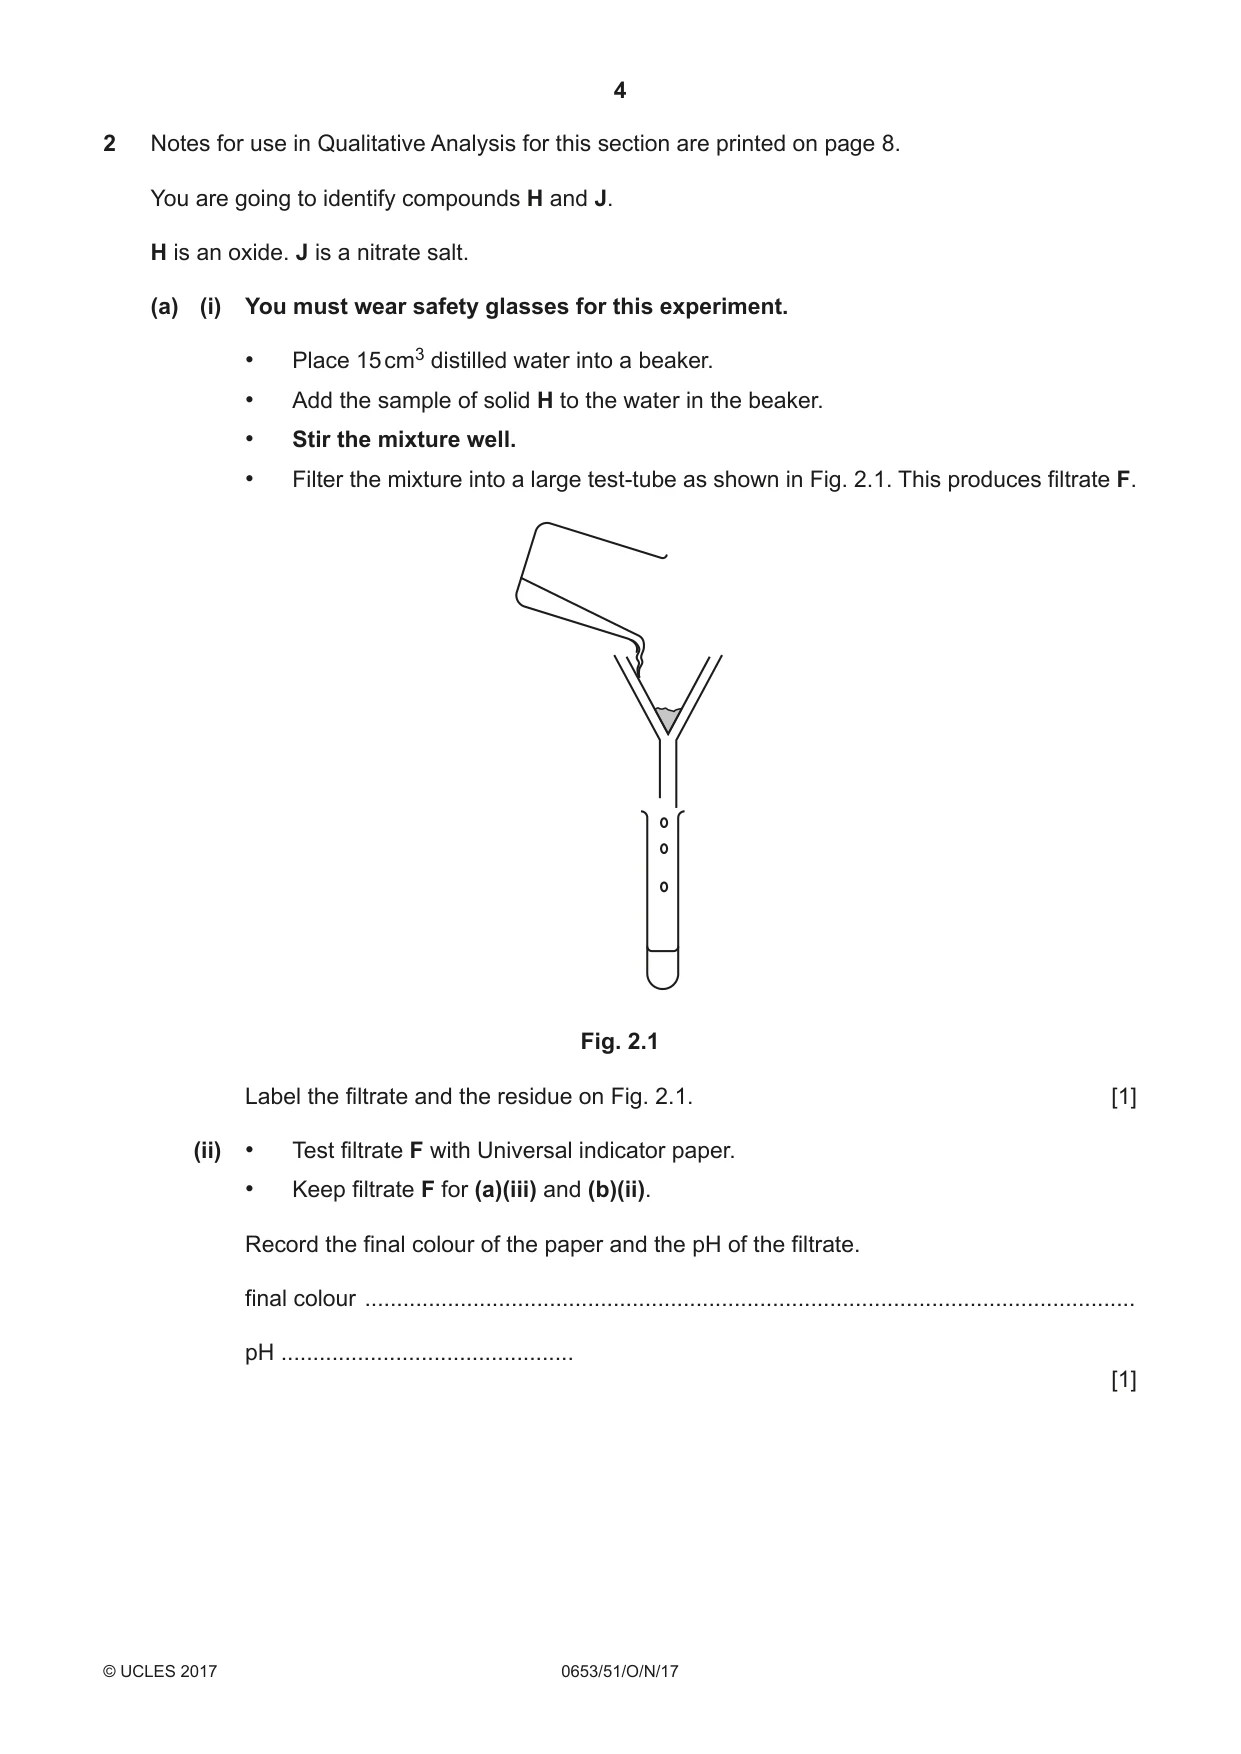
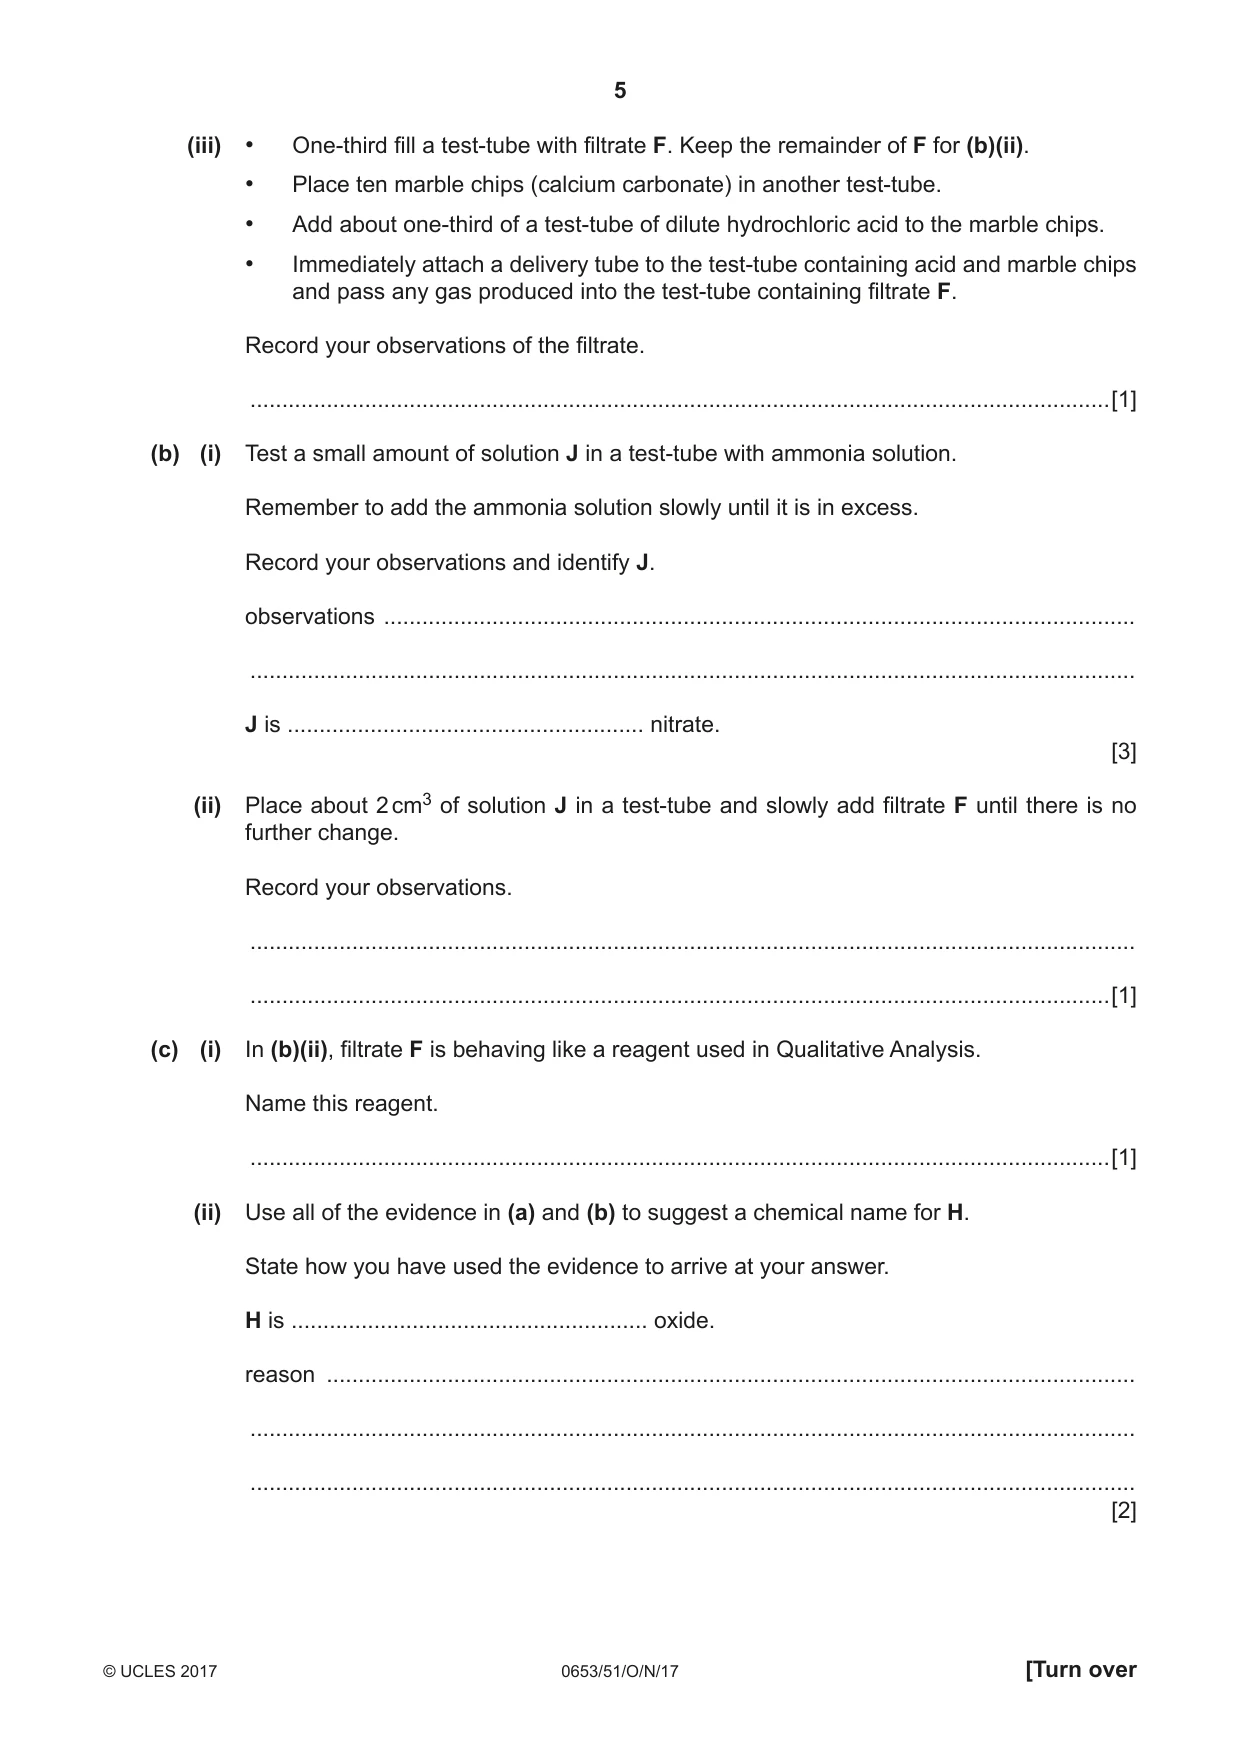
2 Notes for use in Qualitative Analysis for this section are printed on page 8. You are going to identify compounds H and J. H is an oxide. J is a nitrate salt. (a) (i) You must wear safety glasses for this experiment. • Place 15 cm3 distilled water into a beaker. • Add the sample of solid H to the water in the beaker. • Stir the mixture well. • Filter the mixture into a large test-tube as shown in Fig. 2.1. This produces filtrate F. Fig. 2.1 Label the filtrate and the residue on Fig. 2.1. [1] (ii) • Test filtrate F with Universal indicator paper. • Keep filtrate F for (a)(iii) and (b)(ii). Record the final colour of the paper and the pH of the filtrate. final colour ......................................................................................................................... pH .............................................. [1] (iii) • One-third fill a test-tube with filtrate F. Keep the remainder of F for (b)(ii). • Place ten marble chips (calcium carbonate) in another test-tube. • Add about one-third of a test-tube of dilute hydrochloric acid to the marble chips. • Immediately attach a delivery tube to the test-tube containing acid and marble chips and pass any gas produced into the test-tube containing filtrate F. Record your observations of the filtrate. .......................................................................................................................................[1] (b) (i) Test a small amount of solution J in a test-tube with ammonia solution. Remember to add the ammonia solution slowly until it is in excess. Record your observations and identify J. observations ...................................................................................................................... ........................................................................................................................................... J is ........................................................ nitrate. [3] (ii) Place about 2 cm3 of solution J in a test-tube and slowly add filtrate F until there is no further change. Record your observations. ........................................................................................................................................... .......................................................................................................................................[1] (c) (i) In (b)(ii), filtrate F is behaving like a reagent used in Qualitative Analysis. Name this reagent. .......................................................................................................................................[1] (ii) Use all of the evidence in (a) and (b) to suggest a chemical name for H. State how you have used the evidence to arrive at your answer. H is ........................................................ oxide. reason ............................................................................................................................... ........................................................................................................................................... ........................................................................................................................................... [2]
Mark scheme: 2(a)(i) filtrate and residue correctly labelled ; 1 2(a)(ii) blue / purple and 10–12 ; 1 2(a)(iii) milky / white ppt ; 1 2(b)(i) blue ppt ; dark(er) blue solution ; (J is) copper (nitrate) ; 3 2(b)(ii) (slight) blue ppt. / blue solid ; 1 2(c)(i) sodium hydroxide ; 1 2(c)(ii) (H is) calcium (oxide) ; H + water gives limewater for CO2 test in (a)(iii) / F is limewater / calcium oxide reacts exothermically with water / H and water has pH > 7 ; 2
Q3 · You are going to investigate how the power output P of a filament lamp depends upon the…
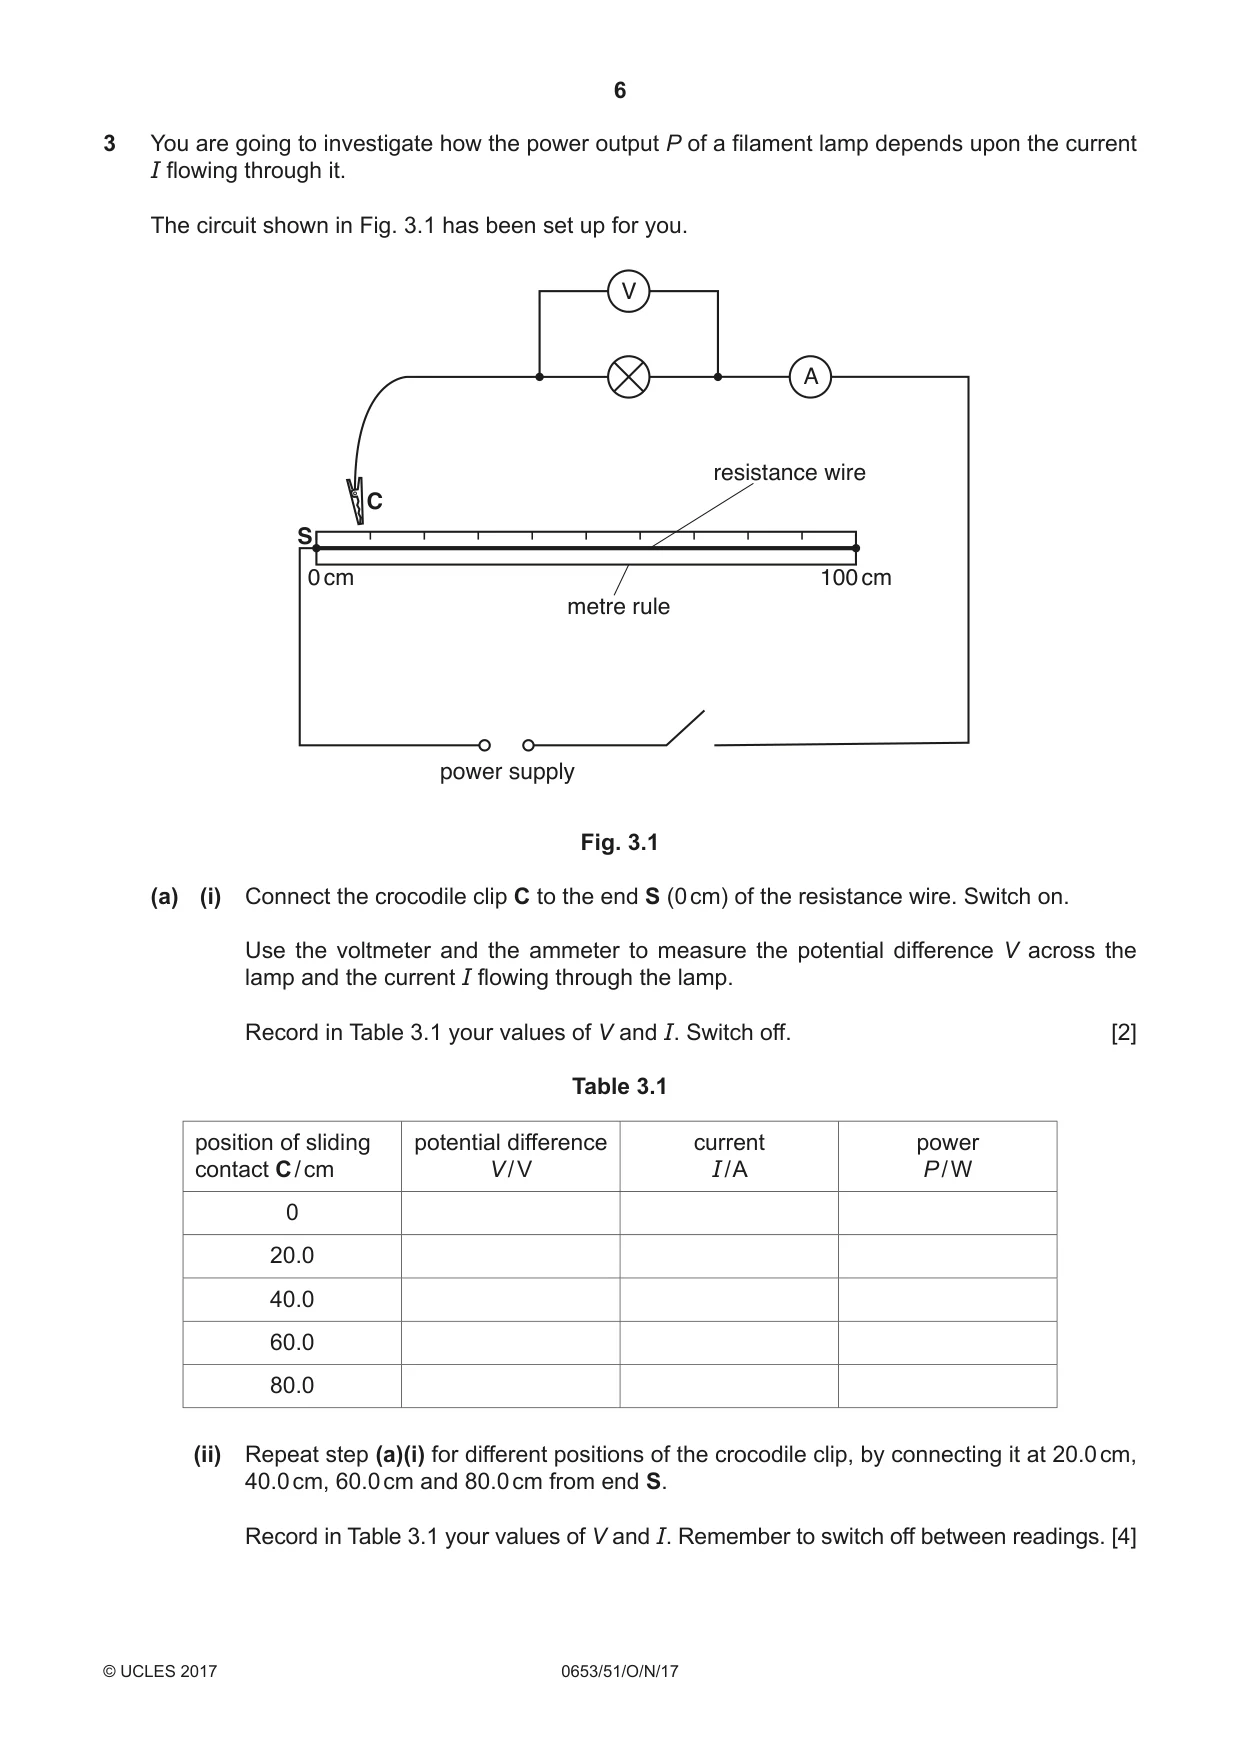
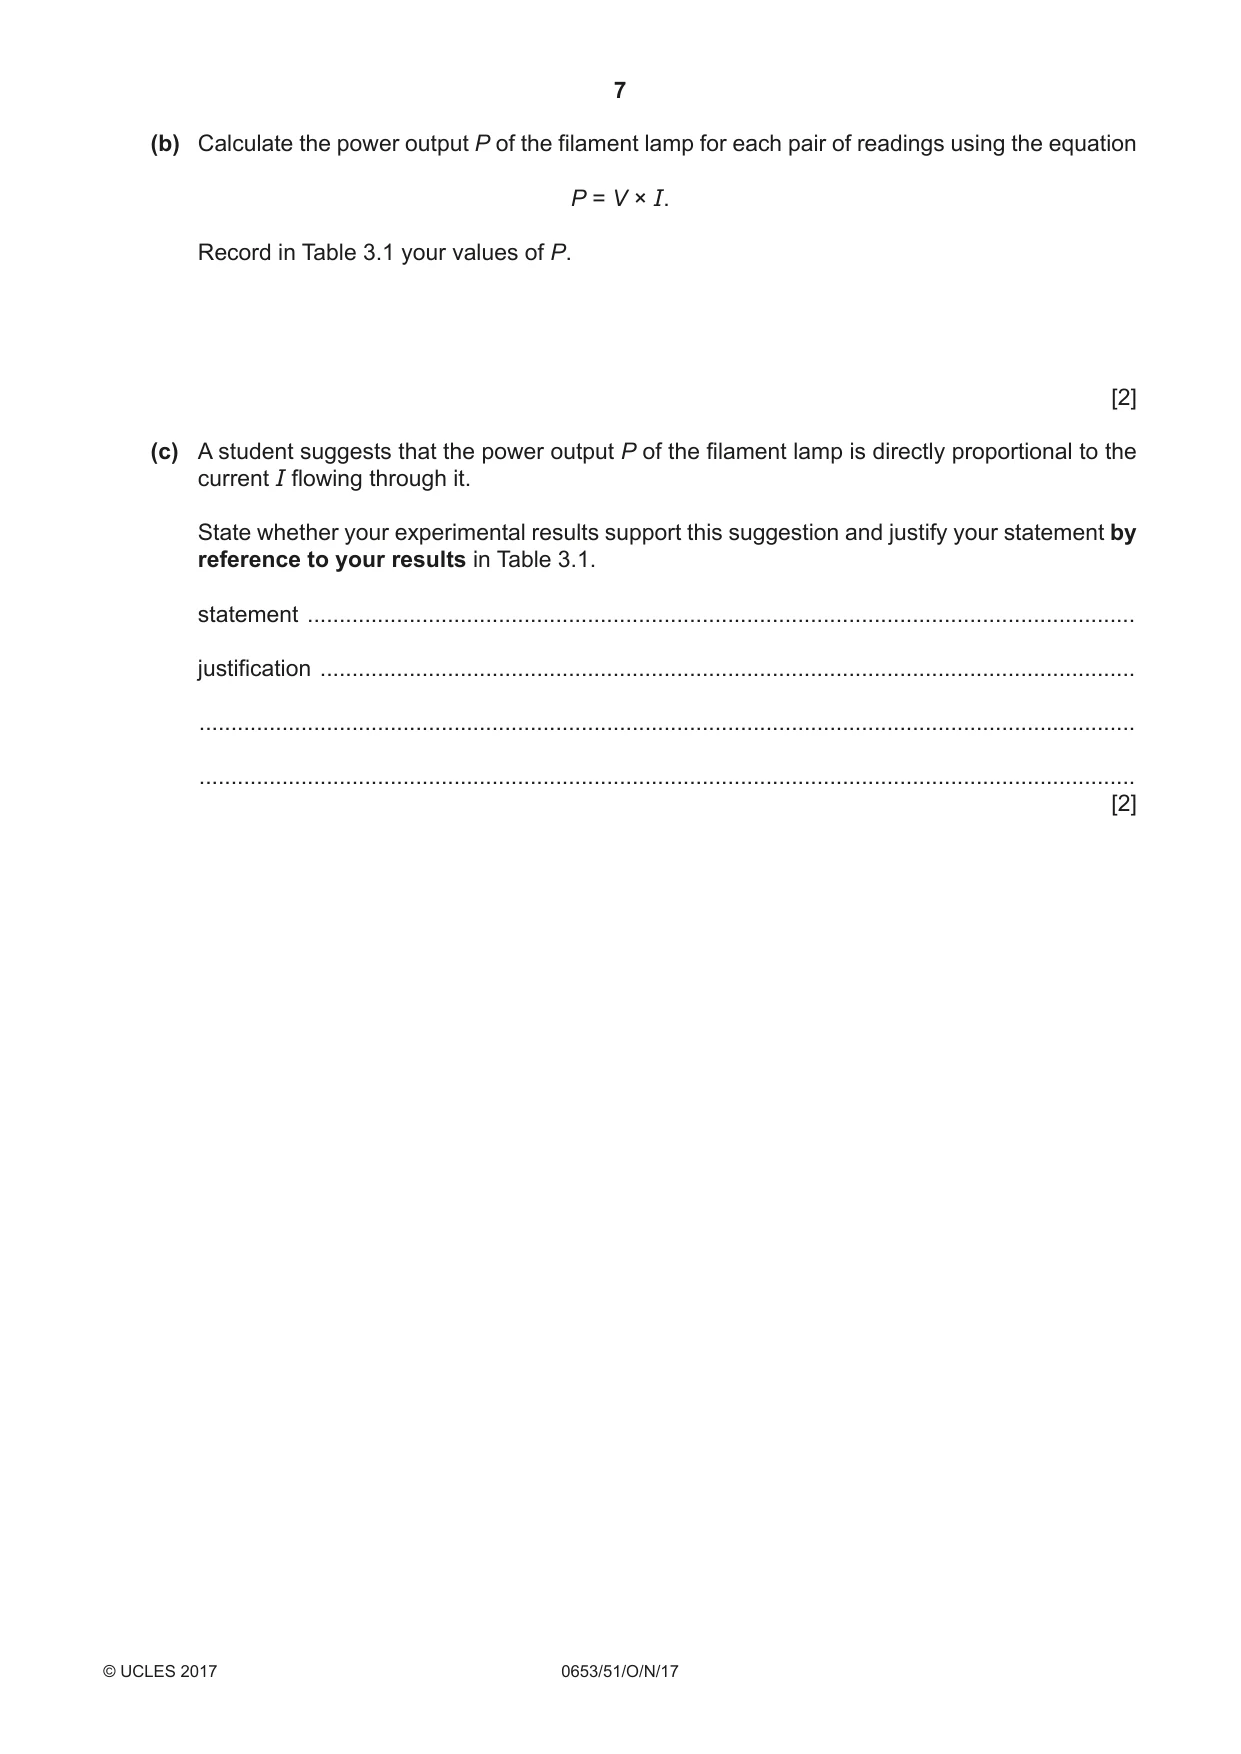
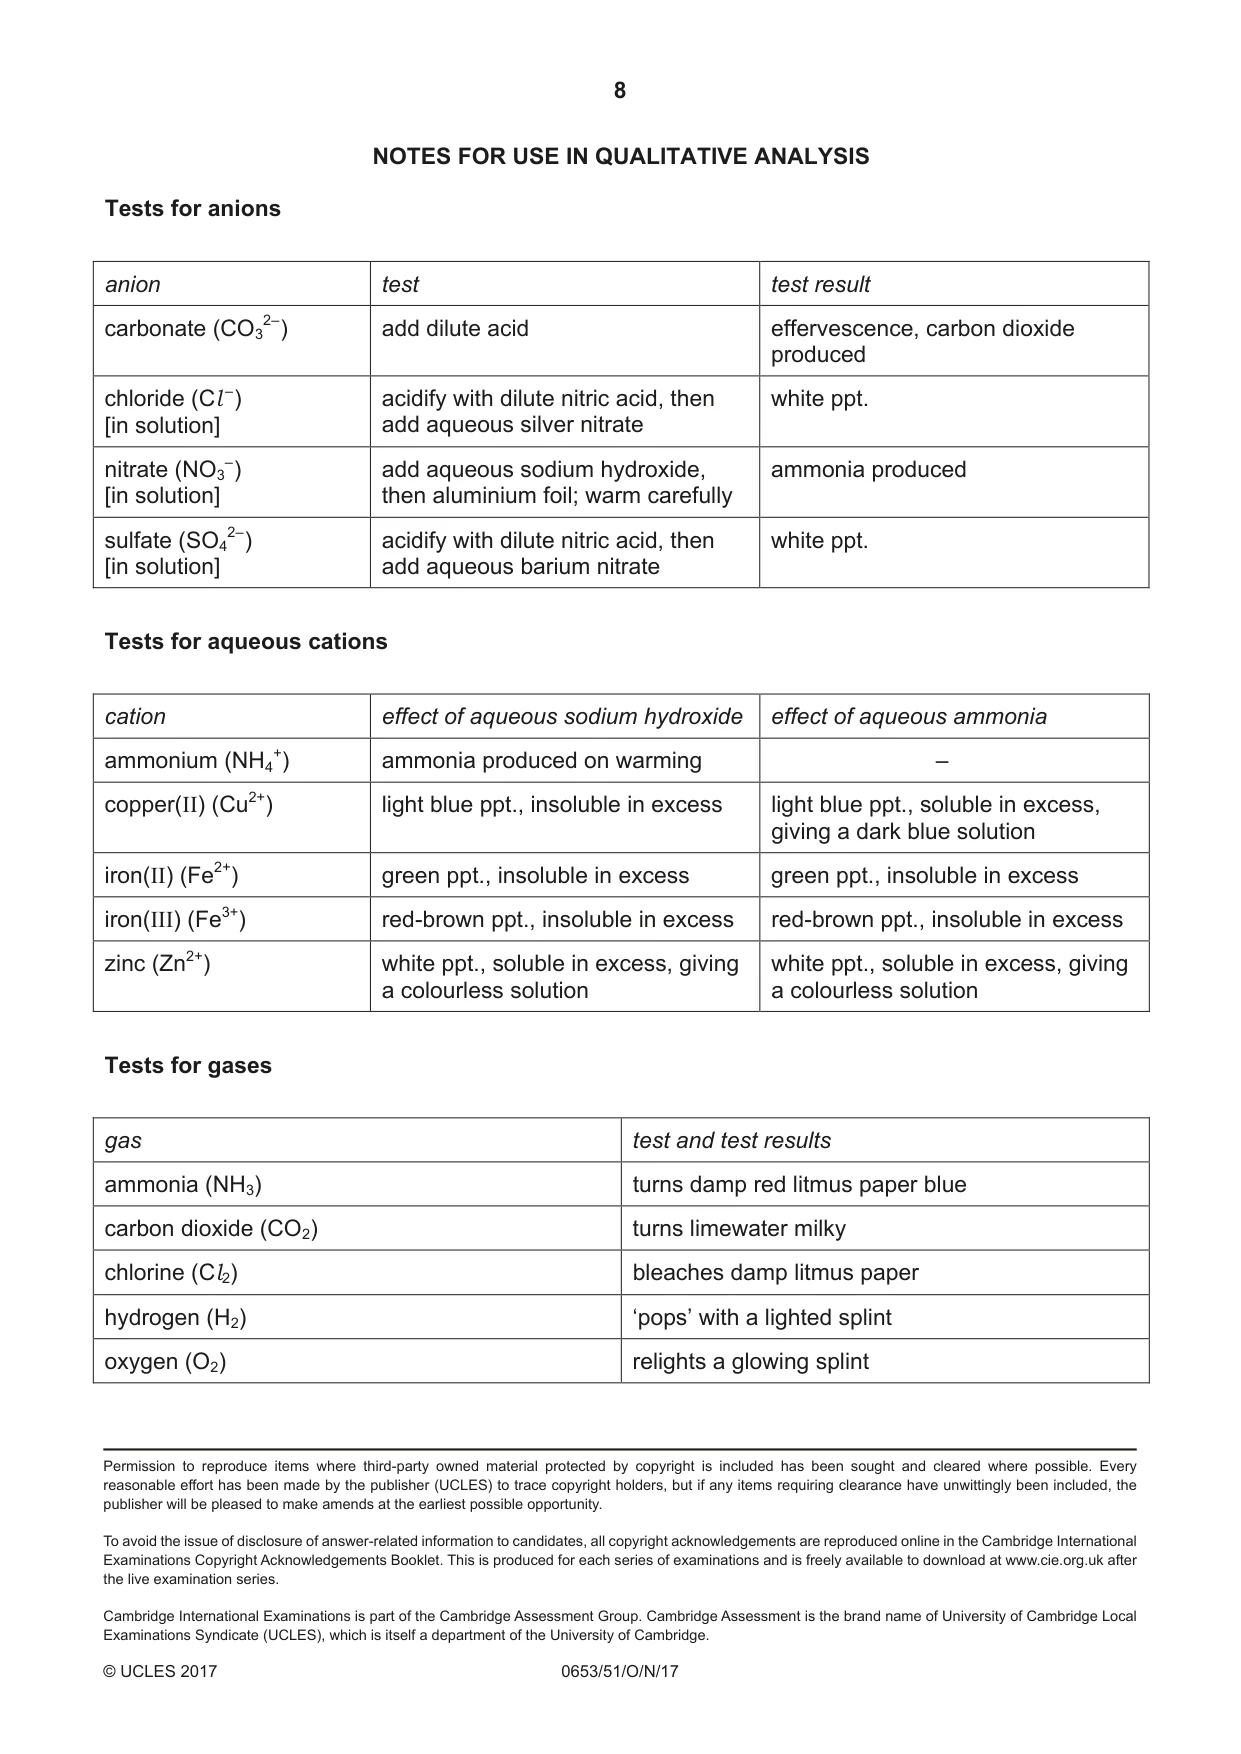
3 You are going to investigate how the power output P of a filament lamp depends upon the current I flowing through it. The circuit shown in Fig. 3.1 has been set up for you. V A resistance wire C S 0 cm 100 cm metre rule power supply Fig. 3.1 (a) (i) Connect the crocodile clip C to the end S (0 cm) of the resistance wire. Switch on. Use the voltmeter and the ammeter to measure the potential difference V across the lamp and the current I flowing through the lamp. Record in Table 3.1 your values of V and I. Switch off. [2] Table 3.1 position of sliding potential difference current power contact C / cm V / V I / A P / W 0 20.0 40.0 60.0 80.0 (ii) Repeat step (a)(i) for different positions of the crocodile clip, by connecting it at 20.0 cm, 40.0 cm, 60.0 cm and 80.0 cm from end S. Record in Table 3.1 your values of V and I. Remember to switch off between readings. [4] (b) Calculate the power output P of the filament lamp for each pair of readings using the equation P = V × I. Record in Table 3.1 your values of P. [2] (c) A student suggests that the power output P of the filament lamp is directly proportional to the current I flowing through it. State whether your experimental results support this suggestion and justify your statement by reference to your results in Table 3.1. statement .................................................................................................................................. justification ................................................................................................................................ ................................................................................................................................................... ................................................................................................................................................... [2] NOTES FOR USE IN QUALITATIVE ANALYSIS Tests for anions anion test test result carbonate (CO3 2–) add dilute acid effervescence, carbon dioxide produced chloride (Cl –) acidify with dilute nitric acid, then white ppt. [in solution] add aqueous silver nitrate nitrate (NO3 –) add aqueous sodium hydroxide, ammonia produced [in solution] then aluminium foil; warm carefully sulfate (SO4 2–) acidify with dilute nitric acid, then white ppt. [in solution] add aqueous barium nitrate Tests for aqueous cations cation effect of aqueous sodium hydroxide effect of aqueous ammonia ammonium (NH4 +) ammonia produced on warming – copper(II) (Cu2+) light blue ppt., insoluble in excess light blue ppt., soluble in excess, giving a dark blue solution iron(II) (Fe2+) green ppt., insoluble in excess green ppt., insoluble in excess iron(III) (Fe3+) red-brown ppt., insoluble in excess red-brown ppt., insoluble in excess zinc (Zn2+) white ppt., soluble in excess, giving white ppt., soluble in excess, giving a colourless solution a colourless solution Tests for gases gas test and test results ammonia (NH3) turns damp red litmus paper blue carbon dioxide (CO2) turns limewater milky chlorine (Cl2) bleaches damp litmus paper hydrogen (H2) ‘pops’ with a lighted splint oxygen (O2) relights a glowing splint
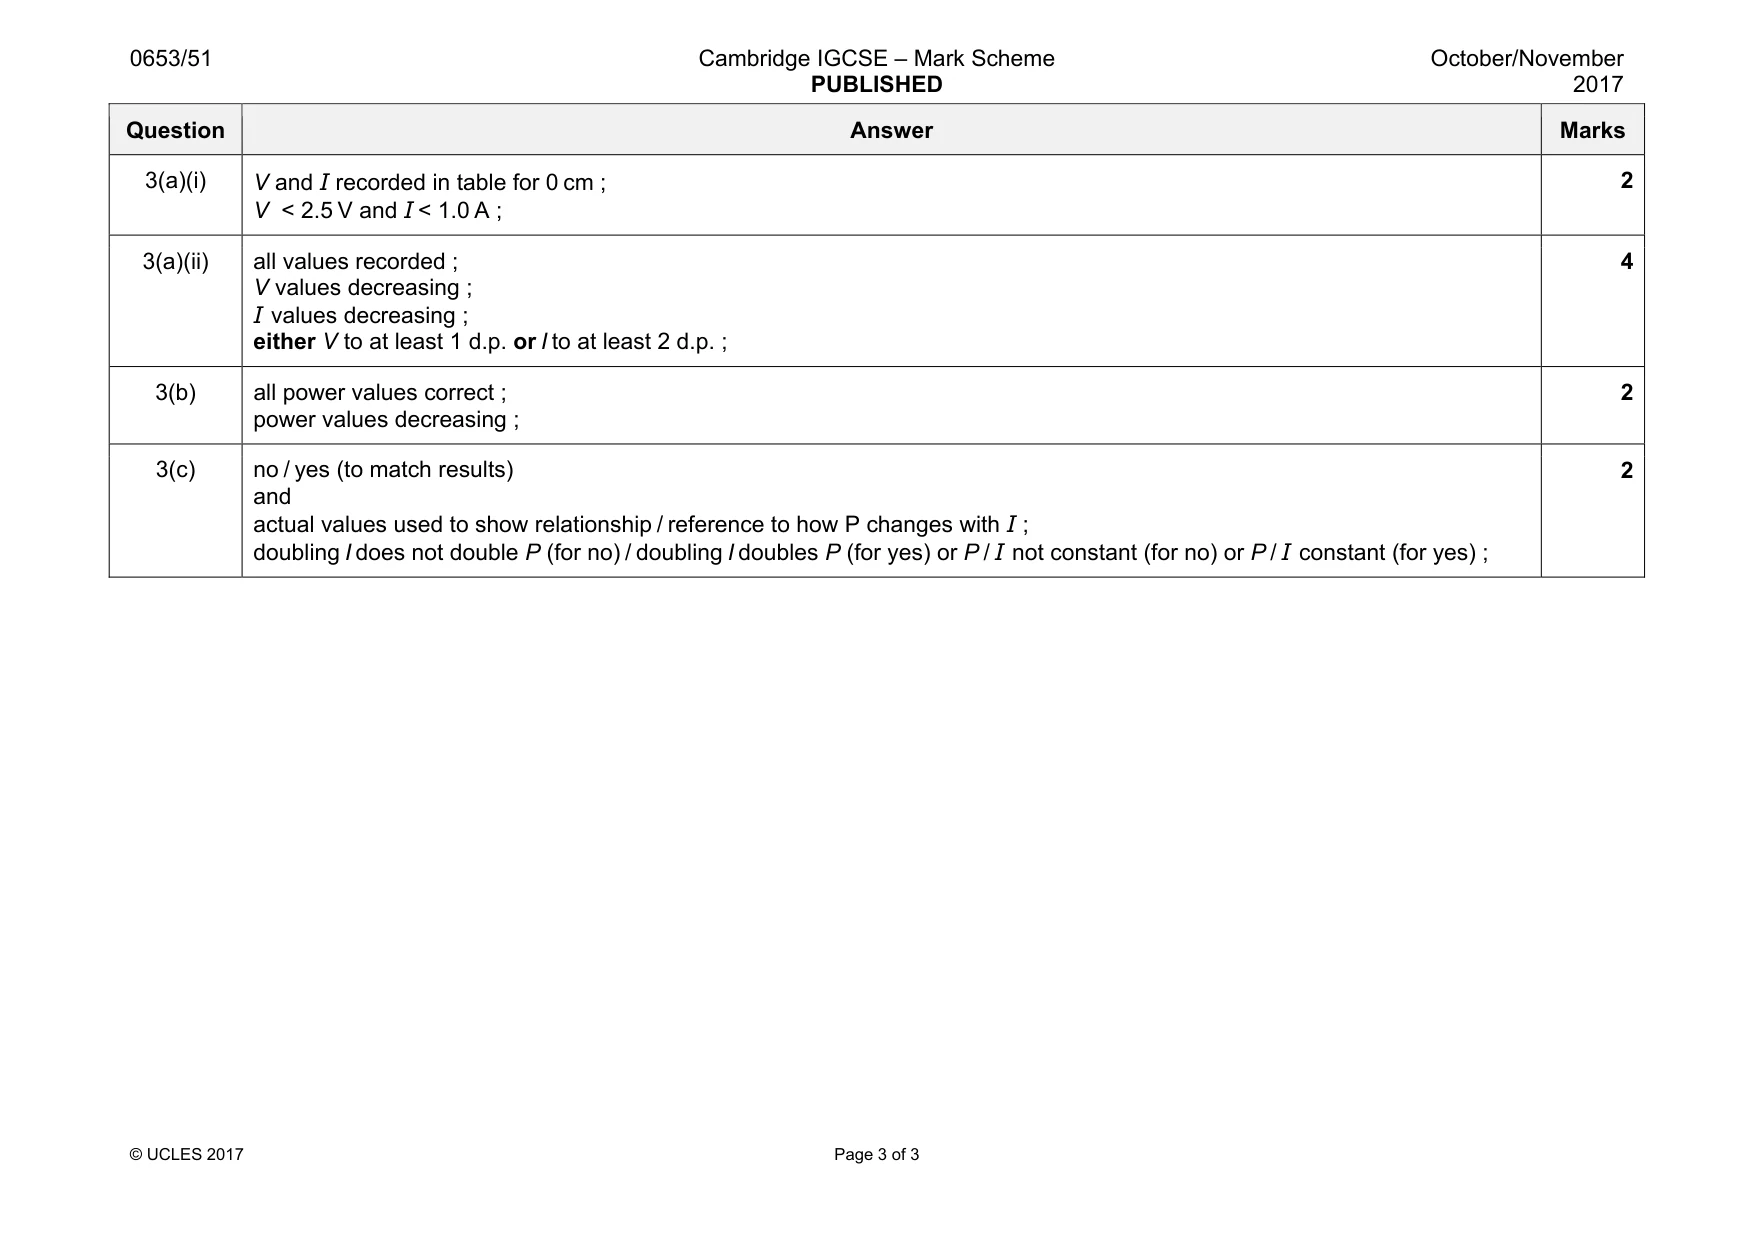
Mark scheme: 3(a)(i) V < 2.5 V and I < 1.0 A ; 2 3(a)(ii) all values recorded ; V values decreasing ; I values decreasing ; either V to at least 1 d.p. or I to at least 2 d.p. ; 4 3(b) all power values correct ; power values decreasing ; 2 3(c) no / yes (to match results) and actual values used to show relationship / reference to how P changes with I ; doubling I does not double P (for no) / doubling I doubles P (for yes) or P / I not constant (for no) or P / I constant (for yes) ; 2
What was in this paper
The subtopics covered by these 3 questions, and how many questions each got. Open one in a new tab to see every Cambridge question on it.
What you needed in this session
Cambridge’s own grade thresholds for 2017 Oct/Nov, Paper 5 · Variant 1. A higher threshold means an easier paper — the bar moves with how the cohort did.