Cambridge IGCSE Science - Combined 0653 — 2017 Oct/Nov Paper 5 · Variant 2
0653/52/O/N/17 · 3 questions · 30 marks · ≈34 min
The question paper and its mark scheme, free to read here and free to download. This is Cambridge’s own paper, exactly as it was sat.
Question paper8 pages
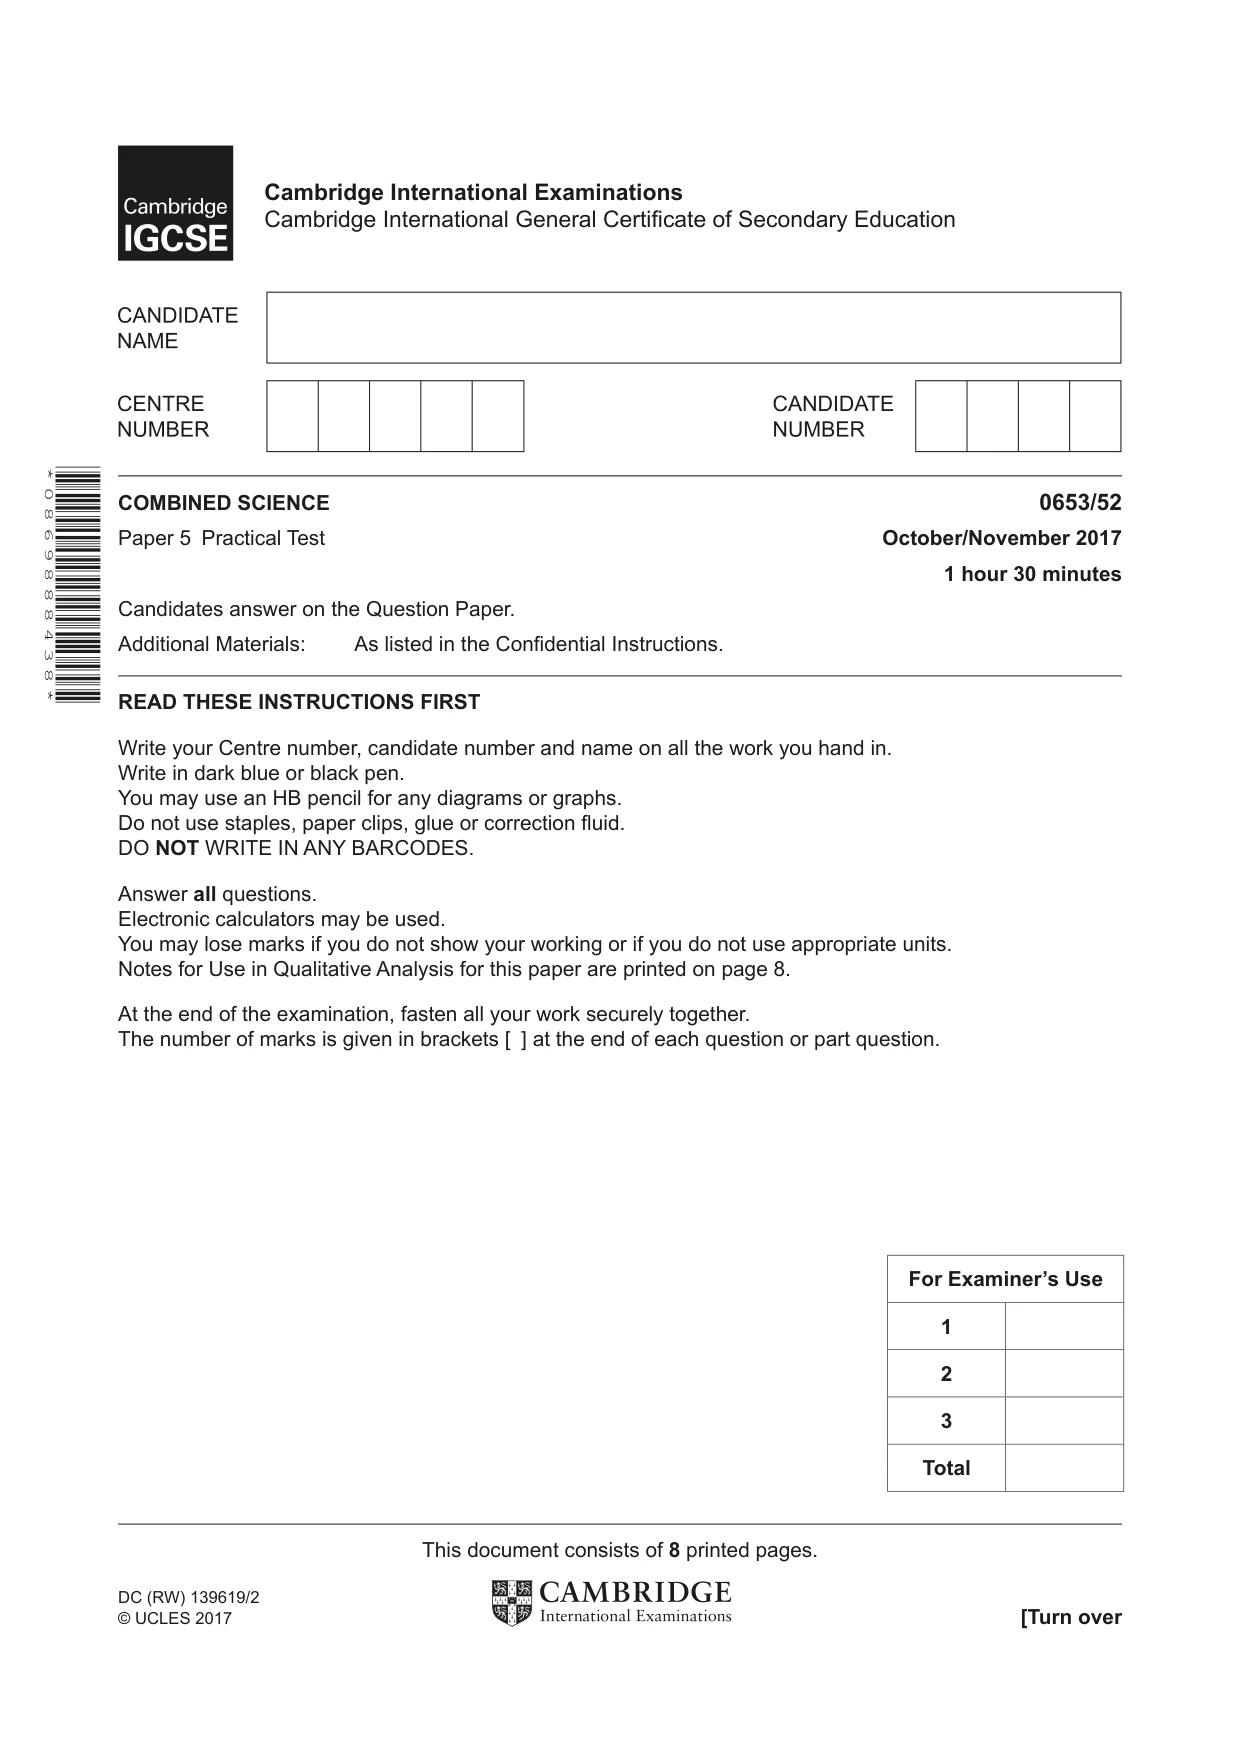
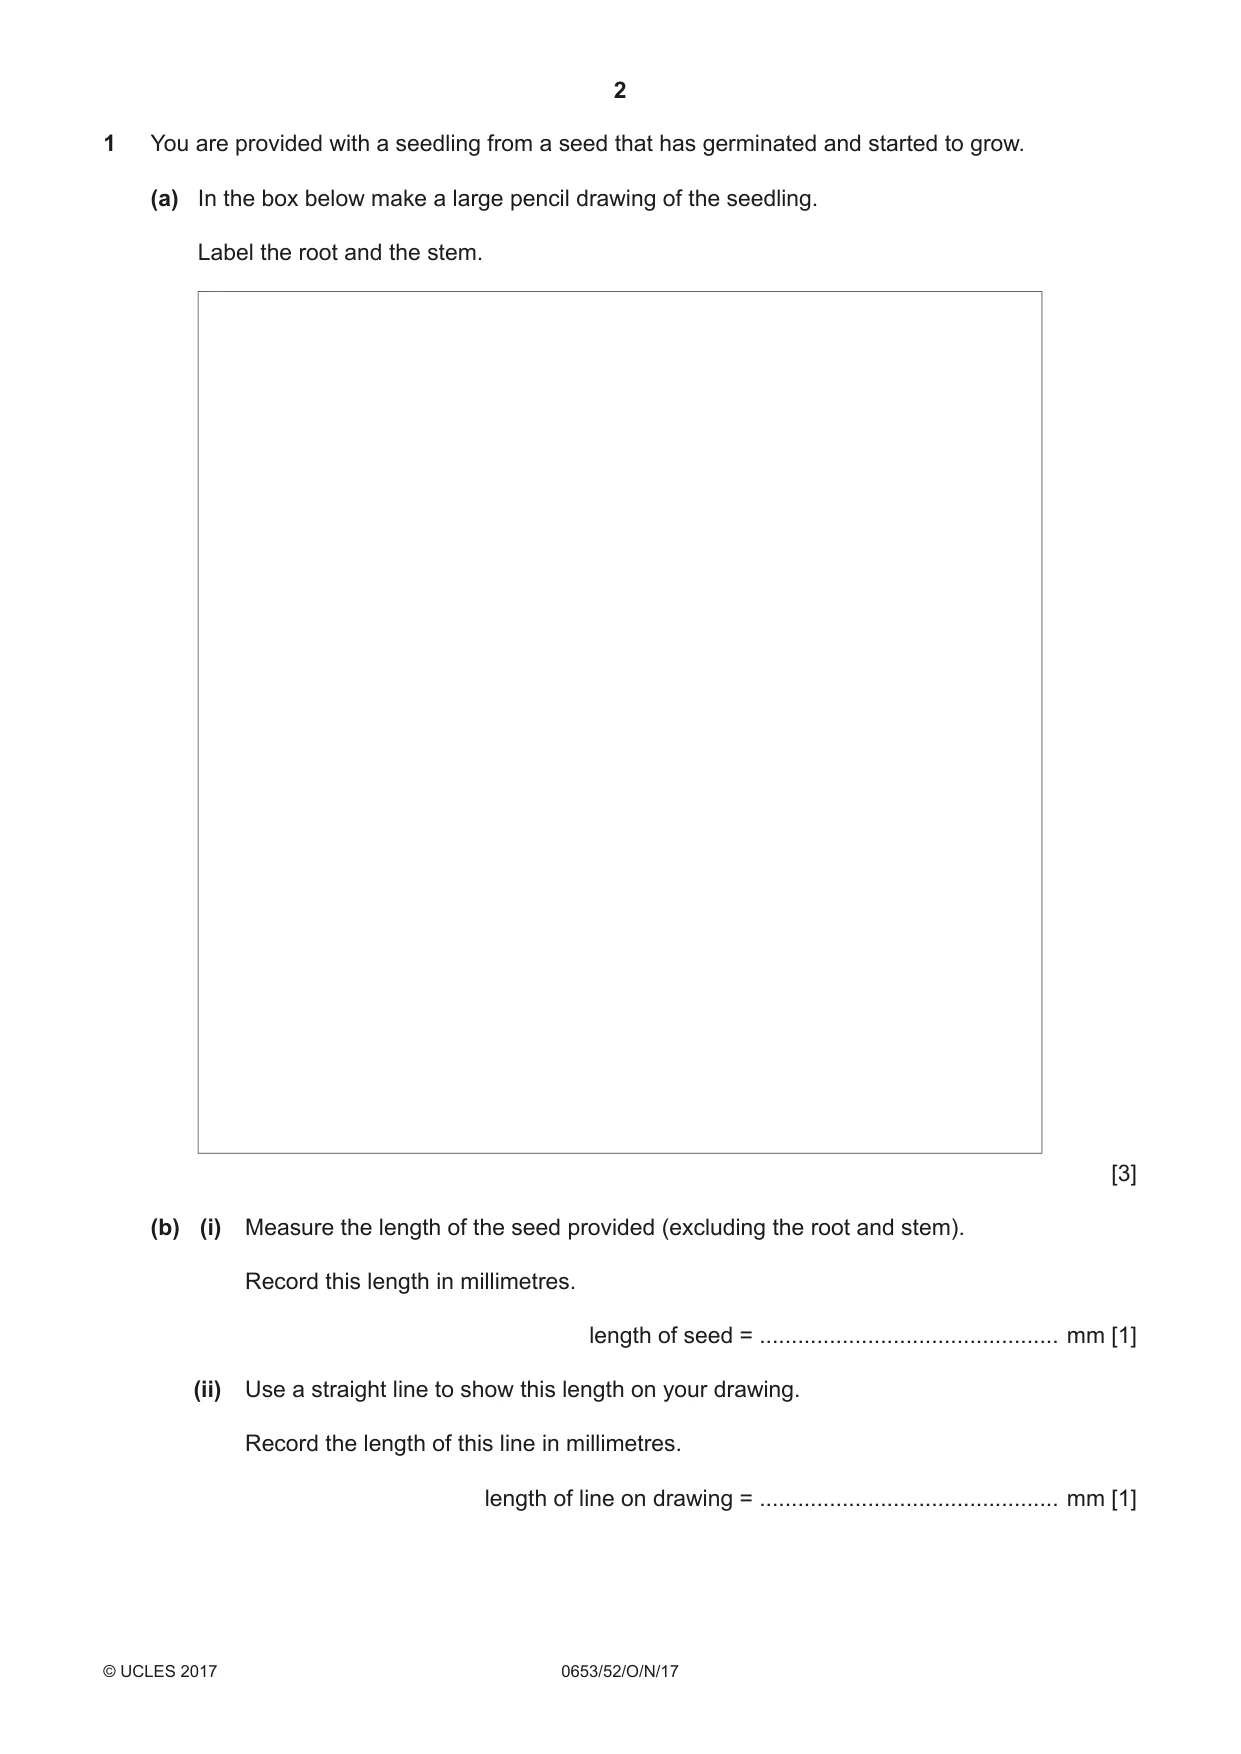
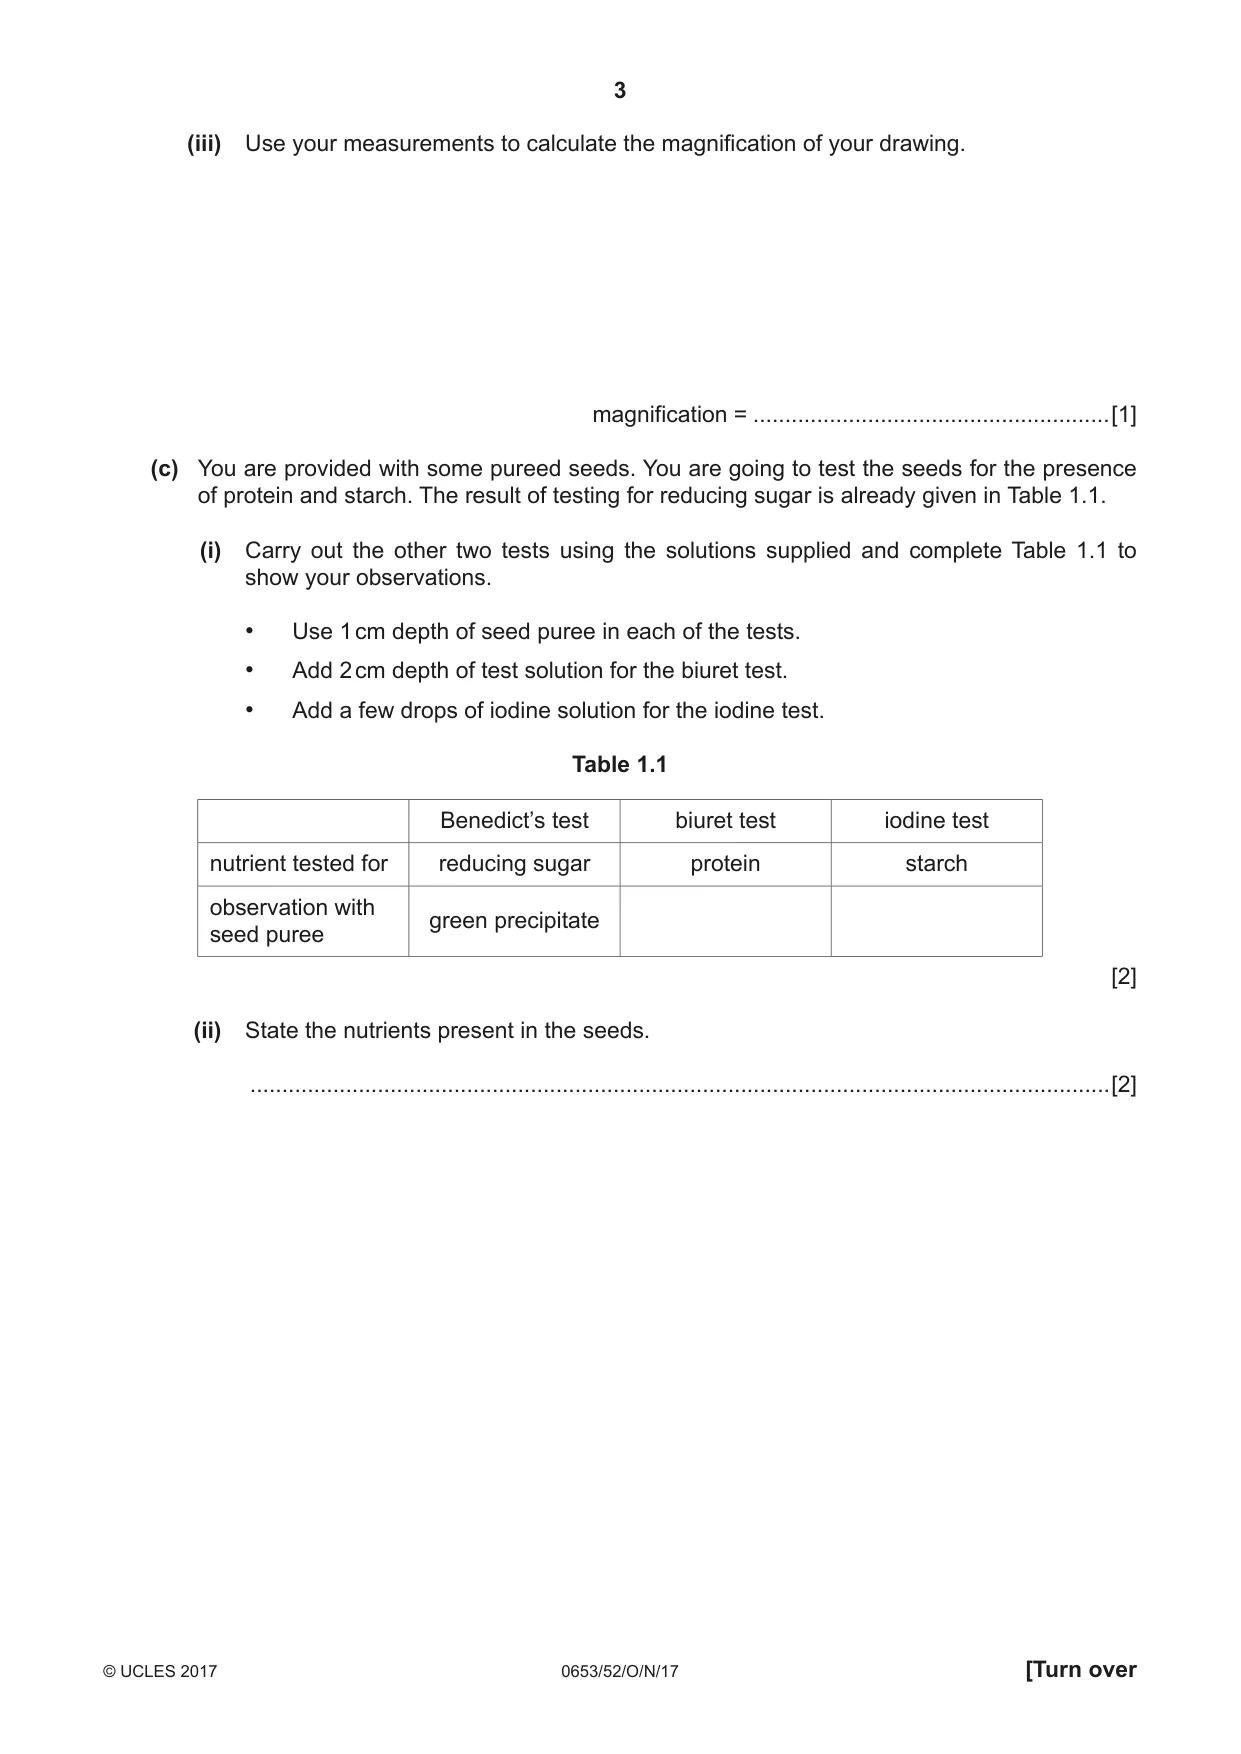
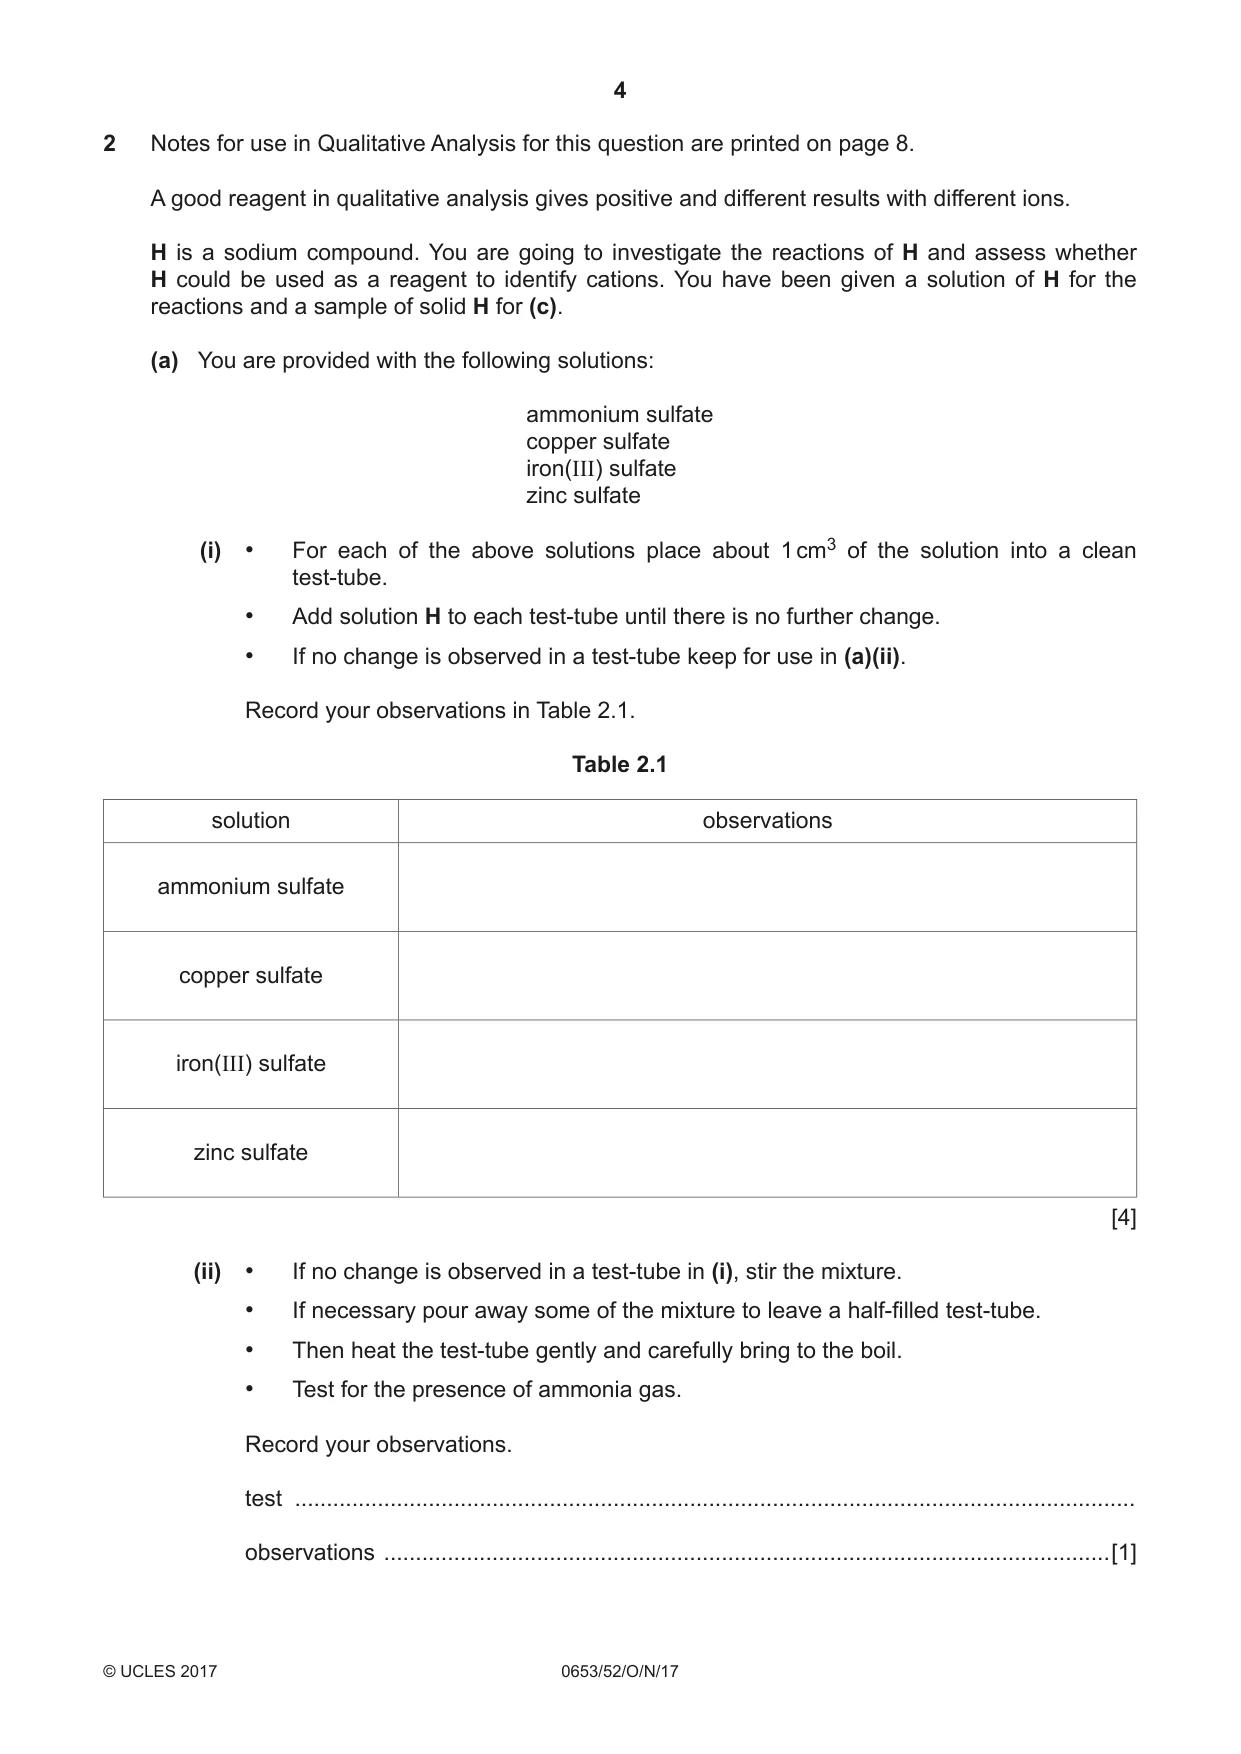
Mark scheme3 pages
Answers below. Sit the paper first if you are practising.
Questions as text
Q1 · You are provided with a seedling from a seed that has germinated and started to grow
1 You are provided with a seedling from a seed that has germinated and started to grow. (a) In the box below make a large pencil drawing of the seedling. Label the root and the stem. [3] (b) (i) Measure the length of the seed provided (excluding the root and stem). Record this length in millimetres. length of seed = ............................................... mm [1] (ii) Use a straight line to show this length on your drawing. Record the length of this line in millimetres. length of line on drawing = ............................................... mm [1] (iii) Use your measurements to calculate the magnification of your drawing. magnification = ........................................................[1] (c) You are provided with some pureed seeds. You are going to test the seeds for the presence of protein and starch. The result of testing for reducing sugar is already given in Table 1.1. (i) Carry out the other two tests using the solutions supplied and complete Table 1.1 to show your observations. • Use 1 cm depth of seed puree in each of the tests. • Add 2 cm depth of test solution for the biuret test. • Add a few drops of iodine solution for the iodine test. Table 1.1 Benedict’s test biuret test iodine test nutrient tested for reducing sugar protein starch observation with green precipitate seed puree [2] (ii) State the nutrients present in the seeds. .......................................................................................................................................[2]
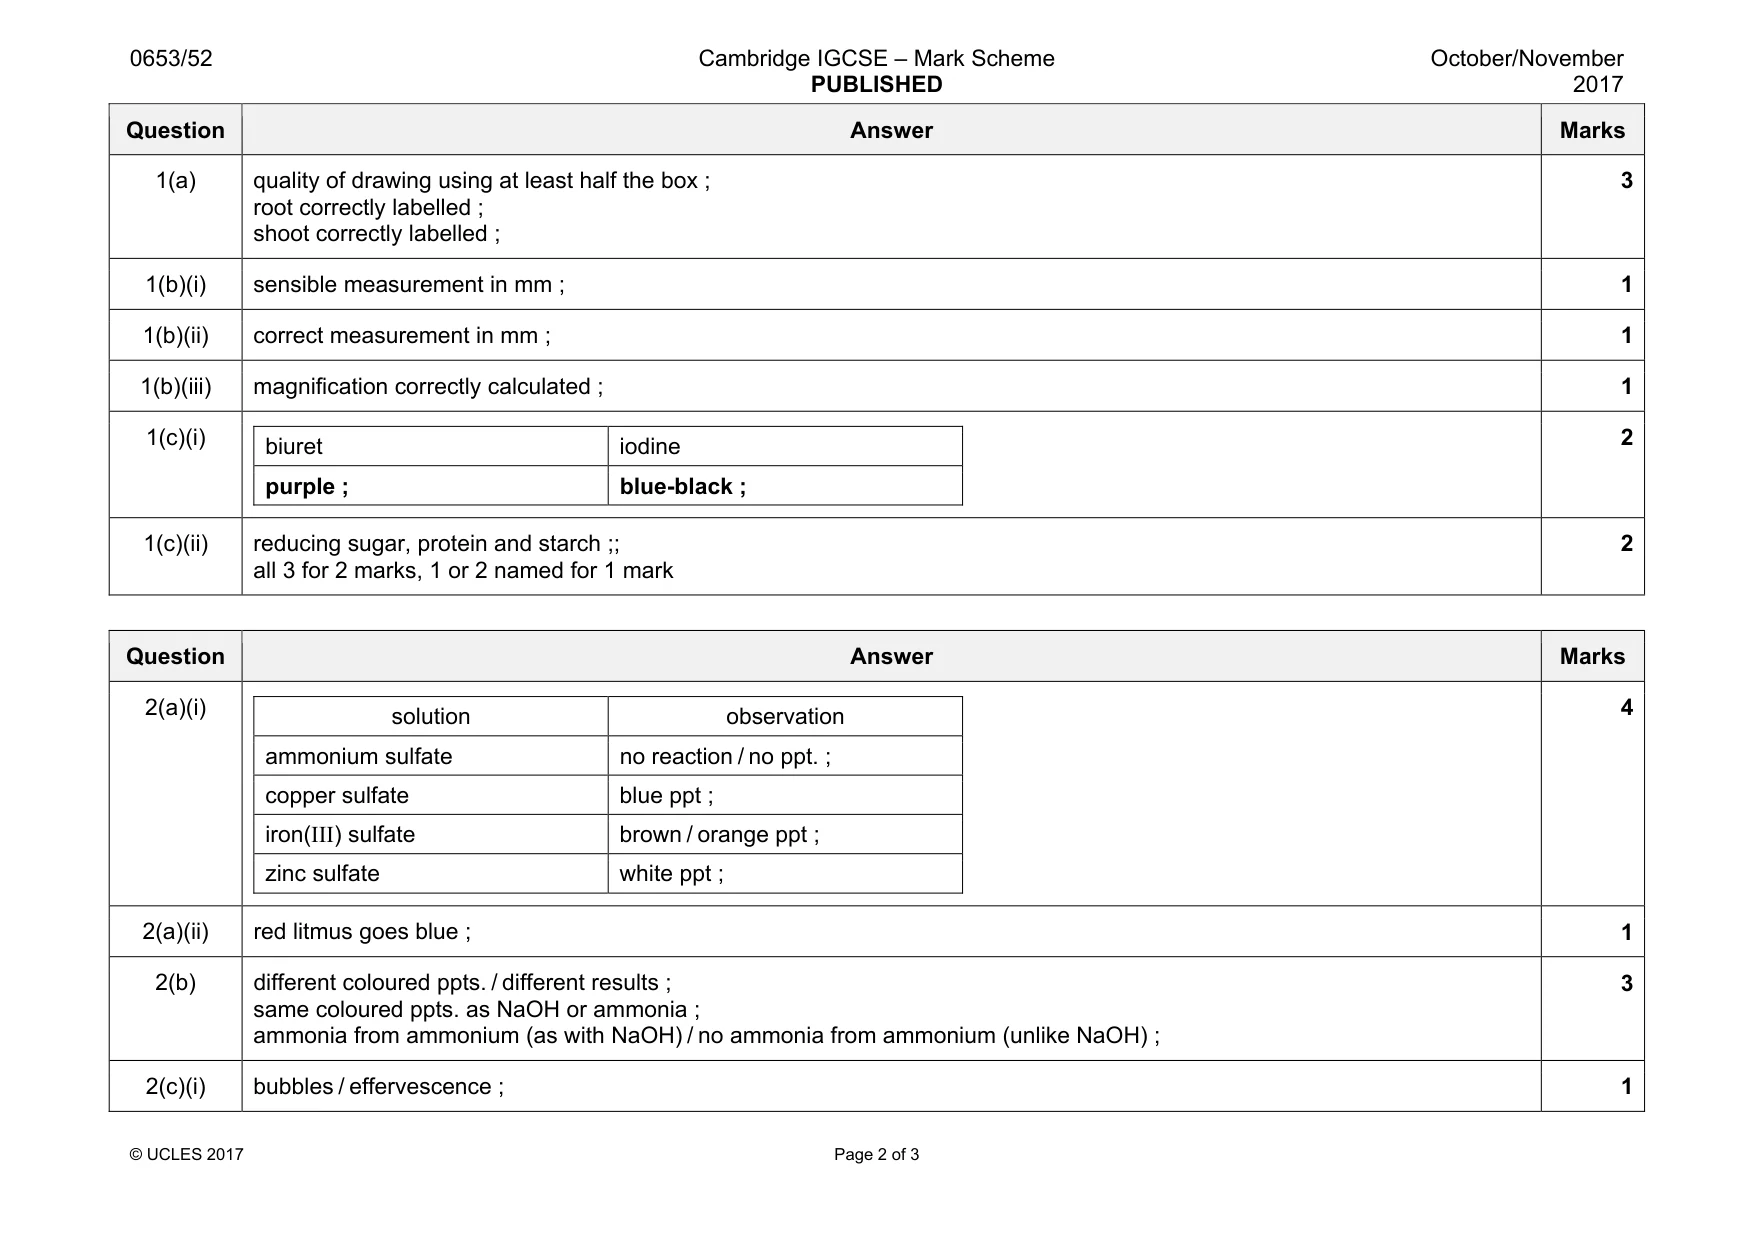
Mark scheme: 1(a) quality of drawing using at least half the box ; root correctly labelled ; shoot correctly labelled ; 3 1(b)(i) sensible measurement in mm ; 1 1(b)(ii) correct measurement in mm ; 1 1(b)(iii) magnification correctly calculated ; 1 1(c)(i) biuret iodine purple ; blue-black ; 2 1(c)(ii) reducing sugar, protein and starch ;; all 3 for 2 marks, 1 or 2 named for 1 mark 2
Q2 · Notes for use in Qualitative Analysis for this question are printed on page 8
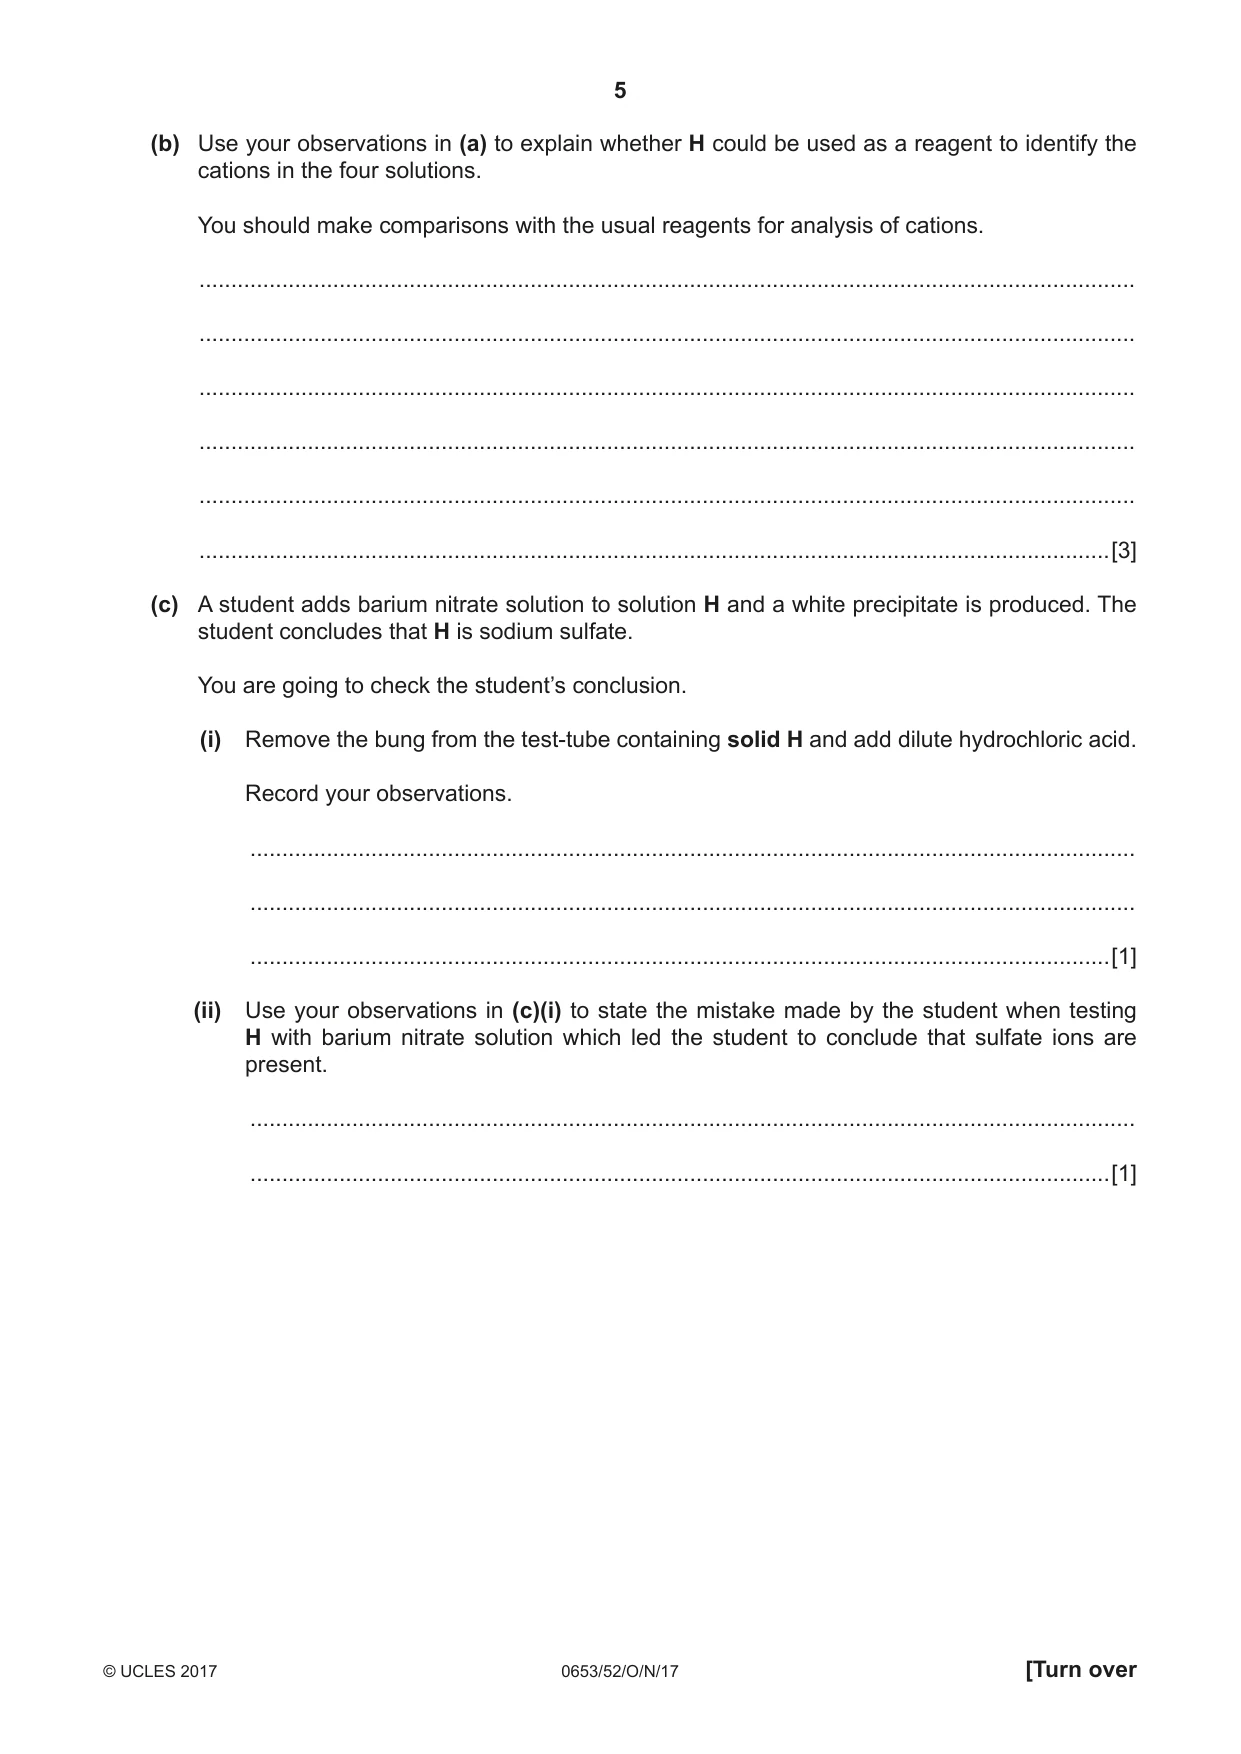
2 Notes for use in Qualitative Analysis for this question are printed on page 8. A good reagent in qualitative analysis gives positive and different results with different ions. H is a sodium compound. You are going to investigate the reactions of H and assess whether H could be used as a reagent to identify cations. You have been given a solution of H for the reactions and a sample of solid H for (c). (a) You are provided with the following solutions: ammonium sulfate copper sulfate iron(III) sulfate zinc sulfate (i) • For each of the above solutions place about 1 cm3 of the solution into a clean test‑tube. • Add solution H to each test‑tube until there is no further change. • If no change is observed in a test‑tube keep for use in (a)(ii). Record your observations in Table 2.1. Table 2.1 solution observations ammonium sulfate copper sulfate iron(III) sulfate zinc sulfate [4] (ii) • If no change is observed in a test‑tube in (i), stir the mixture. • If necessary pour away some of the mixture to leave a half‑filled test‑tube. • Then heat the test‑tube gently and carefully bring to the boil. • Test for the presence of ammonia gas. Record your observations. test .................................................................................................................................... observations ..................................................................................................................[1] (b) Use your observations in (a) to explain whether H could be used as a reagent to identify the cations in the four solutions. You should make comparisons with the usual reagents for analysis of cations. ................................................................................................................................................... ................................................................................................................................................... ................................................................................................................................................... ................................................................................................................................................... ................................................................................................................................................... ...............................................................................................................................................[3] (c) A student adds barium nitrate solution to solution H and a white precipitate is produced. The student concludes that H is sodium sulfate. You are going to check the student’s conclusion. (i) Remove the bung from the test‑tube containing solid H and add dilute hydrochloric acid. Record your observations. ........................................................................................................................................... ........................................................................................................................................... .......................................................................................................................................[1] (ii) Use your observations in (c)(i) to state the mistake made by the student when testing H with barium nitrate solution which led the student to conclude that sulfate ions are present. ........................................................................................................................................... .......................................................................................................................................[1]
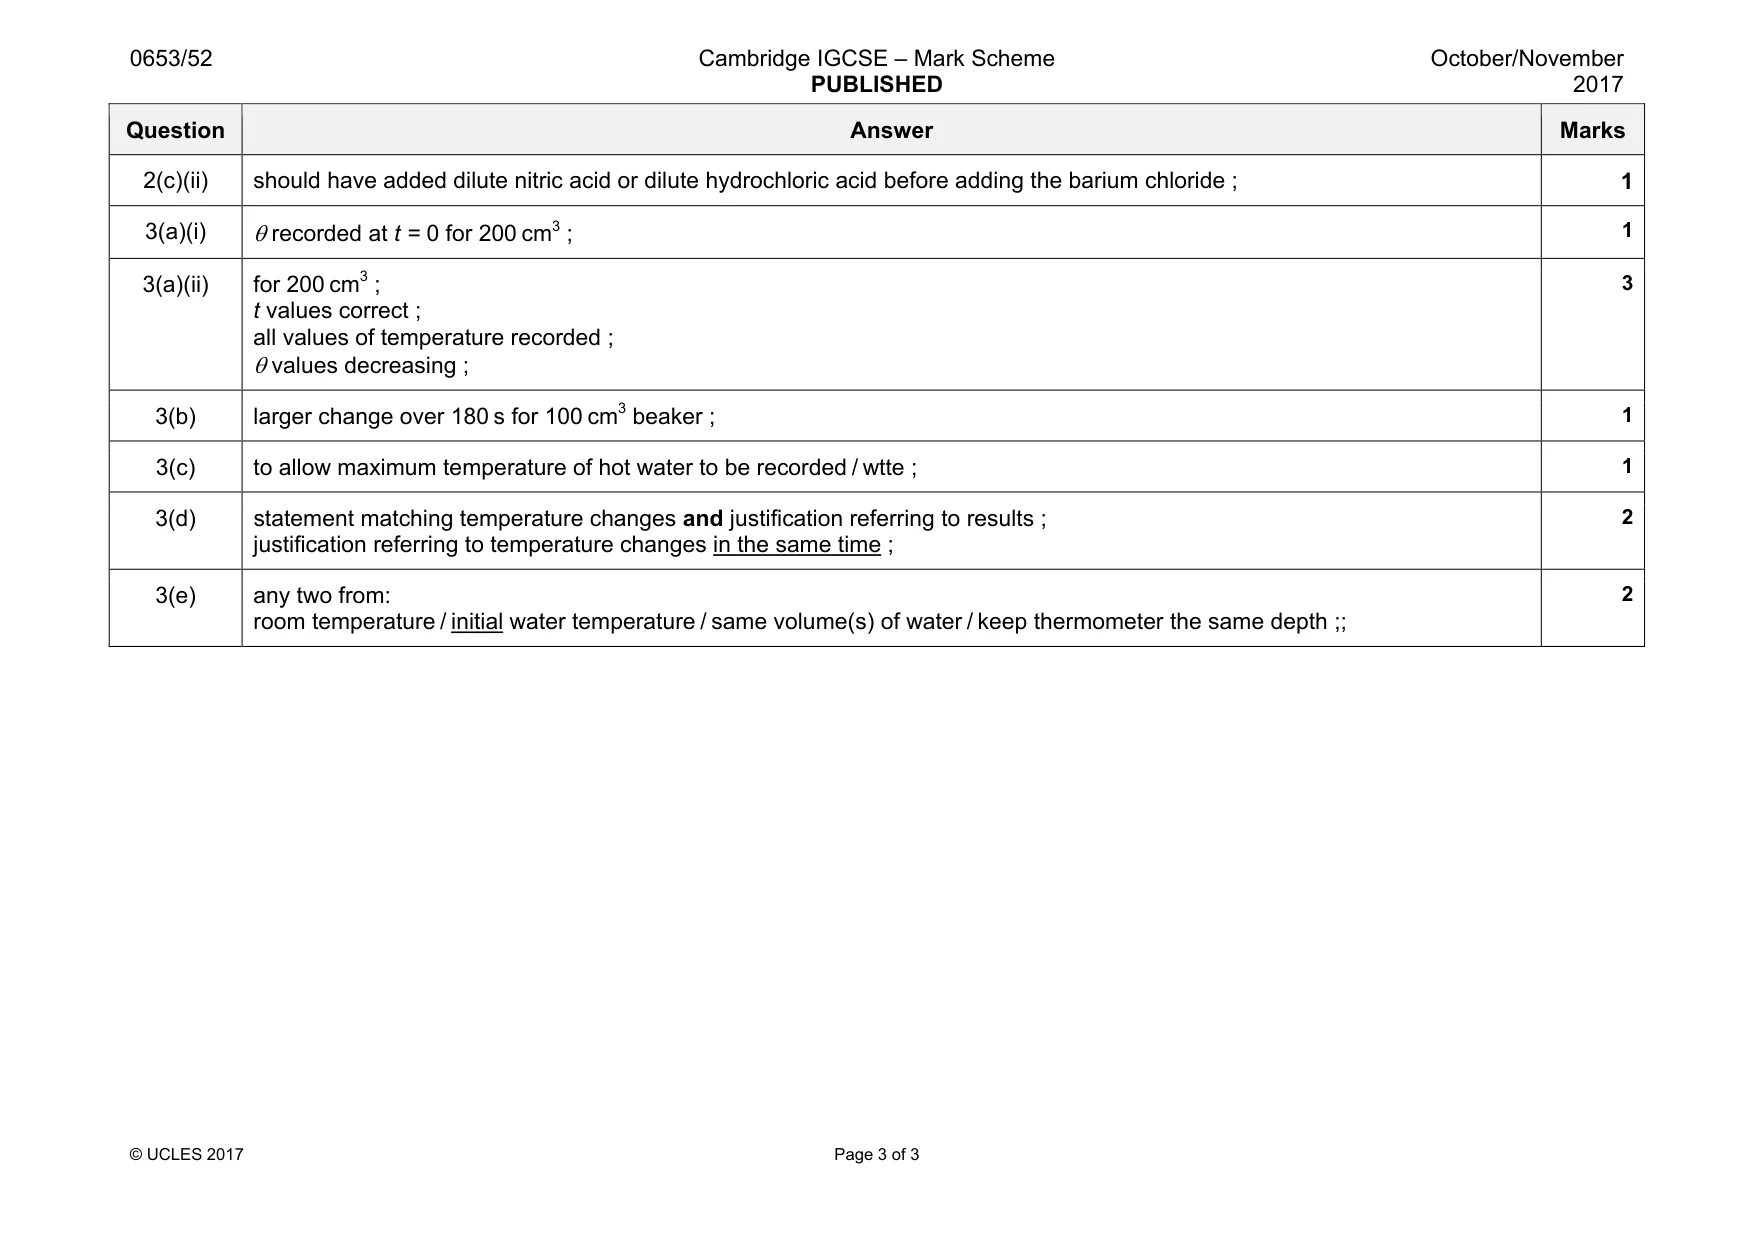
Mark scheme: 2(a)(i) solution observation ammonium sulfate no reaction / no ppt. ; copper sulfate blue ppt ; iron(III) sulfate brown / orange ppt ; zinc sulfate white ppt ; 4 2(a)(ii) red litmus goes blue ; 1 2(b) different coloured ppts. / different results ; same coloured ppts. as NaOH or ammonia ; ammonia from ammonium (as with NaOH) / no ammonia from ammonium (unlike NaOH) ; 3 2(c)(i) bubbles / effervescence ; 1 Question Answer Marks 2(c)(ii) should have added dilute nitric acid or dilute hydrochloric acid before adding the barium chloride ; 1 θ recorded at t = 0 for 200 cm3 ; 1
Q3 · You are going to investigate the cooling rates of different volumes of water
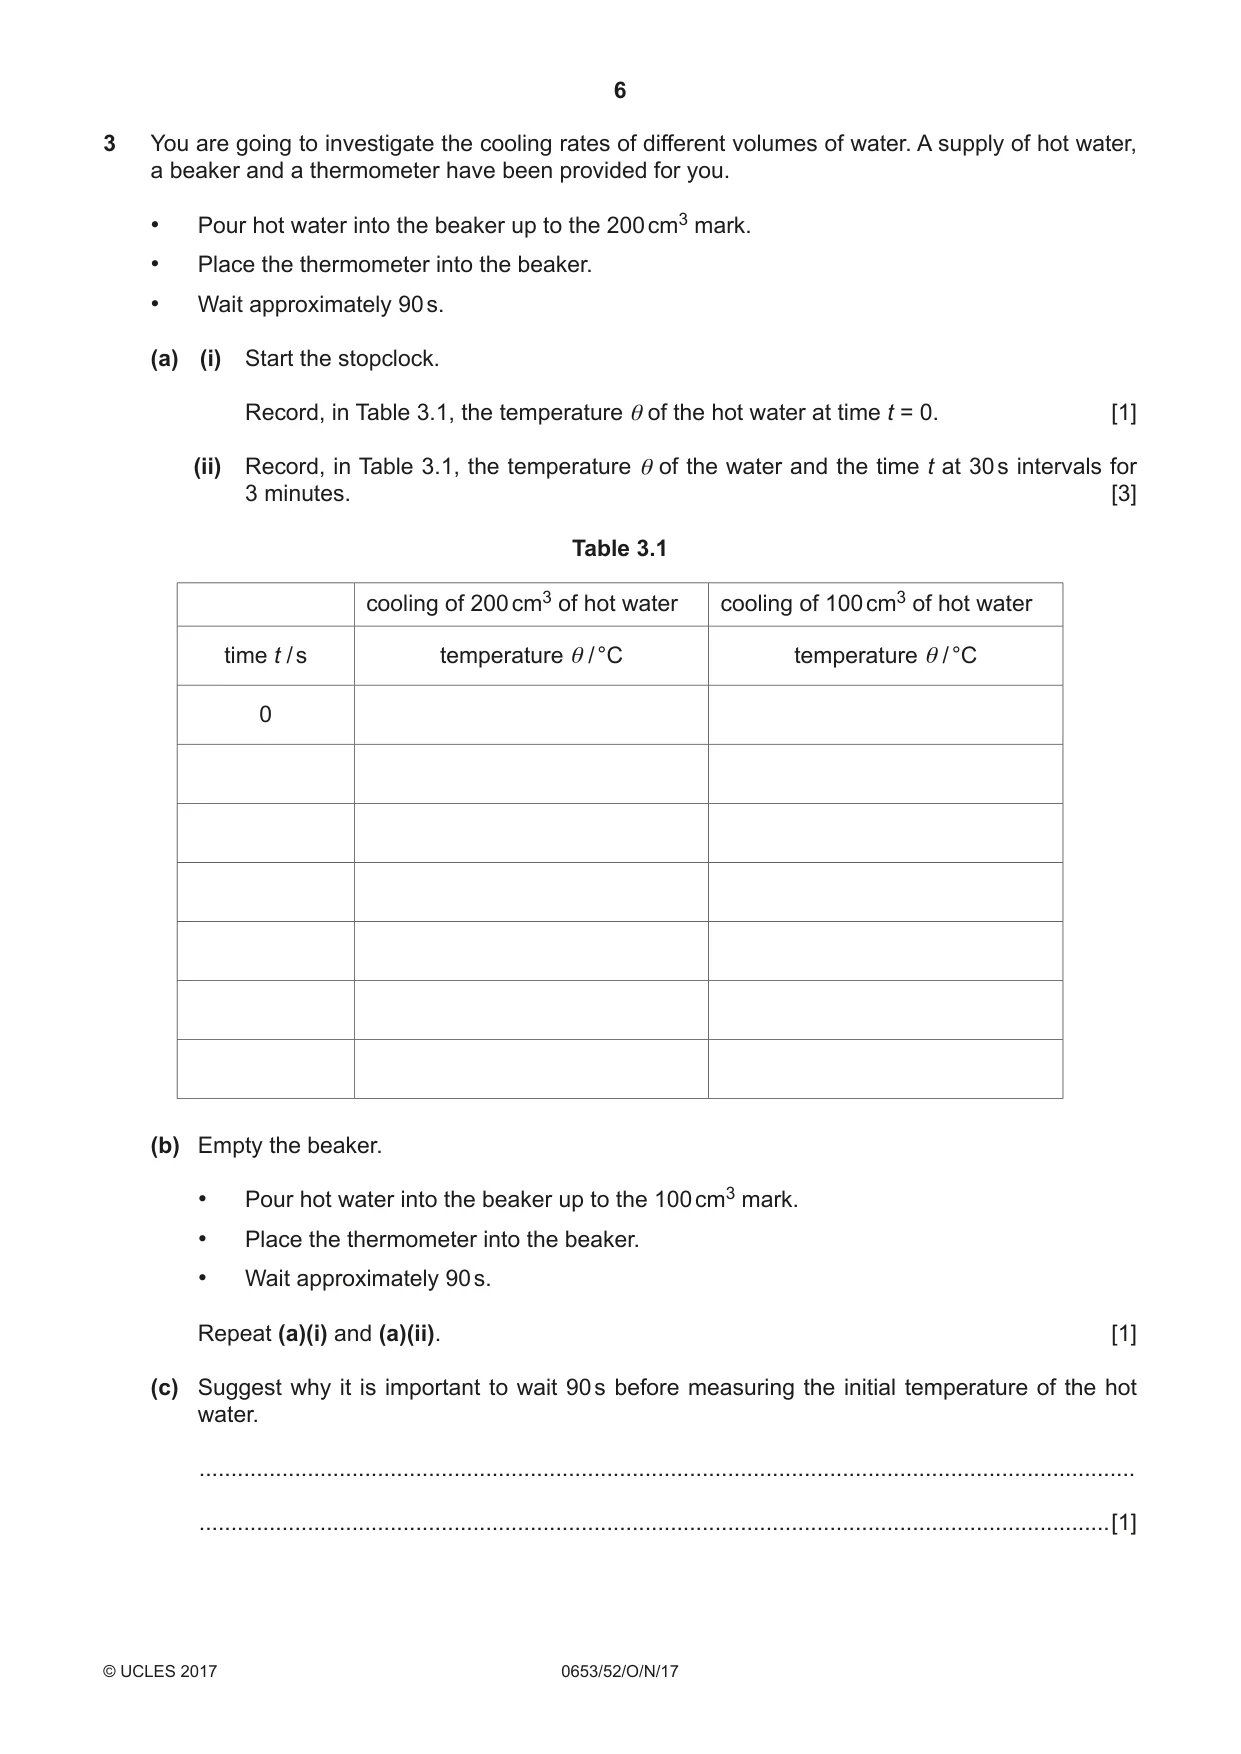
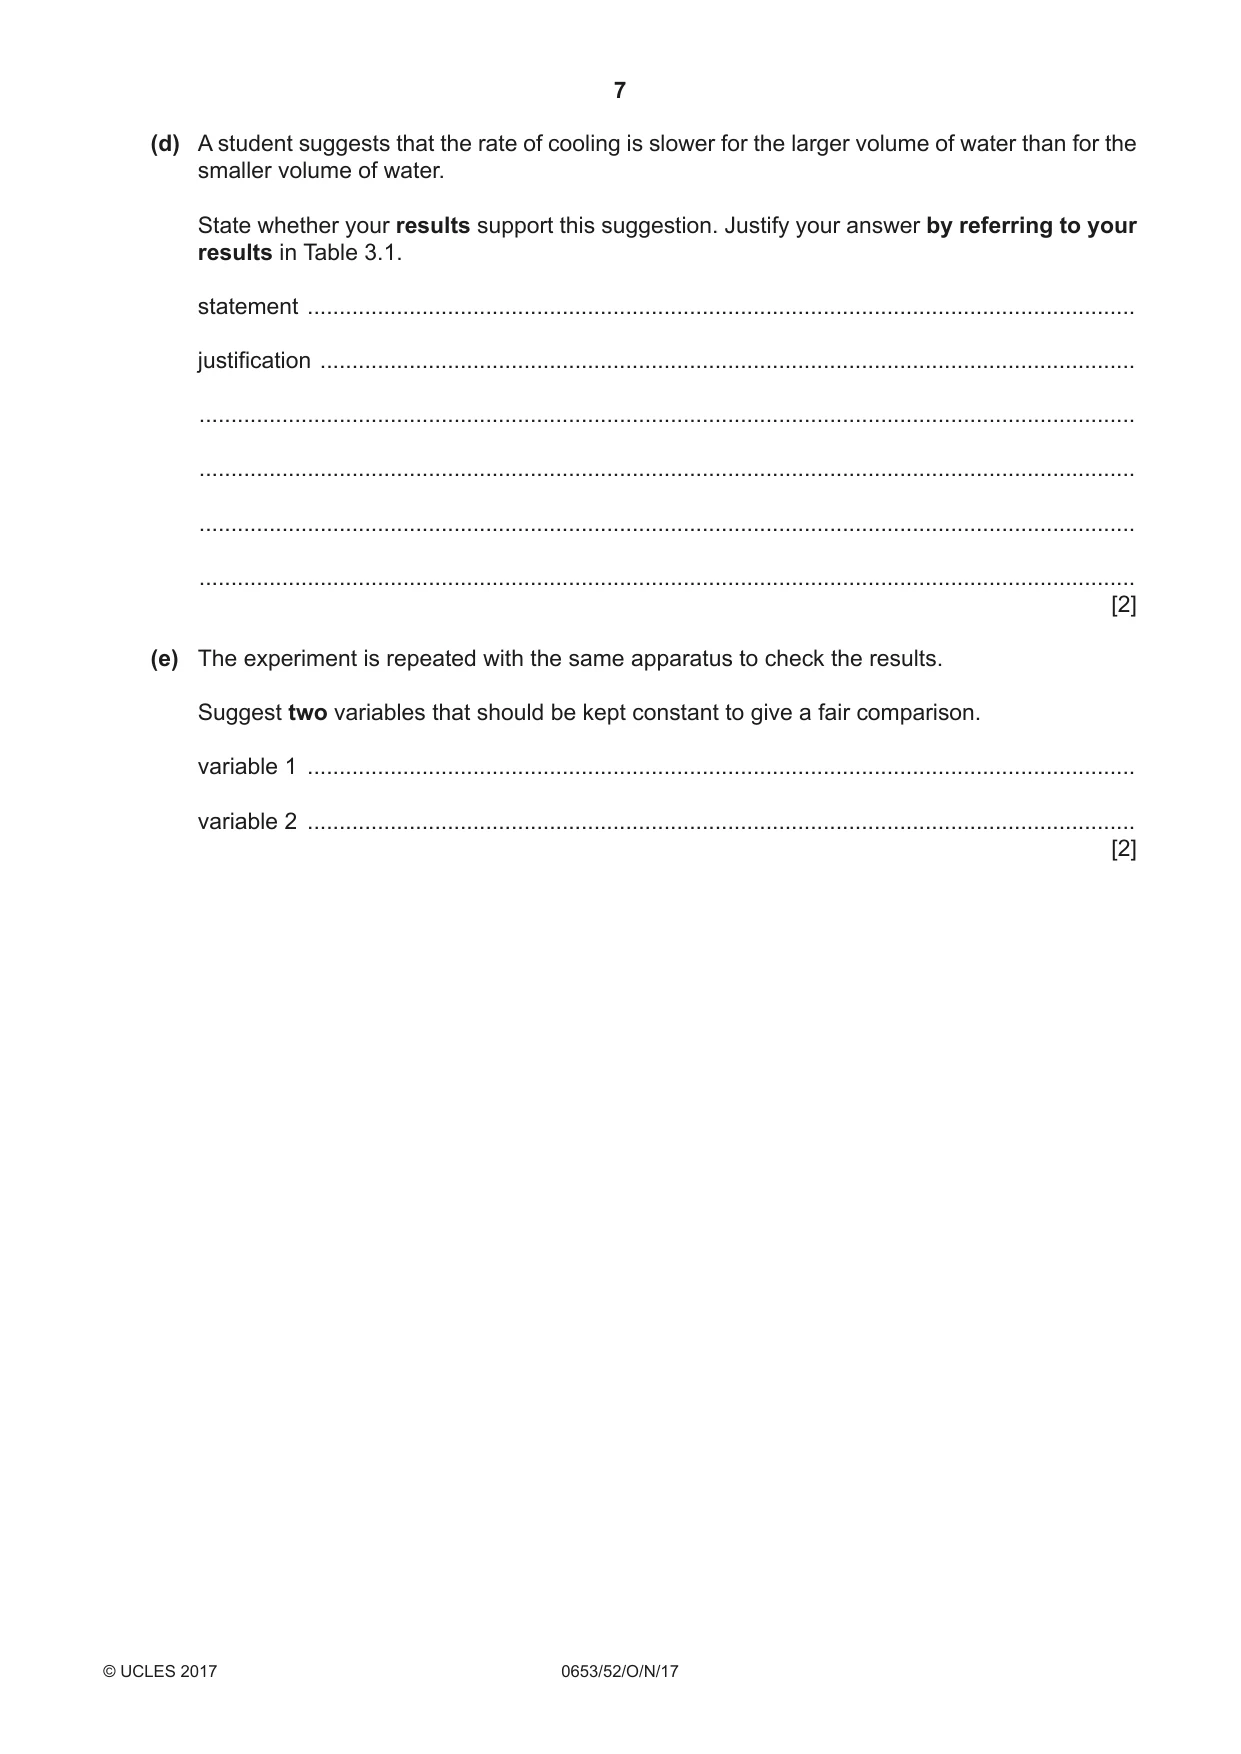
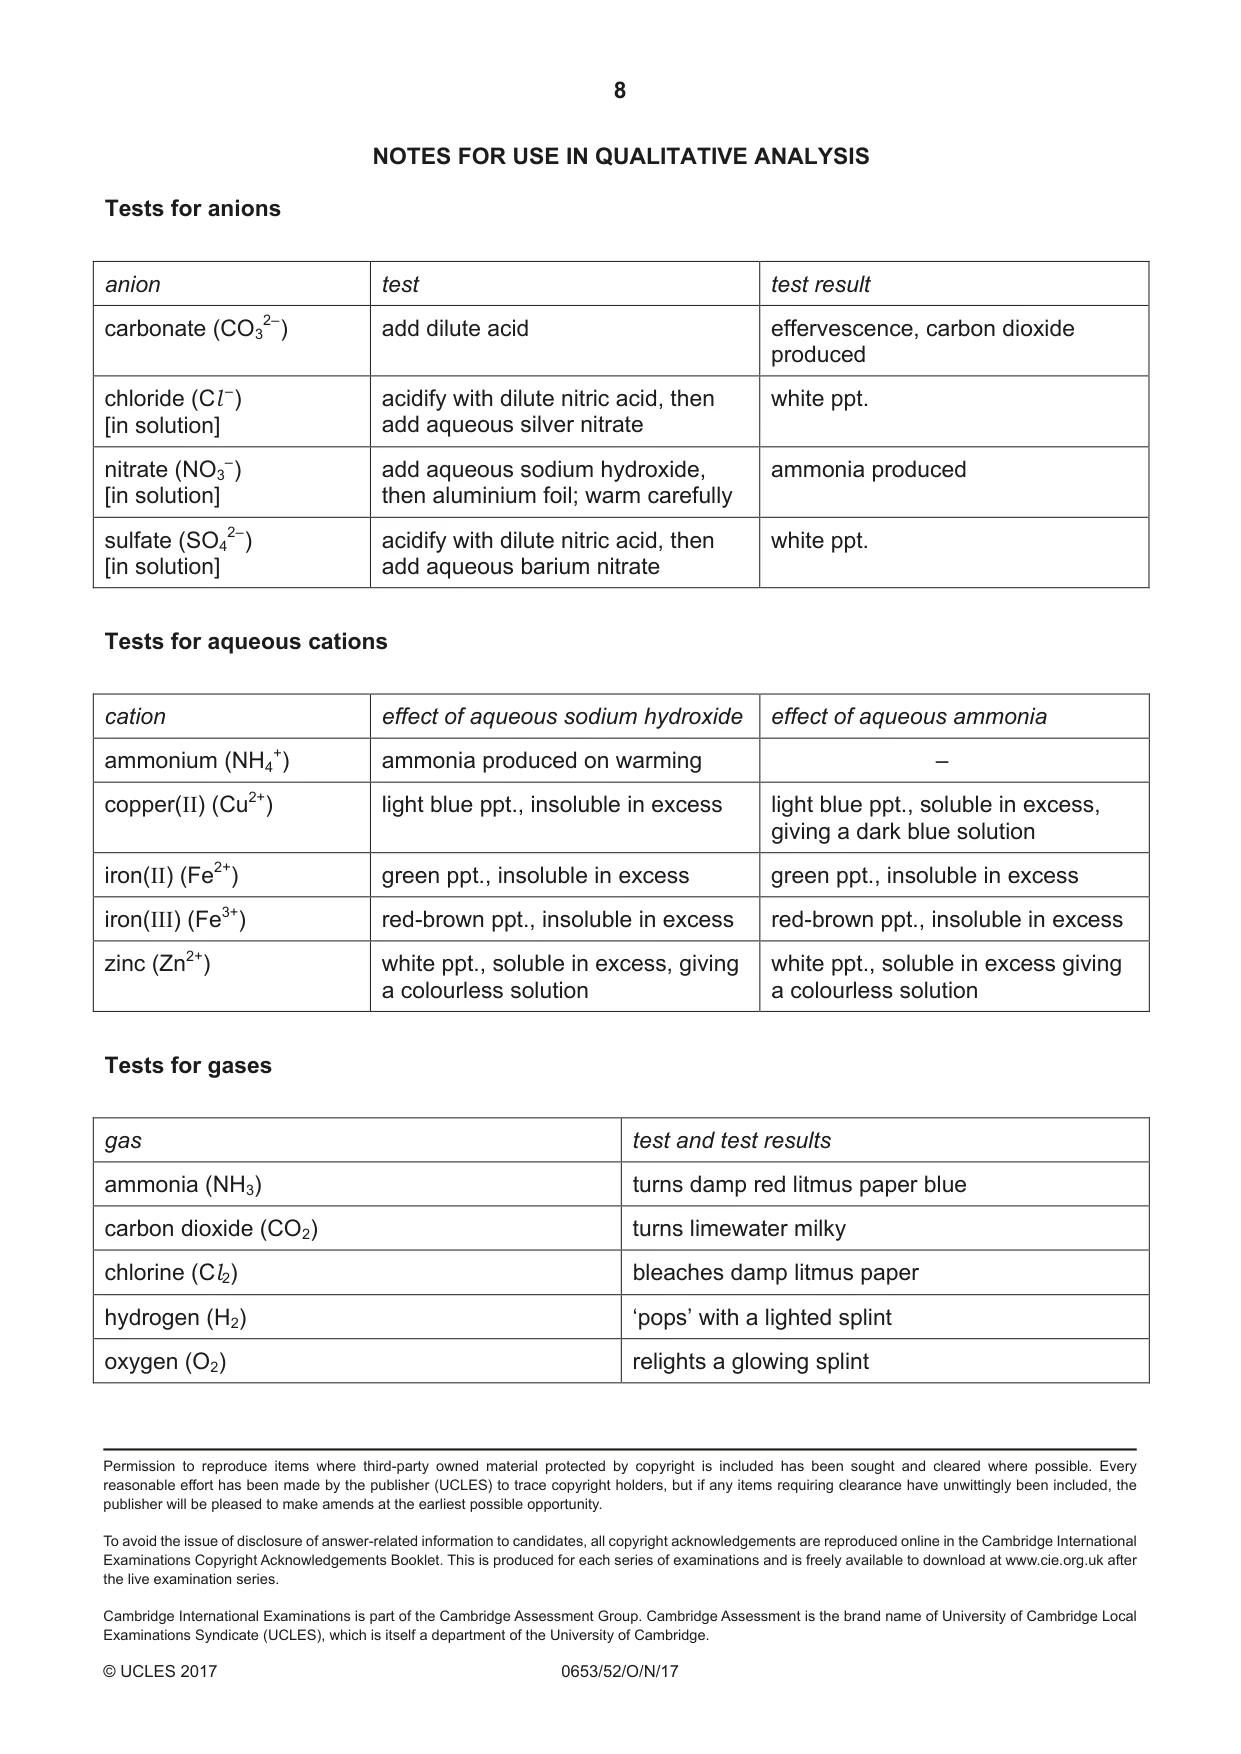
3 You are going to investigate the cooling rates of different volumes of water. A supply of hot water, a beaker and a thermometer have been provided for you. • Pour hot water into the beaker up to the 200 cm3 mark. • Place the thermometer into the beaker. • Wait approximately 90 s. (a) (i) Start the stopclock. Record, in Table 3.1, the temperature θ of the hot water at time t = 0. [1] (ii) Record, in Table 3.1, the temperature θ of the water and the time t at 30 s intervals for 3 minutes. [3] Table 3.1 cooling of 200 cm3 of hot water cooling of 100 cm3 of hot water time t / s temperature θ / °C temperature θ / °C 0 (b) Empty the beaker. • Pour hot water into the beaker up to the 100 cm3 mark. • Place the thermometer into the beaker. • Wait approximately 90 s. Repeat (a)(i) and (a)(ii). [1] (c) Suggest why it is important to wait 90 s before measuring the initial temperature of the hot water. ................................................................................................................................................... ...............................................................................................................................................[1] (d) A student suggests that the rate of cooling is slower for the larger volume of water than for the smaller volume of water. State whether your results support this suggestion. Justify your answer by referring to your results in Table 3.1. statement .................................................................................................................................. justification ................................................................................................................................ ................................................................................................................................................... ................................................................................................................................................... ................................................................................................................................................... ................................................................................................................................................... [2] (e) The experiment is repeated with the same apparatus to check the results. Suggest two variables that should be kept constant to give a fair comparison. variable 1 .................................................................................................................................. variable 2 .................................................................................................................................. [2] NOTES FOR USE IN QUALITATIVE ANALYSIS Tests for anions anion test test result carbonate (CO3 2–) add dilute acid effervescence, carbon dioxide produced chloride (Cl –) acidify with dilute nitric acid, then white ppt. [in solution] add aqueous silver nitrate nitrate (NO3 –) add aqueous sodium hydroxide, ammonia produced [in solution] then aluminium foil; warm carefully sulfate (SO4 2–) acidify with dilute nitric acid, then white ppt. [in solution] add aqueous barium nitrate Tests for aqueous cations cation effect of aqueous sodium hydroxide effect of aqueous ammonia ammonium (NH4 +) ammonia produced on warming – copper(II) (Cu2+) light blue ppt., insoluble in excess light blue ppt., soluble in excess, giving a dark blue solution iron(II) (Fe2+) green ppt., insoluble in excess green ppt., insoluble in excess iron(III) (Fe3+) red-brown ppt., insoluble in excess red-brown ppt., insoluble in excess zinc (Zn2+) white ppt., soluble in excess, giving white ppt., soluble in excess giving a colourless solution a colourless solution Tests for gases gas test and test results ammonia (NH3) turns damp red litmus paper blue carbon dioxide (CO2) turns limewater milky chlorine (Cl2) bleaches damp litmus paper hydrogen (H2) ‘pops’ with a lighted splint oxygen (O2) relights a glowing splint
Mark scheme: 3(a)(i) 3(a)(ii) for 200 cm3 ; t values correct ; all values of temperature recorded ; θ values decreasing ; 3 3(b) larger change over 180 s for 100 cm3 beaker ; 1 3(c) to allow maximum temperature of hot water to be recorded / wtte ; 1 3(d) statement matching temperature changes and justification referring to results ; justification referring to temperature changes in the same time ; 2 3(e) any two from: room temperature / initial water temperature / same volume(s) of water / keep thermometer the same depth ;; 2
What was in this paper
The subtopics covered by these 3 questions, and how many questions each got. Open one in a new tab to see every Cambridge question on it.
What you needed in this session
Cambridge’s own grade thresholds for 2017 Oct/Nov, Paper 5 · Variant 2. A higher threshold means an easier paper — the bar moves with how the cohort did.