Cambridge IGCSE Science - Combined 0653 — 2014 May/June Paper 5 · Variant 1
0653/51/M/J/14 · 30 marks · ≈34 min
The question paper and its mark scheme, free to read here and free to download. This is Cambridge’s own paper, exactly as it was sat.
Question paper12 pages


Mark scheme3 pages
Answers below. Sit the paper first if you are practising.
Paper as text
Question paper, page 1
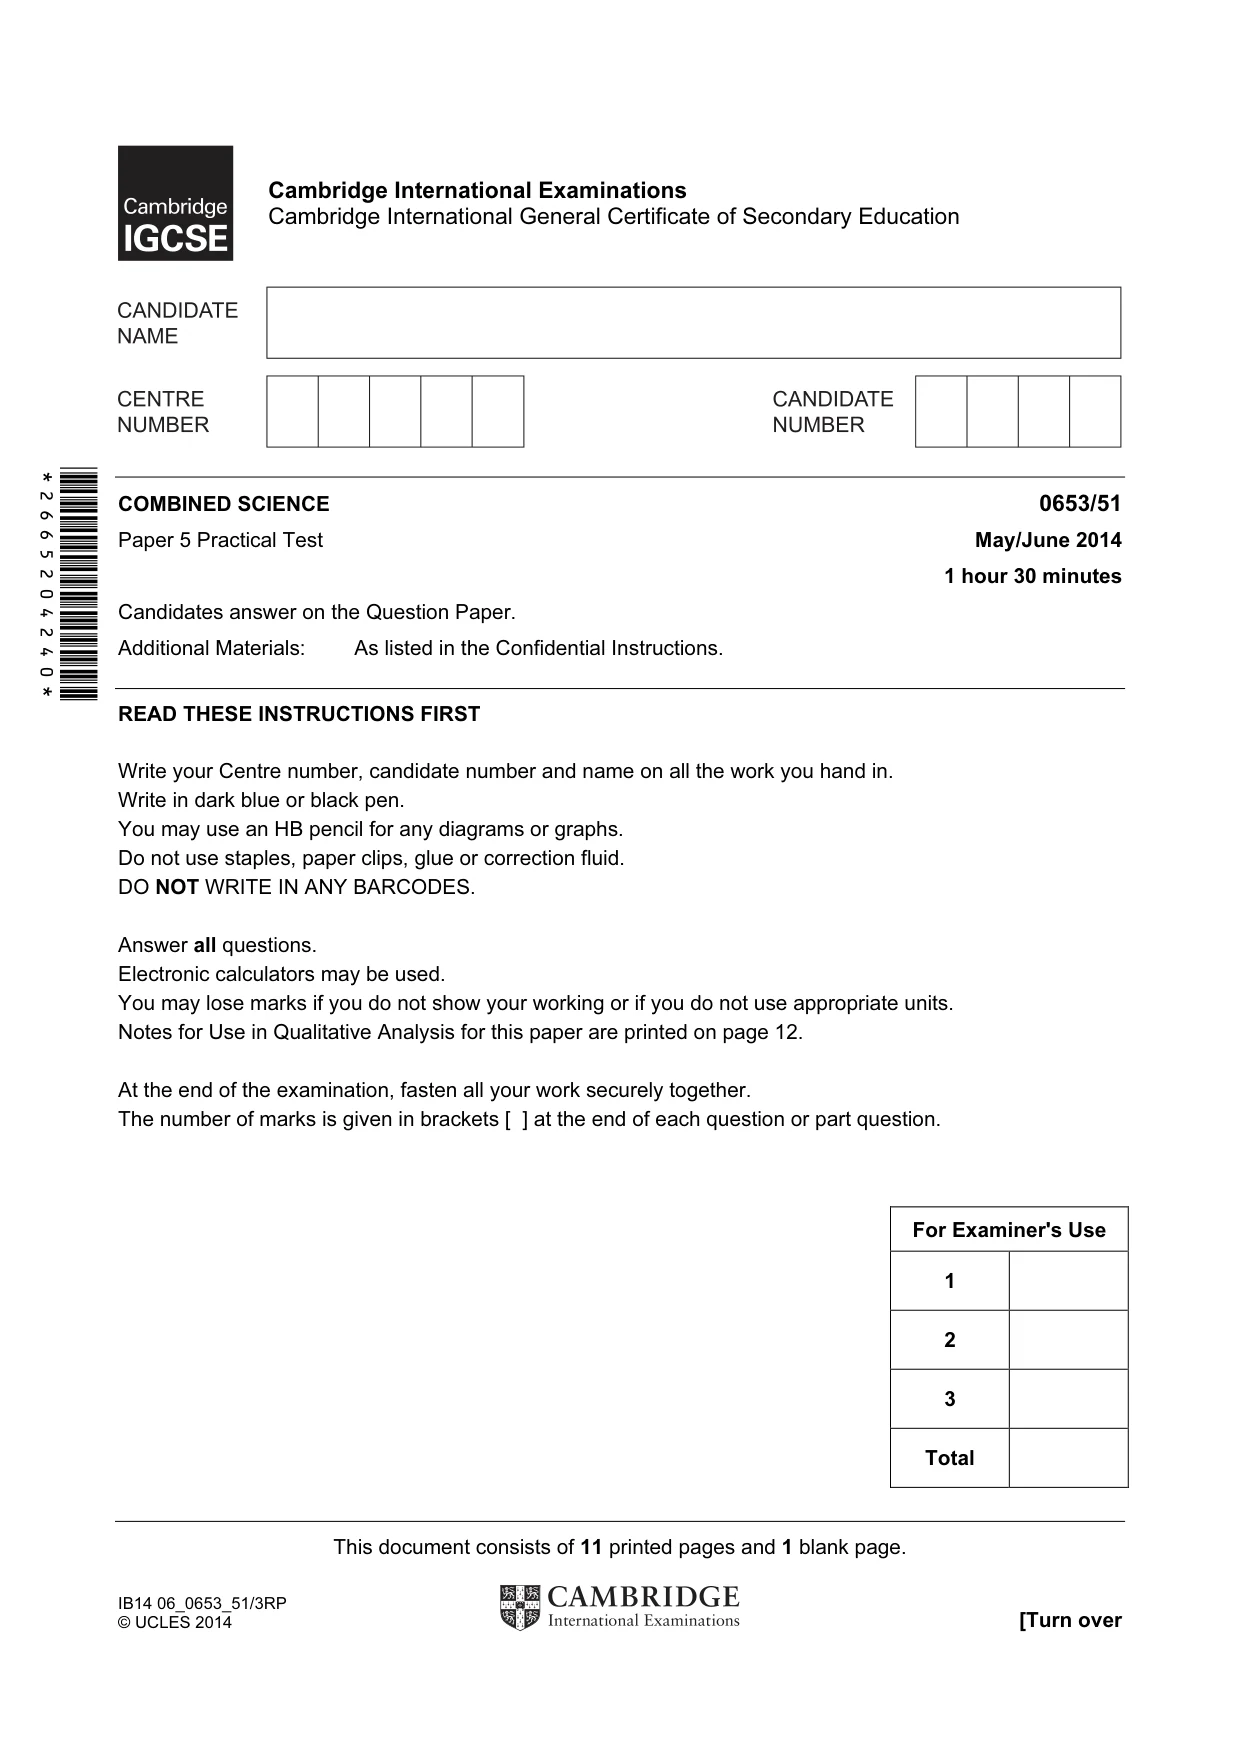
This document consists of 11 printed pages and 1 blank page. IB14 06_0653_51/3RP © UCLES 2014 [Turn over *2665204240* For Examiner's Use 1 2 3 Total Cambridge International Examinations Cambridge International General Certificate of Secondary Education COMBINED SCIENCE 0653/51 Paper 5 Practical Test May/June 2014 1 hour 30 minutes Candidates answer on the Question Paper. Additional Materials: As listed in the Confidential Instructions. READ THESE INSTRUCTIONS FIRST Write your Centre number, candidate number and name on all the work you hand in. Write in dark blue or black pen. You may use an HB pencil for any diagrams or graphs. Do not use staples, paper clips, glue or correction fluid. DO NOT WRITE IN ANY BARCODES. Answer all questions. Electronic calculators may be used. You may lose marks if you do not show your working or if you do not use appropriate units. Notes for Use in Qualitative Analysis for this paper are printed on page 12. At the end of the examination, fasten all your work securely together. The number of marks is given in brackets [ ] at the end of each question or part question.
Question paper, page 2
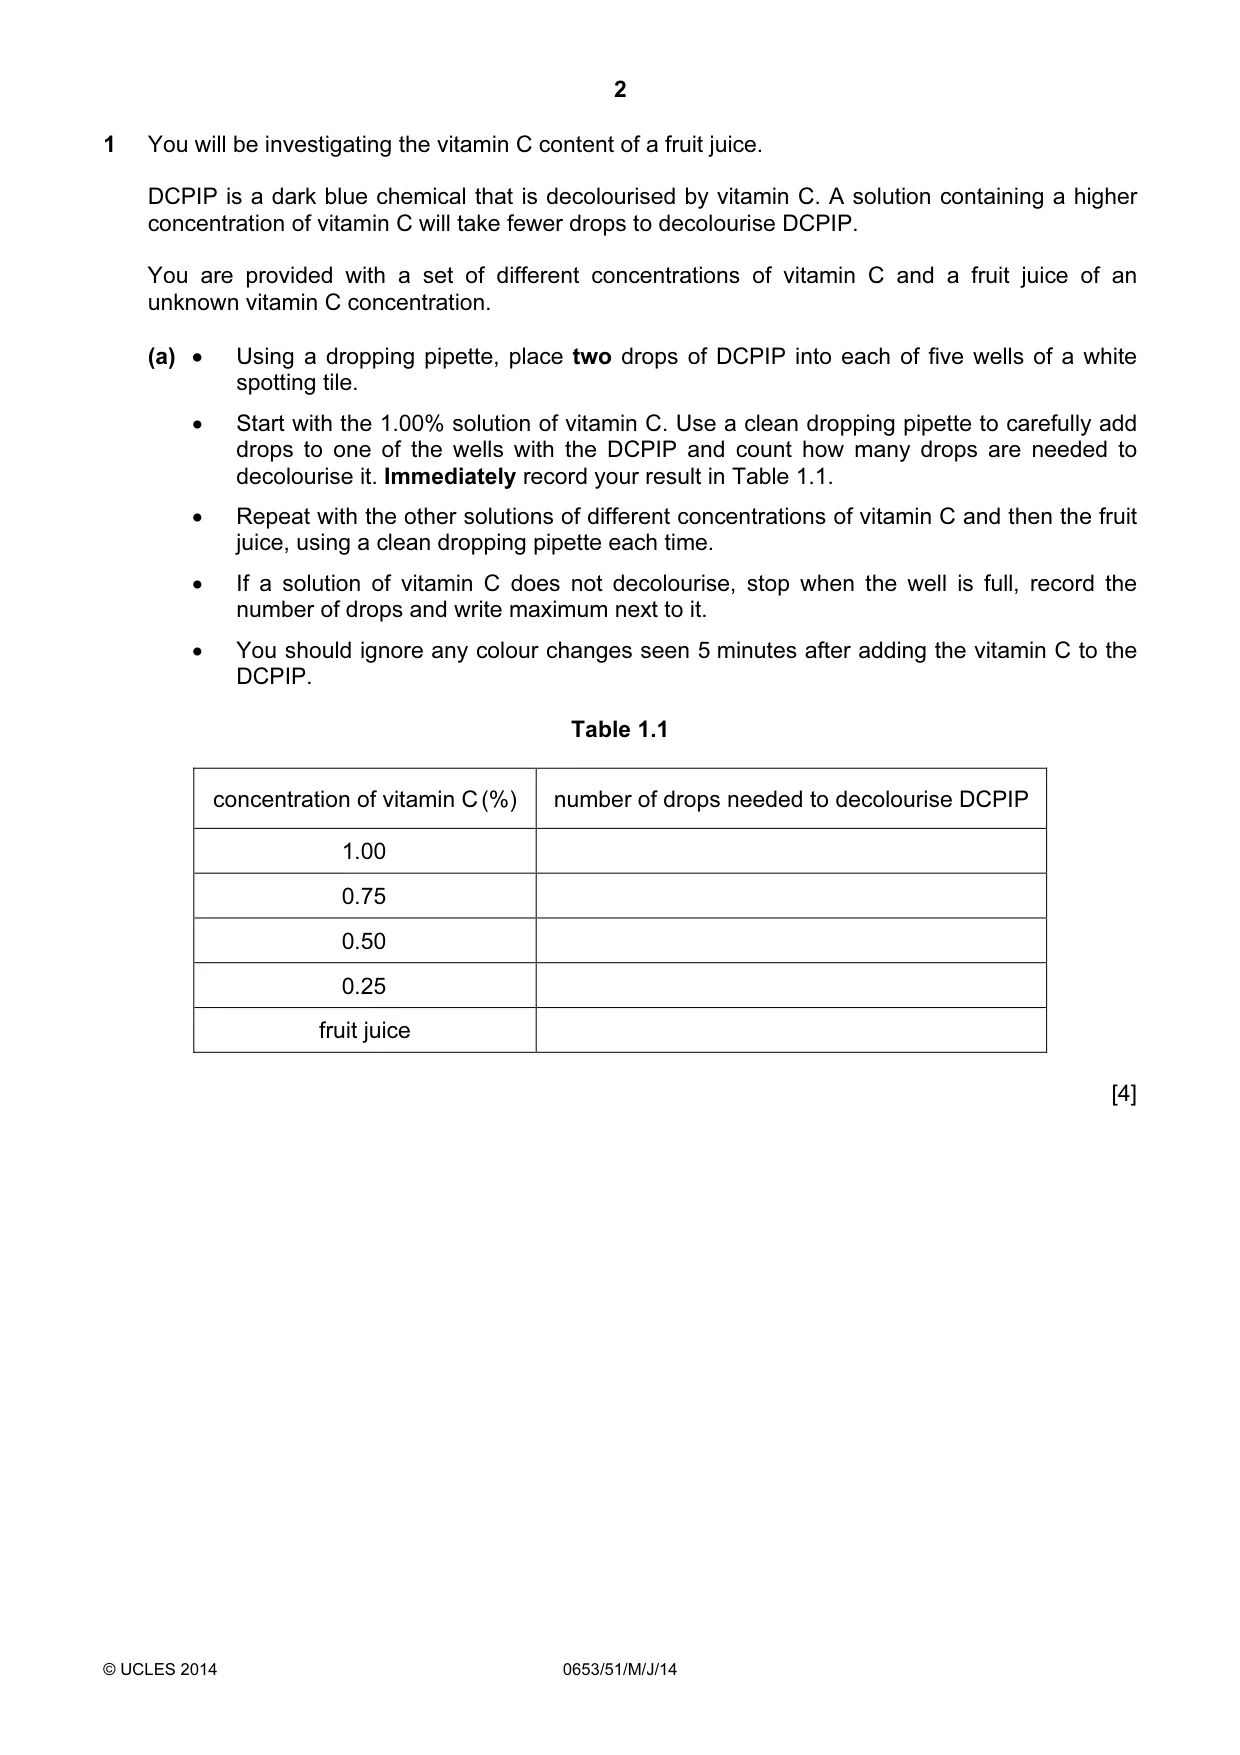
2 © UCLES 2014 0653/51/M/J/14 1 You will be investigating the vitamin C content of a fruit juice. DCPIP is a dark blue chemical that is decolourised by vitamin C. A solution containing a higher concentration of vitamin C will take fewer drops to decolourise DCPIP. You are provided with a set of different concentrations of vitamin C and a fruit juice of an unknown vitamin C concentration. (a) • Using a dropping pipette, place two drops of DCPIP into each of five wells of a white spotting tile. • Start with the 1.00% solution of vitamin C. Use a clean dropping pipette to carefully add drops to one of the wells with the DCPIP and count how many drops are needed to decolourise it. Immediately record your result in Table 1.1. • Repeat with the other solutions of different concentrations of vitamin C and then the fruit juice, using a clean dropping pipette each time. • If a solution of vitamin C does not decolourise, stop when the well is full, record the number of drops and write maximum next to it. • You should ignore any colour changes seen 5 minutes after adding the vitamin C to the DCPIP. Table 1.1 concentration of vitamin C (%) number of drops needed to decolourise DCPIP 1.00 0.75 0.50 0.25 fruit juice [4]
Question paper, page 3
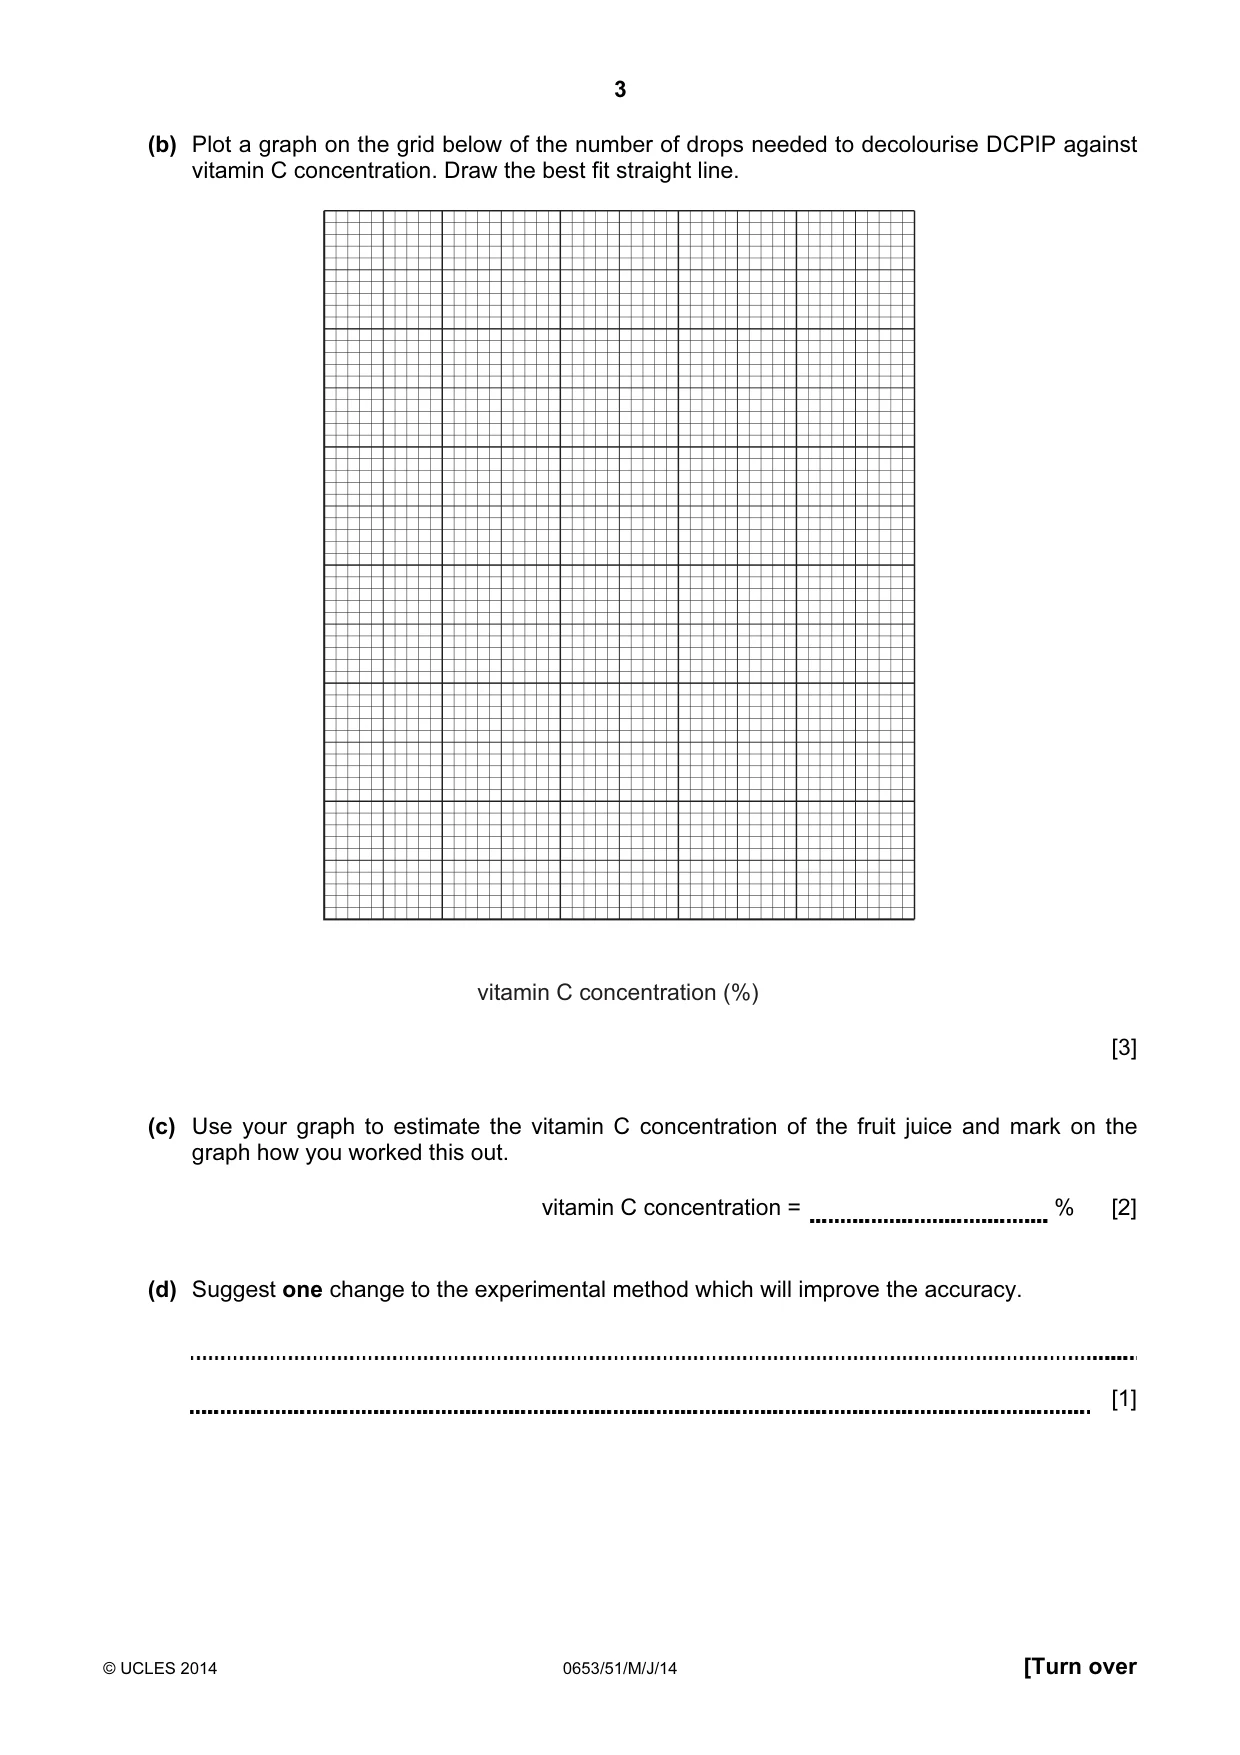
3 © UCLES 2014 0653/51/M/J/14 [Turn over (b) Plot a graph on the grid below of the number of drops needed to decolourise DCPIP against vitamin C concentration. Draw the best fit straight line. vitamin C concentration (%) [3] (c) Use your graph to estimate the vitamin C concentration of the fruit juice and mark on the graph how you worked this out. vitamin C concentration = % [2] (d) Suggest one change to the experimental method which will improve the accuracy. [1]
Question paper, page 4
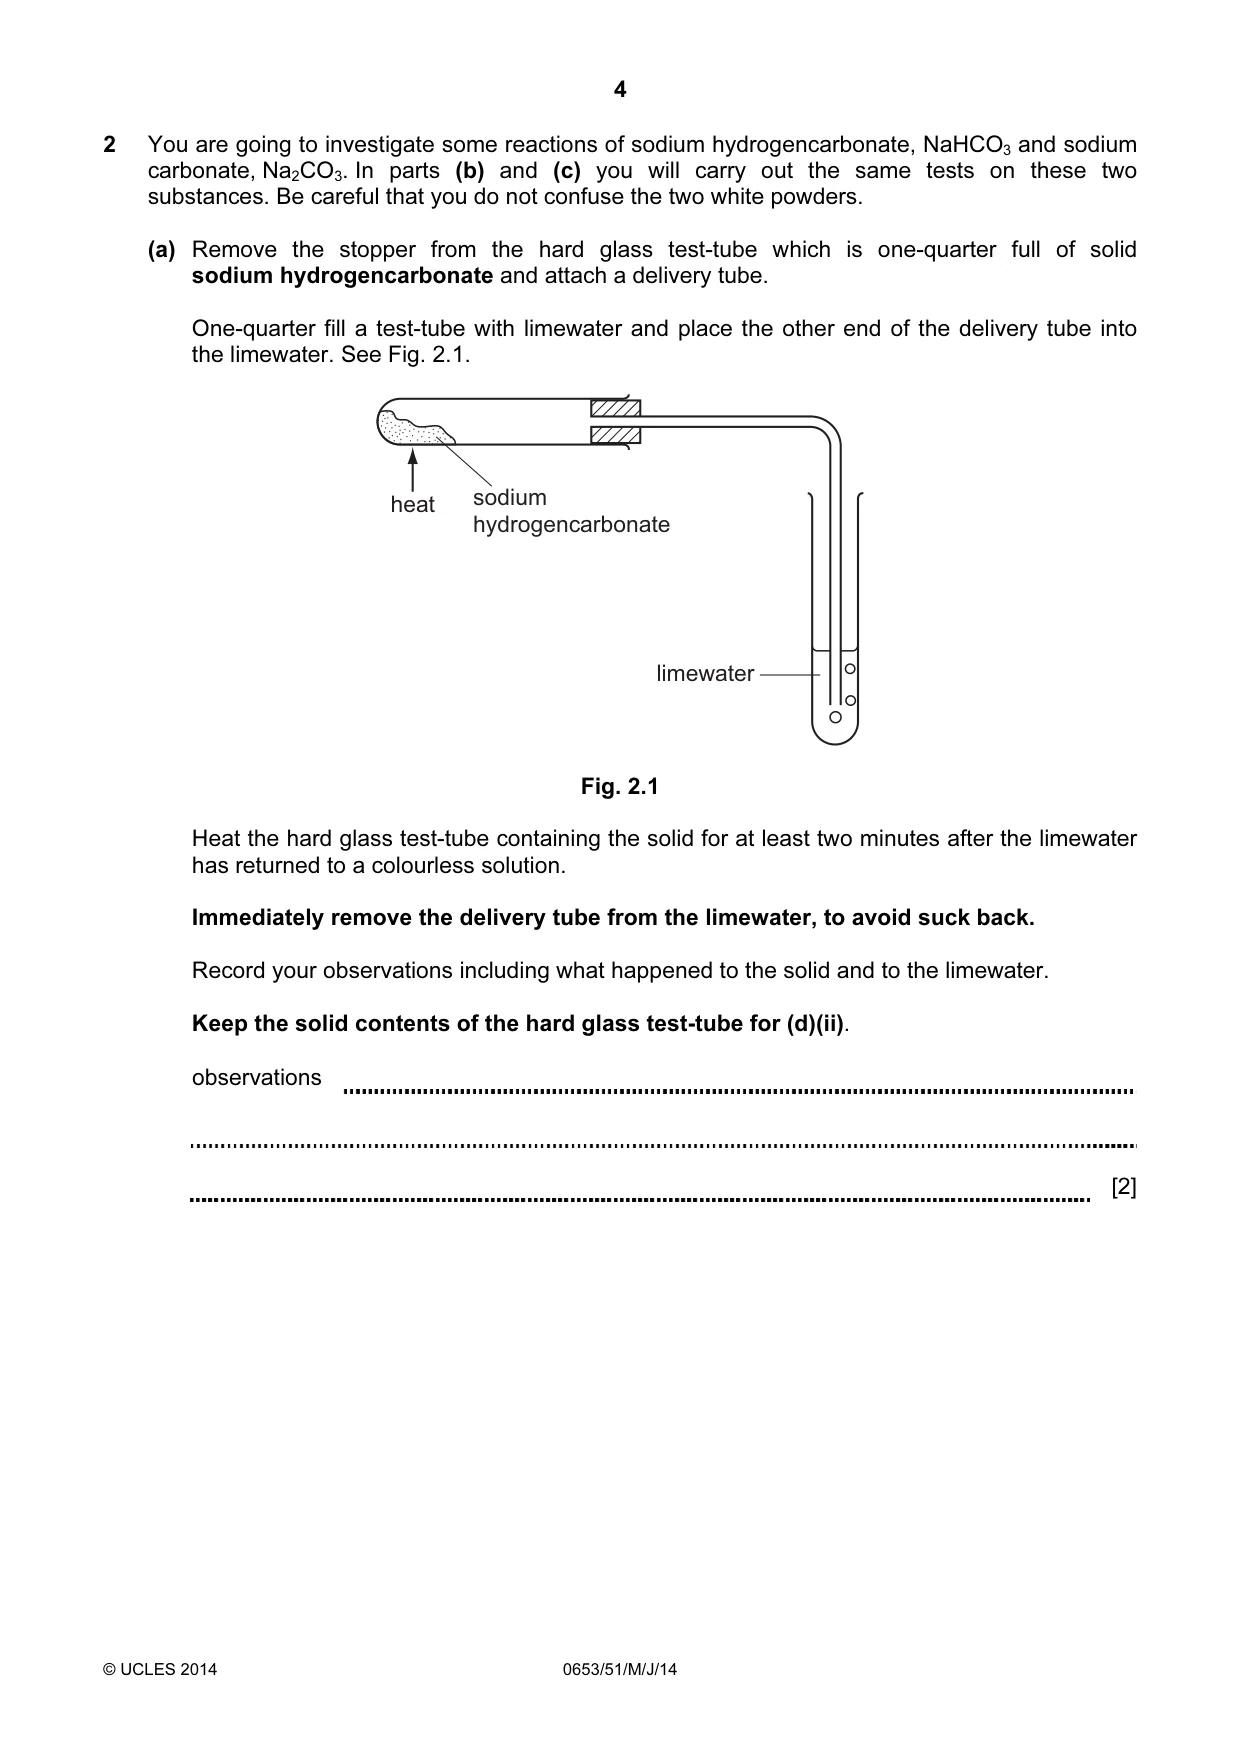
4 © UCLES 2014 0653/51/M/J/14 2 You are going to investigate some reactions of sodium hydrogencarbonate, NaHCO3 and sodium carbonate, Na2CO3. In parts (b) and (c) you will carry out the same tests on these two substances. Be careful that you do not confuse the two white powders. (a) Remove the stopper from the hard glass test-tube which is one-quarter full of solid sodium hydrogencarbonate and attach a delivery tube. One-quarter fill a test-tube with limewater and place the other end of the delivery tube into the limewater. See Fig. 2.1. heat sodium hydrogencarbonate limewater Fig. 2.1 Heat the hard glass test-tube containing the solid for at least two minutes after the limewater has returned to a colourless solution. Immediately remove the delivery tube from the limewater, to avoid suck back. Record your observations including what happened to the solid and to the limewater. Keep the solid contents of the hard glass test-tube for (d)(ii). observations [2]
Question paper, page 5
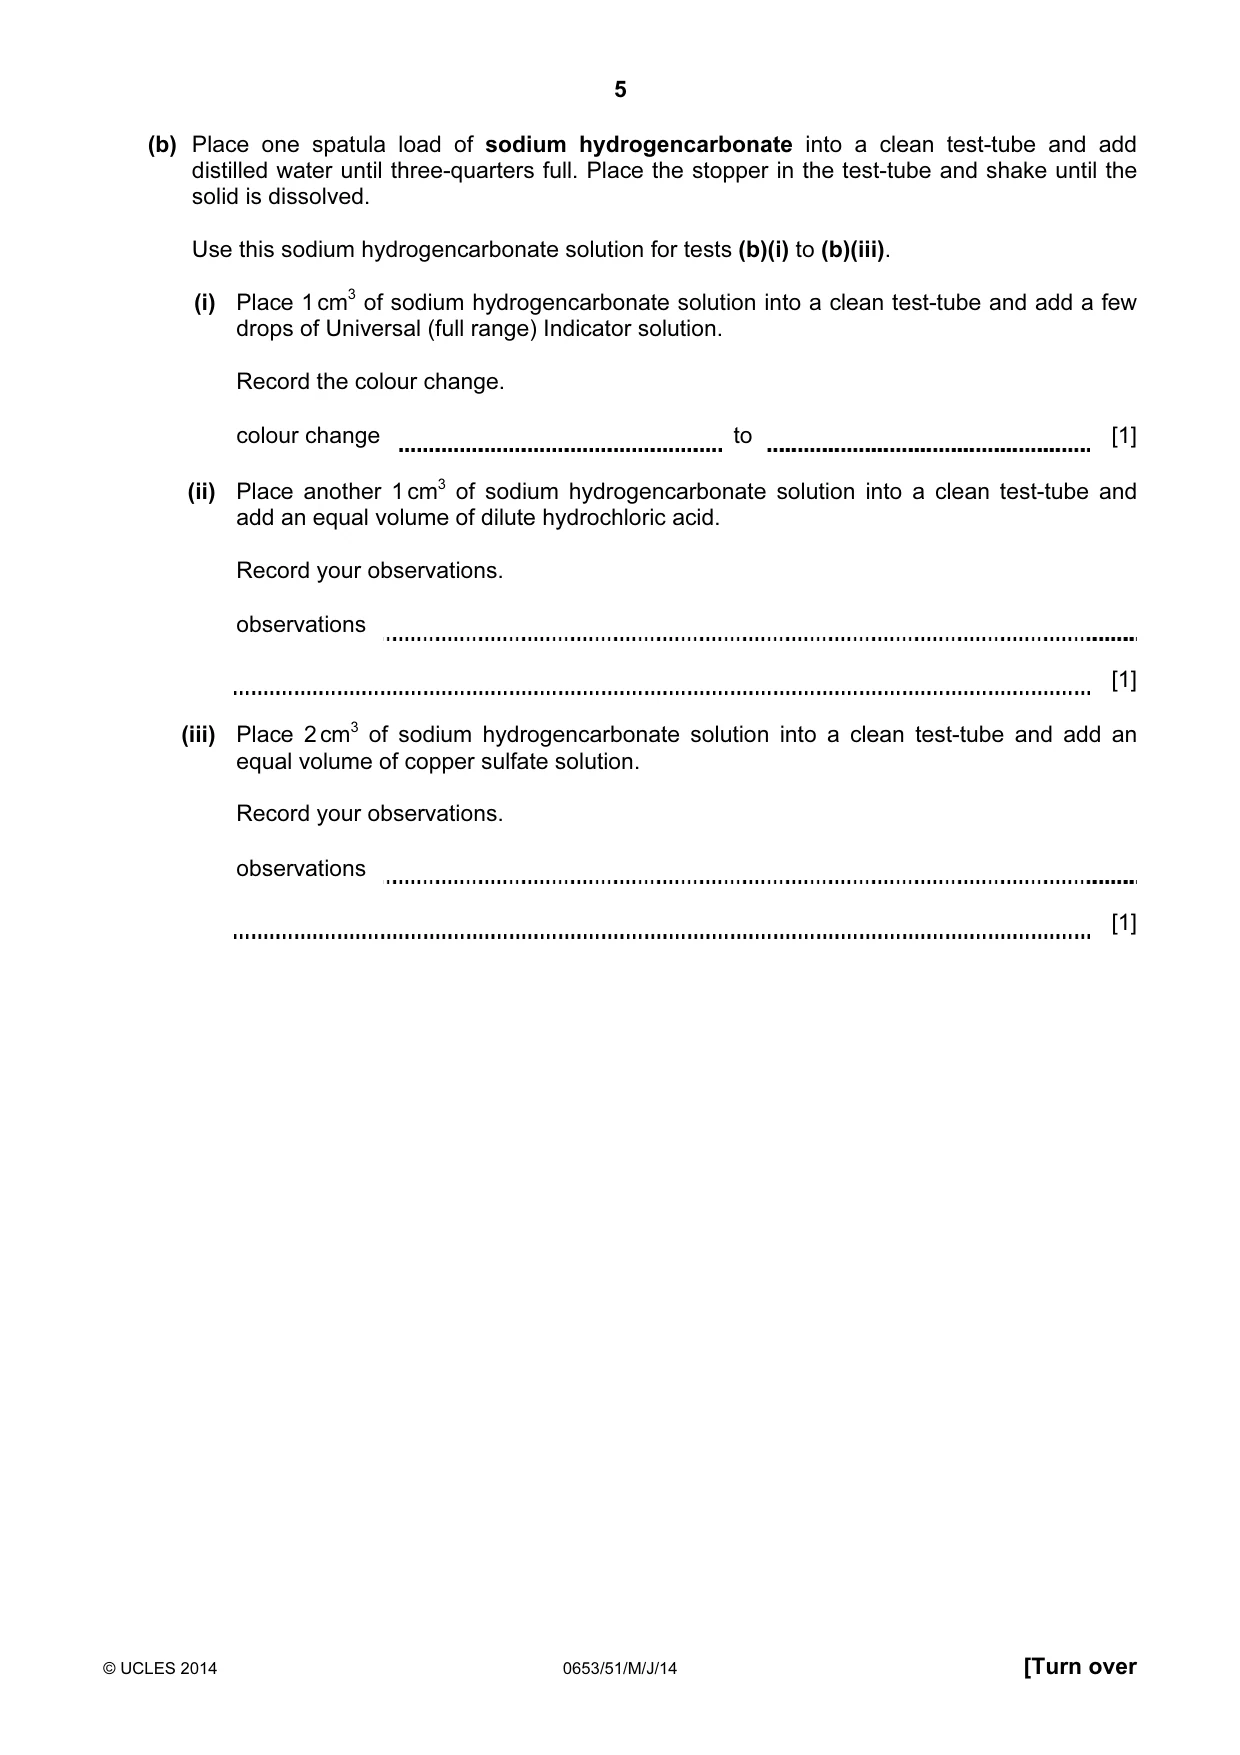
5 © UCLES 2014 0653/51/M/J/14 [Turn over (b) Place one spatula load of sodium hydrogencarbonate into a clean test-tube and add distilled water until three-quarters full. Place the stopper in the test-tube and shake until the solid is dissolved. Use this sodium hydrogencarbonate solution for tests (b)(i) to (b)(iii). (i) Place 1 cm3 of sodium hydrogencarbonate solution into a clean test-tube and add a few drops of Universal (full range) Indicator solution. Record the colour change. colour change to [1] (ii) Place another 1 cm3 of sodium hydrogencarbonate solution into a clean test-tube and add an equal volume of dilute hydrochloric acid. Record your observations. observations [1] (iii) Place 2 cm3 of sodium hydrogencarbonate solution into a clean test-tube and add an equal volume of copper sulfate solution. Record your observations. observations [1]
Question paper, page 6
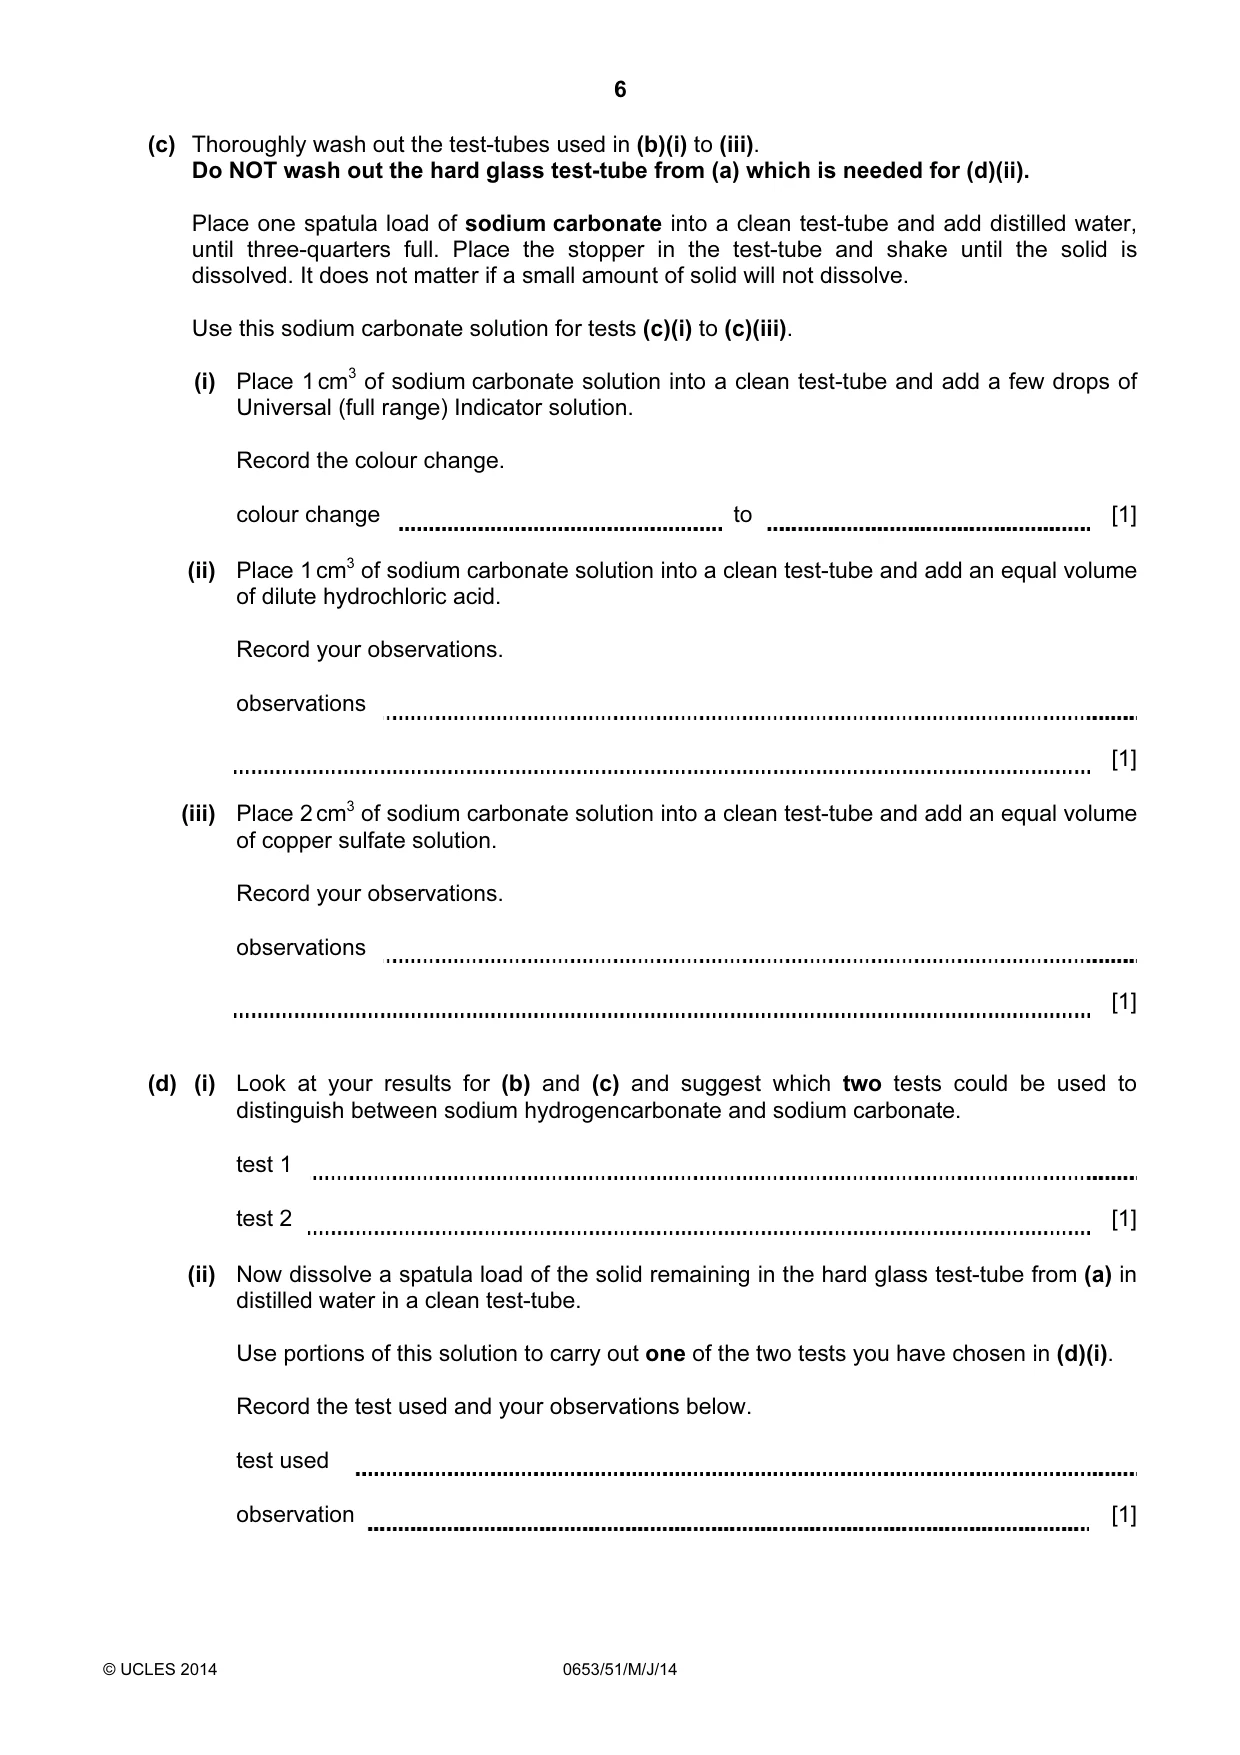
6 © UCLES 2014 0653/51/M/J/14 (c) Thoroughly wash out the test-tubes used in (b)(i) to (iii). Do NOT wash out the hard glass test-tube from (a) which is needed for (d)(ii). Place one spatula load of sodium carbonate into a clean test-tube and add distilled water, until three-quarters full. Place the stopper in the test-tube and shake until the solid is dissolved. It does not matter if a small amount of solid will not dissolve. Use this sodium carbonate solution for tests (c)(i) to (c)(iii). (i) Place 1 cm3 of sodium carbonate solution into a clean test-tube and add a few drops of Universal (full range) Indicator solution. Record the colour change. colour change to [1] (ii) Place 1 cm3 of sodium carbonate solution into a clean test-tube and add an equal volume of dilute hydrochloric acid. Record your observations. observations [1] (iii) Place 2 cm3 of sodium carbonate solution into a clean test-tube and add an equal volume of copper sulfate solution. Record your observations. observations [1] (d) (i) Look at your results for (b) and (c) and suggest which two tests could be used to distinguish between sodium hydrogencarbonate and sodium carbonate. test 1 test 2 [1] (ii) Now dissolve a spatula load of the solid remaining in the hard glass test-tube from (a) in distilled water in a clean test-tube. Use portions of this solution to carry out one of the two tests you have chosen in (d)(i). Record the test used and your observations below. test used observation [1]
Question paper, page 7
7 © UCLES 2014 0653/51/M/J/14 [Turn over Please turn over for Question 3.
Question paper, page 8
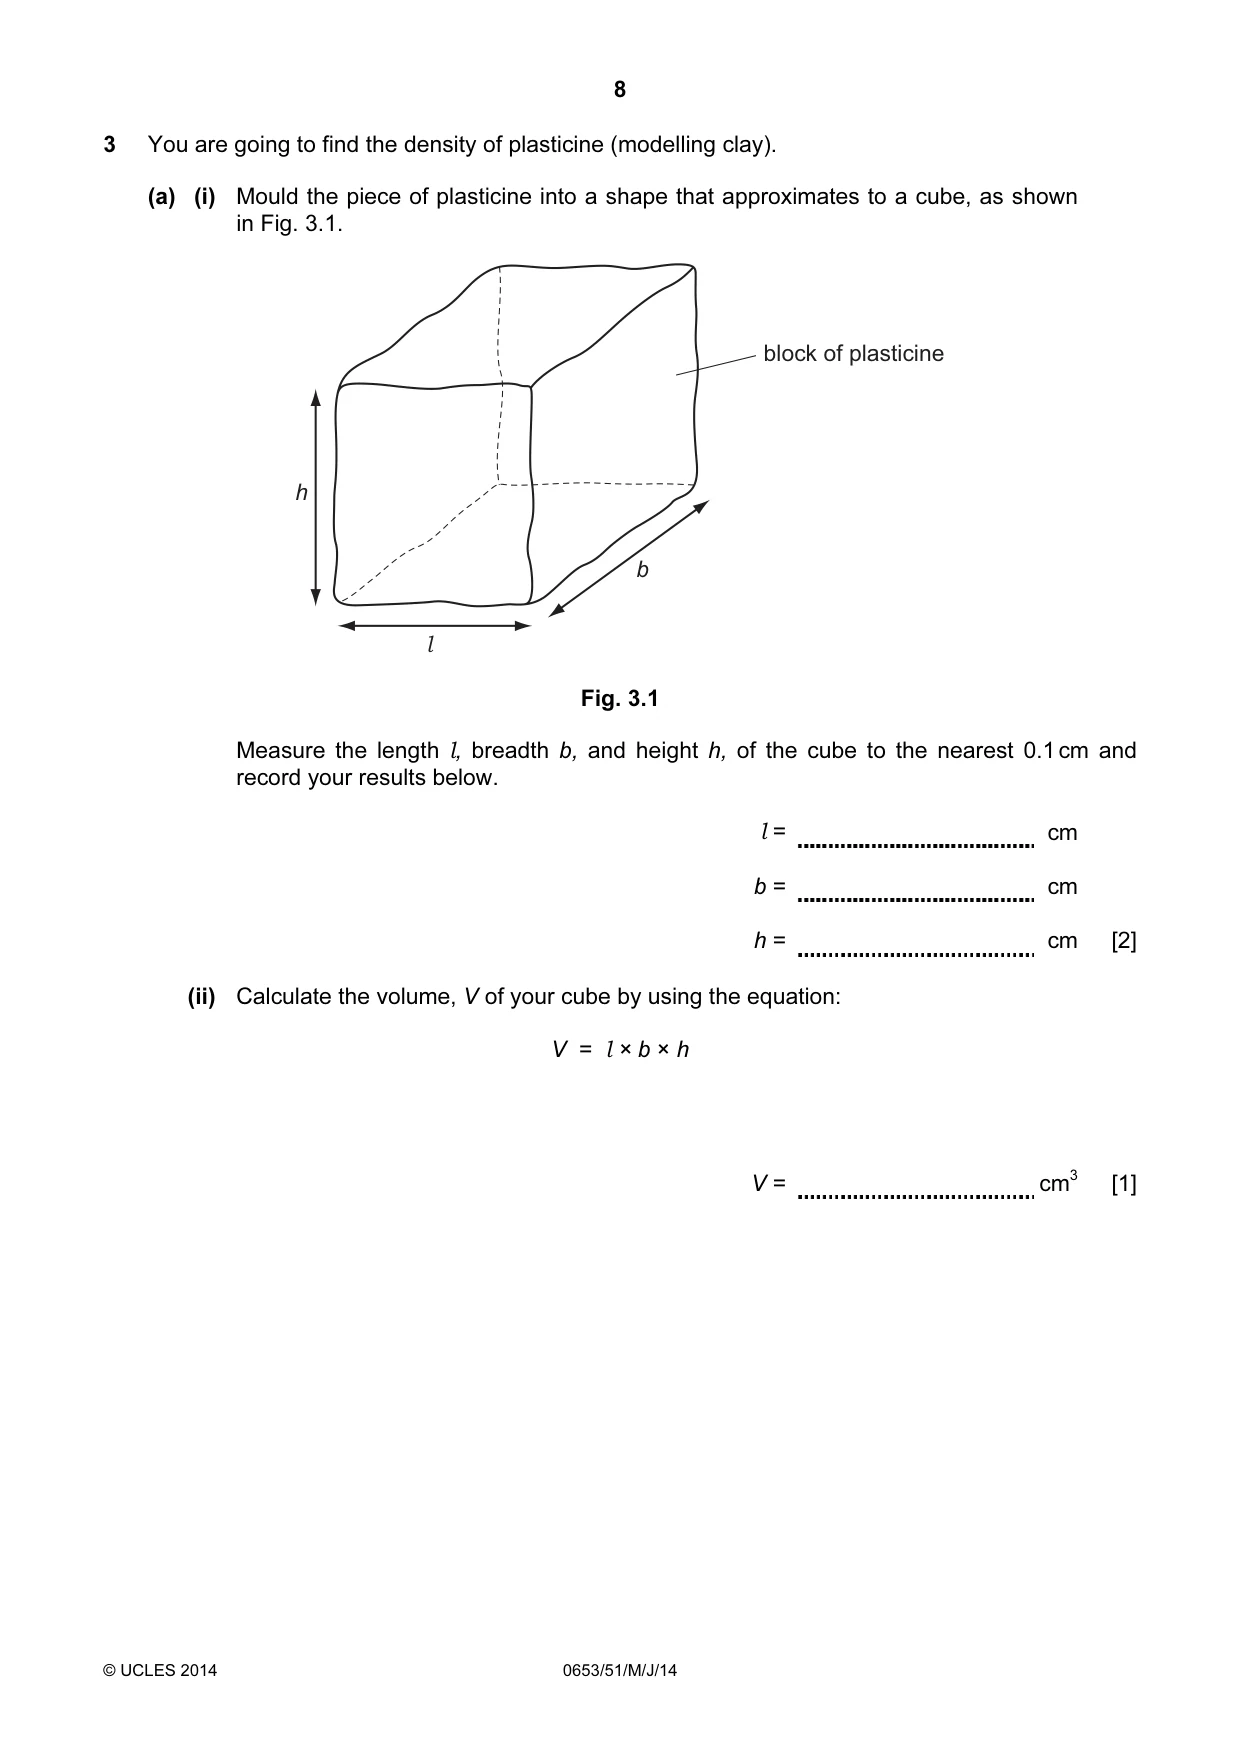
8 © UCLES 2014 0653/51/M/J/14 3 You are going to find the density of plasticine (modelling clay). (a) (i) Mould the piece of plasticine into a shape that approximates to a cube, as shown in Fig. 3.1. b h l block of plasticine Fig. 3.1 Measure the length l, breadth b, and height h, of the cube to the nearest 0.1 cm and record your results below. l = cm b = cm h = cm [2] (ii) Calculate the volume, V of your cube by using the equation: V = l × b × h V = cm3 [1]
Question paper, page 9
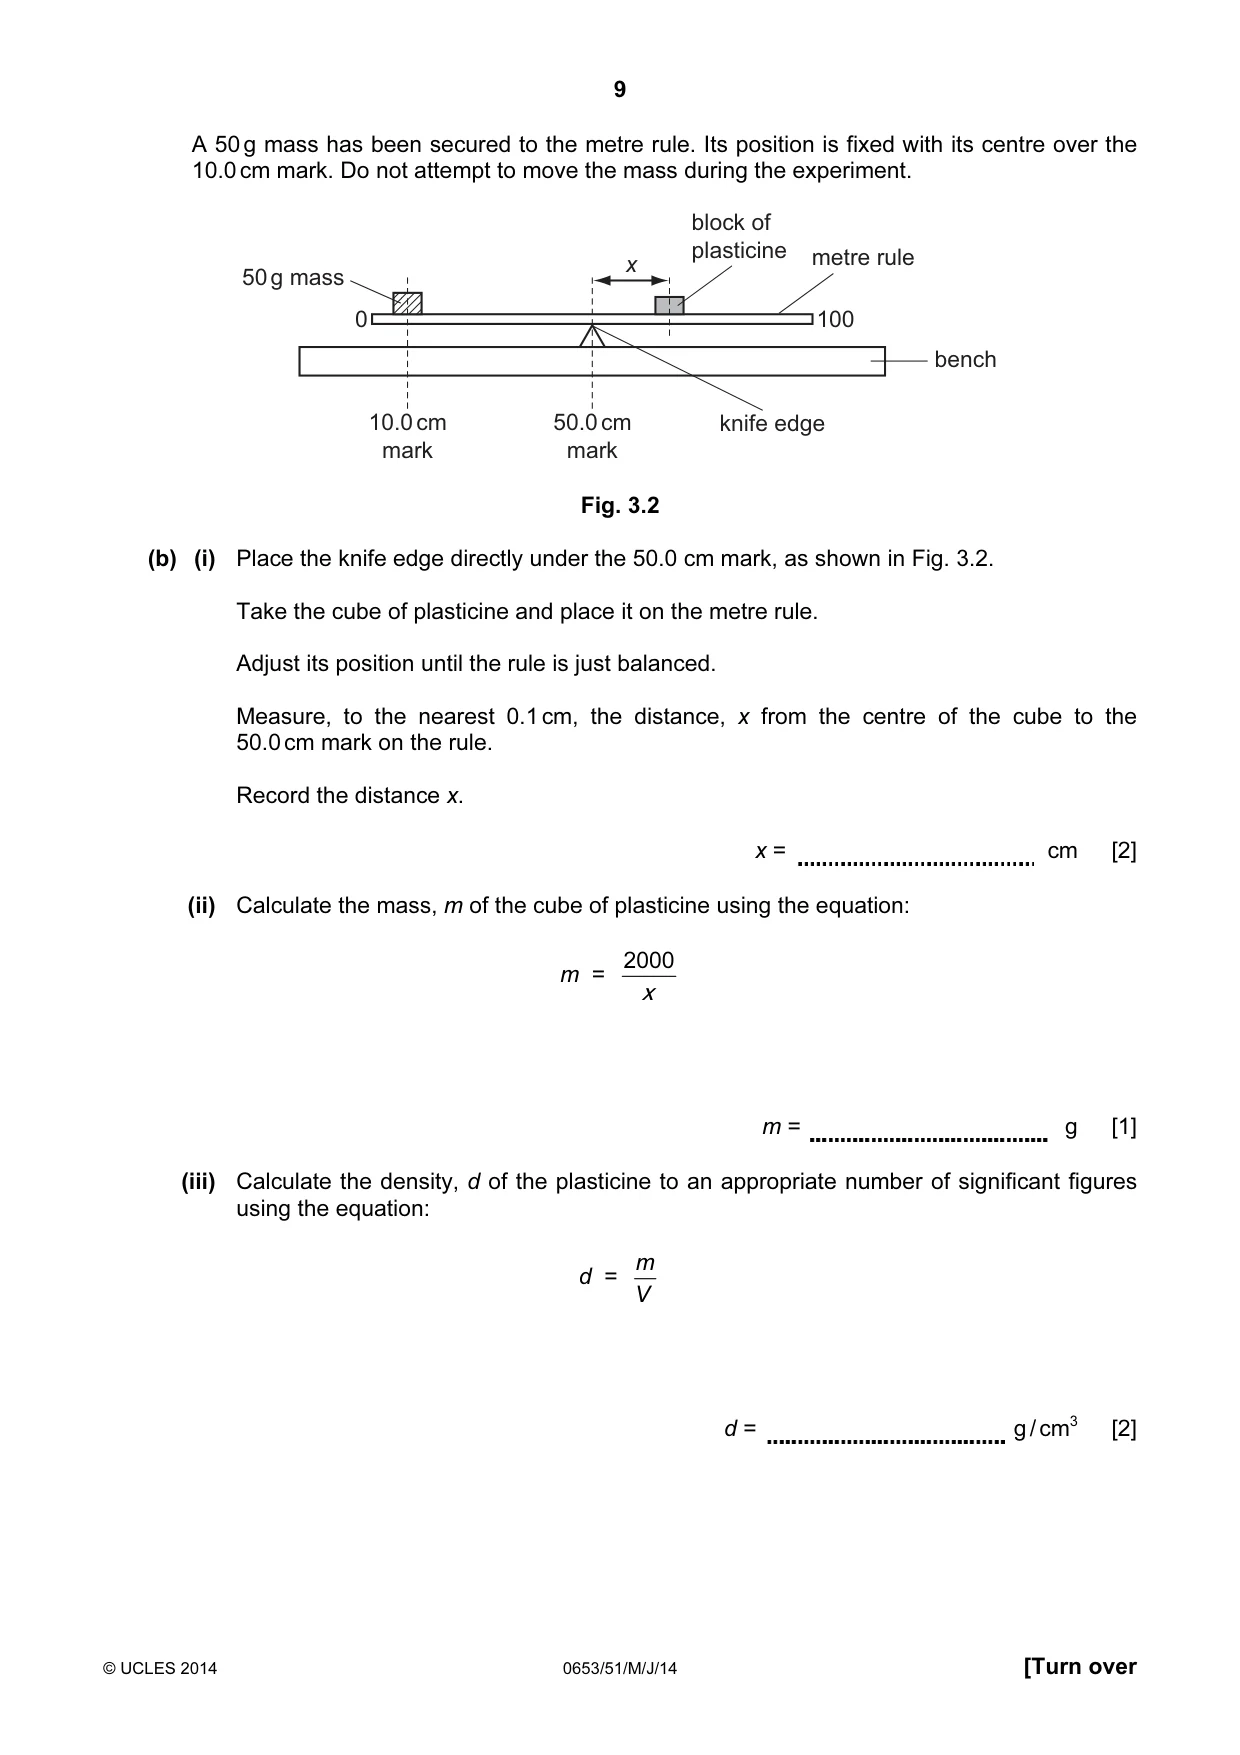
9 © UCLES 2014 0653/51/M/J/14 [Turn over A 50 g mass has been secured to the metre rule. Its position is fixed with its centre over the 10.0 cm mark. Do not attempt to move the mass during the experiment. 50 g mass block of plasticine metre rule x 10.0 cm mark 50.0 cm mark bench 0 100 knife edge Fig. 3.2 (b) (i) Place the knife edge directly under the 50.0 cm mark, as shown in Fig. 3.2. Take the cube of plasticine and place it on the metre rule. Adjust its position until the rule is just balanced. Measure, to the nearest 0.1 cm, the distance, x from the centre of the cube to the 50.0 cm mark on the rule. Record the distance x. x = cm [2] (ii) Calculate the mass, m of the cube of plasticine using the equation: m = x 2000 m = g [1] (iii) Calculate the density, d of the plasticine to an appropriate number of significant figures using the equation: d = m V d = g / cm3 [2]
Question paper, page 10
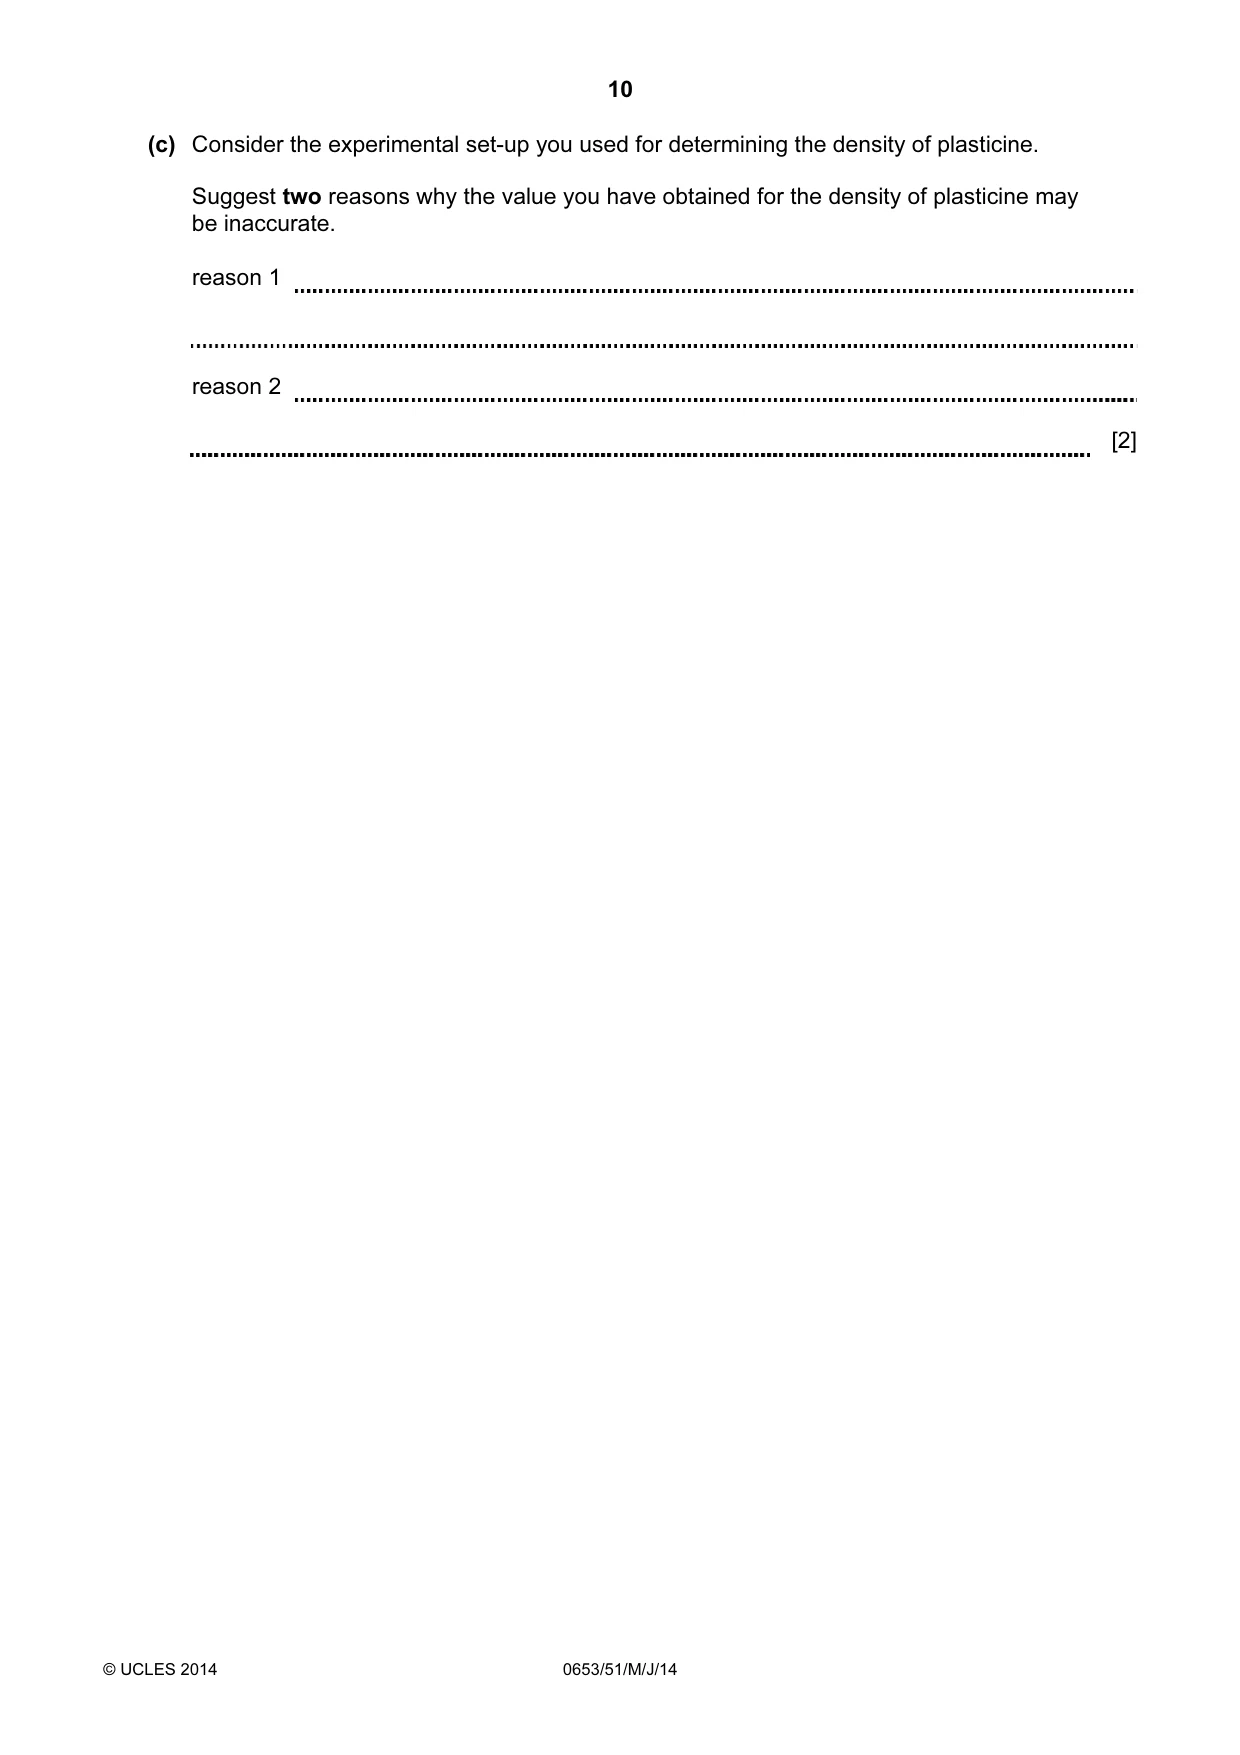
10 © UCLES 2014 0653/51/M/J/14 (c) Consider the experimental set-up you used for determining the density of plasticine. Suggest two reasons why the value you have obtained for the density of plasticine may be inaccurate. reason 1 reason 2 [2]
Question paper, page 11
11 © UCLES 2014 0653/51/M/J/14 BLANK PAGE
Question paper, page 12
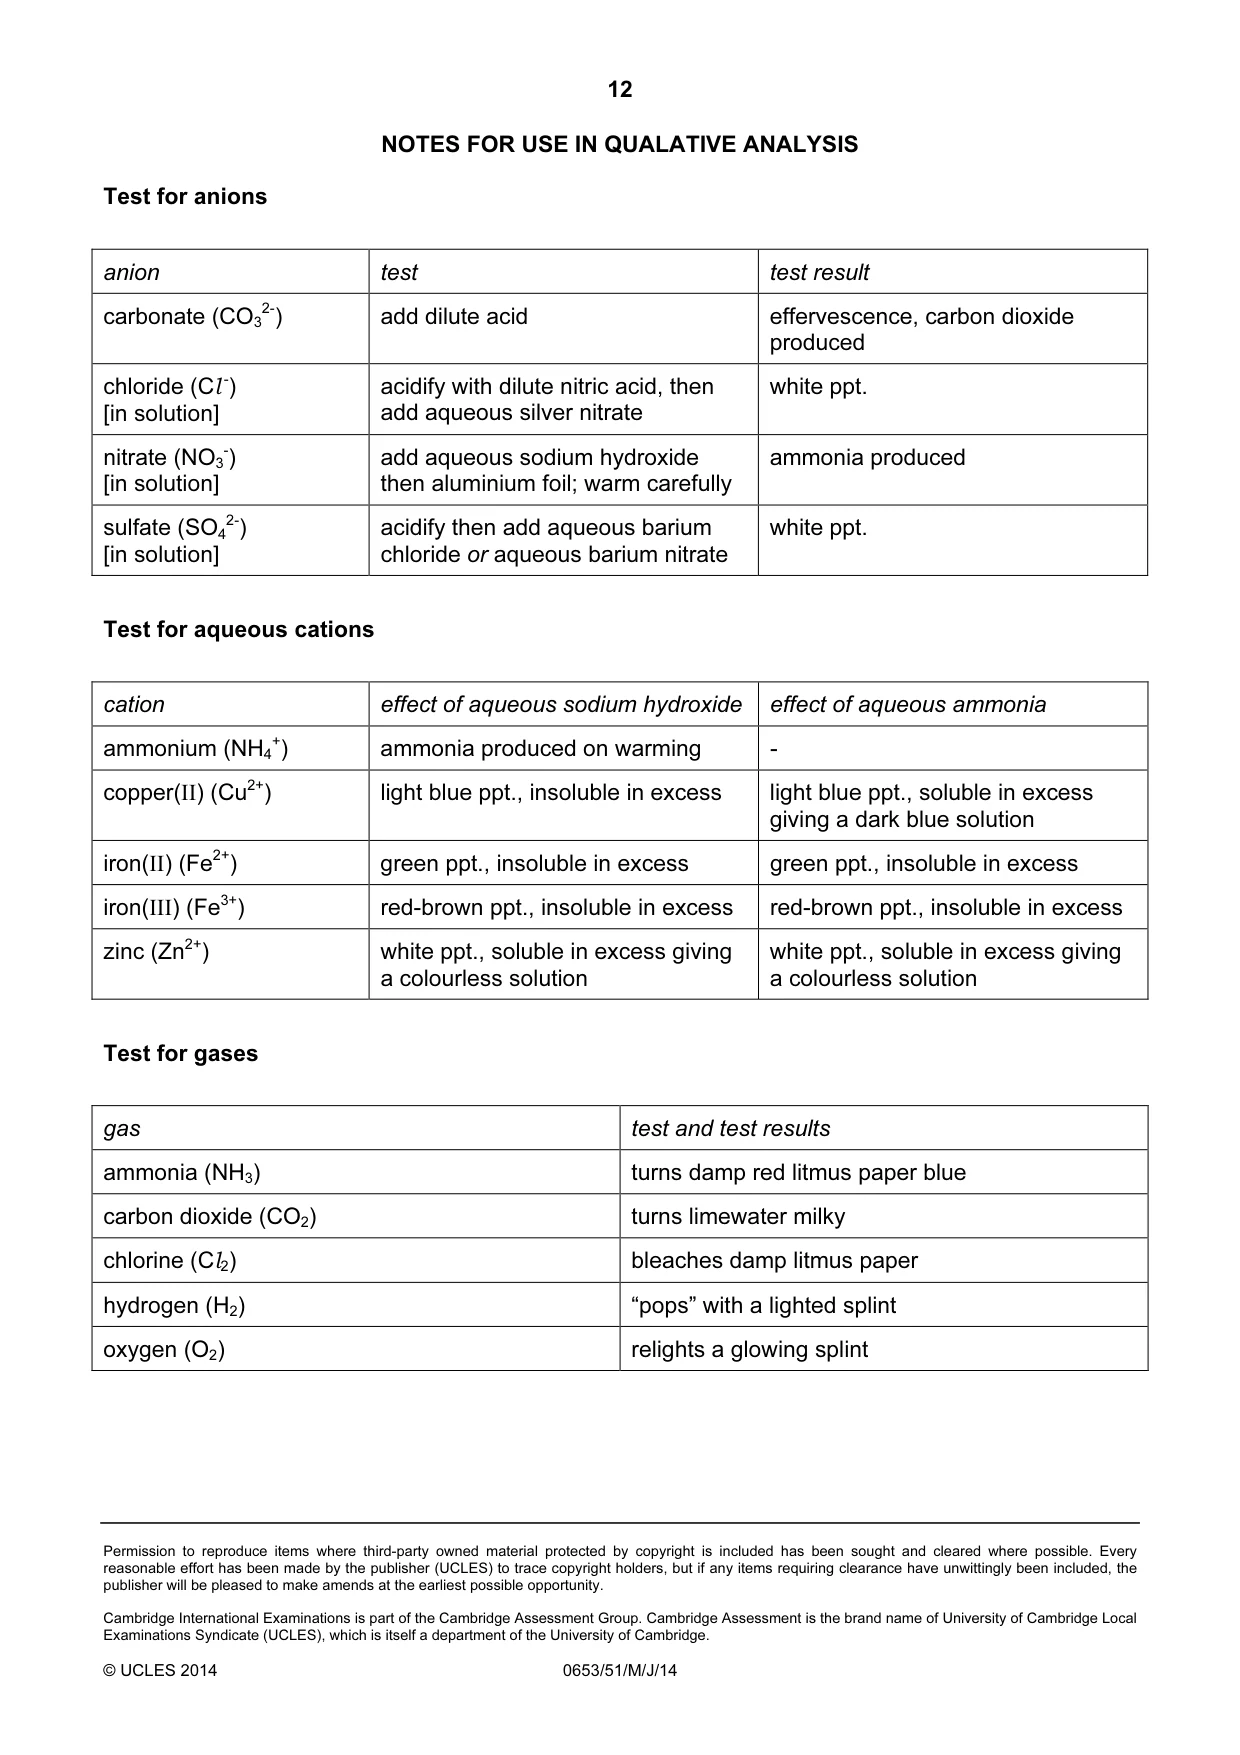
12 Permission to reproduce items where third-party owned material protected by copyright is included has been sought and cleared where possible. Every reasonable effort has been made by the publisher (UCLES) to trace copyright holders, but if any items requiring clearance have unwittingly been included, the publisher will be pleased to make amends at the earliest possible opportunity. Cambridge International Examinations is part of the Cambridge Assessment Group. Cambridge Assessment is the brand name of University of Cambridge Local Examinations Syndicate (UCLES), which is itself a department of the University of Cambridge. © UCLES 2014 0653/51/M/J/14 NOTES FOR USE IN QUALATIVE ANALYSIS Test for anions anion test test result carbonate (CO3 2-) add dilute acid effervescence, carbon dioxide produced chloride (Cl -) [in solution] acidify with dilute nitric acid, then add aqueous silver nitrate white ppt. nitrate (NO3 -) [in solution] add aqueous sodium hydroxide then aluminium foil; warm carefully ammonia produced sulfate (SO4 2-) [in solution] acidify then add aqueous barium chloride or aqueous barium nitrate white ppt. Test for aqueous cations cation effect of aqueous sodium hydroxide effect of aqueous ammonia ammonium (NH4 +) ammonia produced on warming - copper(II) (Cu2+) light blue ppt., insoluble in excess light blue ppt., soluble in excess giving a dark blue solution iron(II) (Fe2+) green ppt., insoluble in excess green ppt., insoluble in excess iron(III) (Fe3+) red-brown ppt., insoluble in excess red-brown ppt., insoluble in excess zinc (Zn2+) white ppt., soluble in excess giving a colourless solution white ppt., soluble in excess giving a colourless solution Test for gases gas test and test results ammonia (NH3) turns damp red litmus paper blue carbon dioxide (CO2) turns limewater milky chlorine (Cl2) bleaches damp litmus paper hydrogen (H2) “pops” with a lighted splint oxygen (O2) relights a glowing splint
Mark scheme, page 1
CAMBRIDGE INTERNATIONAL EXAMINATIONS International General Certificate of Secondary Education MARK SCHEME for the May/June 2014 series 0653 COMBINED SCIENCE 0653/51 Paper 5 (Practical), maximum raw mark 30 This mark scheme is published as an aid to teachers and candidates, to indicate the requirements of the examination. It shows the basis on which Examiners were instructed to award marks. It does not indicate the details of the discussions that took place at an Examiners’ meeting before marking began, which would have considered the acceptability of alternative answers. Mark schemes should be read in conjunction with the question paper and the Principal Examiner Report for Teachers. Cambridge will not enter into discussions about these mark schemes. Cambridge is publishing the mark schemes for the May/June 2014 series for most IGCSE, GCE Advanced Level and Advanced Subsidiary Level components and some Ordinary Level components.
Mark scheme, page 2
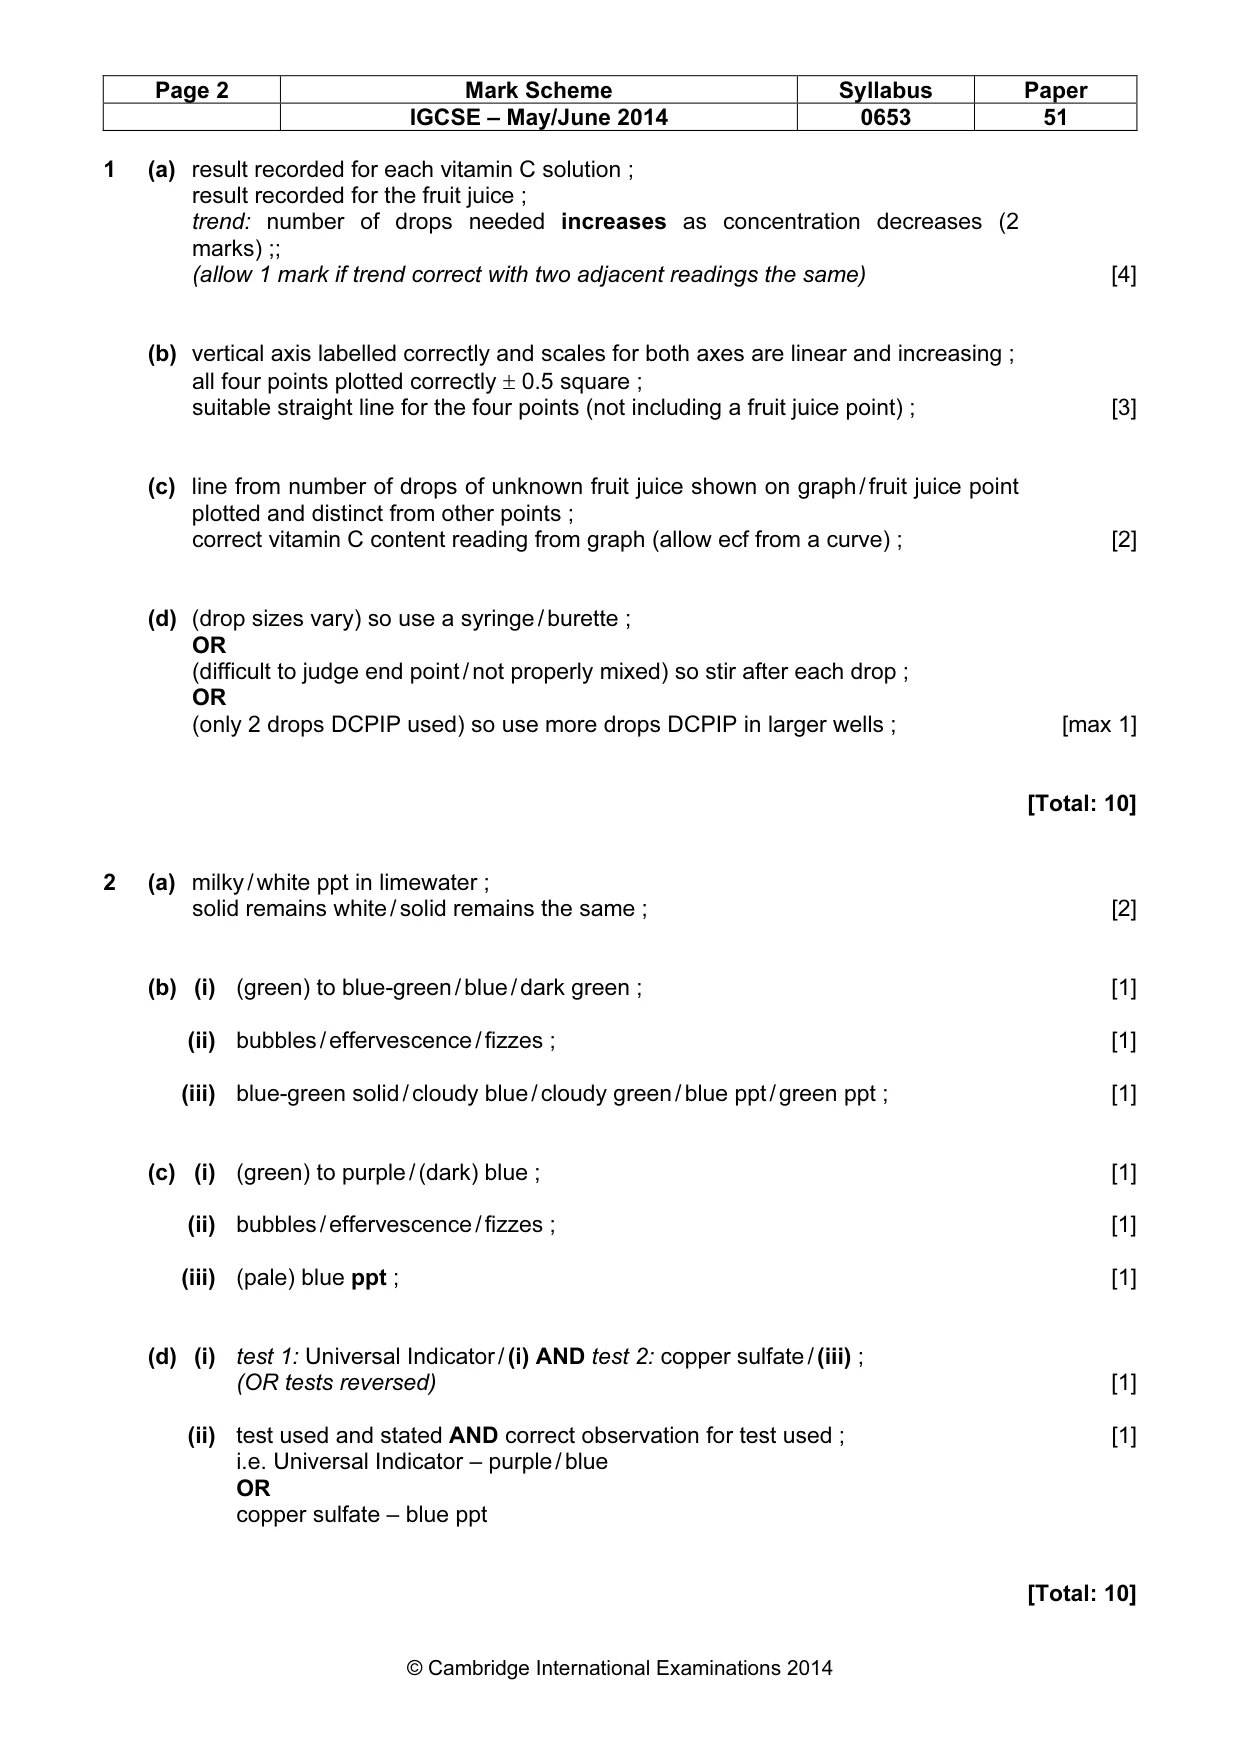
Page 2 Mark Scheme Syllabus Paper IGCSE – May/June 2014 0653 51 © Cambridge International Examinations 2014 1 (a) result recorded for each vitamin C solution ; result recorded for the fruit juice ; trend: number of drops needed increases as concentration decreases (2 marks) ;; (allow 1 mark if trend correct with two adjacent readings the same) [4] (b) vertical axis labelled correctly and scales for both axes are linear and increasing ; all four points plotted correctly ± 0.5 square ; suitable straight line for the four points (not including a fruit juice point) ; [3] (c) line from number of drops of unknown fruit juice shown on graph / fruit juice point plotted and distinct from other points ; correct vitamin C content reading from graph (allow ecf from a curve) ; [2] (d) (drop sizes vary) so use a syringe / burette ; OR (difficult to judge end point / not properly mixed) so stir after each drop ; OR (only 2 drops DCPIP used) so use more drops DCPIP in larger wells ; [max 1] [Total: 10] 2 (a) milky / white ppt in limewater ; solid remains white / solid remains the same ; [2] (b) (i) (green) to blue-green / blue / dark green ; [1] (ii) bubbles / effervescence / fizzes ; [1] (iii) blue-green solid / cloudy blue / cloudy green / blue ppt / green ppt ; [1] (c) (i) (green) to purple / (dark) blue ; [1] (ii) bubbles / effervescence / fizzes ; [1] (iii) (pale) blue ppt ; [1] (d) (i) test 1: Universal Indicator / (i) AND test 2: copper sulfate / (iii) ; (OR tests reversed) [1] (ii) test used and stated AND correct observation for test used ; [1] i.e. Universal Indicator – purple / blue OR copper sulfate – blue ppt [Total: 10]
Mark scheme, page 3
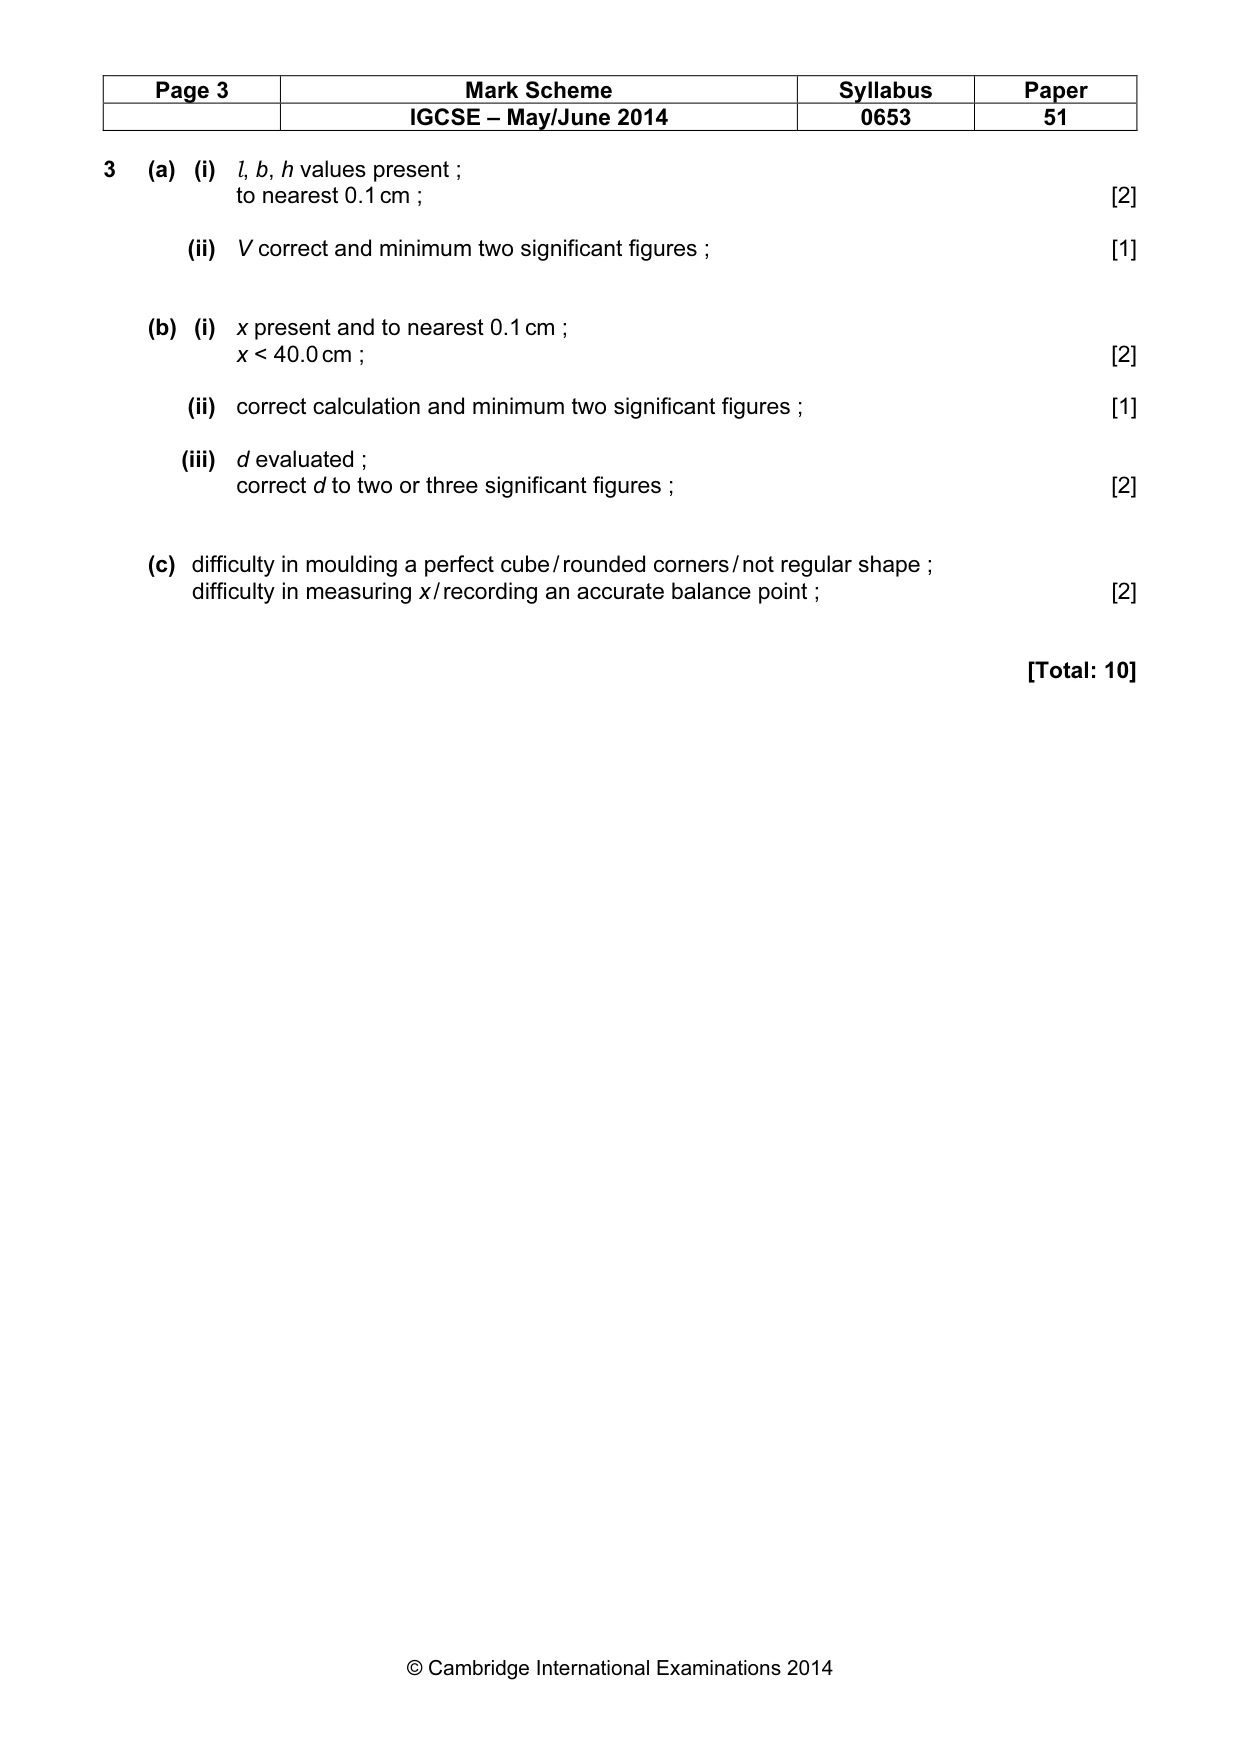
Page 3 Mark Scheme Syllabus Paper IGCSE – May/June 2014 0653 51 © Cambridge International Examinations 2014 3 (a) (i) l, b, h values present ; to nearest 0.1 cm ; [2] (ii) V correct and minimum two significant figures ; [1] (b) (i) x present and to nearest 0.1 cm ; x < 40.0 cm ; [2] (ii) correct calculation and minimum two significant figures ; [1] (iii) d evaluated ; correct d to two or three significant figures ; [2] (c) difficulty in moulding a perfect cube / rounded corners / not regular shape ; difficulty in measuring x / recording an accurate balance point ; [2] [Total: 10]
What you needed in this session
Cambridge’s own grade thresholds for 2014 May/June, Paper 5 · Variant 1. A higher threshold means an easier paper — the bar moves with how the cohort did.