Cambridge IGCSE Physics 0625 — 2019 May/June Paper 5 · Variant 2
0625/52/M/J/19 · 4 questions · 40 marks · ≈45 min
The question paper and its mark scheme, free to read here and free to download. This is Cambridge’s own paper, exactly as it was sat.
Question paper12 pages

Mark scheme7 pages
Answers below. Sit the paper first if you are practising.
Questions as text
Q1 · In this experiment, you will investigate moments using a balancing method
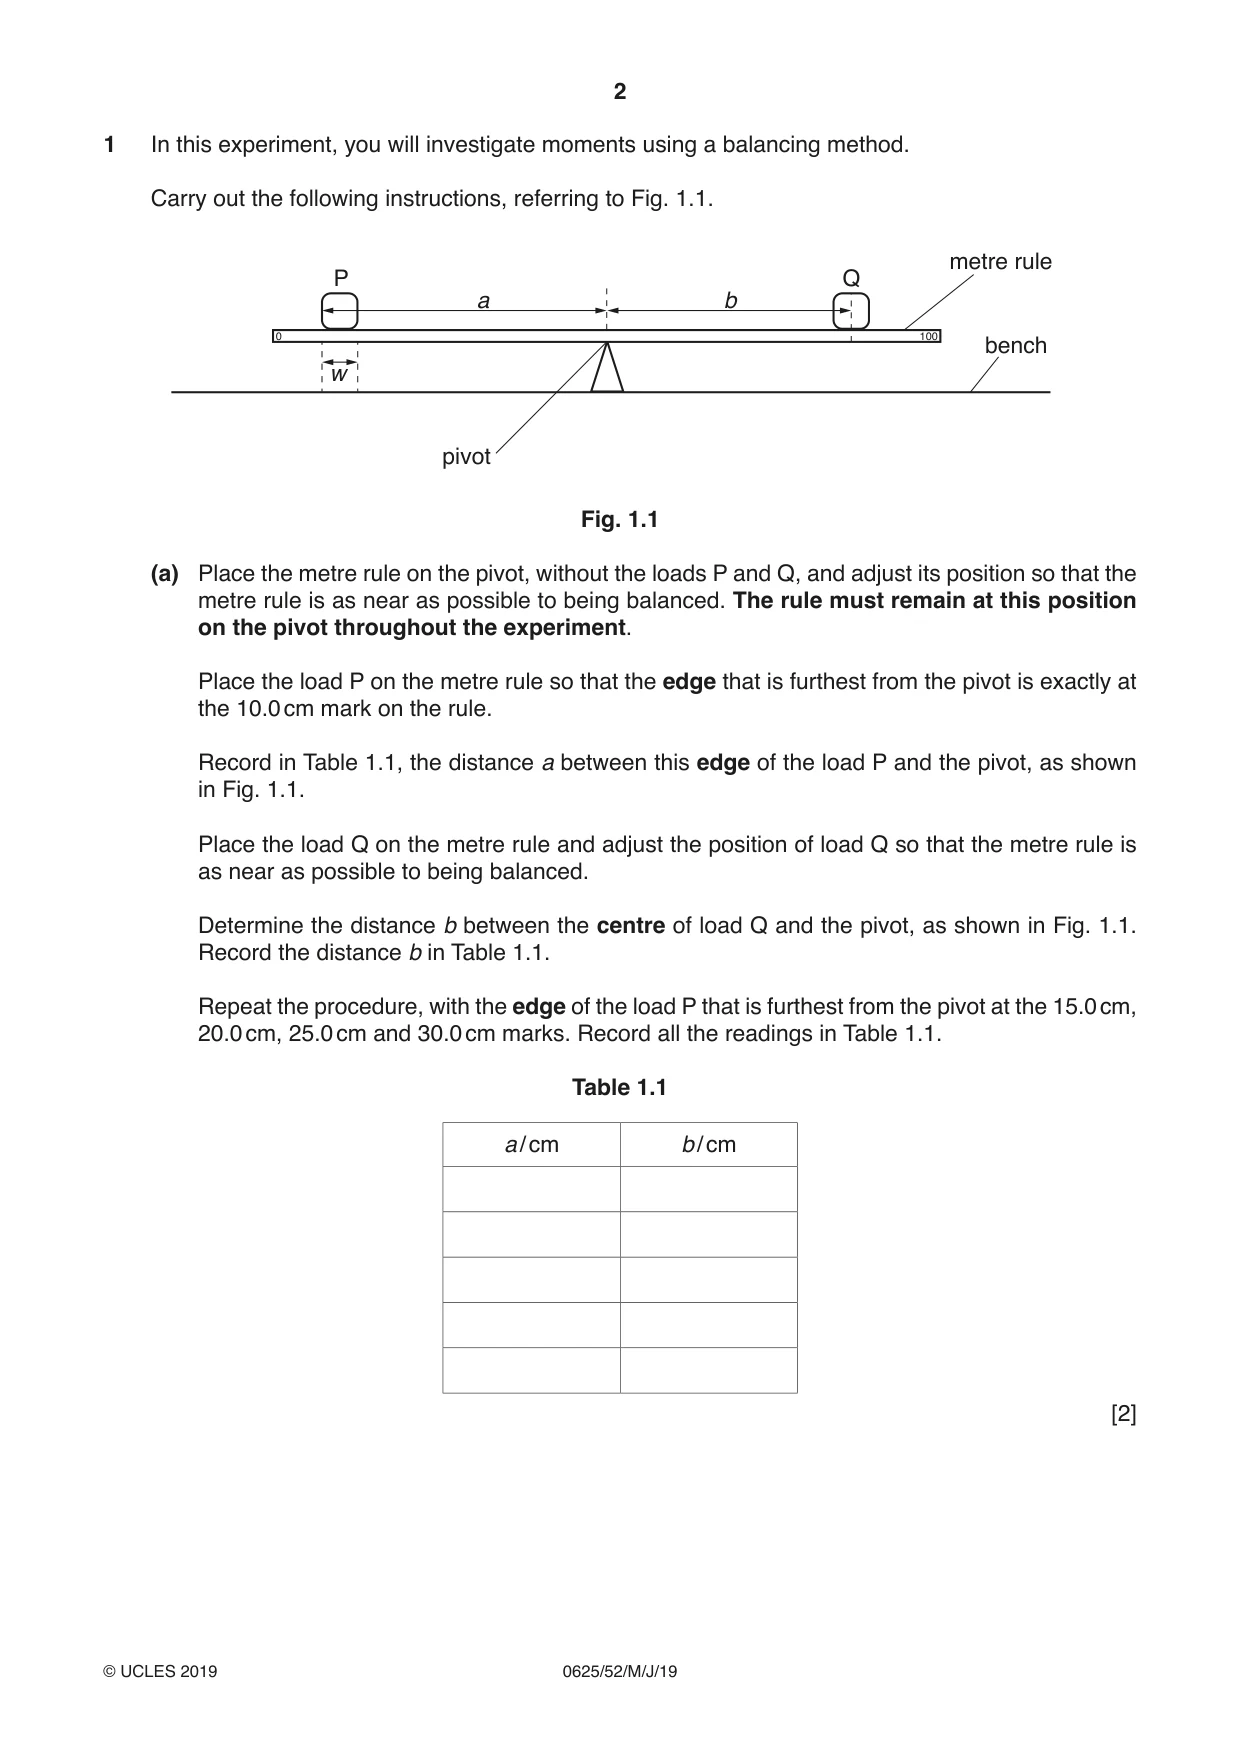
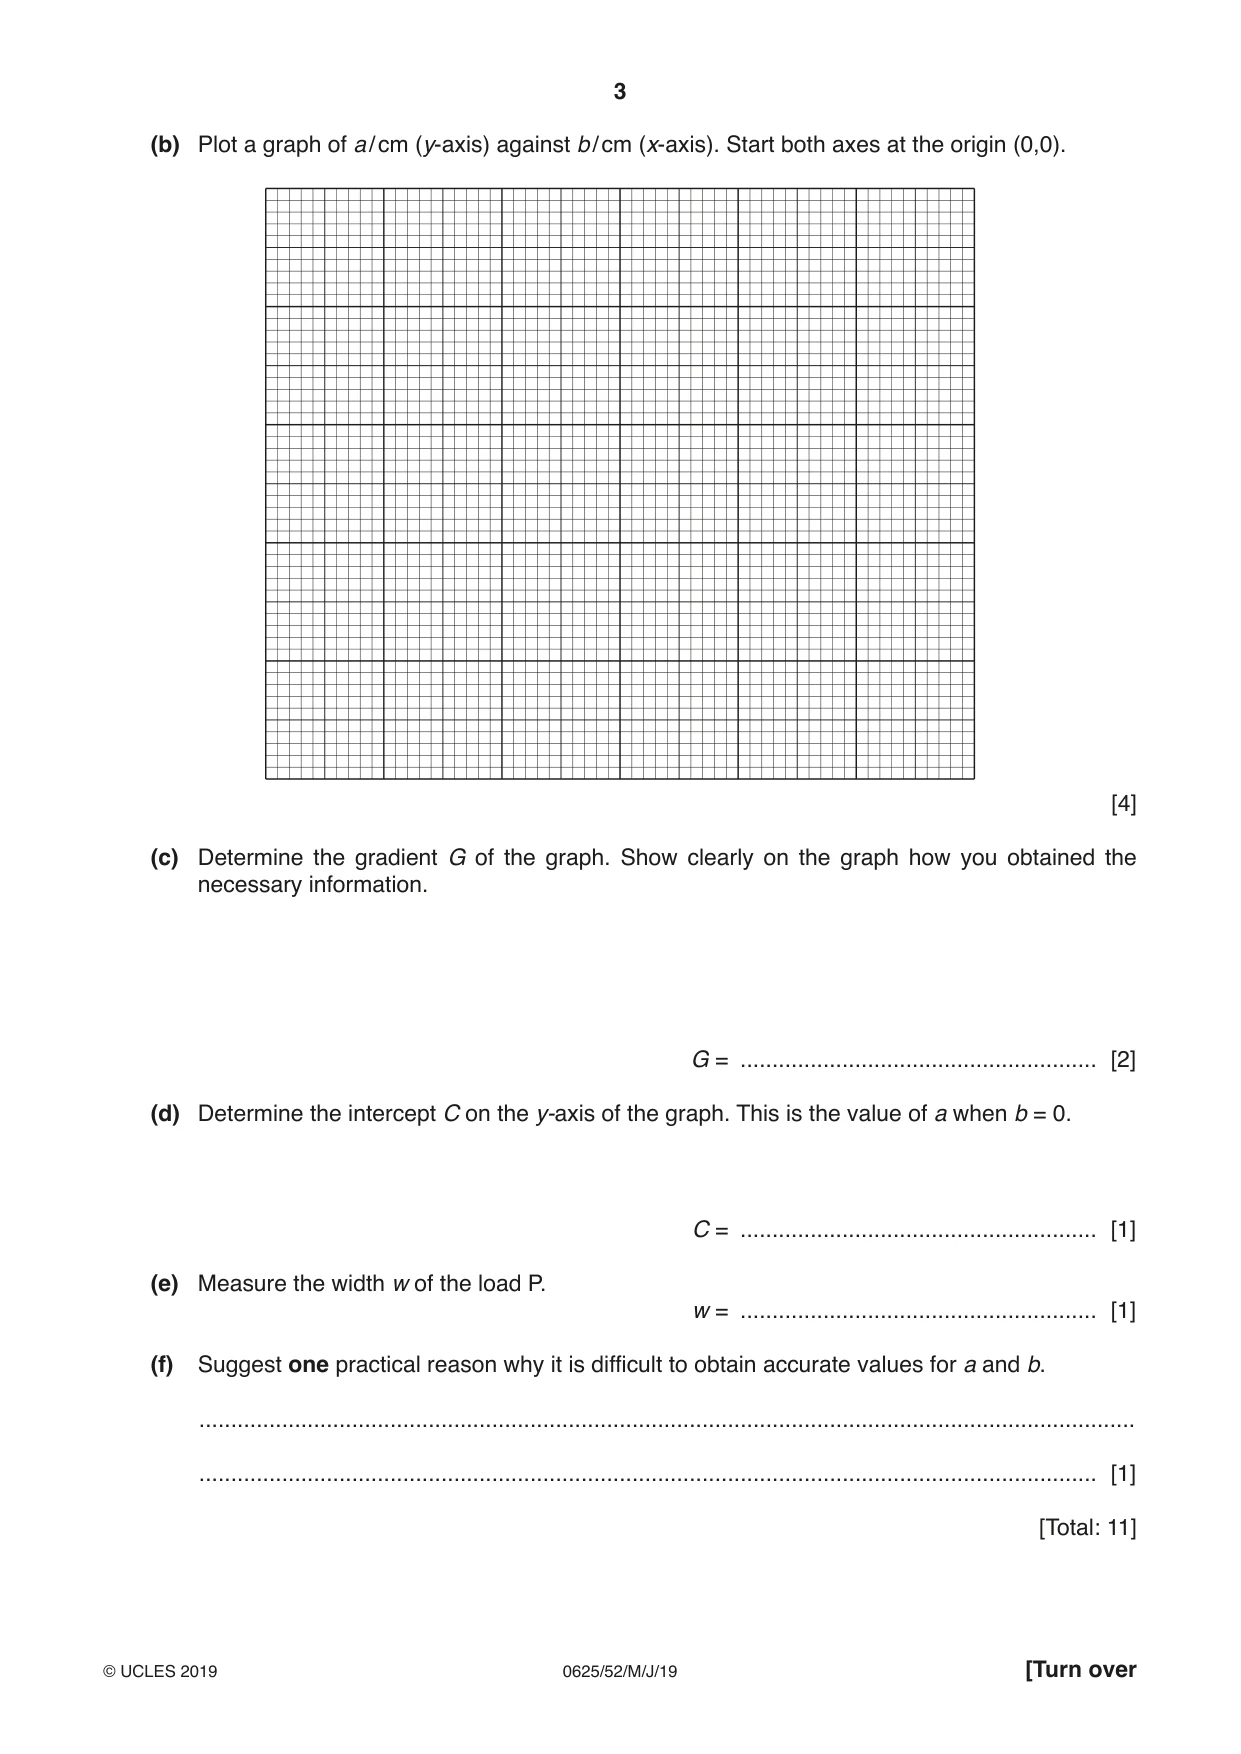
1 In this experiment, you will investigate moments using a balancing method. Carry out the following instructions, referring to Fig. 1.1. metre rule P Q a b 0 100 bench w pivot Fig. 1.1 (a) Place the metre rule on the pivot, without the loads P and Q, and adjust its position so that the metre rule is as near as possible to being balanced. The rule must remain at this position on the pivot throughout the experiment. Place the load P on the metre rule so that the edge that is furthest from the pivot is exactly at the 10.0 cm mark on the rule. Record in Table 1.1, the distance a between this edge of the load P and the pivot, as shown in Fig. 1.1. Place the load Q on the metre rule and adjust the position of load Q so that the metre rule is as near as possible to being balanced. Determine the distance b between the centre of load Q and the pivot, as shown in Fig. 1.1. Record the distance b in Table 1.1. Repeat the procedure, with the edge of the load P that is furthest from the pivot at the 15.0 cm, 20.0 cm, 25.0 cm and 30.0 cm marks. Record all the readings in Table 1.1. Table 1.1 a / cm b / cm [2] (b) Plot a graph of a / cm (y-axis) against b / cm (x-axis). Start both axes at the origin (0,0). [4] (c) Determine the gradient G of the graph. Show clearly on the graph how you obtained the necessary information. G = ........................................................ [2] (d) Determine the intercept C on the y-axis of the graph. This is the value of a when b = 0. C = ........................................................ [1] (e) Measure the width w of the load P. w = ........................................................ [1] (f) Suggest one practical reason why it is difficult to obtain accurate values for a and b. ................................................................................................................................................... ............................................................................................................................................. [1] [Total: 11]
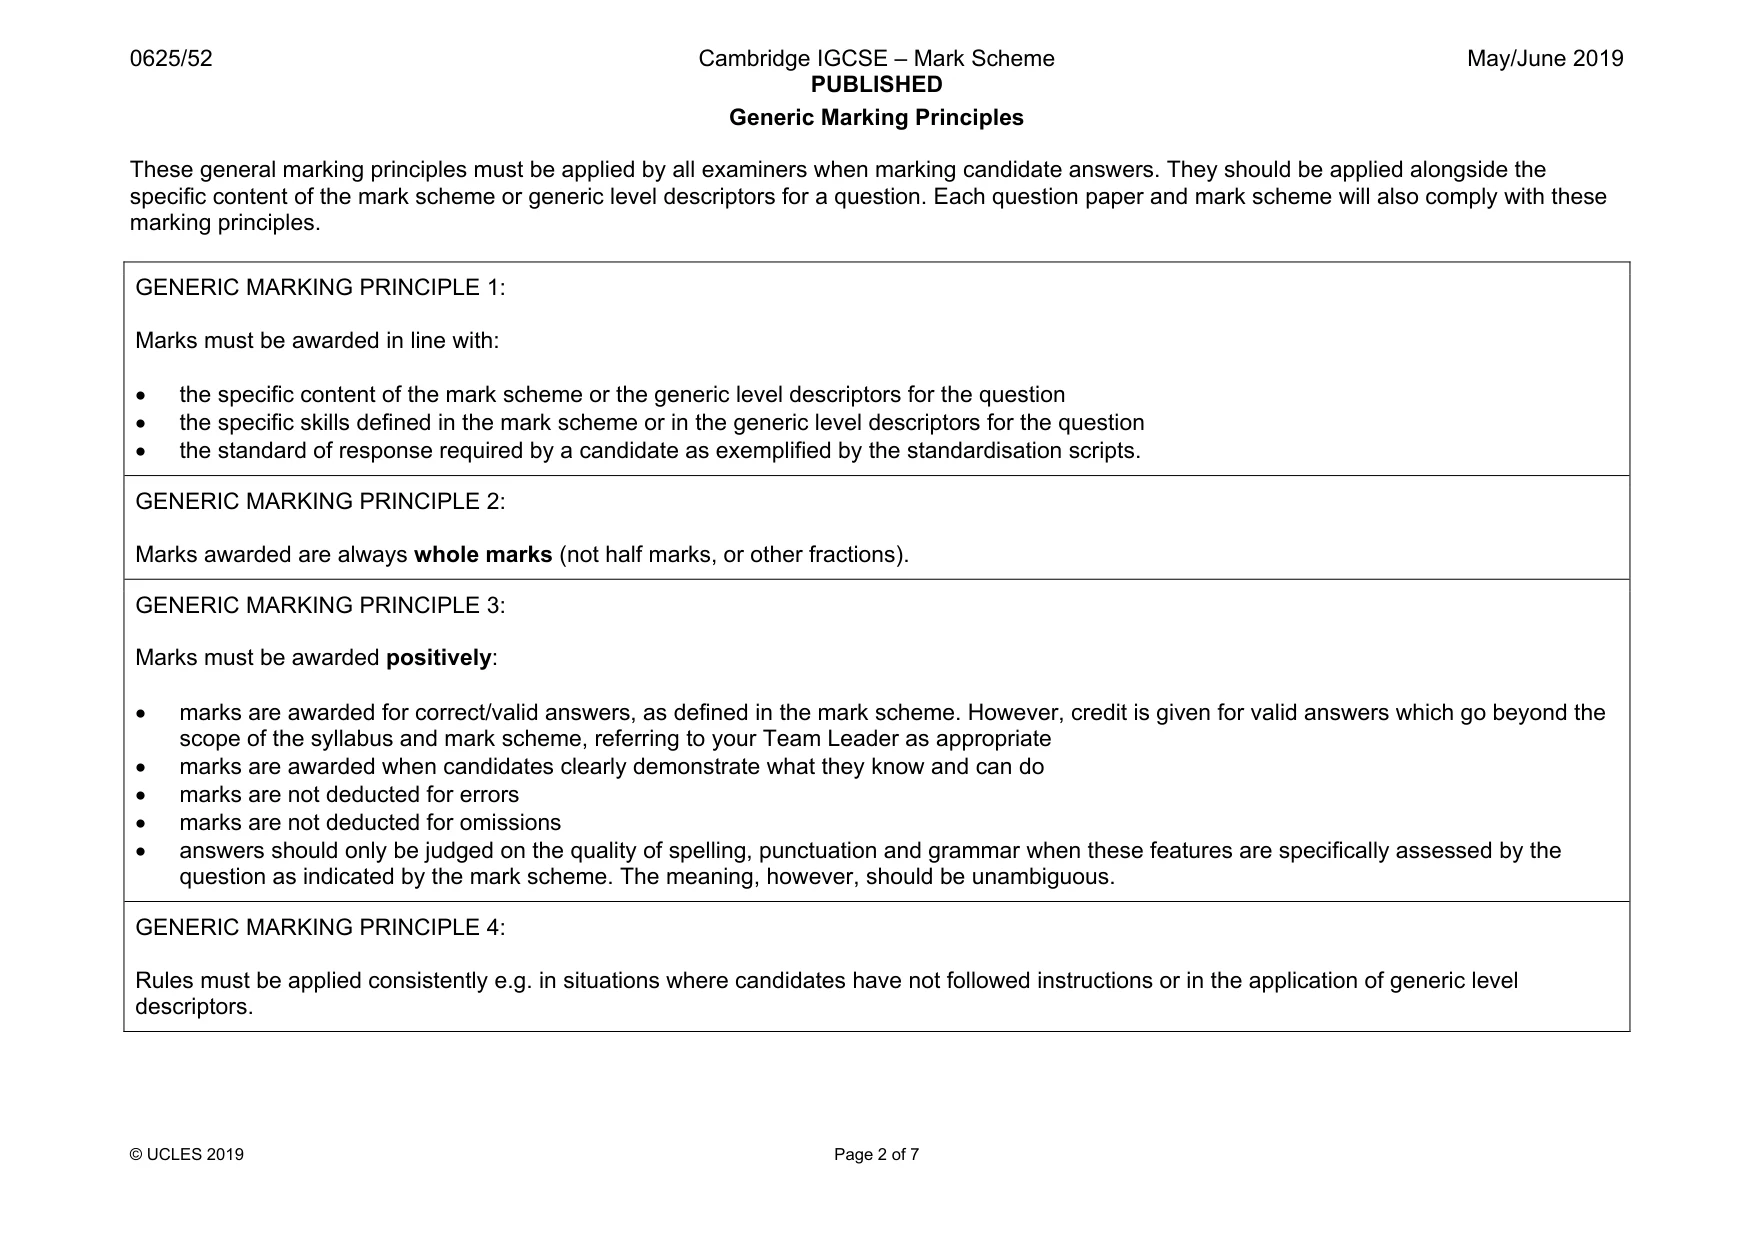
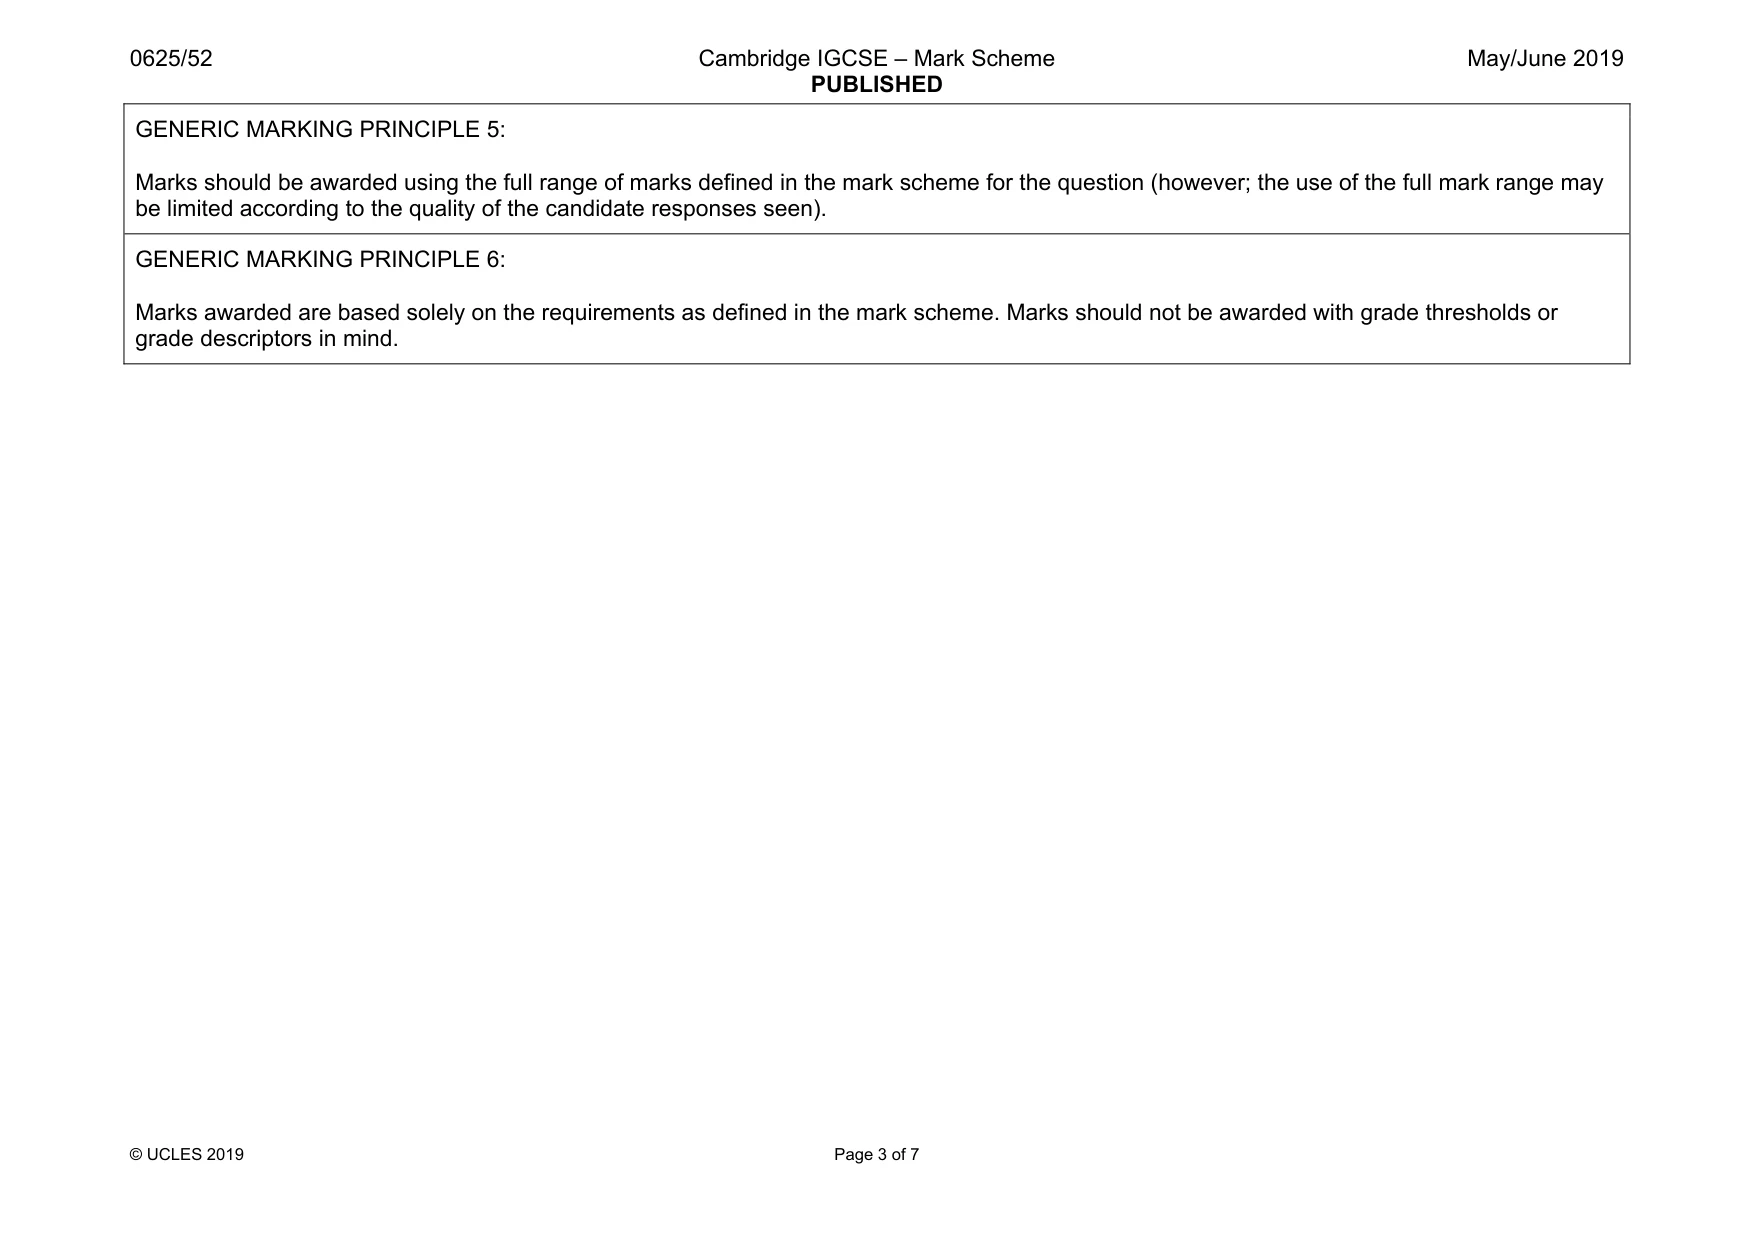
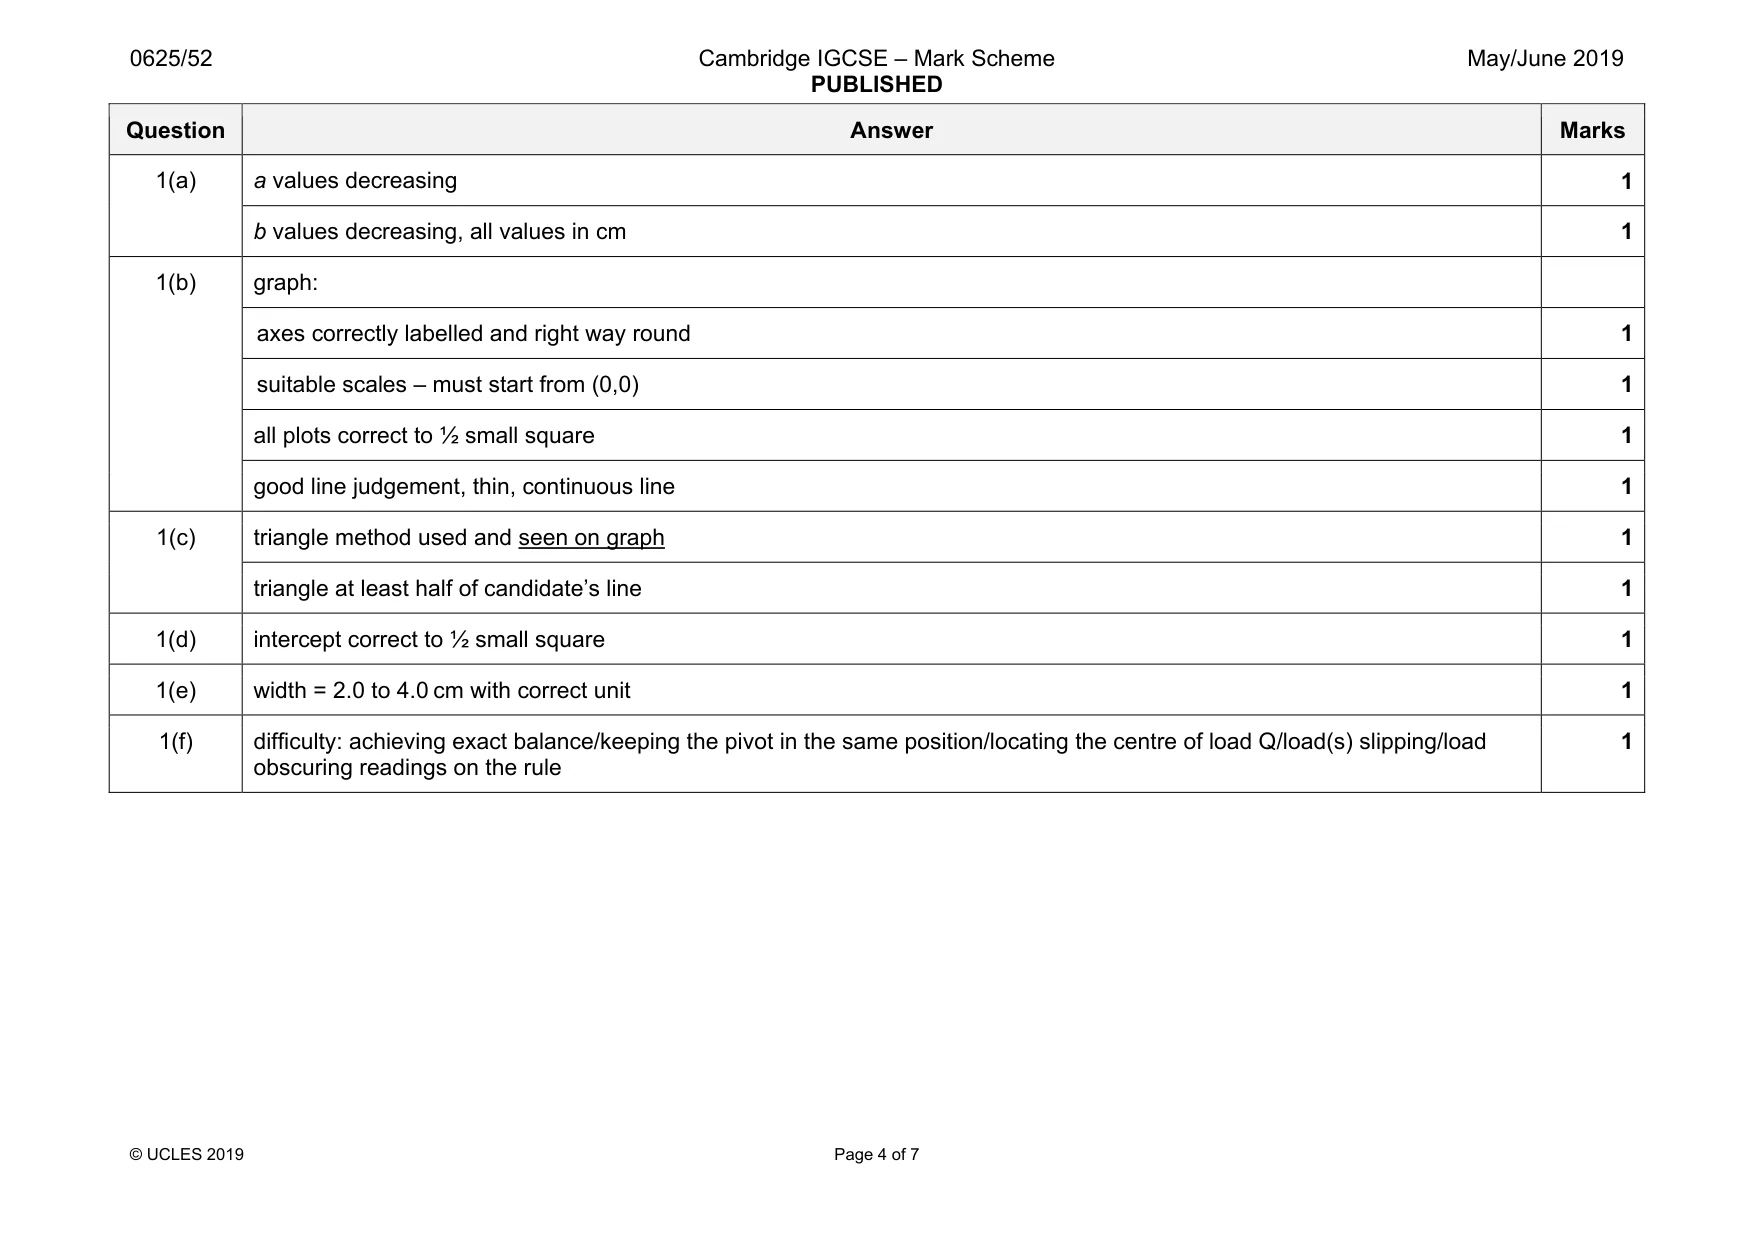
Mark scheme: 1(a) a values decreasing 1 b values decreasing, all values in cm 1 1(b) graph: axes correctly labelled and right way round 1 suitable scales – must start from (0,0) 1 all plots correct to ½ small square 1 good line judgement, thin, continuous line 1 1(c) triangle method used and seen on graph 1 triangle at least half of candidate’s line 1 1(d) intercept correct to ½ small square 1 1(e) width = 2.0 to 4.0 cm with correct unit 1 1(f) difficulty: achieving exact balance/keeping the pivot in the same position/locating the centre of load Q/load(s) slipping/load obscuring readings on the rule 1
Q2 · In this experiment, you will investigate the rate of cooling of water under different…
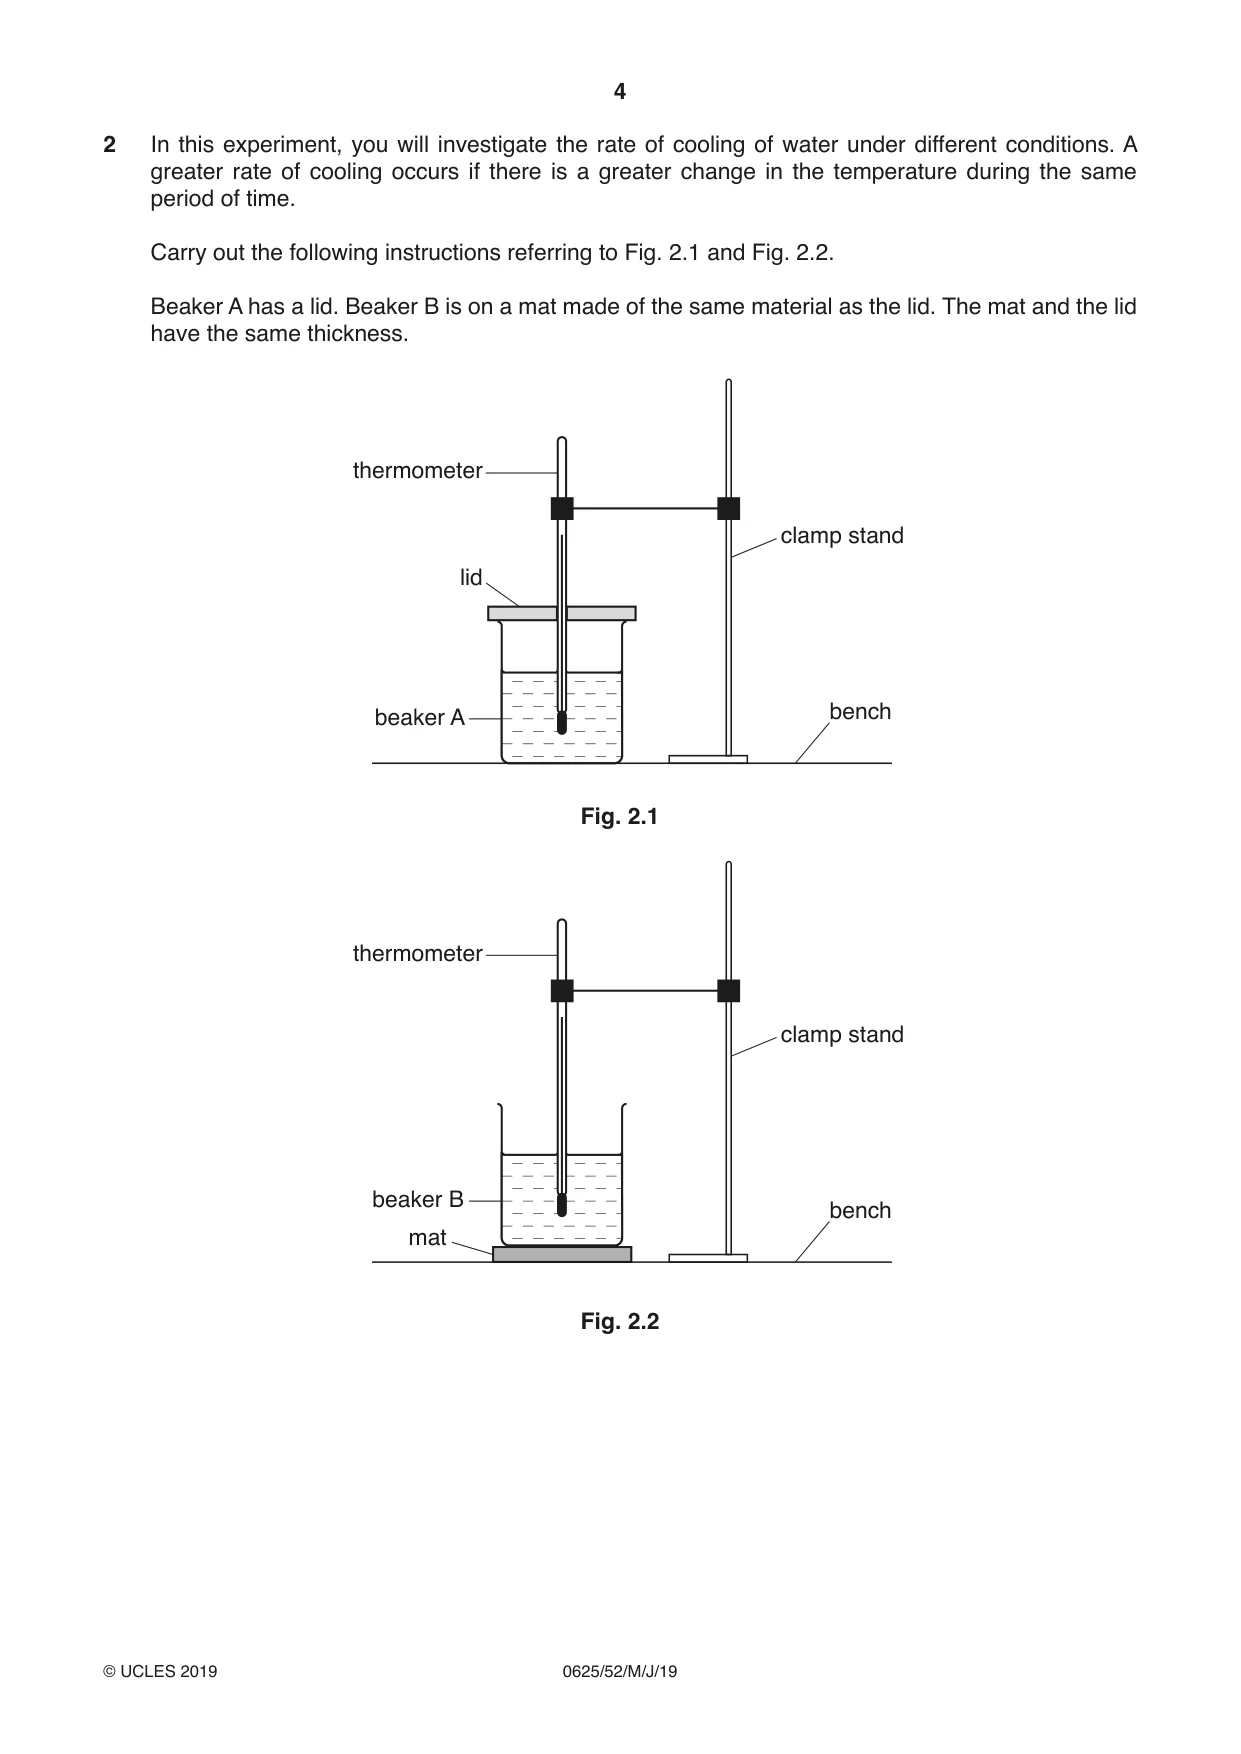
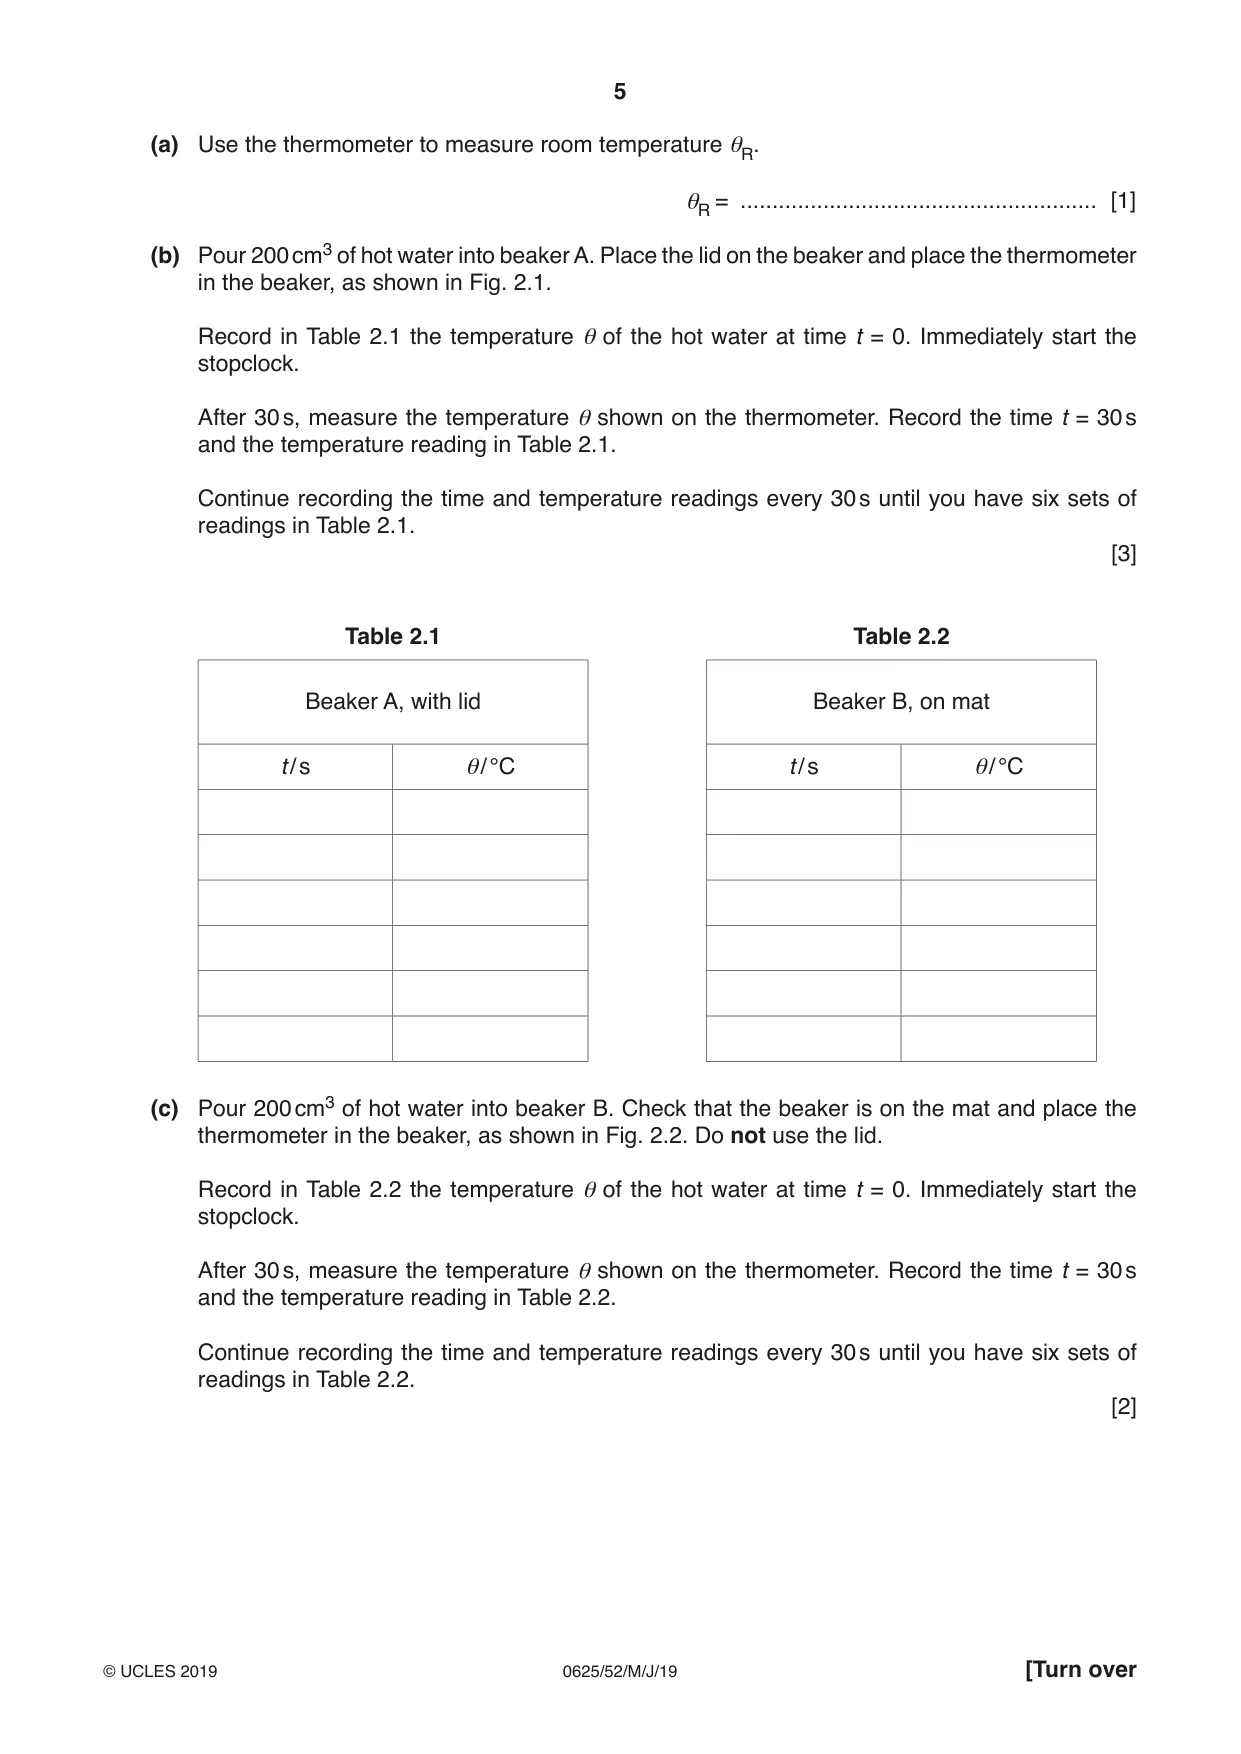
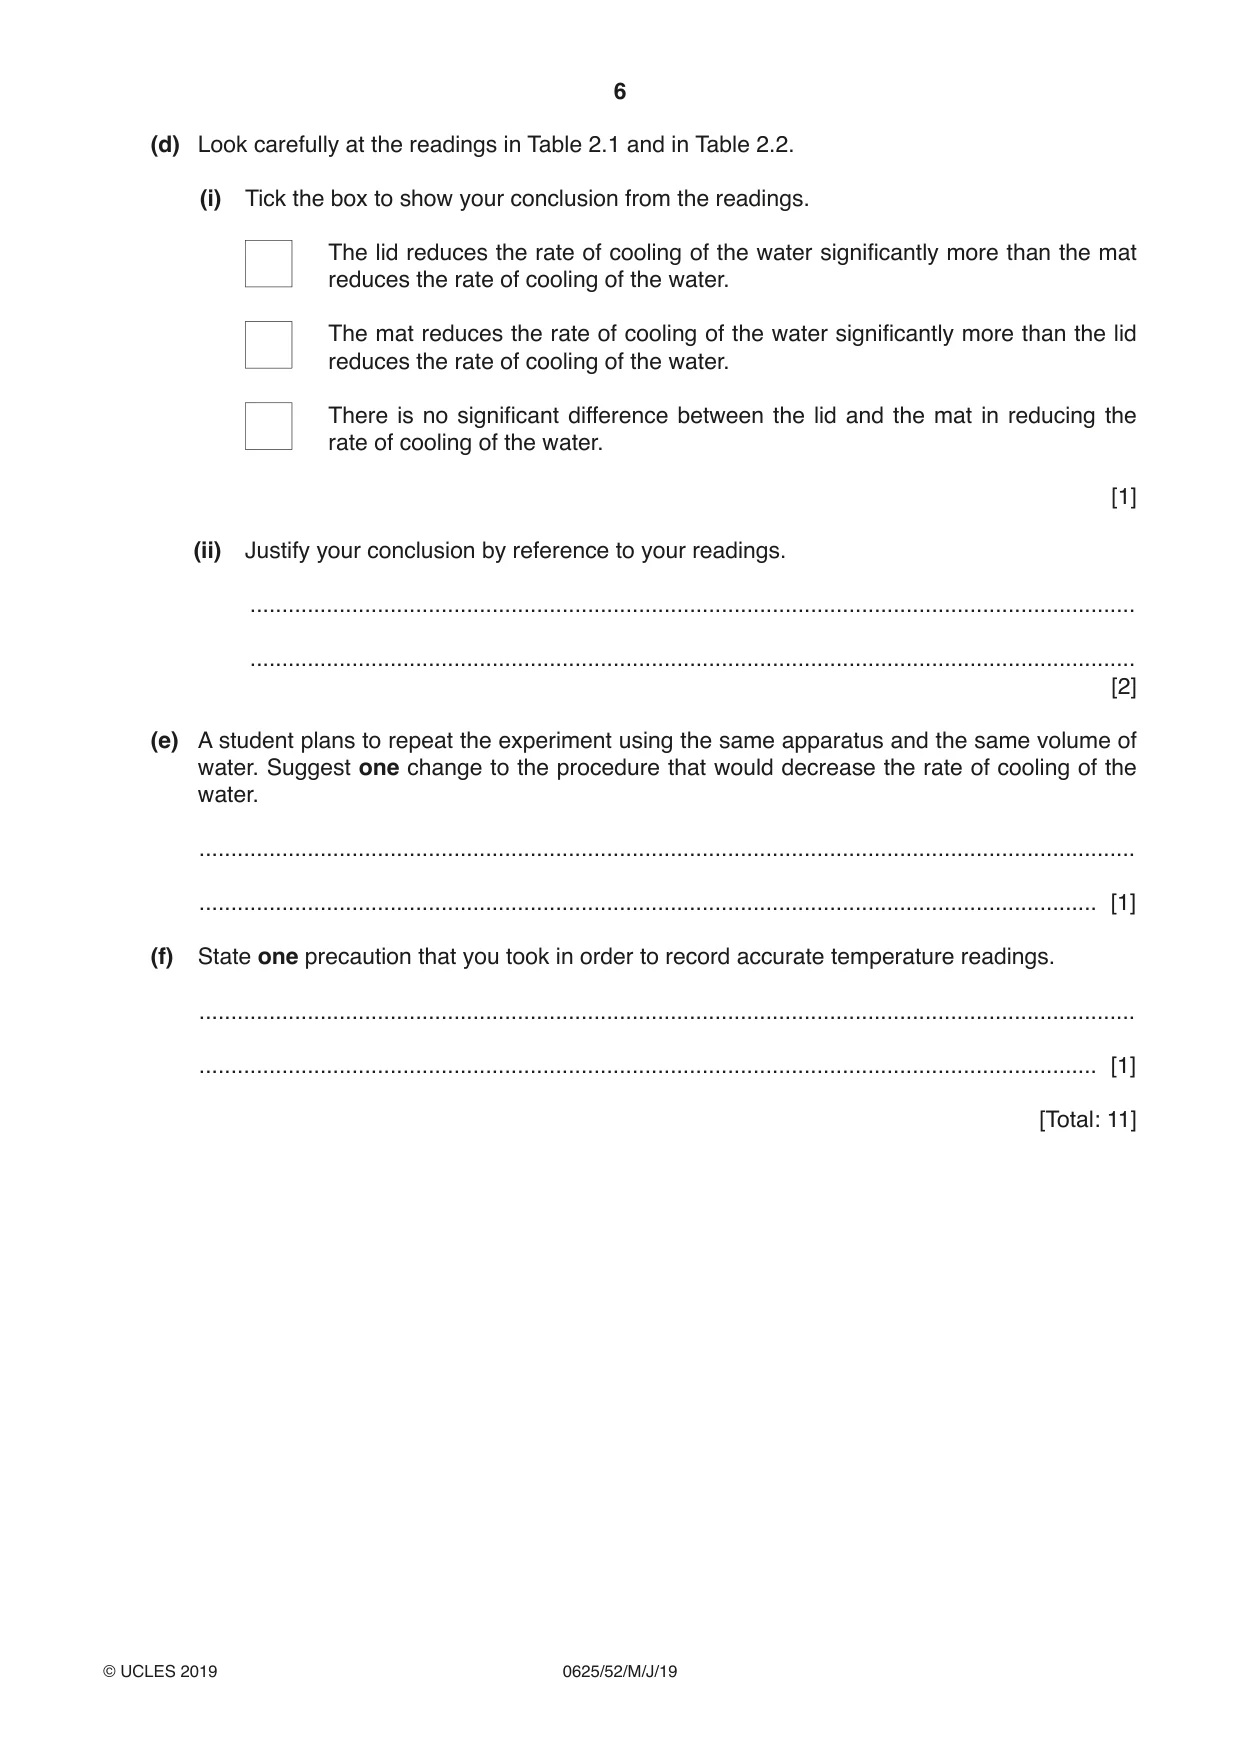
2 In this experiment, you will investigate the rate of cooling of water under different conditions. A greater rate of cooling occurs if there is a greater change in the temperature during the same period of time. Carry out the following instructions referring to Fig. 2.1 and Fig. 2.2. Beaker A has a lid. Beaker B is on a mat made of the same material as the lid. The mat and the lid have the same thickness. thermometer clamp stand lid bench beaker A Fig. 2.1 thermometer clamp stand beaker B bench mat Fig. 2.2 (a) Use the thermometer to measure room temperature θR. θR = ........................................................ [1] (b) Pour 200 cm3 of hot water into beaker A. Place the lid on the beaker and place the thermometer in the beaker, as shown in Fig. 2.1. Record in Table 2.1 the temperature θ of the hot water at time t = 0. Immediately start the stopclock. After 30 s, measure the temperature θ shown on the thermometer. Record the time t = 30 s and the temperature reading in Table 2.1. Continue recording the time and temperature readings every 30 s until you have six sets of readings in Table 2.1. [3] Table 2.1 Table 2.2 Beaker A, with lid Beaker B, on mat t / s θ / °C t / s θ / °C (c) Pour 200 cm3 of hot water into beaker B. Check that the beaker is on the mat and place the thermometer in the beaker, as shown in Fig. 2.2. Do not use the lid. Record in Table 2.2 the temperature θ of the hot water at time t = 0. Immediately start the stopclock. After 30 s, measure the temperature θ shown on the thermometer. Record the time t = 30 s and the temperature reading in Table 2.2. Continue recording the time and temperature readings every 30 s until you have six sets of readings in Table 2.2. [2] (d) Look carefully at the readings in Table 2.1 and in Table 2.2. (i) Tick the box to show your conclusion from the readings. The lid reduces the rate of cooling of the water significantly more than the mat reduces the rate of cooling of the water. The mat reduces the rate of cooling of the water significantly more than the lid reduces the rate of cooling of the water. There is no significant difference between the lid and the mat in reducing the rate of cooling of the water. [1] (ii) Justify your conclusion by reference to your readings. ........................................................................................................................................... ........................................................................................................................................... [2] (e) A student plans to repeat the experiment using the same apparatus and the same volume of water. Suggest one change to the procedure that would decrease the rate of cooling of the water. ................................................................................................................................................... ............................................................................................................................................. [1] (f) State one precaution that you took in order to record accurate temperature readings. ................................................................................................................................................... ............................................................................................................................................. [1] [Total: 11]
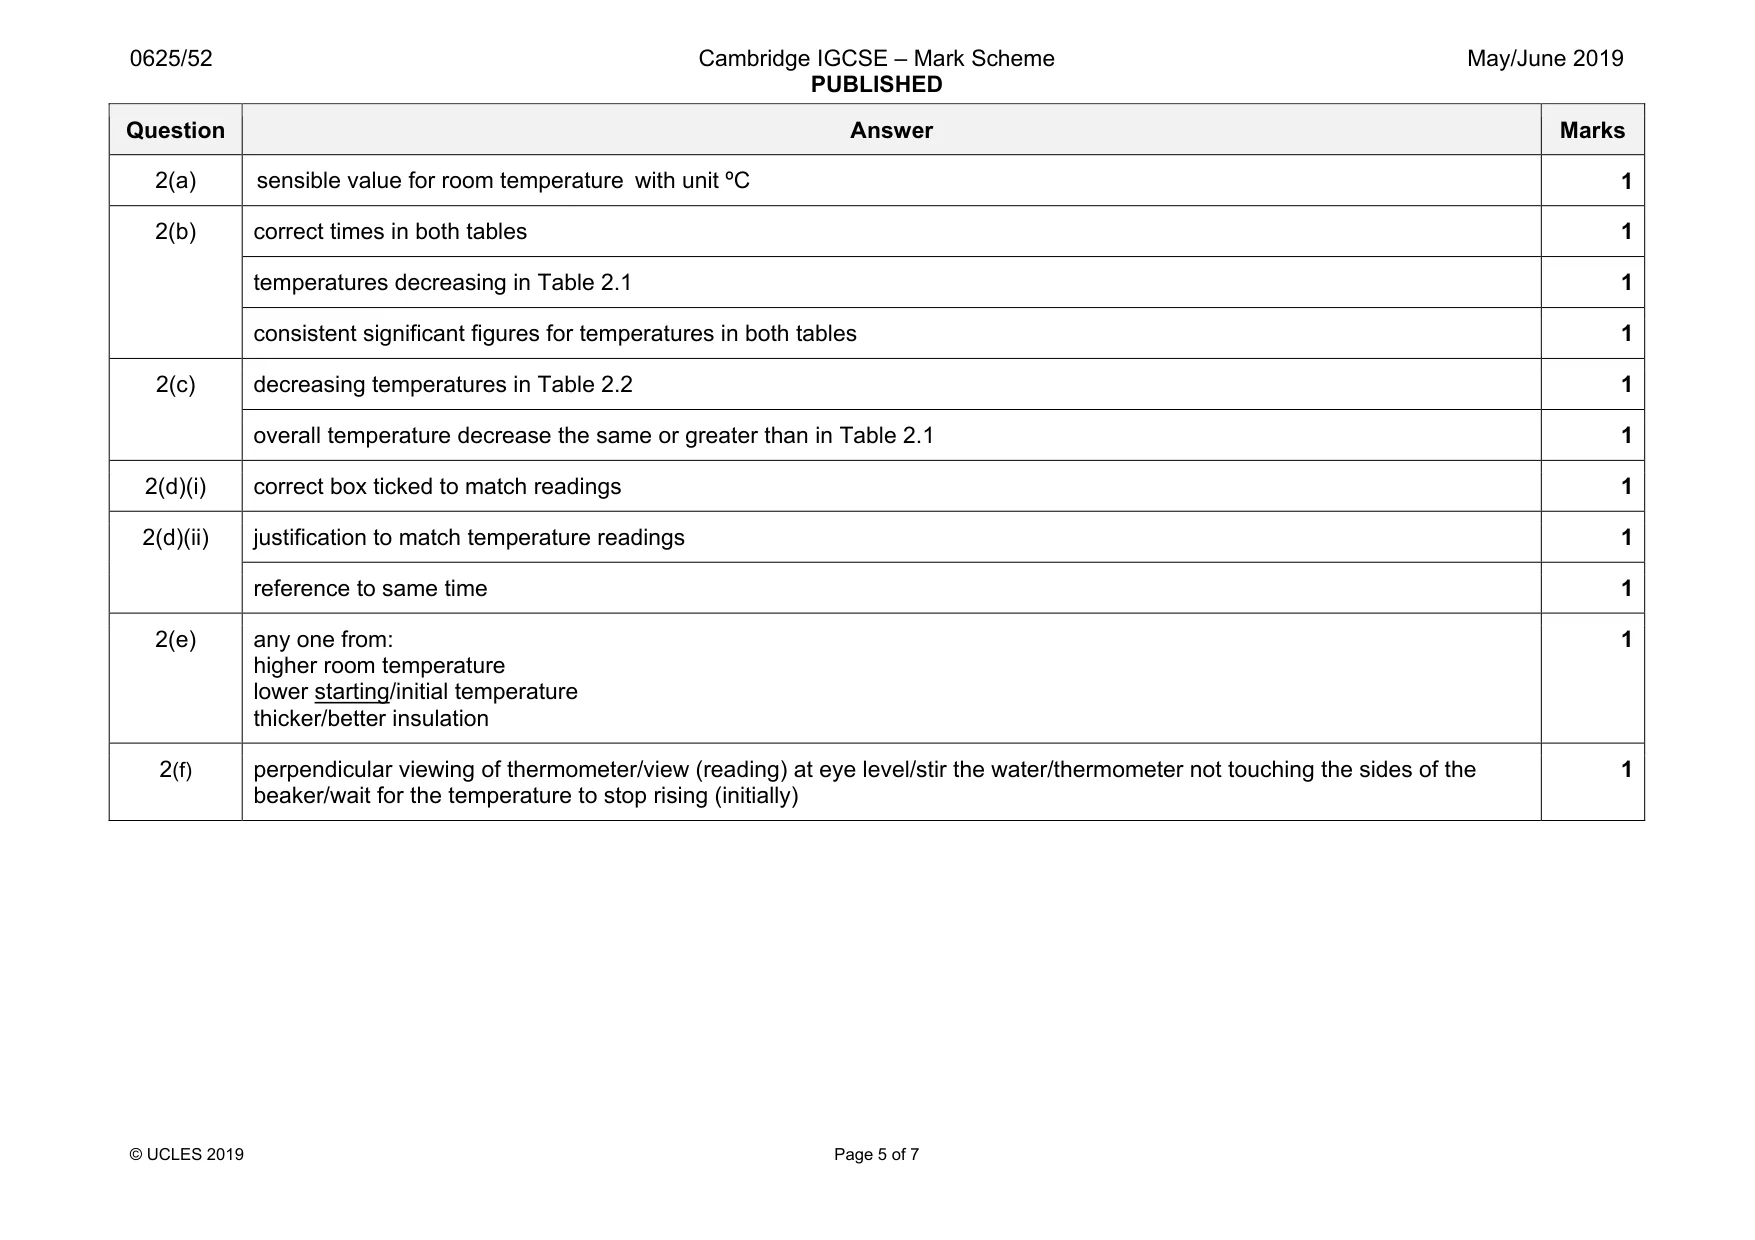
Mark scheme: 2(a) sensible value for room temperature with unit ºC 1 2(b) correct times in both tables 1 temperatures decreasing in Table 2.1 1 consistent significant figures for temperatures in both tables 1 2(c) decreasing temperatures in Table 2.2 1 overall temperature decrease the same or greater than in Table 2.1 1 2(d)(i) correct box ticked to match readings 1 2(d)(ii) justification to match temperature readings 1 reference to same time 1 2(e) any one from: higher room temperature lower starting/initial temperature thicker/better insulation 1 2(f) perpendicular viewing of thermometer/view (reading) at eye level/stir the water/thermometer not touching the sides of the beaker/wait for the temperature to stop rising (initially) 1
Q3 · In this experiment, you will investigate resistance
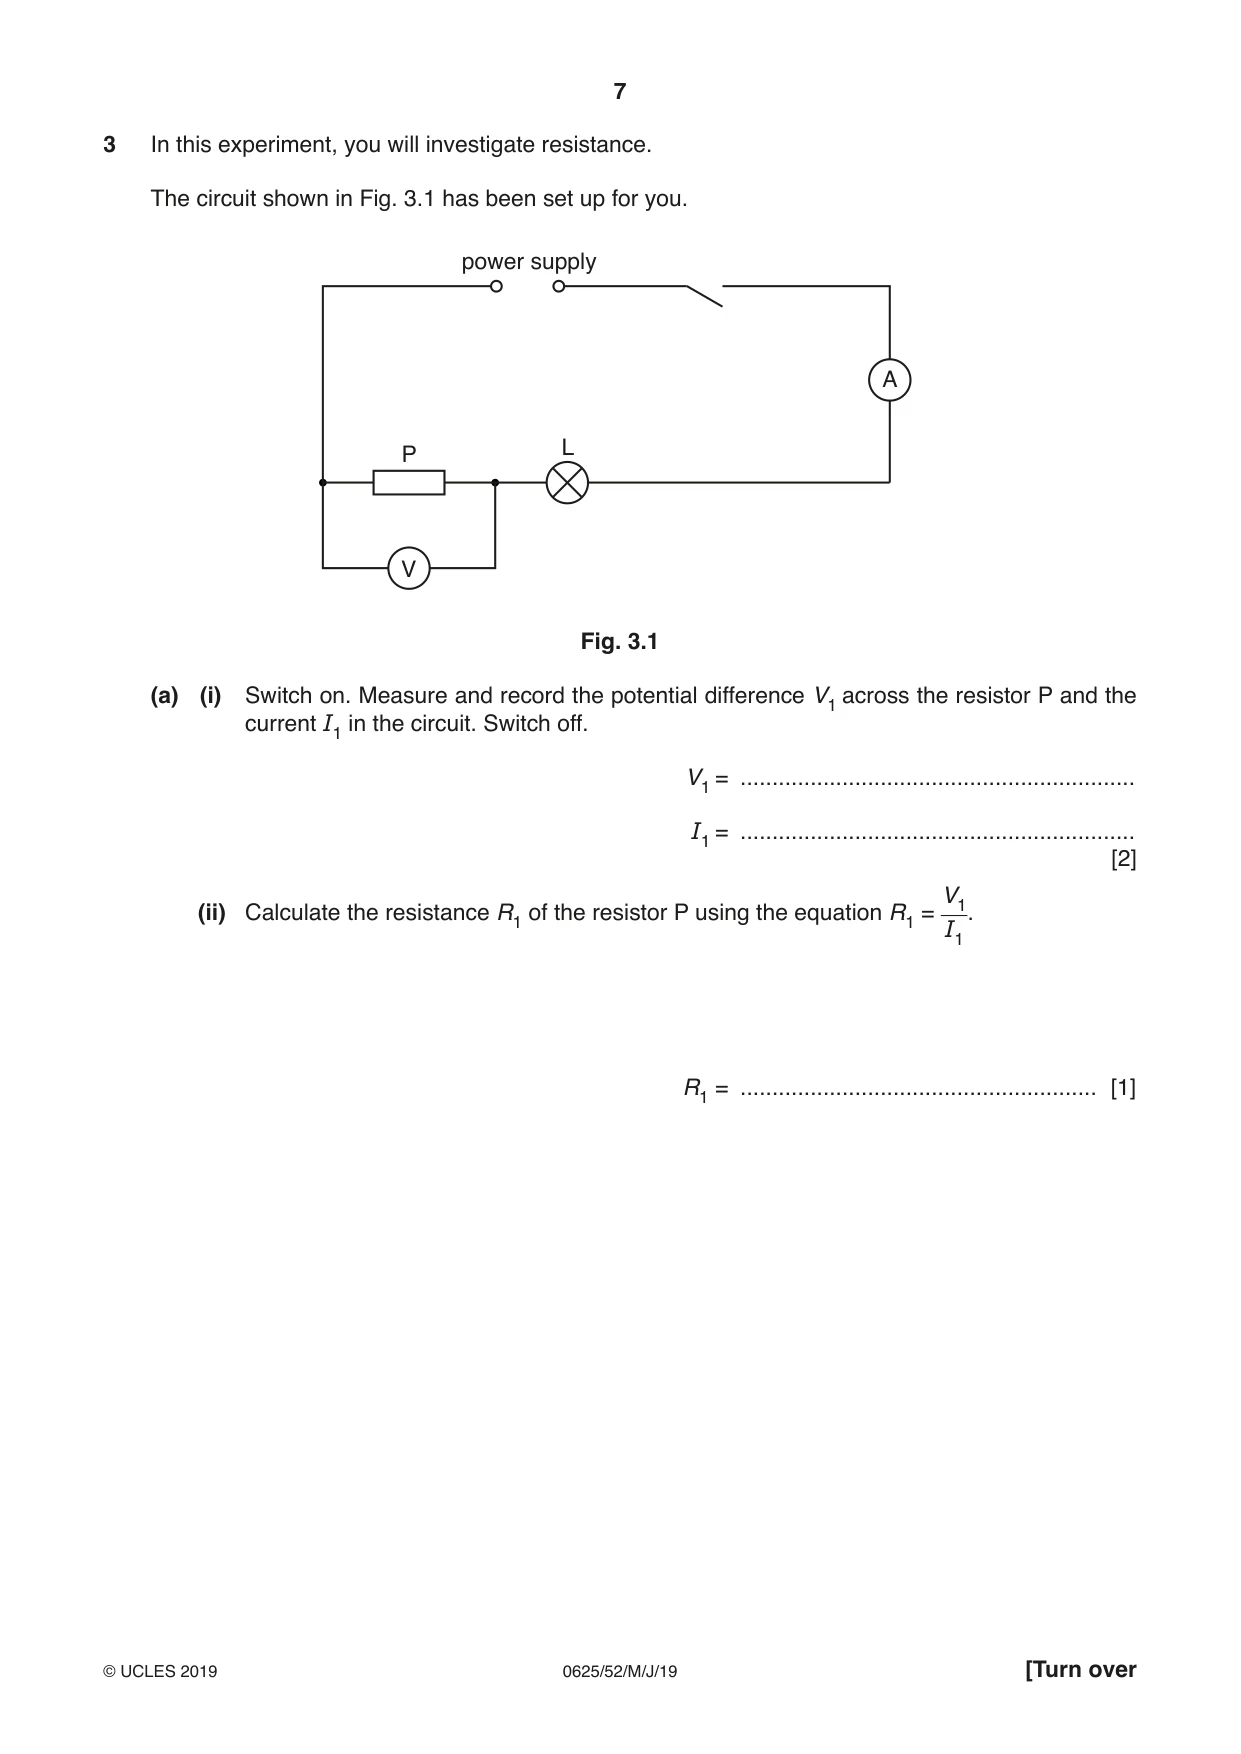
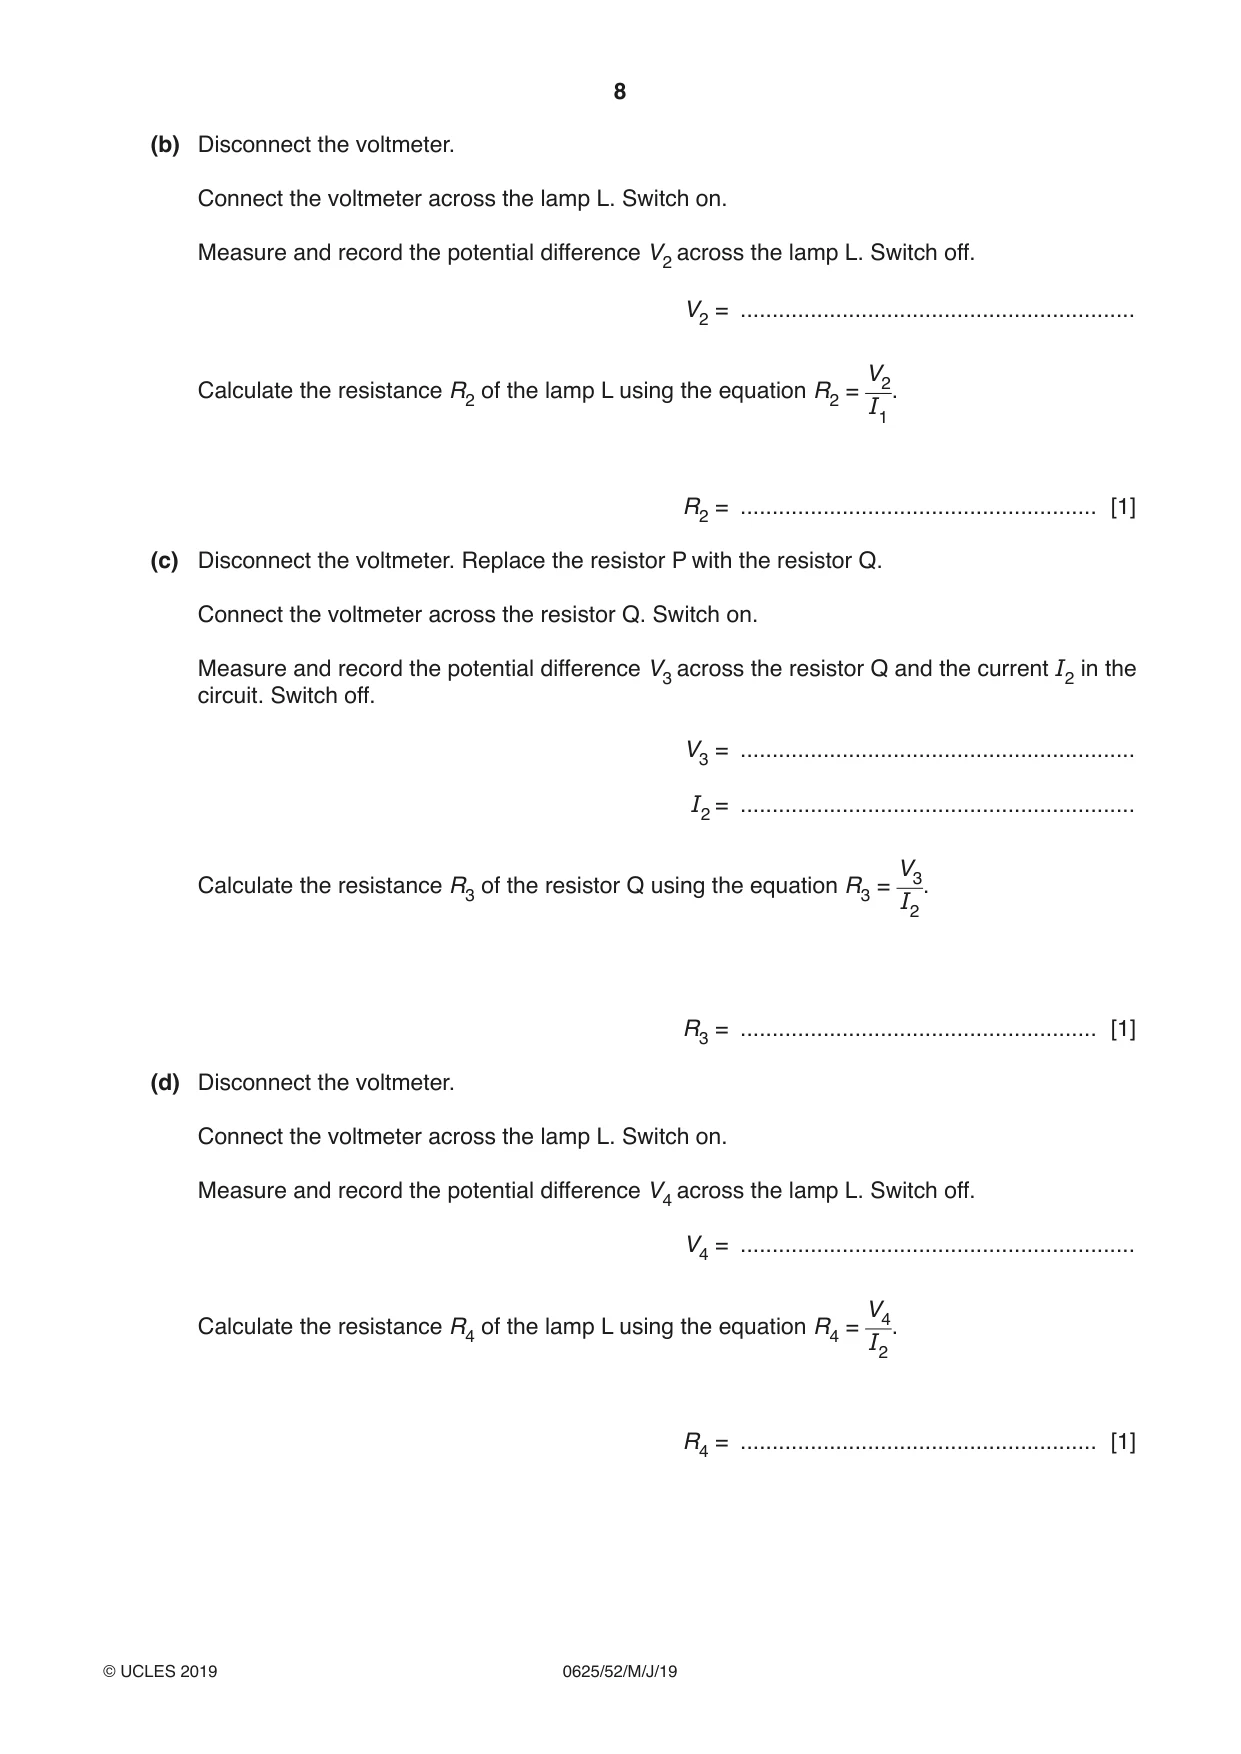
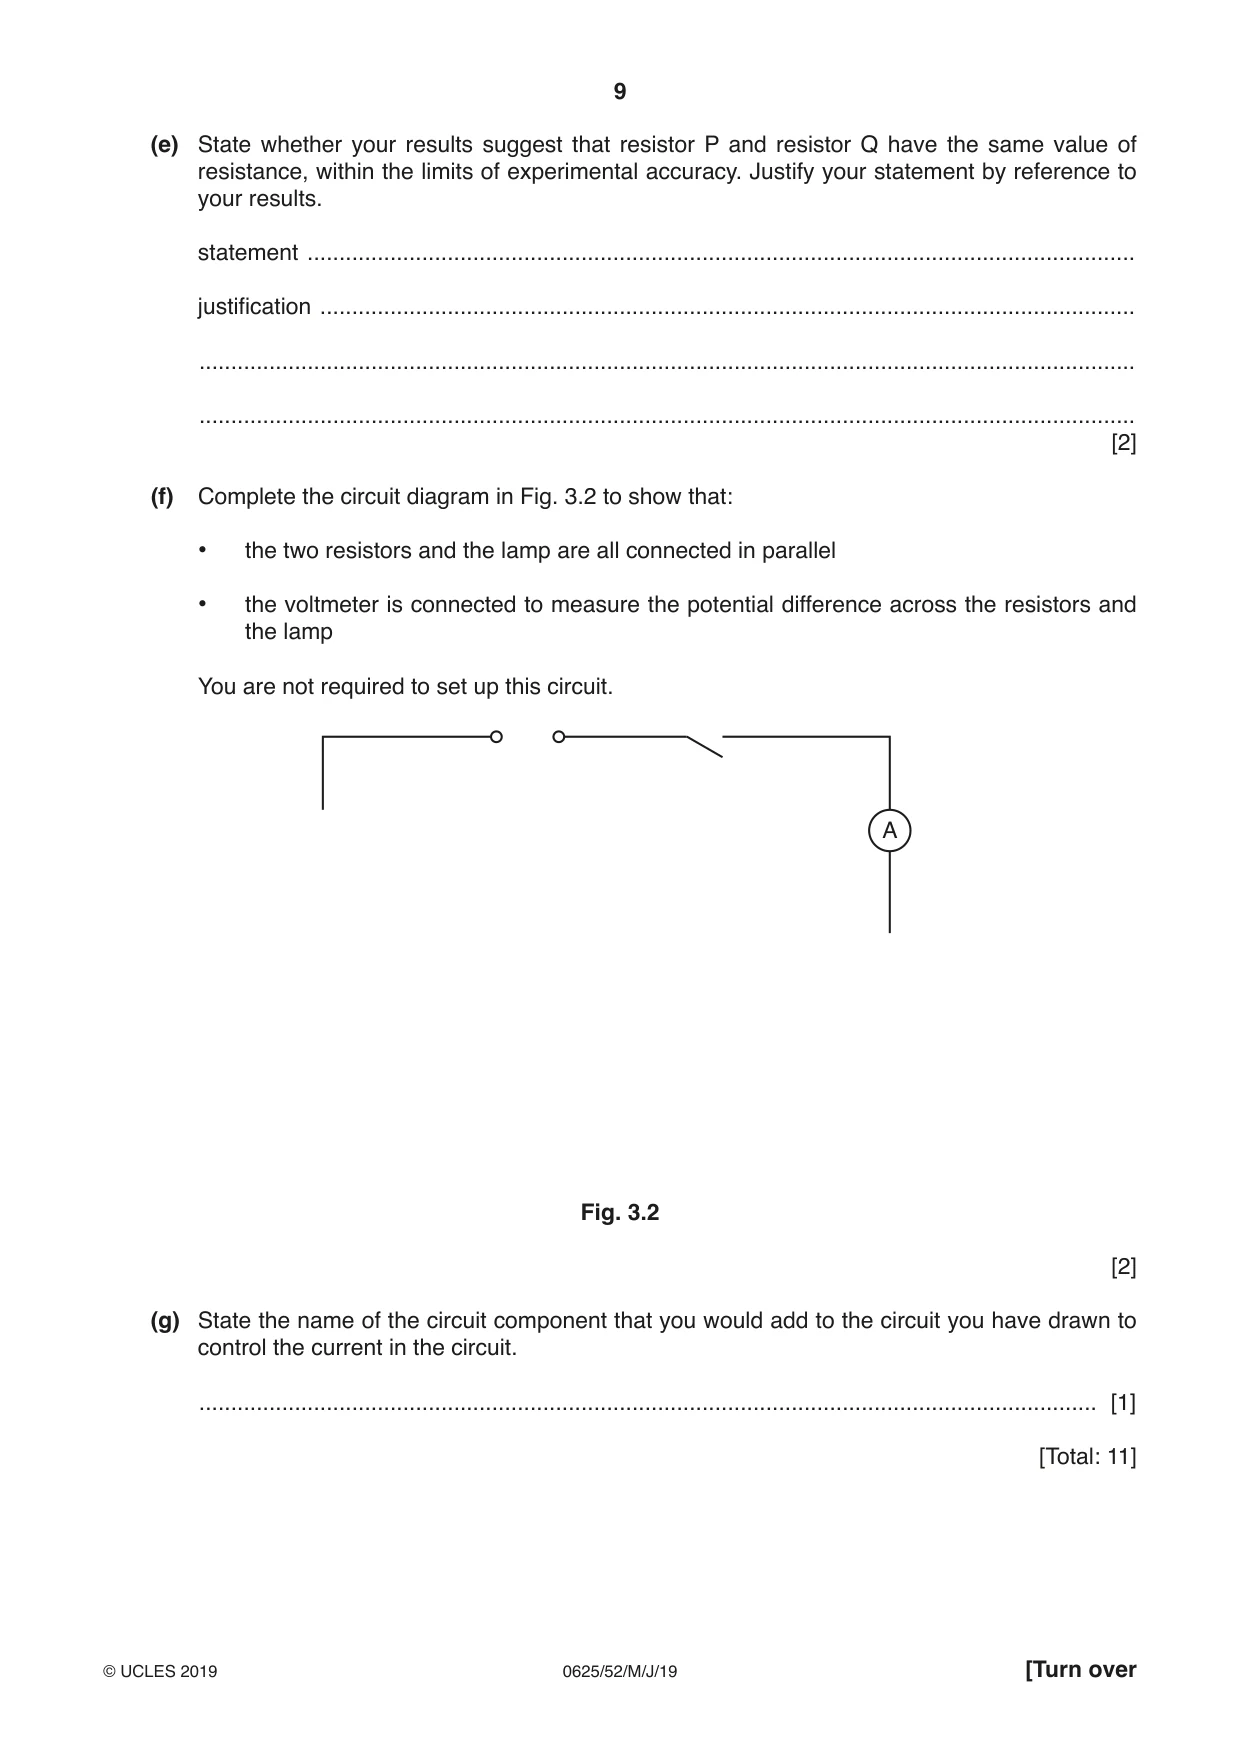
3 In this experiment, you will investigate resistance. The circuit shown in Fig. 3.1 has been set up for you. power supply A L P V Fig. 3.1 (a) (i) Switch on. Measure and record the potential difference V1 across the resistor P and the current I1 in the circuit. Switch off. V1 = .............................................................. I1 = .............................................................. [2] V1 (ii) Calculate the resistance R1 of the resistor P using the equation R1 = . I1 R1 = ........................................................ [1] (b) Disconnect the voltmeter. Connect the voltmeter across the lamp L. Switch on. Measure and record the potential difference V2 across the lamp L. Switch off. V2 = .............................................................. V2 Calculate the resistance R2 of the lamp L using the equation R2 = . I1 R2 = ........................................................ [1] (c) Disconnect the voltmeter. Replace the resistor P with the resistor Q. Connect the voltmeter across the resistor Q. Switch on. Measure and record the potential difference V3 across the resistor Q and the current I2 in the circuit. Switch off. V3 = .............................................................. I2 = .............................................................. V3 Calculate the resistance R3 of the resistor Q using the equation R3 = . I2 R3 = ........................................................ [1] (d) Disconnect the voltmeter. Connect the voltmeter across the lamp L. Switch on. Measure and record the potential difference V4 across the lamp L. Switch off. V4 = .............................................................. V4 Calculate the resistance R4 of the lamp L using the equation R4 = . I2 R4 = ........................................................ [1] (e) State whether your results suggest that resistor P and resistor Q have the same value of resistance, within the limits of experimental accuracy. Justify your statement by reference to your results. statement .................................................................................................................................. justification ................................................................................................................................ ................................................................................................................................................... ................................................................................................................................................... [2] (f) Complete the circuit diagram in Fig. 3.2 to show that: • the two resistors and the lamp are all connected in parallel • the voltmeter is connected to measure the potential difference across the resistors and the lamp You are not required to set up this circuit. A Fig. 3.2 [2] (g) State the name of the circuit component that you would add to the circuit you have drawn to control the current in the circuit. ............................................................................................................................................. [1] [Total: 11]
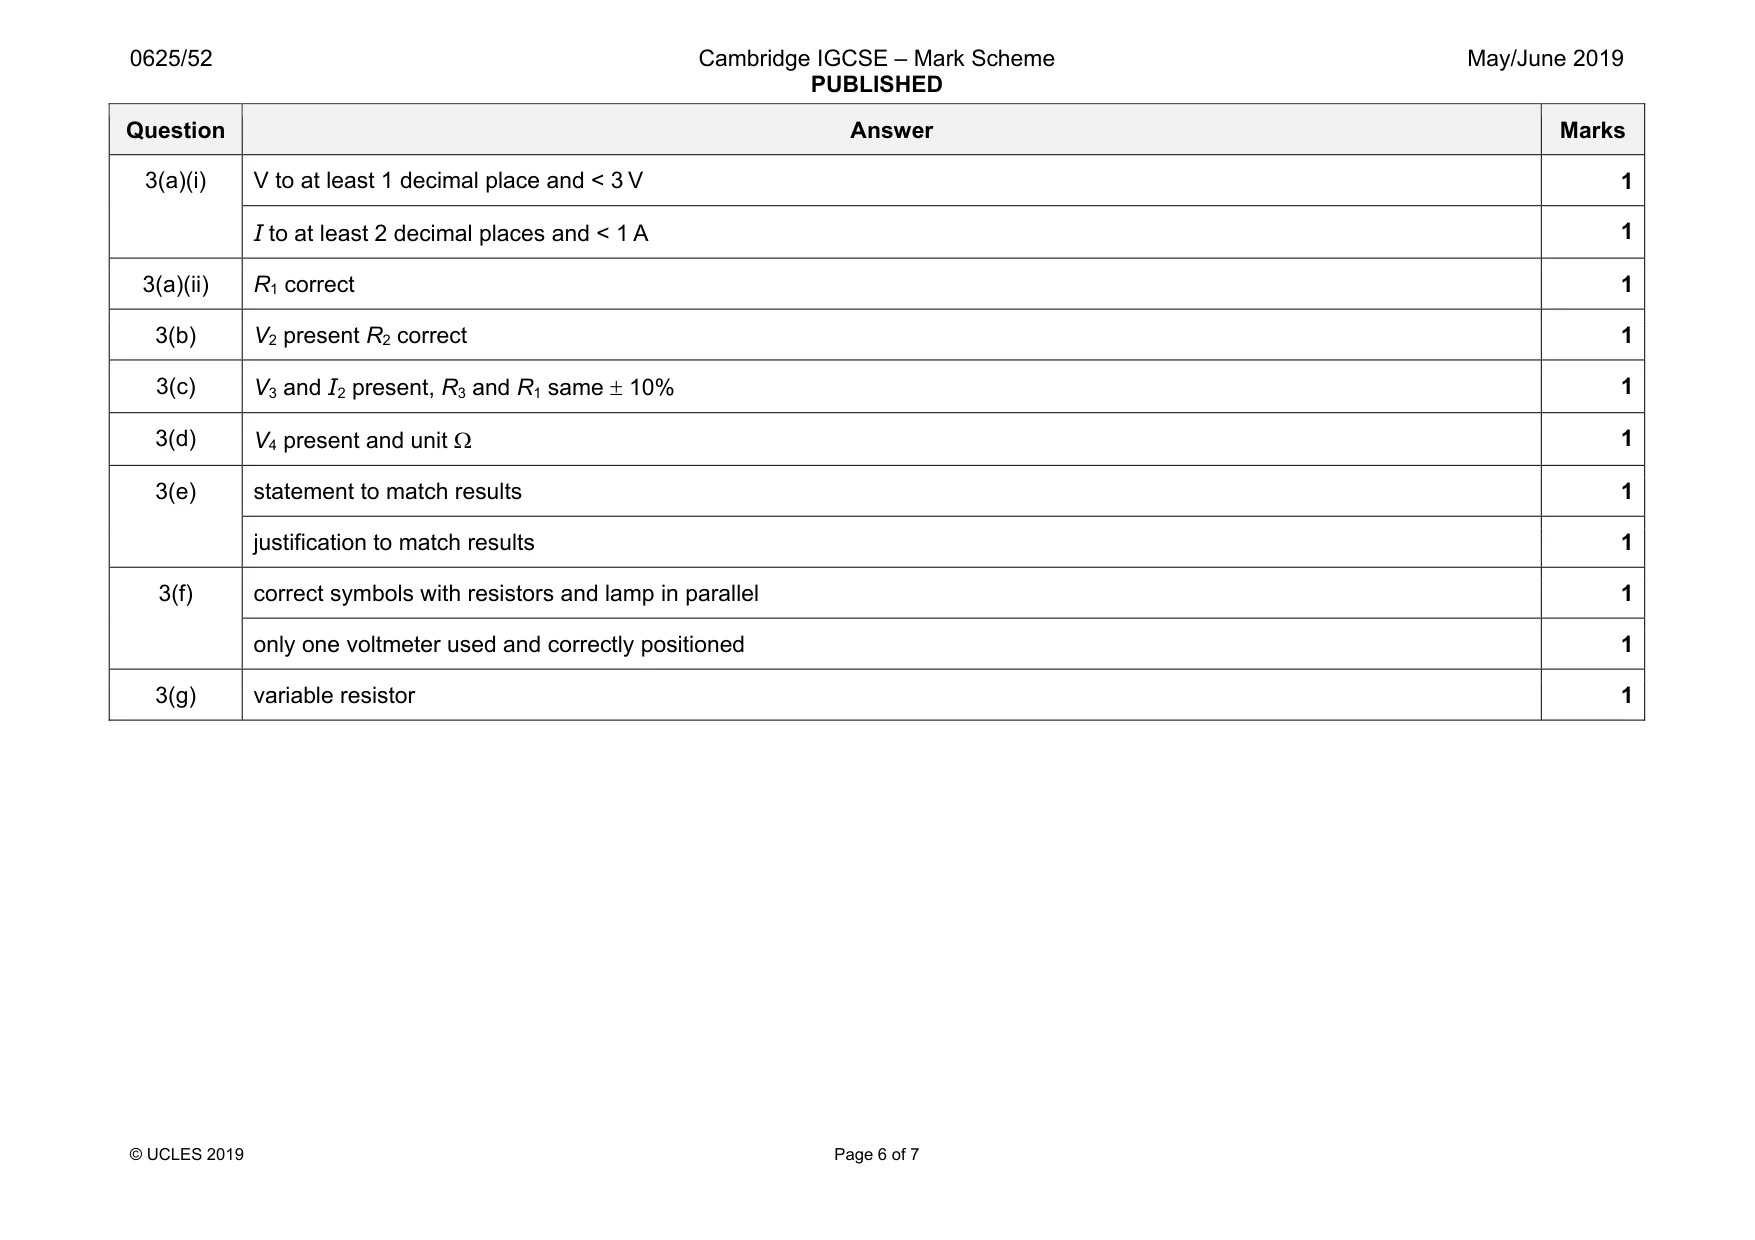
Mark scheme: 3(a)(i) V to at least 1 decimal place and < 3 V 1 I to at least 2 decimal places and < 1 A 1 3(a)(ii) R1 correct 1 3(b) V2 present R2 correct 1 3(c) V3 and I2 present, R3 and R1 same ± 10% 1 3(d) V4 present and unit Ω 1 3(e) statement to match results 1 justification to match results 1 3(f) correct symbols with resistors and lamp in parallel 1 only one voltmeter used and correctly positioned 1 3(g) variable resistor 1
Q4 · A student is investigating the relationship between the thickness of a converging…
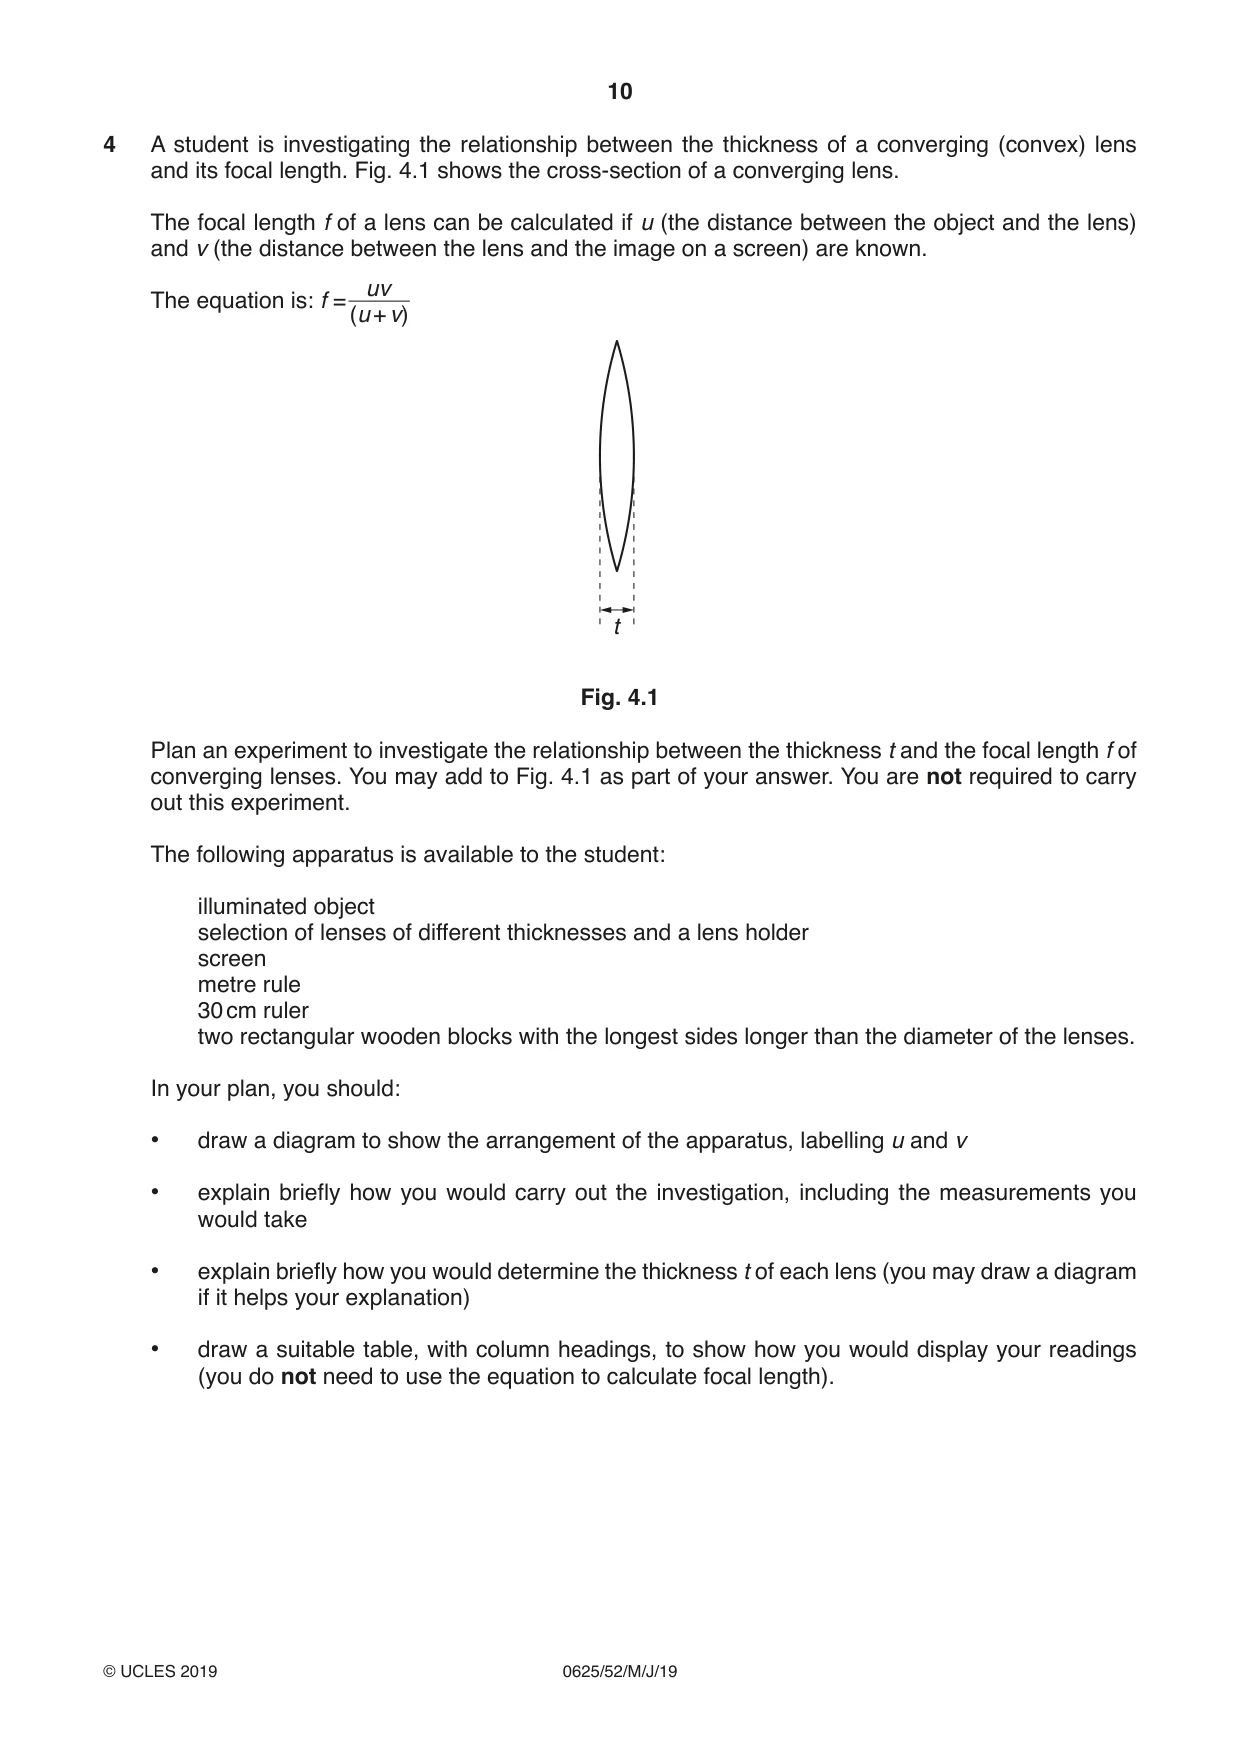
4 A student is investigating the relationship between the thickness of a converging (convex) lens and its focal length. Fig. 4.1 shows the cross-section of a converging lens. The focal length f of a lens can be calculated if u (the distance between the object and the lens) and v (the distance between the lens and the image on a screen) are known. uv The equation is: f =(u + v) t Fig. 4.1 Plan an experiment to investigate the relationship between the thickness t and the focal length f of converging lenses. You may add to Fig. 4.1 as part of your answer. You are not required to carry out this experiment. The following apparatus is available to the student: illuminated object selection of lenses of different thicknesses and a lens holder screen metre rule 30 cm ruler two rectangular wooden blocks with the longest sides longer than the diameter of the lenses. In your plan, you should: • draw a diagram to show the arrangement of the apparatus, labelling u and v • explain briefly how you would carry out the investigation, including the measurements you would take • explain briefly how you would determine the thickness t of each lens (you may draw a diagram if it helps your explanation) • draw a suitable table, with column headings, to show how you would display your readings (you do not need to use the equation to calculate focal length). ................................................................................................................................................... ................................................................................................................................................... ................................................................................................................................................... ................................................................................................................................................... ................................................................................................................................................... ................................................................................................................................................... ................................................................................................................................................... ................................................................................................................................................... ................................................................................................................................................... ................................................................................................................................................... ................................................................................................................................................... ................................................................................................................................................... ................................................................................................................................................... ................................................................................................................................................... ................................................................................................................................................... ................................................................................................................................................... ................................................................................................................................................... ................................................................................................................................................... ................................................................................................................................................... ................................................................................................................................................... ................................................................................................................................................... ................................................................................................................................................... ................................................................................................................................................... ................................................................................................................................................... ................................................................................................................................................... ................................................................................................................................................... [7] [Total: 7]
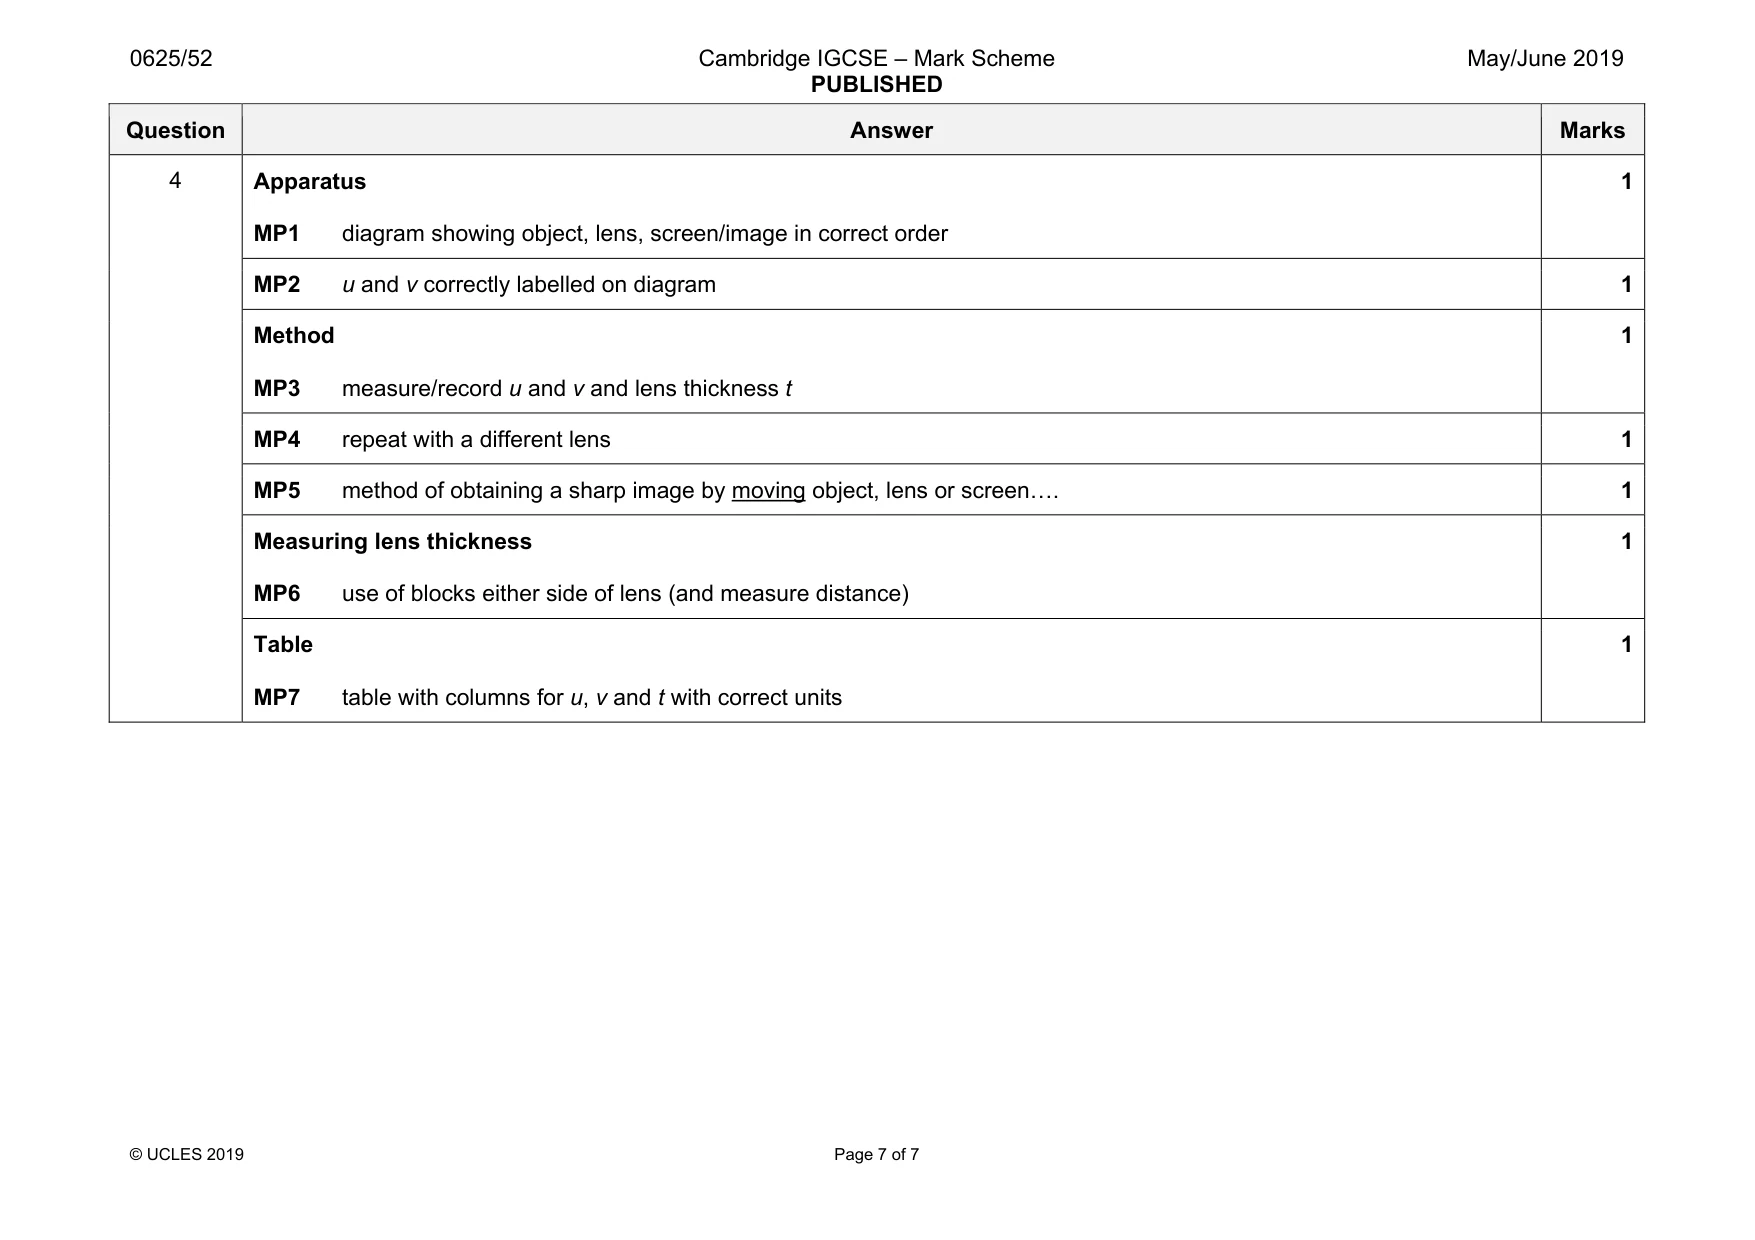
Mark scheme: 4 Apparatus MP1 diagram showing object, lens, screen/image in correct order 1 MP2 u and v correctly labelled on diagram 1 Method MP3 measure/record u and v and lens thickness t 1 MP4 repeat with a different lens 1 MP5 method of obtaining a sharp image by moving object, lens or screen«. 1 Measuring lens thickness MP6 use of blocks either side of lens (and measure distance) 1 Table MP7 table with columns for u, v and t with correct units 1
What was in this paper
The subtopics covered by these 4 questions, and how many questions each got. Open one in a new tab to see every Cambridge question on it.
What you needed in this session
Cambridge’s own grade thresholds for 2019 May/June, Paper 5 · Variant 2. A higher threshold means an easier paper — the bar moves with how the cohort did.