Cambridge IGCSE Physics 0625 — 2024 Oct/Nov Paper 5 · Variant 2
0625/52/O/N/24 · 4 questions · 40 marks · ≈45 min
The question paper and its mark scheme, free to read here and free to download. This is Cambridge’s own paper, exactly as it was sat.
Question paper12 pages

Mark scheme8 pages
Answers below. Sit the paper first if you are practising.
Questions as text
Q1 · In this experiment, you will take measurements of a stack of glass microscope slides to…
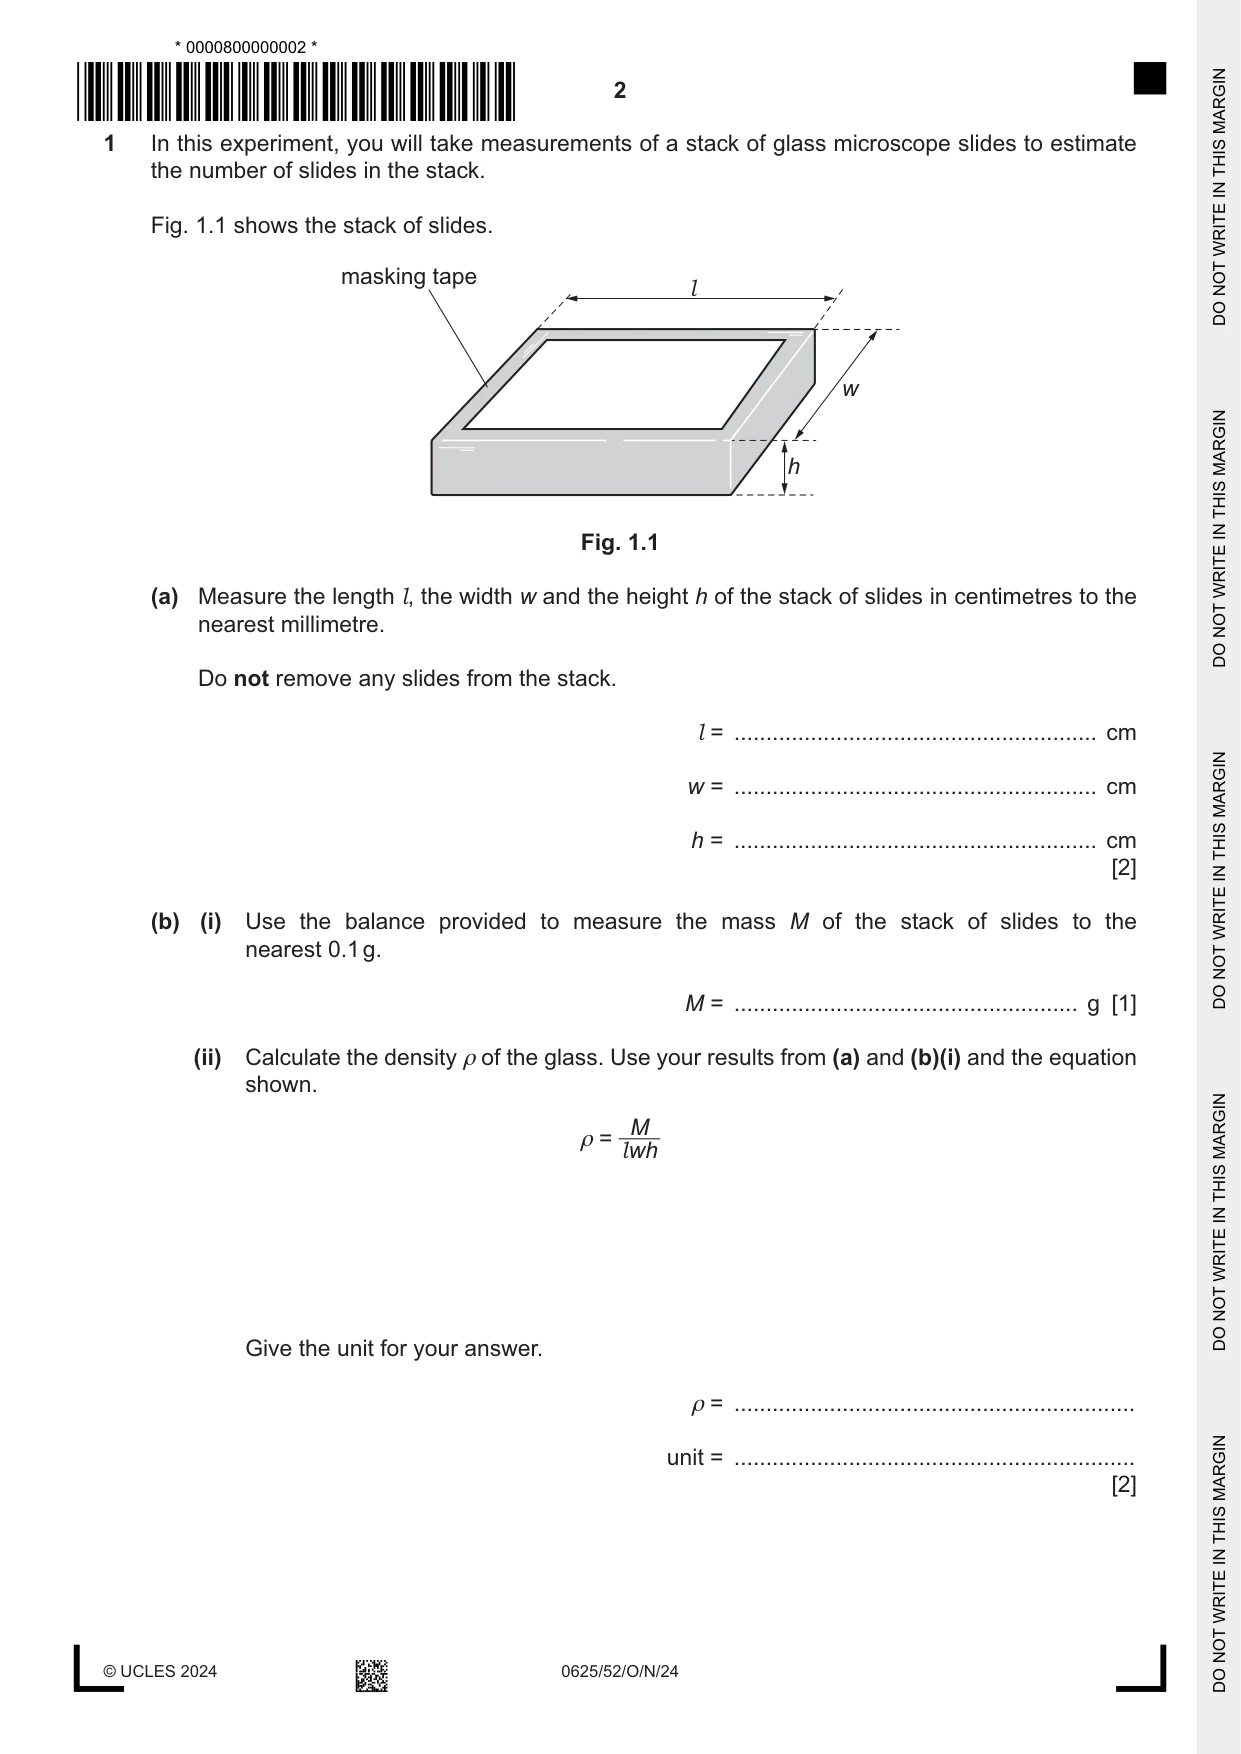
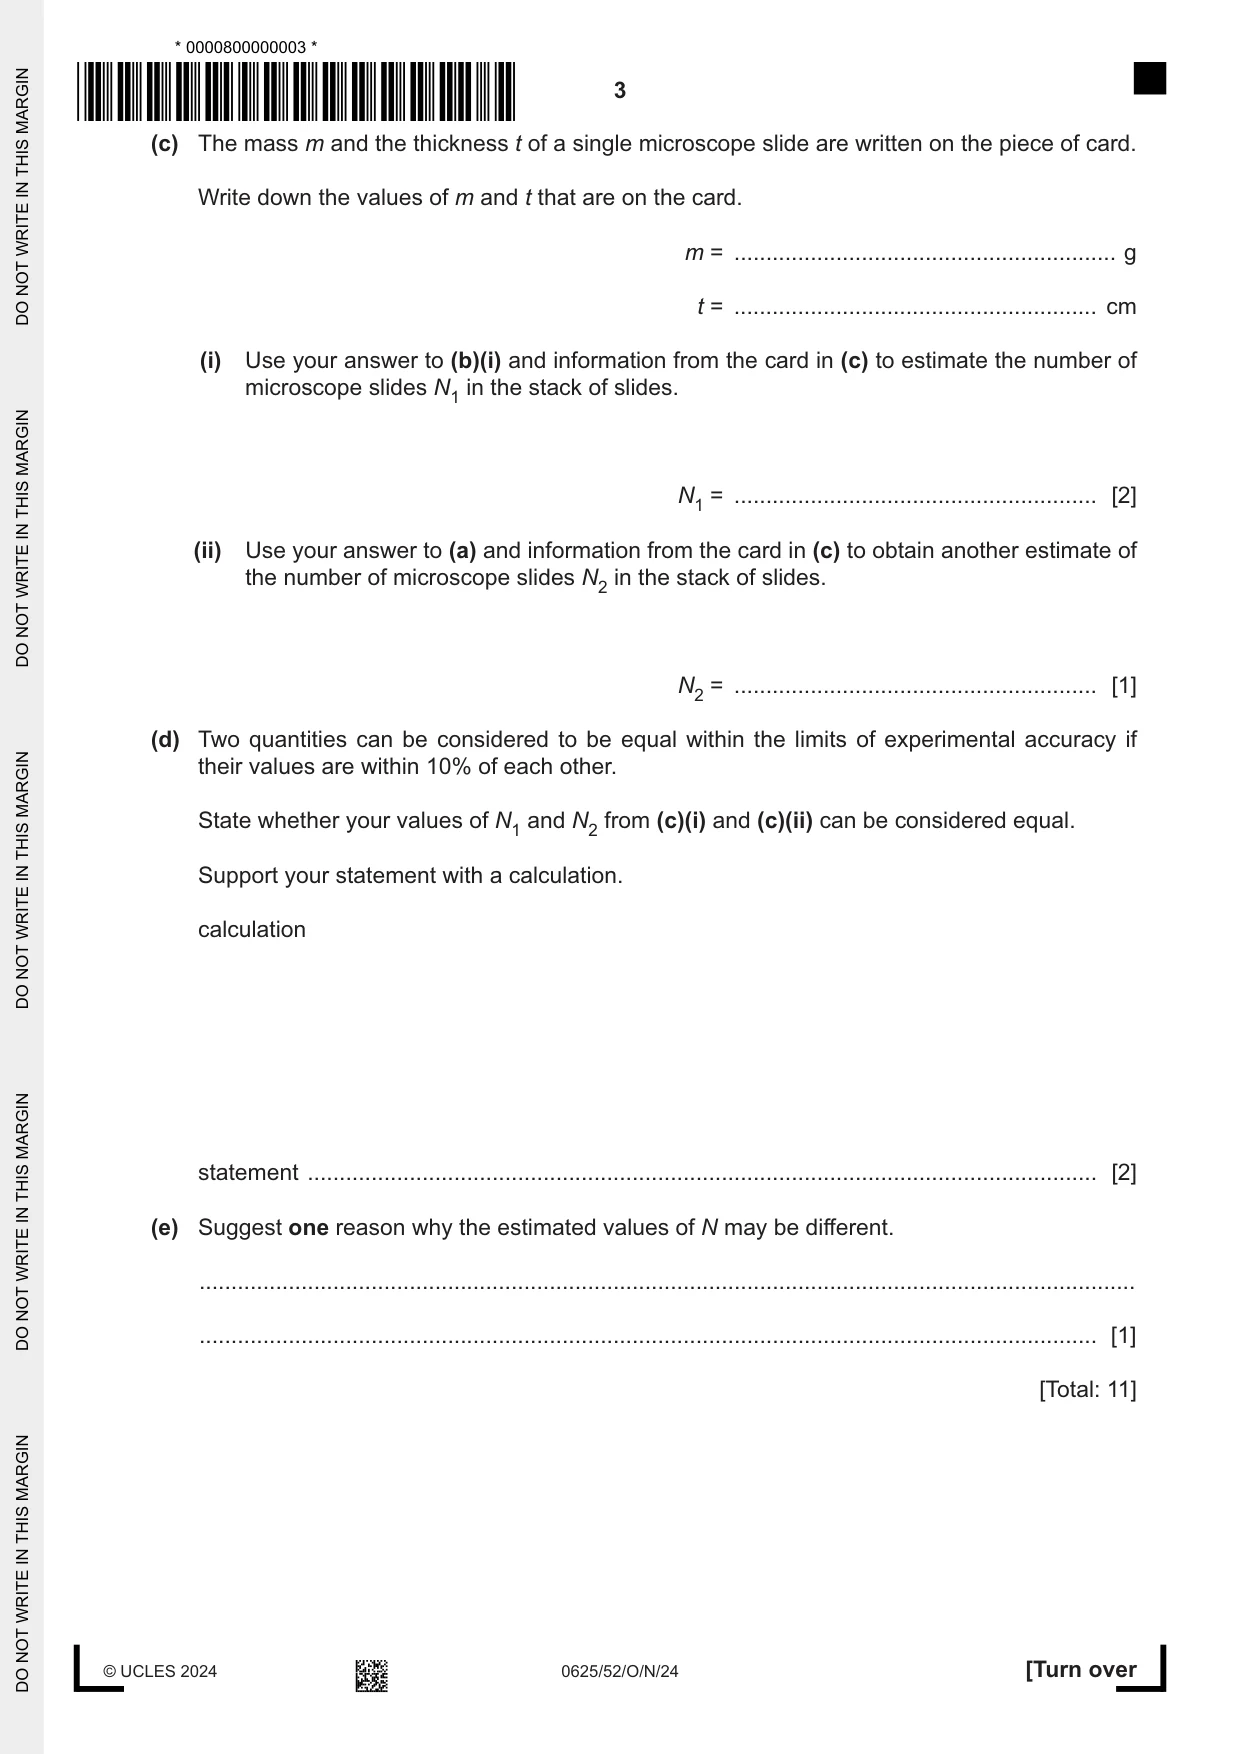
1 In this experiment, you will take measurements of a stack of glass microscope slides to estimate the number of slides in the stack. Fig. 1.1 shows the stack of slides. masking tape l w h Fig. 1.1 (a) Measure the length l, the width w and the height h of the stack of slides in centimetres to the nearest millimetre. Do not remove any slides from the stack. l = ......................................................... cm w = ......................................................... cm h = ......................................................... cm [2] (b) (i) Use the balance provided to measure the mass M of the stack of slides to the nearest 0.1 g. M = ...................................................... g [1] (ii) Calculate the density ρ of the glass. Use your results from (a) and (b)(i) and the equation shown. M ρ = l wh Give the unit for your answer. ρ = ............................................................... unit = ............................................................... [2] (c) The mass m and the thickness t of a single microscope slide are written on the piece of card. Write down the values of m and t that are on the card. m = ............................................................ g t = ......................................................... cm (i) Use your answer to (b)(i) and information from the card in (c) to estimate the number of microscope slides N1 in the stack of slides. N1 = ......................................................... [2] (ii) Use your answer to (a) and information from the card in (c) to obtain another estimate of the number of microscope slides N2 in the stack of slides. N2 = ......................................................... [1] (d) Two quantities can be considered to be equal within the limits of experimental accuracy if their values are within 10% of each other. State whether your values of N1 and N2 from (c)(i) and (c)(ii) can be considered equal. Support your statement with a calculation. calculation statement ............................................................................................................................ [2] (e) Suggest one reason why the estimated values of N may be different. ................................................................................................................................................... ............................................................................................................................................. [1] [Total: 11]
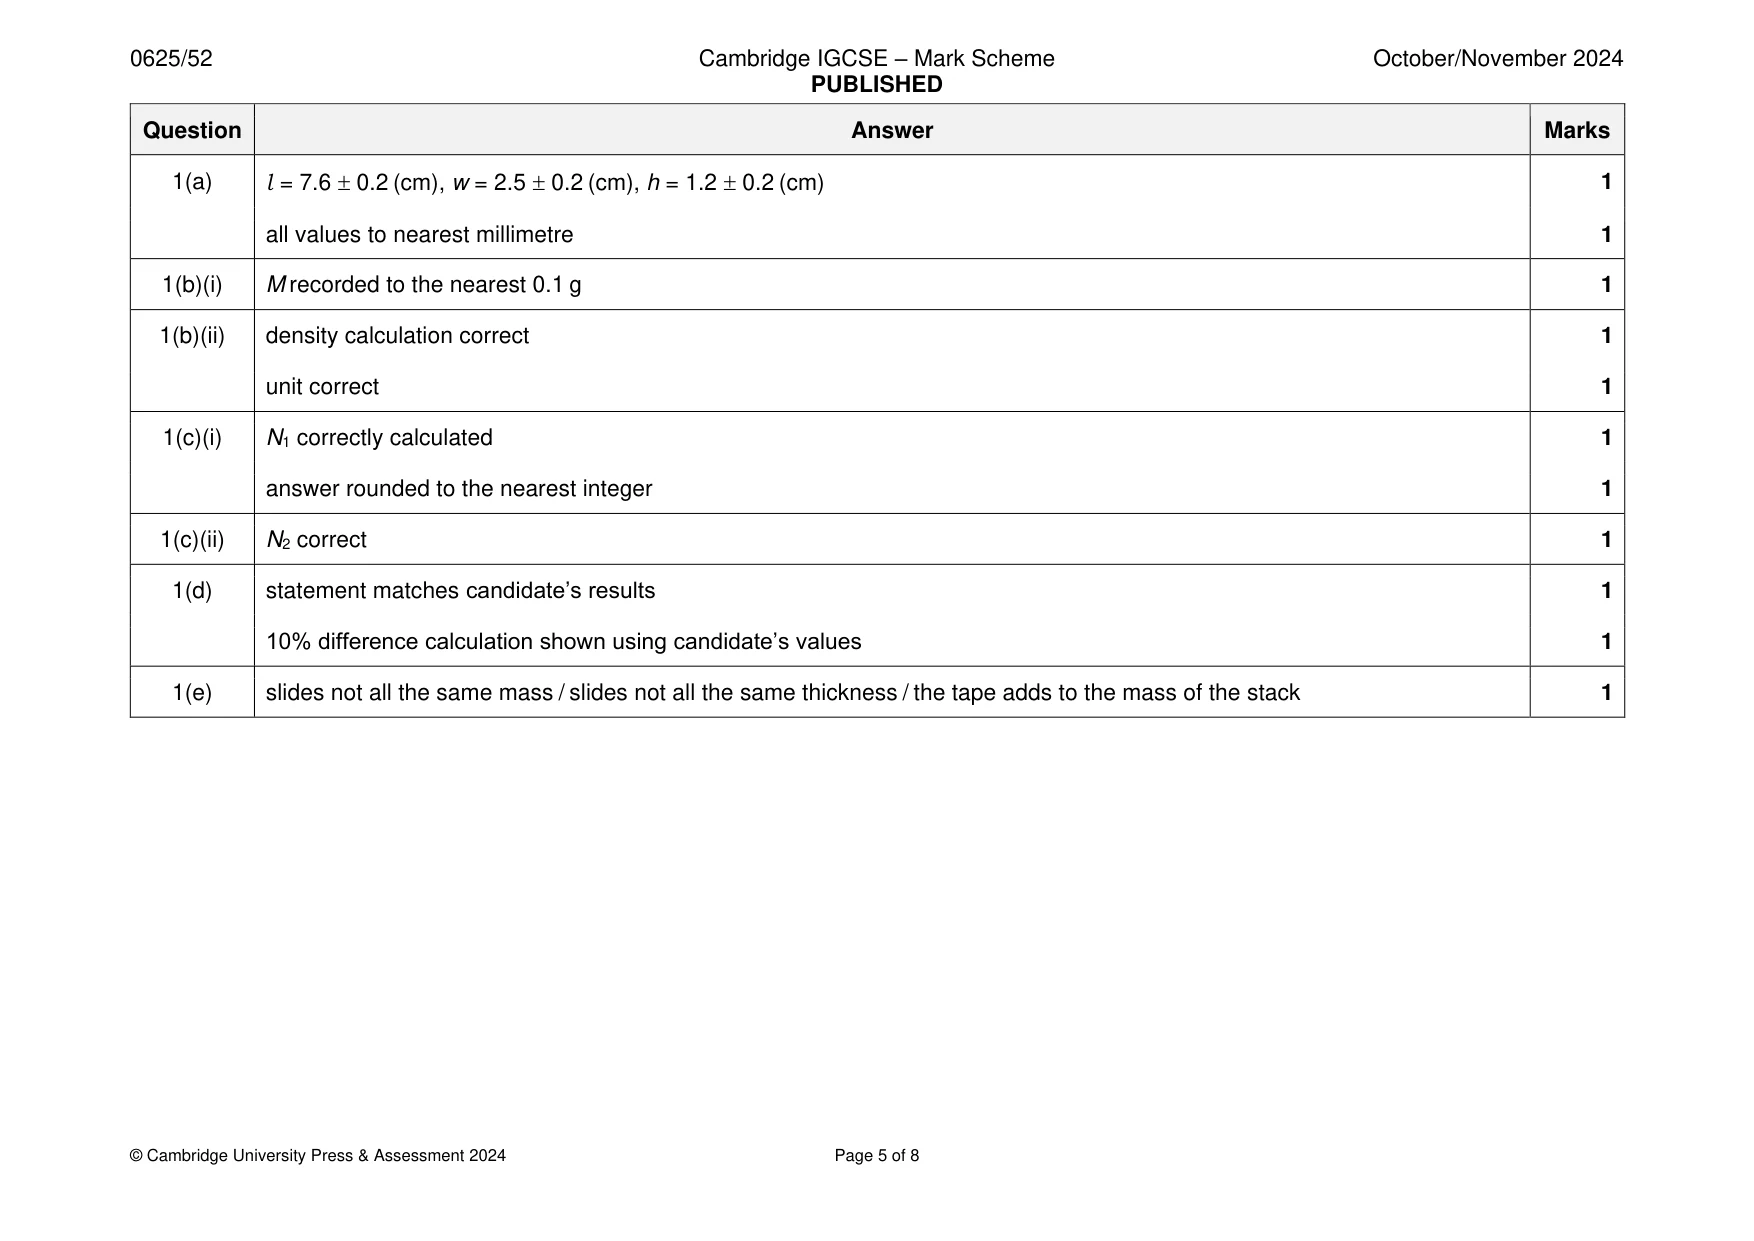
Mark scheme: Question Answer Marks 1(a) l = 7.6 0.2 (cm), w = 2.5 0.2 (cm), h = 1.2 0.2 (cm) 1 all values to nearest millimetre 1 1(b)(i) M recorded to the nearest 0.1 g 1 1(b)(ii) density calculation correct 1 unit correct 1 1(c)(i) N1 correctly calculated 1 answer rounded to the nearest integer 1 1(c)(ii) N2 correct 1 1(d) statement matches candidate’s results 1 10% difference calculation shown using candidate’s values 1 1(e) slides not all the same mass / slides not all the same thickness / the tape adds to the mass of the stack 1
More questions on Physical quantities and measurement techniques
Q2 · In this experiment, you will investigate the resistance of a light‑emitting diode (LED)…
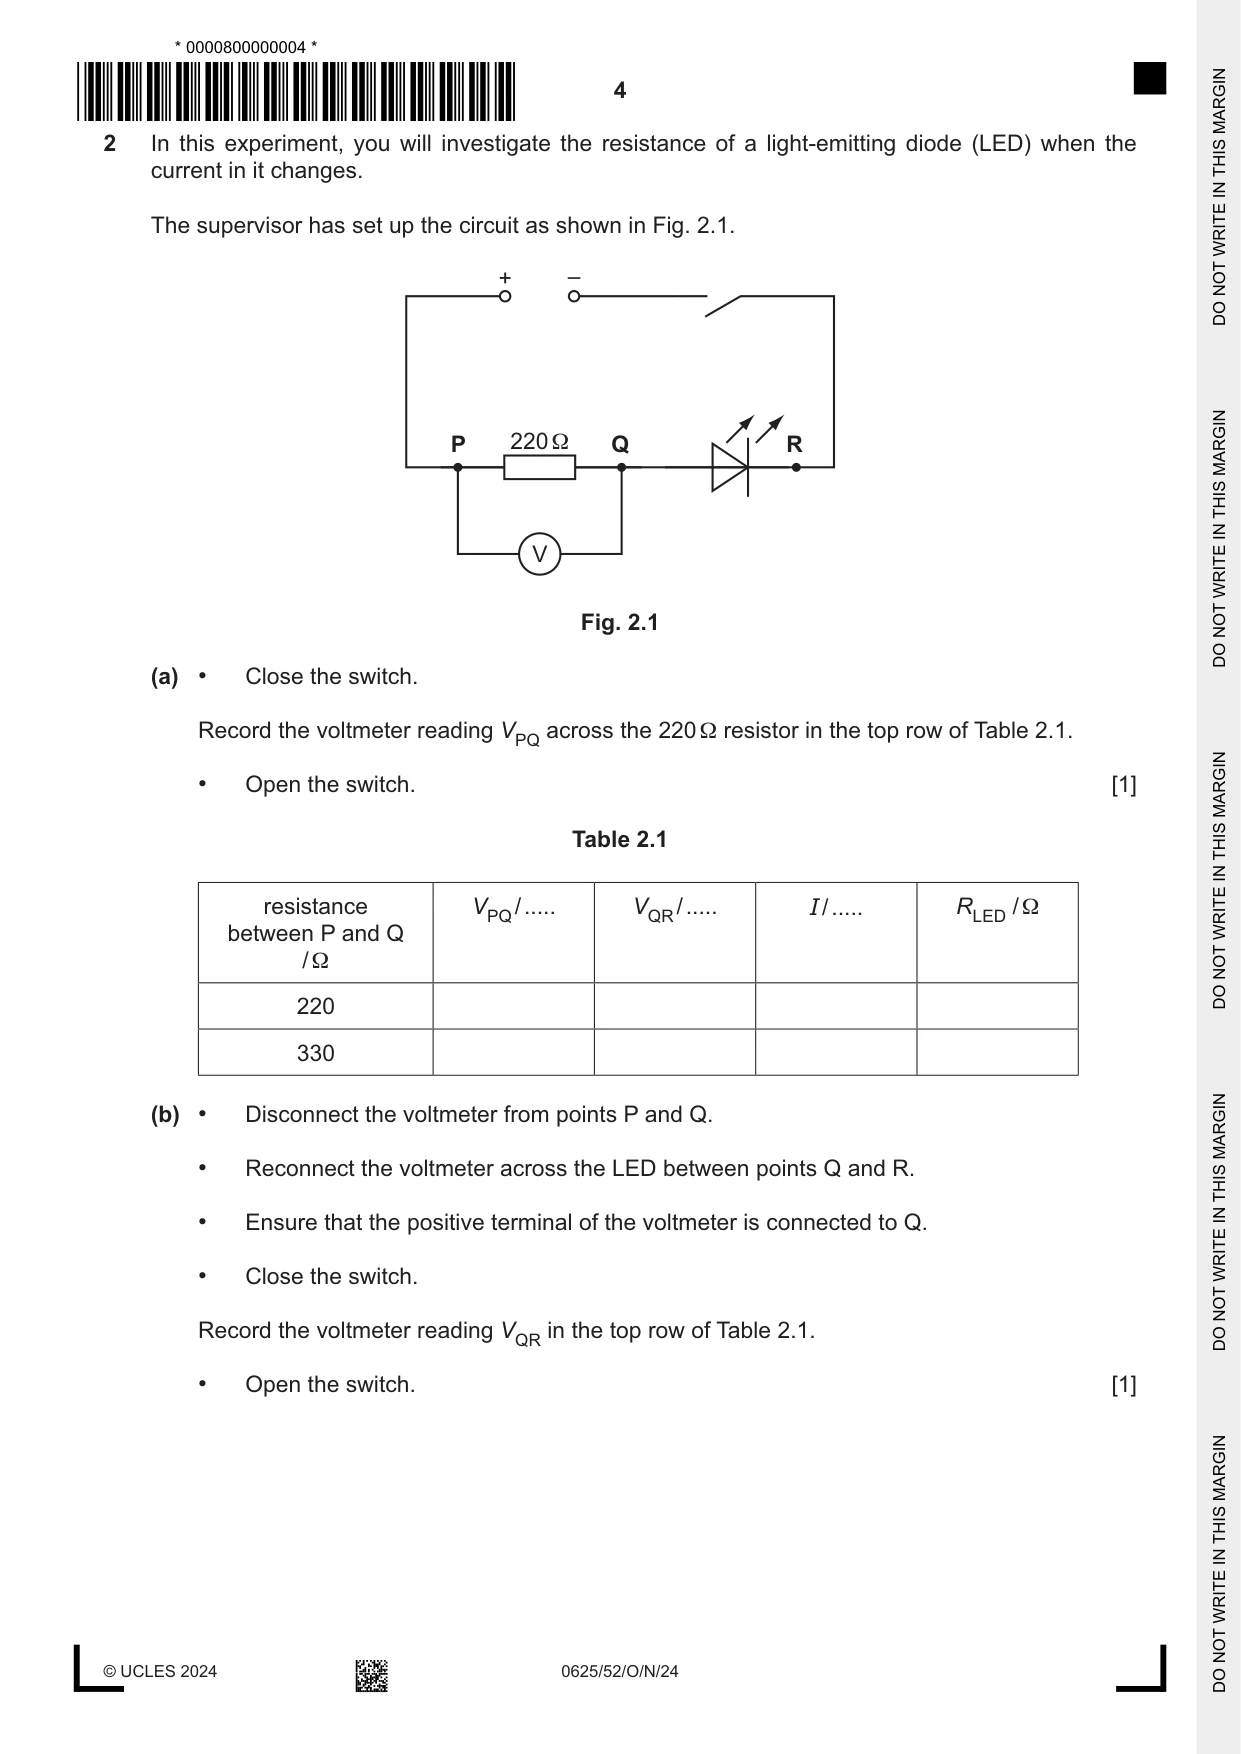
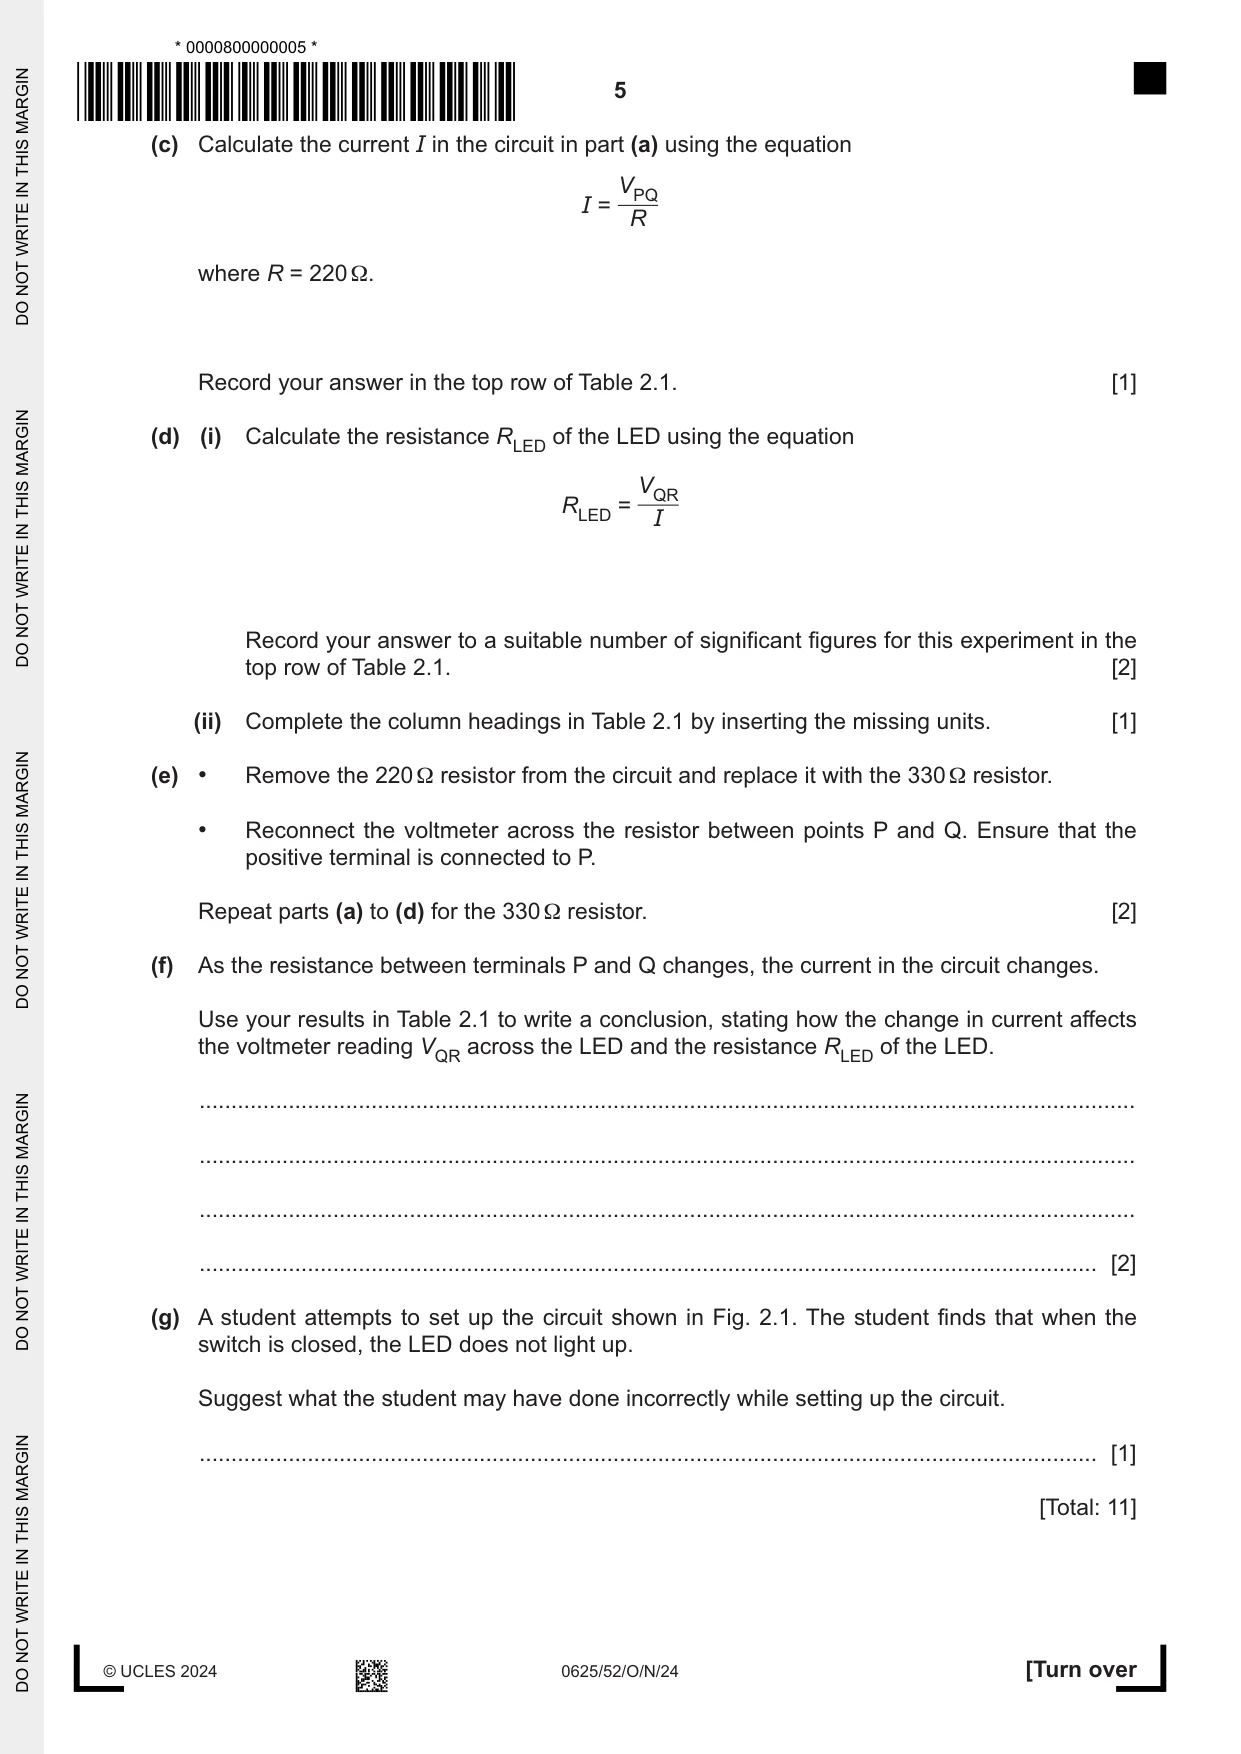
2 In this experiment, you will investigate the resistance of a light‑emitting diode (LED) when the current in it changes. The supervisor has set up the circuit as shown in Fig. 2.1. + – P 220 Ω Q R V Fig. 2.1 (a) • Close the switch. Record the voltmeter reading VPQ across the 220 Ω resistor in the top row of Table 2.1. • Open the switch. [1] Table 2.1 resistance VPQ / ..... VQR / ..... I / ..... RLED / Ω between P and Q / Ω 220 330 (b) • Disconnect the voltmeter from points P and Q. • Reconnect the voltmeter across the LED between points Q and R. • Ensure that the positive terminal of the voltmeter is connected to Q. • Close the switch. Record the voltmeter reading VQR in the top row of Table 2.1. • Open the switch. [1] (c) Calculate the current I in the circuit in part (a) using the equation VPQ I = R where R = 220 Ω. Record your answer in the top row of Table 2.1. [1] (d) (i) Calculate the resistance RLED of the LED using the equation VQR RLED = I Record your answer to a suitable number of significant figures for this experiment in the top row of Table 2.1. [2] (ii) Complete the column headings in Table 2.1 by inserting the missing units. [1] (e) • Remove the 220 Ω resistor from the circuit and replace it with the 330 Ω resistor. • Reconnect the voltmeter across the resistor between points P and Q. Ensure that the positive terminal is connected to P. Repeat parts (a) to (d) for the 330 Ω resistor. [2] (f) As the resistance between terminals P and Q changes, the current in the circuit changes. Use your results in Table 2.1 to write a conclusion, stating how the change in current affects the voltmeter reading VQR across the LED and the resistance RLED of the LED. ................................................................................................................................................... ................................................................................................................................................... ................................................................................................................................................... ............................................................................................................................................. [2] (g) A student attempts to set up the circuit shown in Fig. 2.1. The student finds that when the switch is closed, the LED does not light up. Suggest what the student may have done incorrectly while setting up the circuit. ............................................................................................................................................. [1] [Total: 11]
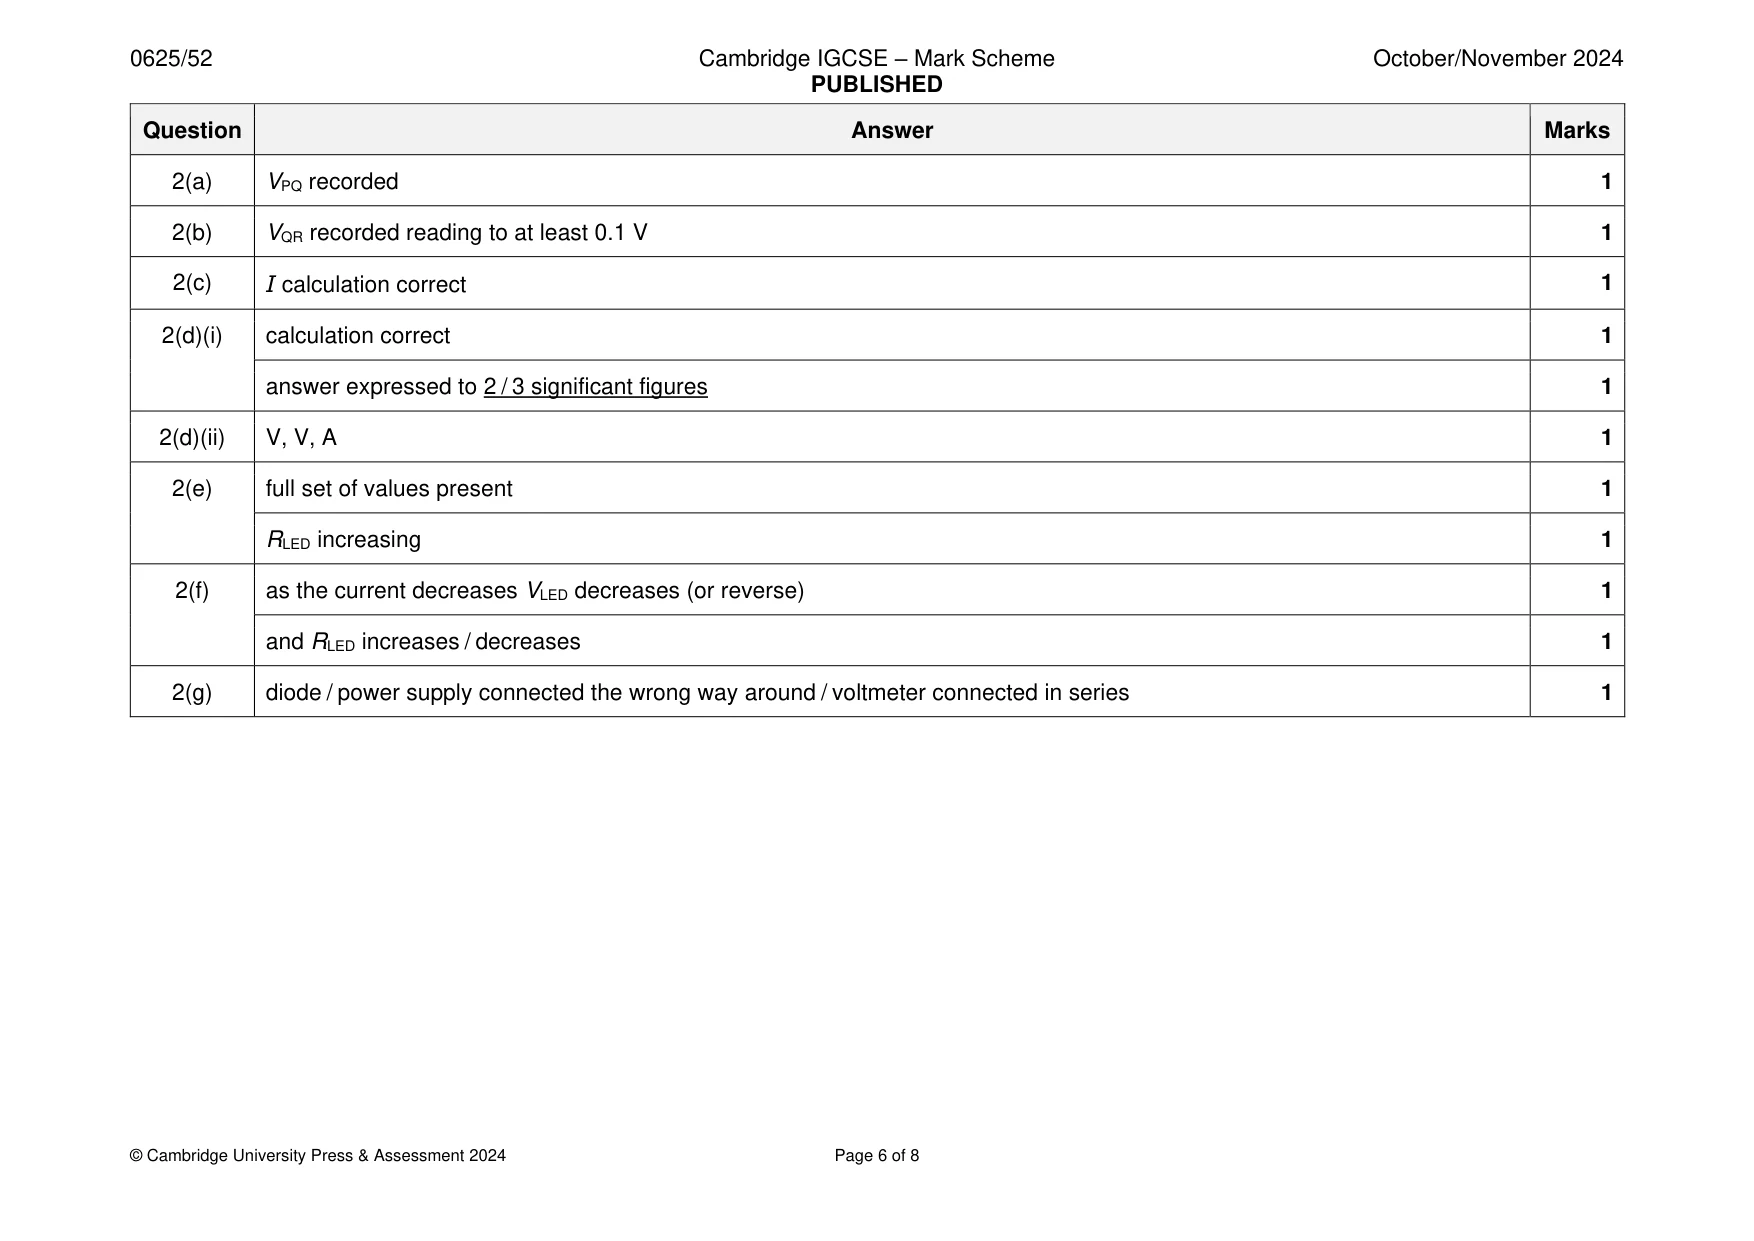
Mark scheme: 2(a) VPQ recorded 1 2(b) VQR recorded reading to at least 0.1 V 1 2(c) I calculation correct 1 2(d)(i) calculation correct 1 answer expressed to 2 / 3 significant figures 1 2(d)(ii) V, V, A 1 2(e) full set of values present 1 RLED increasing 1 2(f) as the current decreases VLED decreases (or reverse) 1 and RLED increases / decreases 1 2(g) diode / power supply connected the wrong way around / voltmeter connected in series 1
Q3 · In this experiment, you will investigate the image formed by a converging lens
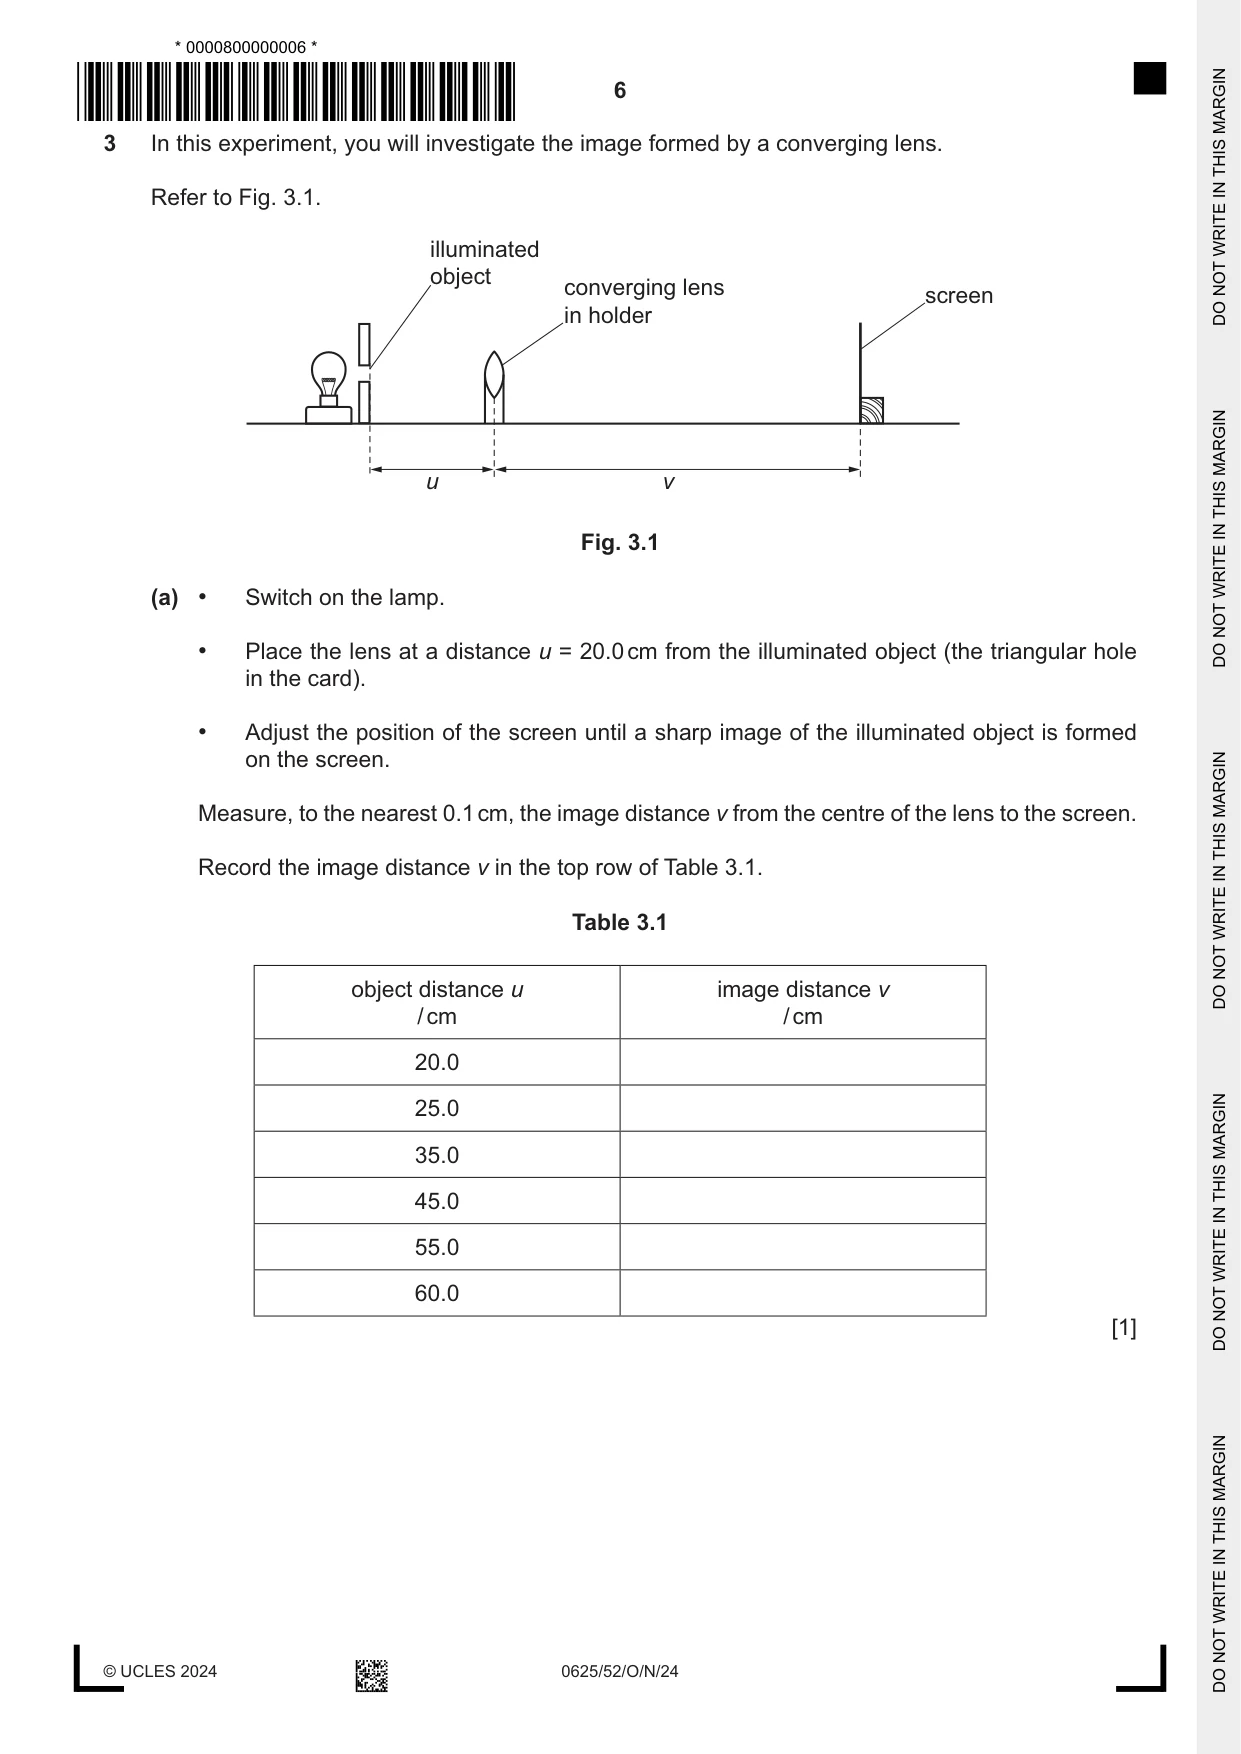
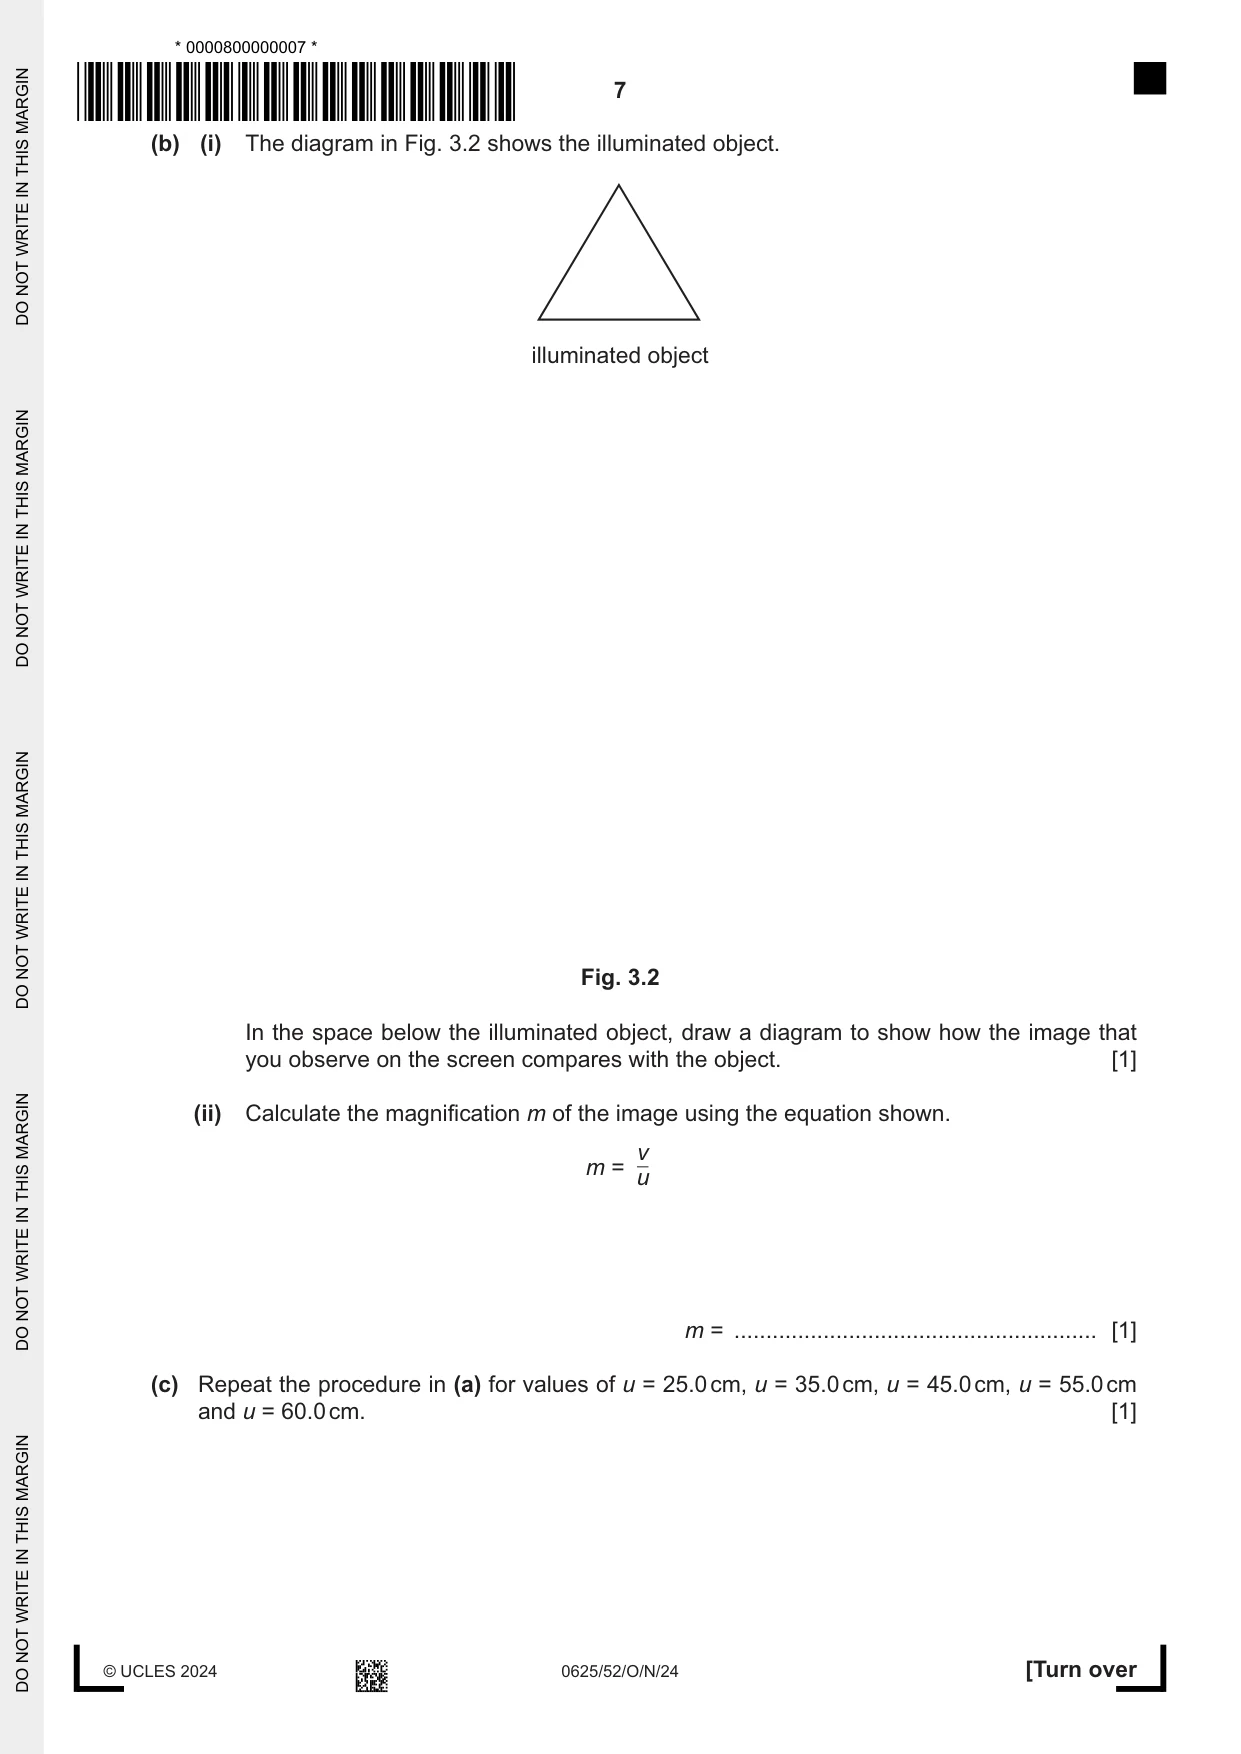
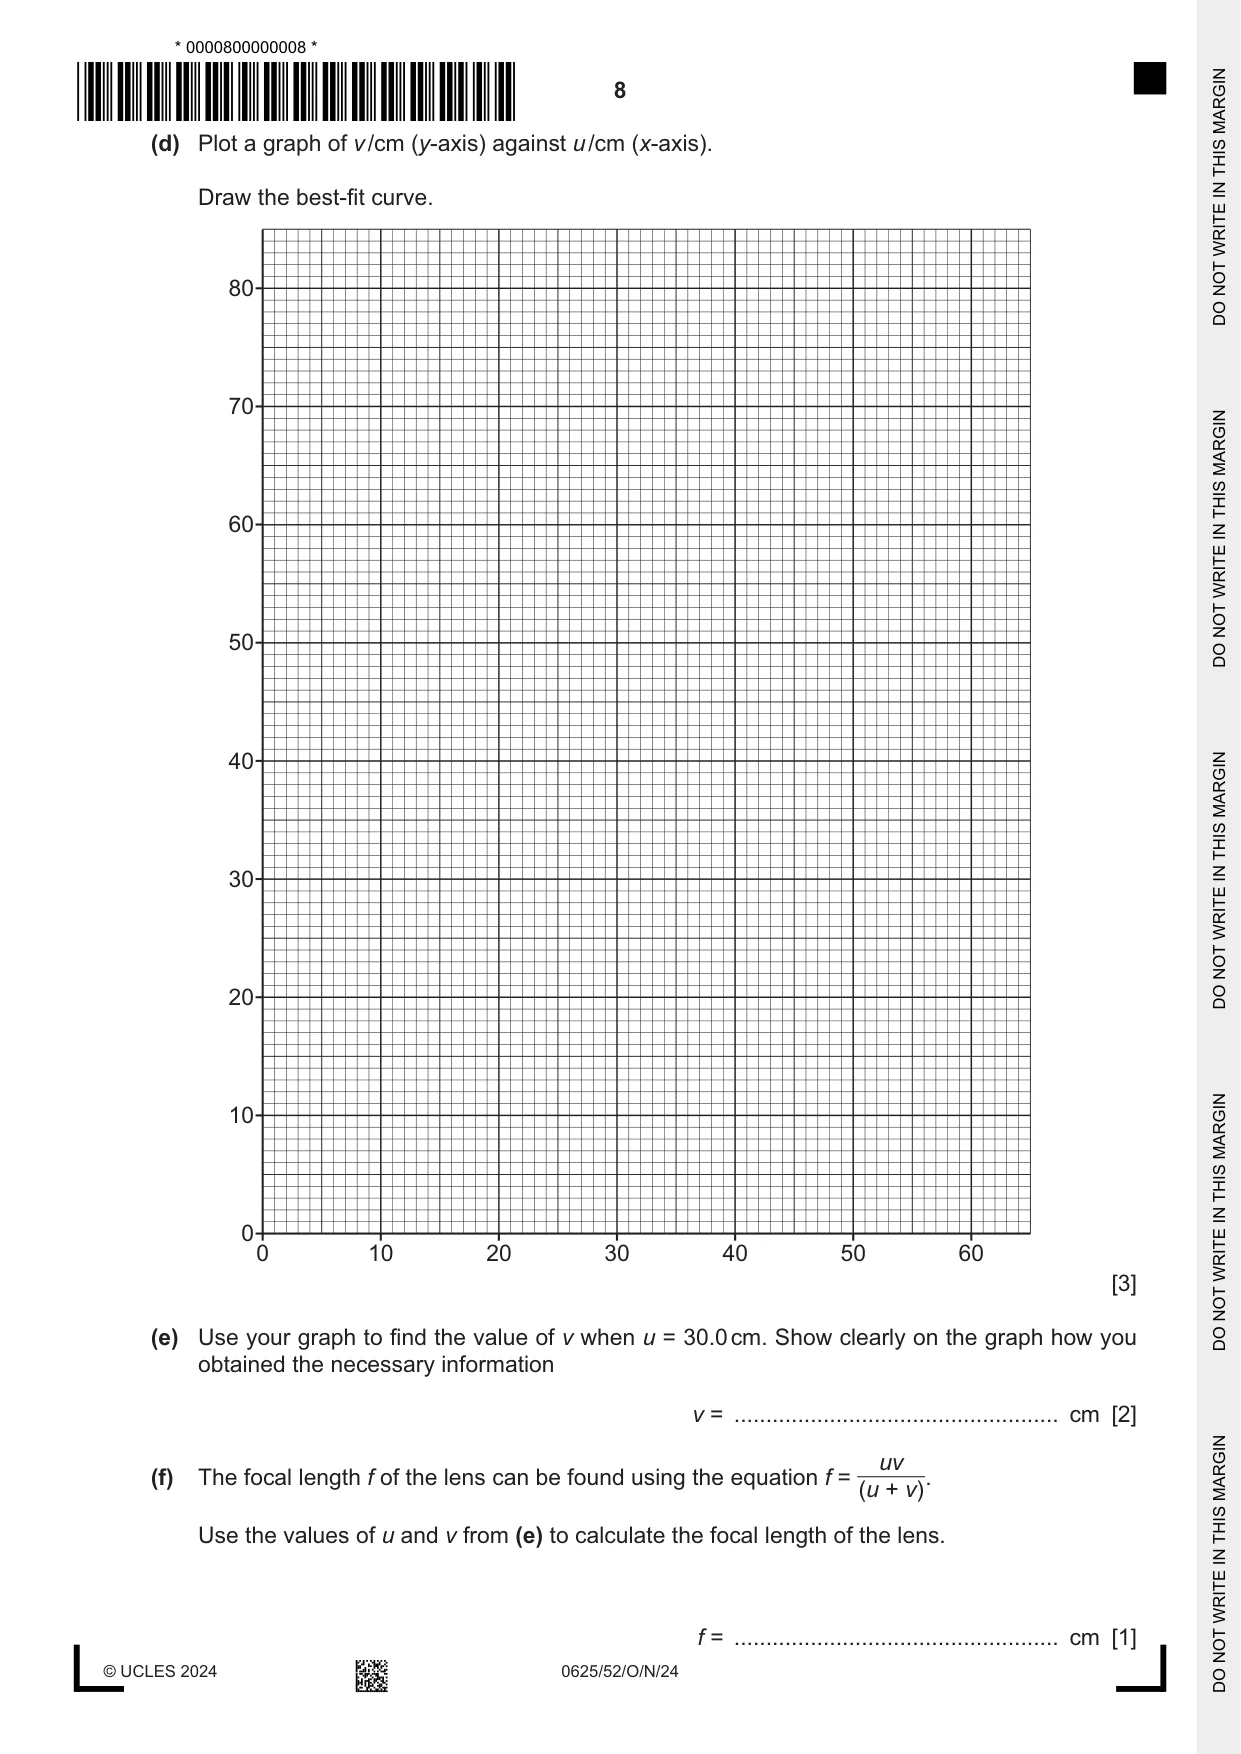
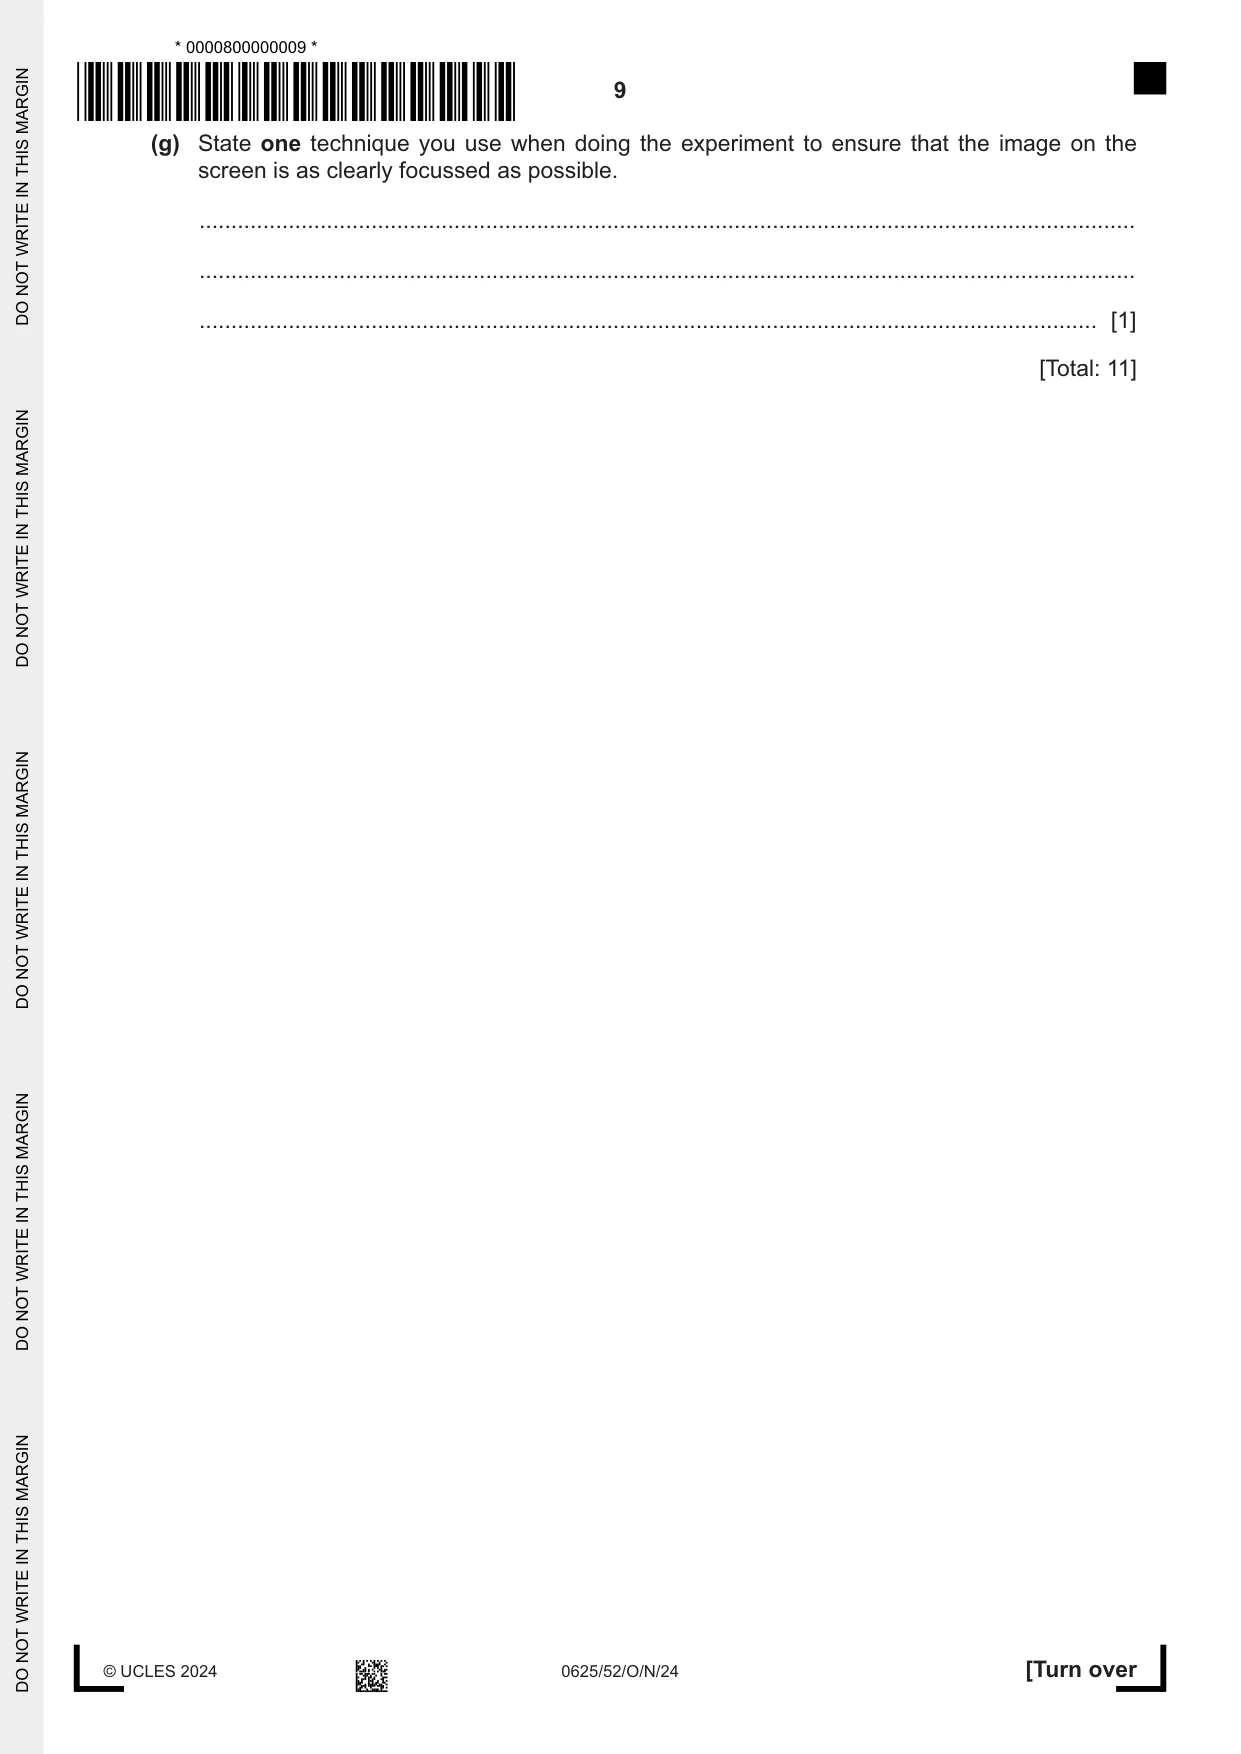
3 In this experiment, you will investigate the image formed by a converging lens. Refer to Fig. 3.1. illuminated object converging lens screen in holder u v Fig. 3.1 (a) • Switch on the lamp. • Place the lens at a distance u = 20.0 cm from the illuminated object (the triangular hole in the card). • Adjust the position of the screen until a sharp image of the illuminated object is formed on the screen. Measure, to the nearest 0.1 cm, the image distance v from the centre of the lens to the screen. Record the image distance v in the top row of Table 3.1. Table 3.1 object distance u image distance v / cm / cm 20.0 25.0 35.0 45.0 55.0 60.0 [1] (b) (i) The diagram in Fig. 3.2 shows the illuminated object. illuminated object Fig. 3.2 In the space below the illuminated object, draw a diagram to show how the image that you observe on the screen compares with the object. [1] (ii) Calculate the magnification m of the image using the equation shown. v m = u m = ......................................................... [1] (c) Repeat the procedure in (a) for values of u = 25.0 cm, u = 35.0 cm, u = 45.0 cm, u = 55.0 cm and u = 60.0 cm. [1] (d) Plot a graph of v /cm (y‑axis) against u /cm (x‑axis). Draw the best‑fit curve. 80 70 60 50 40 30 20 10 0 0 10 20 30 40 50 60 [3] (e) Use your graph to find the value of v when u = 30.0 cm. Show clearly on the graph how you obtained the necessary information v = ................................................... cm [2] uv (f) The focal length f of the lens can be found using the equation f = (u + v). Use the values of u and v from (e) to calculate the focal length of the lens. f = ................................................... cm [1] (g) State one technique you use when doing the experiment to ensure that the image on the screen is as clearly focussed as possible. ................................................................................................................................................... ................................................................................................................................................... ............................................................................................................................................. [1] [Total: 11]
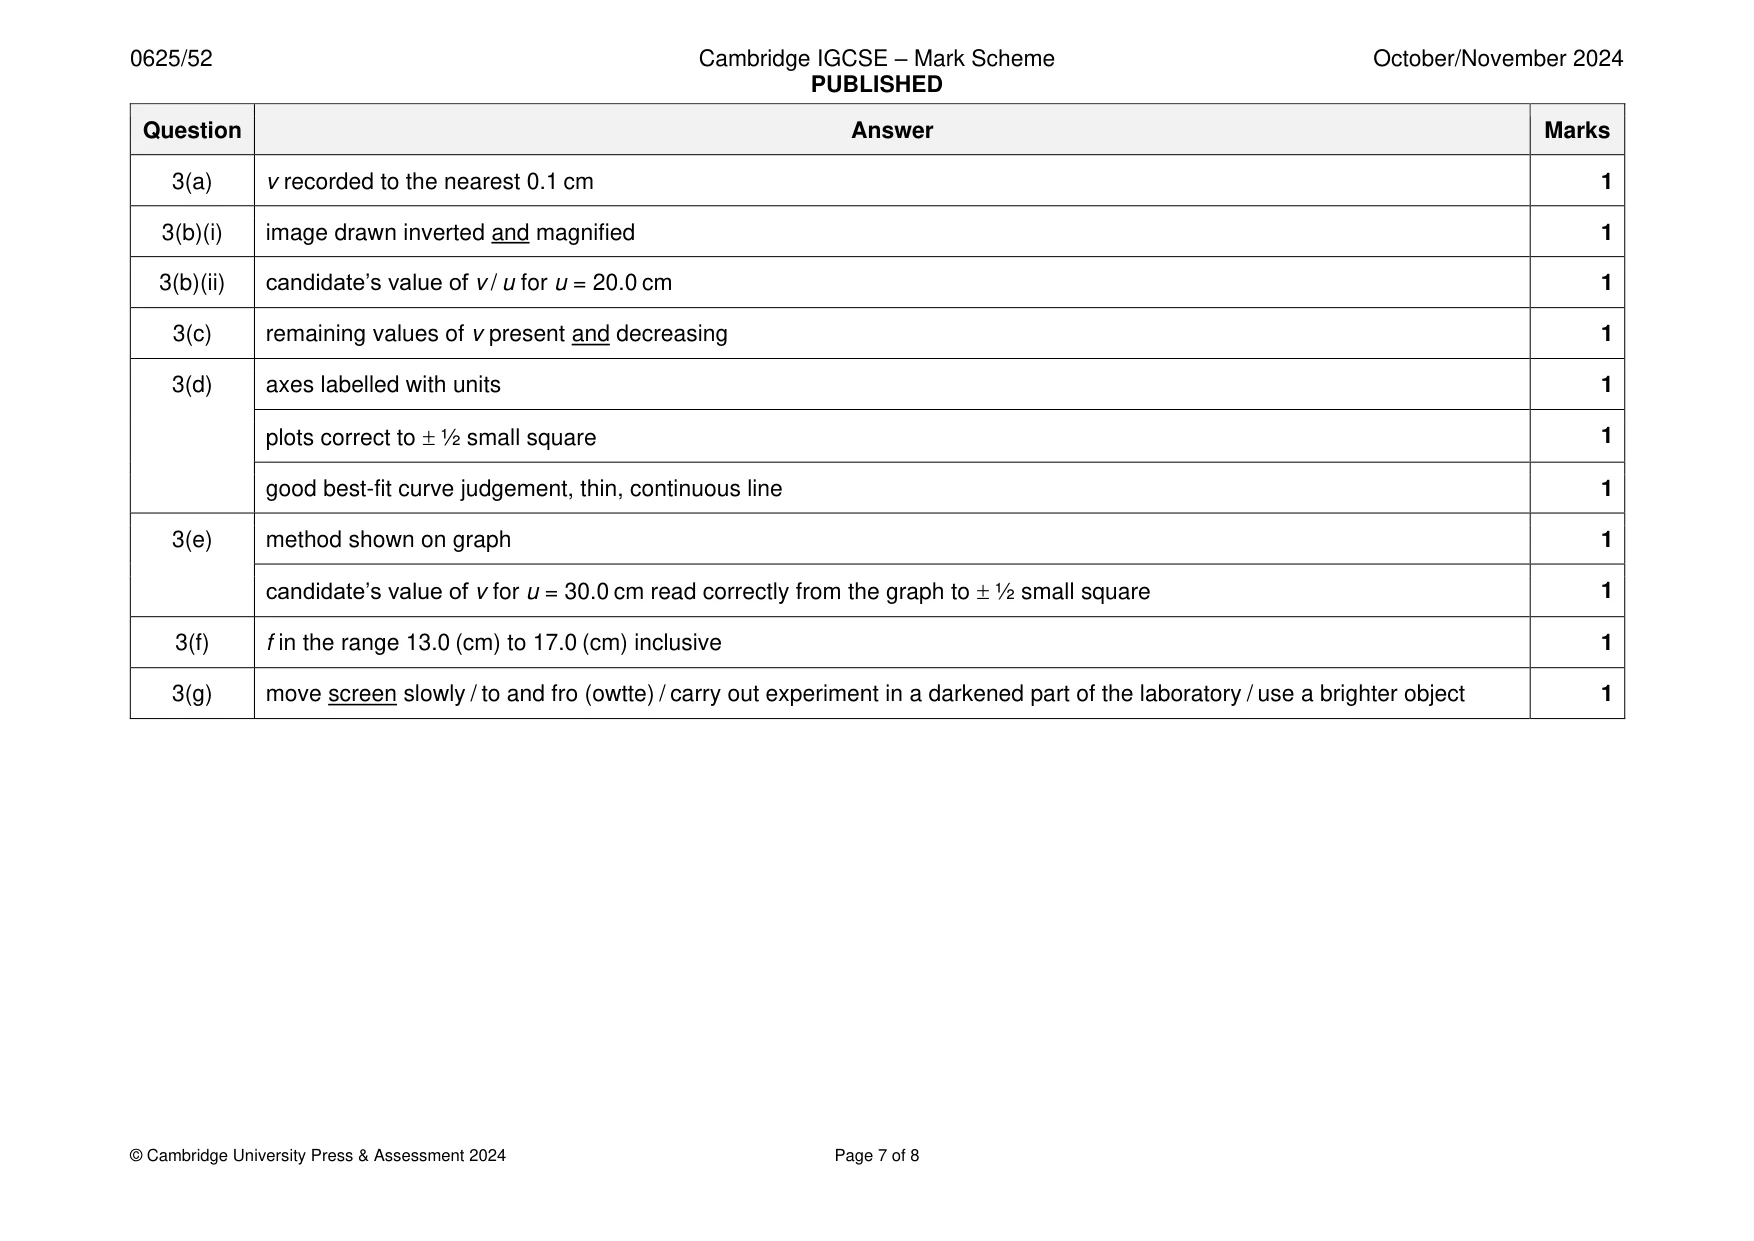
Mark scheme: 3(a) v recorded to the nearest 0.1 cm 1 3(b)(i) image drawn inverted and magnified 1 3(b)(ii) candidate’s value of v / u for u = 20.0 cm 1 3(c) remaining values of v present and decreasing 1 3(d) axes labelled with units 1 plots correct to ½ small square 1 good best-fit curve judgement, thin, continuous line 1 3(e) method shown on graph 1 candidate’s value of v for u = 30.0 cm read correctly from the graph to ½ small square 1 3(f) f in the range 13.0 (cm) to 17.0 (cm) inclusive 1 3(g) move screen slowly / to and fro (owtte) / carry out experiment in a darkened part of the laboratory / use a brighter object 1
Q4 · Hot water is poured into a glass beaker and allowed to cool down
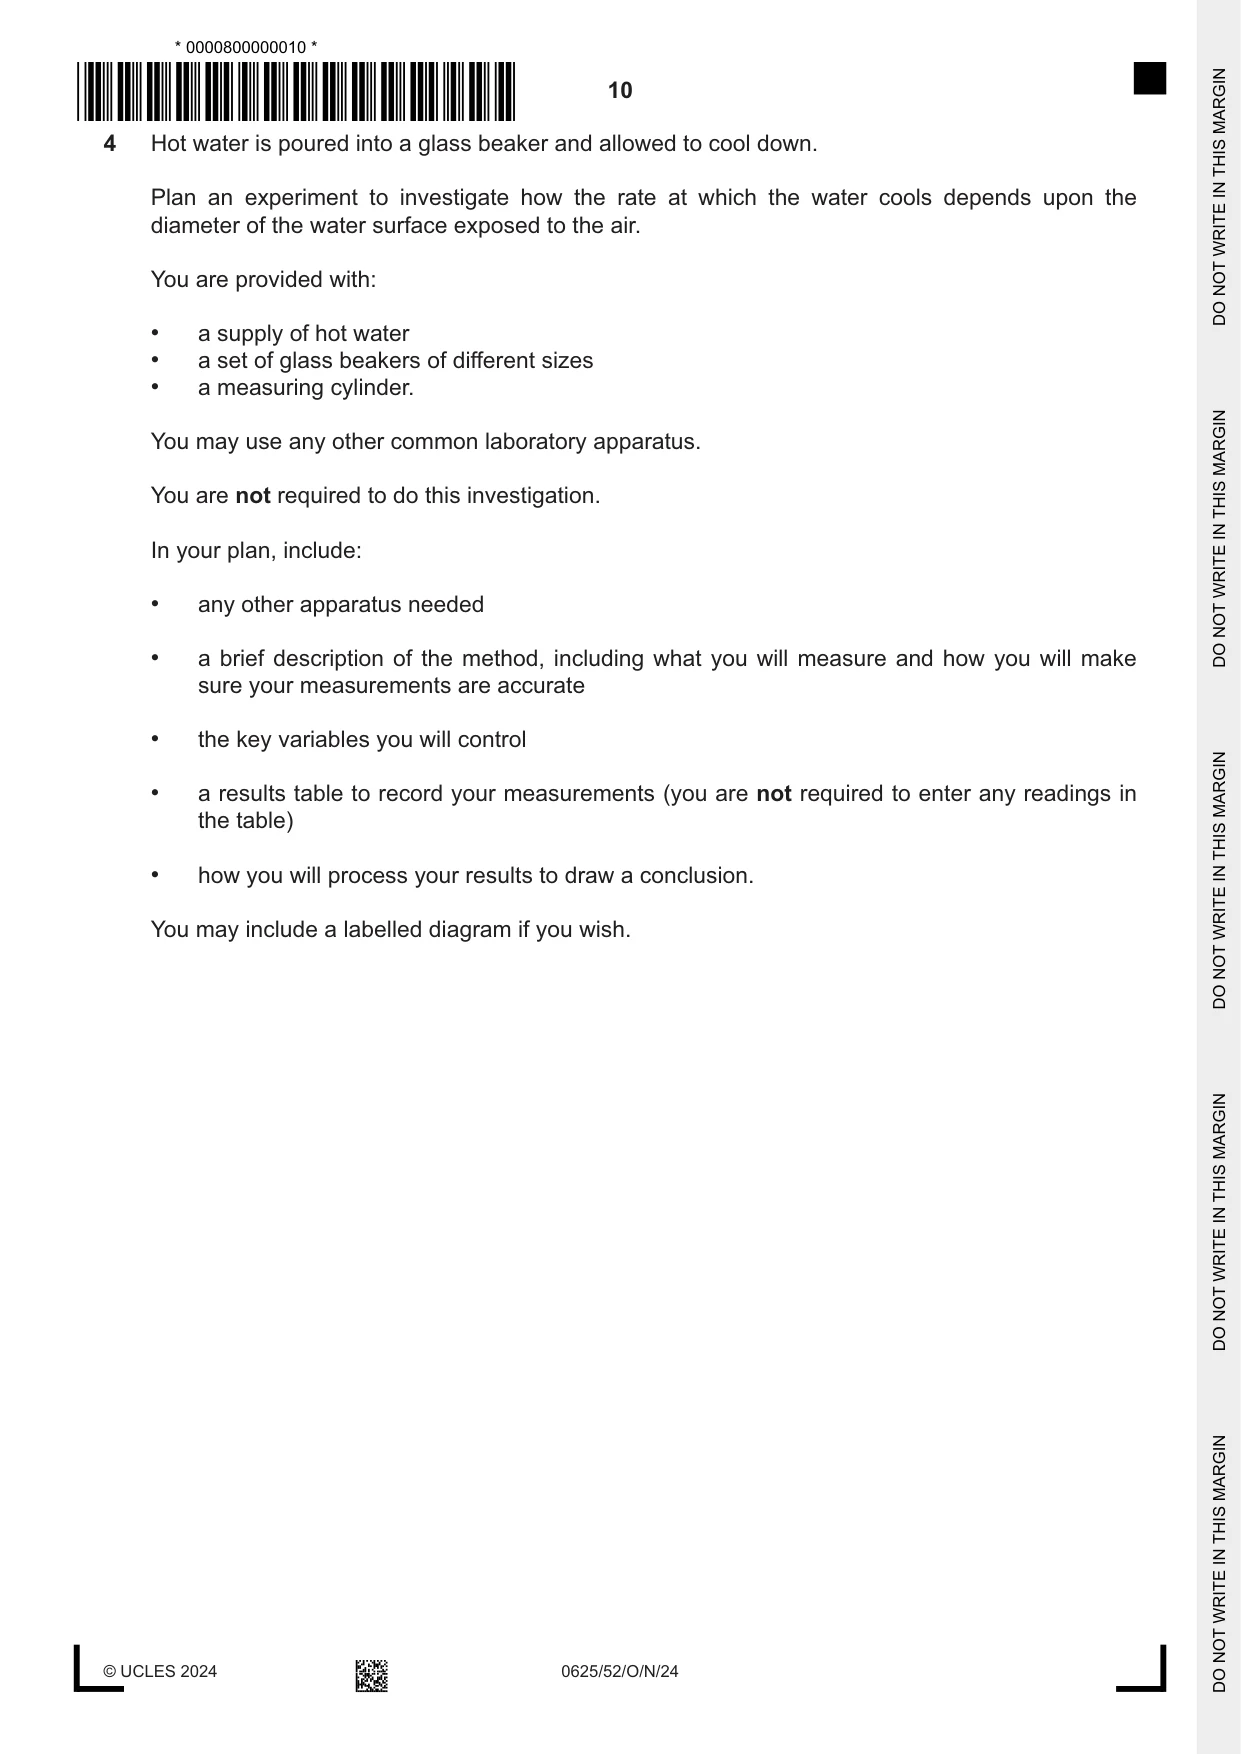
4 Hot water is poured into a glass beaker and allowed to cool down. Plan an experiment to investigate how the rate at which the water cools depends upon the diameter of the water surface exposed to the air. You are provided with: • a supply of hot water • a set of glass beakers of different sizes • a measuring cylinder. You may use any other common laboratory apparatus. You are not required to do this investigation. In your plan, include: • any other apparatus needed • a brief description of the method, including what you will measure and how you will make sure your measurements are accurate • the key variables you will control • a results table to record your measurements (you are not required to enter any readings in the table) • how you will process your results to draw a conclusion. You may include a labelled diagram if you wish. .......................................................................................................................................................... .......................................................................................................................................................... .......................................................................................................................................................... .......................................................................................................................................................... .......................................................................................................................................................... .......................................................................................................................................................... .......................................................................................................................................................... .......................................................................................................................................................... .......................................................................................................................................................... .......................................................................................................................................................... .......................................................................................................................................................... .......................................................................................................................................................... .......................................................................................................................................................... .......................................................................................................................................................... .......................................................................................................................................................... .......................................................................................................................................................... .......................................................................................................................................................... .......................................................................................................................................................... .......................................................................................................................................................... .......................................................................................................................................................... .......................................................................................................................................................... .......................................................................................................................................................... .......................................................................................................................................................... .......................................................................................................................................................... .......................................................................................................................................................... .......................................................................................................................................................... .......................................................................................................................................................... .................................................................................................................................................... [7]
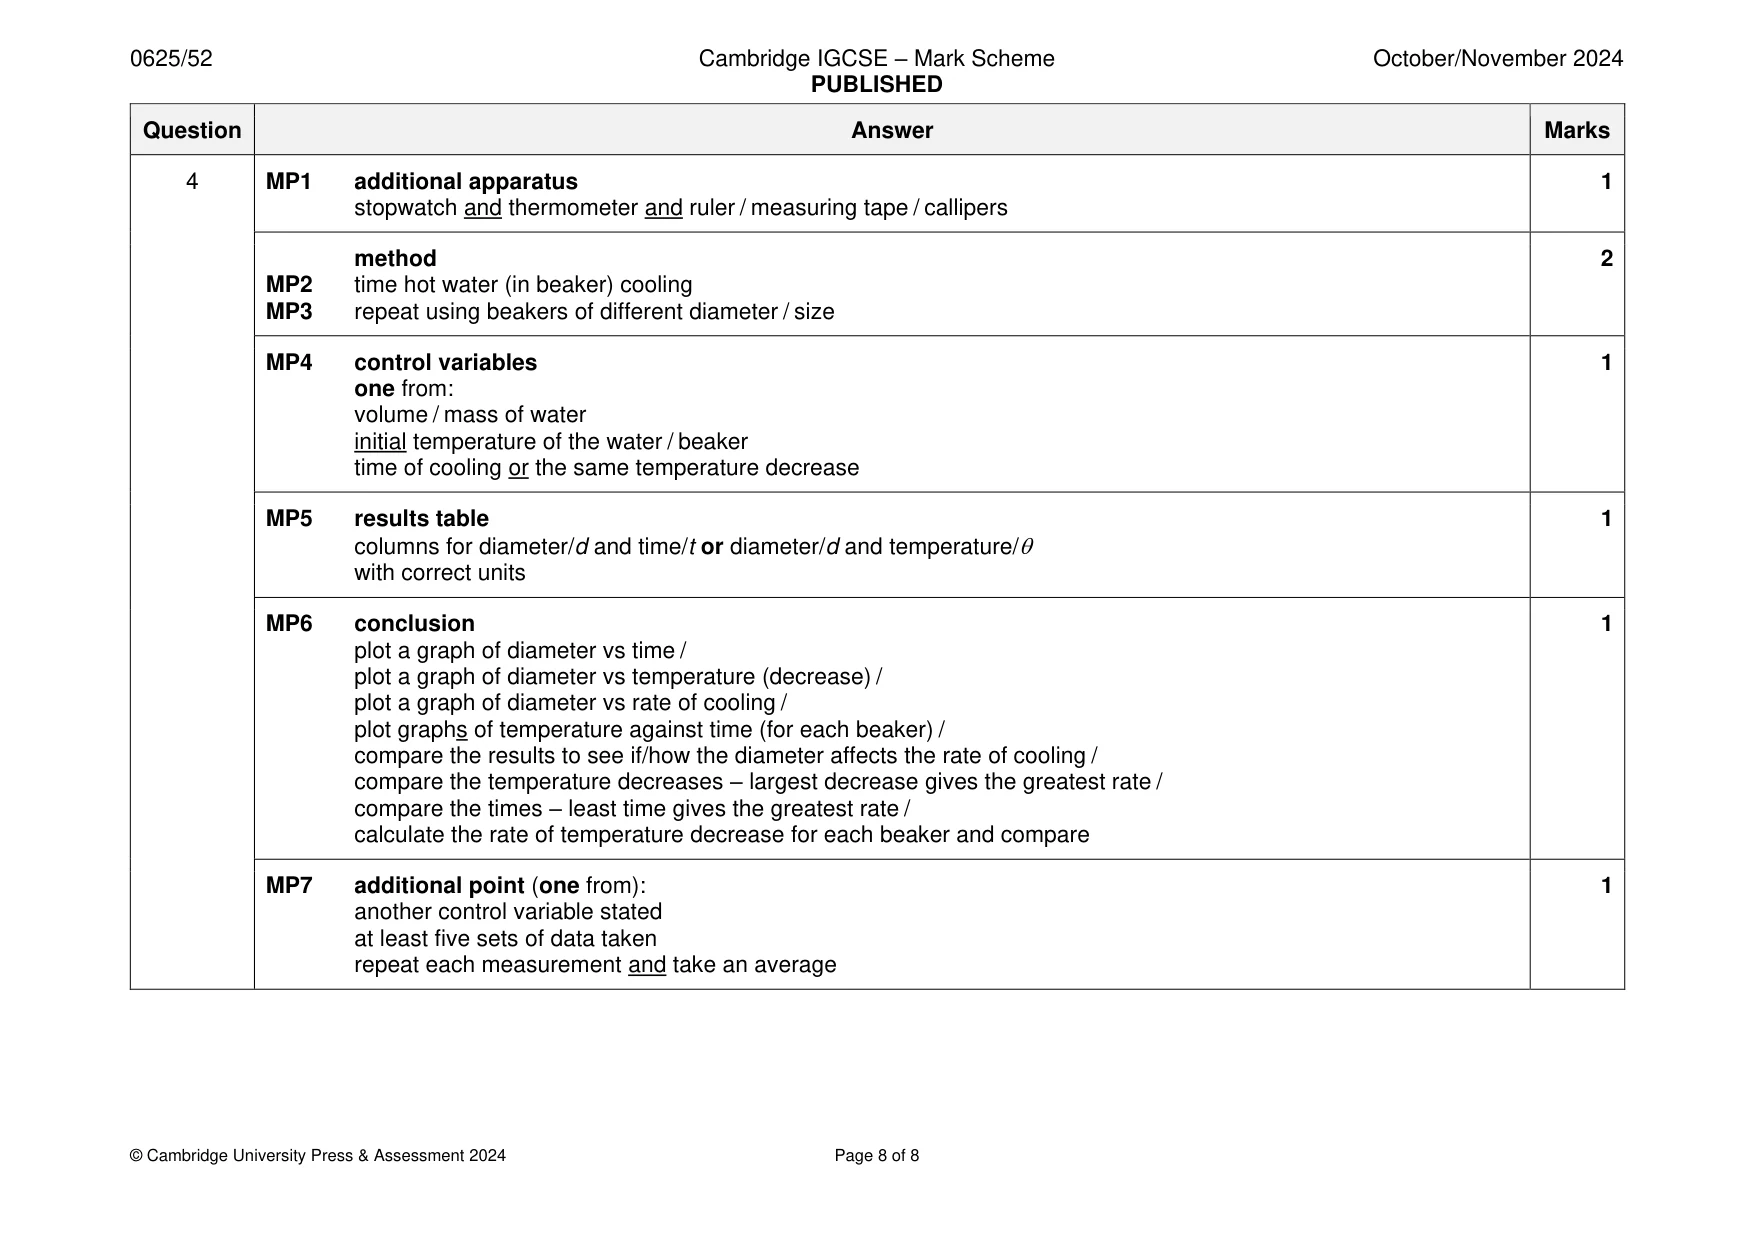
Mark scheme: 4 MP1 additional apparatus 1 stopwatch and thermometer and ruler / measuring tape / callipers method 2 MP2 time hot water (in beaker) cooling MP3 repeat using beakers of different diameter / size MP4 control variables 1 one from: volume / mass of water initial temperature of the water / beaker time of cooling or the same temperature decrease MP5 results table 1 columns for diameter/d and time/t or diameter/d and temperature/ with correct units MP6 conclusion 1 plot a graph of diameter vs time / plot a graph of diameter vs temperature (decrease) / plot a graph of diameter vs rate of cooling / plot graphs of temperature against time (for each beaker) / compare the results to see if/how the diameter affects the rate of cooling / compare the temperature decreases – largest decrease gives the greatest rate / compare the times – least time gives the greatest rate / calculate the rate of temperature decrease for each beaker and compare MP7 additional point (one from): 1 another control variable stated at least five sets of data taken repeat each measurement and take an average
What was in this paper
The subtopics covered by these 4 questions, and how many questions each got. Open one in a new tab to see every Cambridge question on it.
What you needed in this session
Cambridge’s own grade thresholds for 2024 Oct/Nov, Paper 5 · Variant 2. A higher threshold means an easier paper — the bar moves with how the cohort did.