Cambridge IGCSE Physics 0625 — 2024 May/June Paper 5 · Variant 2
0625/52/M/J/24 · 4 questions · 40 marks · ≈45 min
The question paper and its mark scheme, free to read here and free to download. This is Cambridge’s own paper, exactly as it was sat.
Question paper16 pages




Mark scheme7 pages
Answers below. Sit the paper first if you are practising.
Questions as text
Q1 · In this experiment, you will measure the spring constant k of a spring by two different…
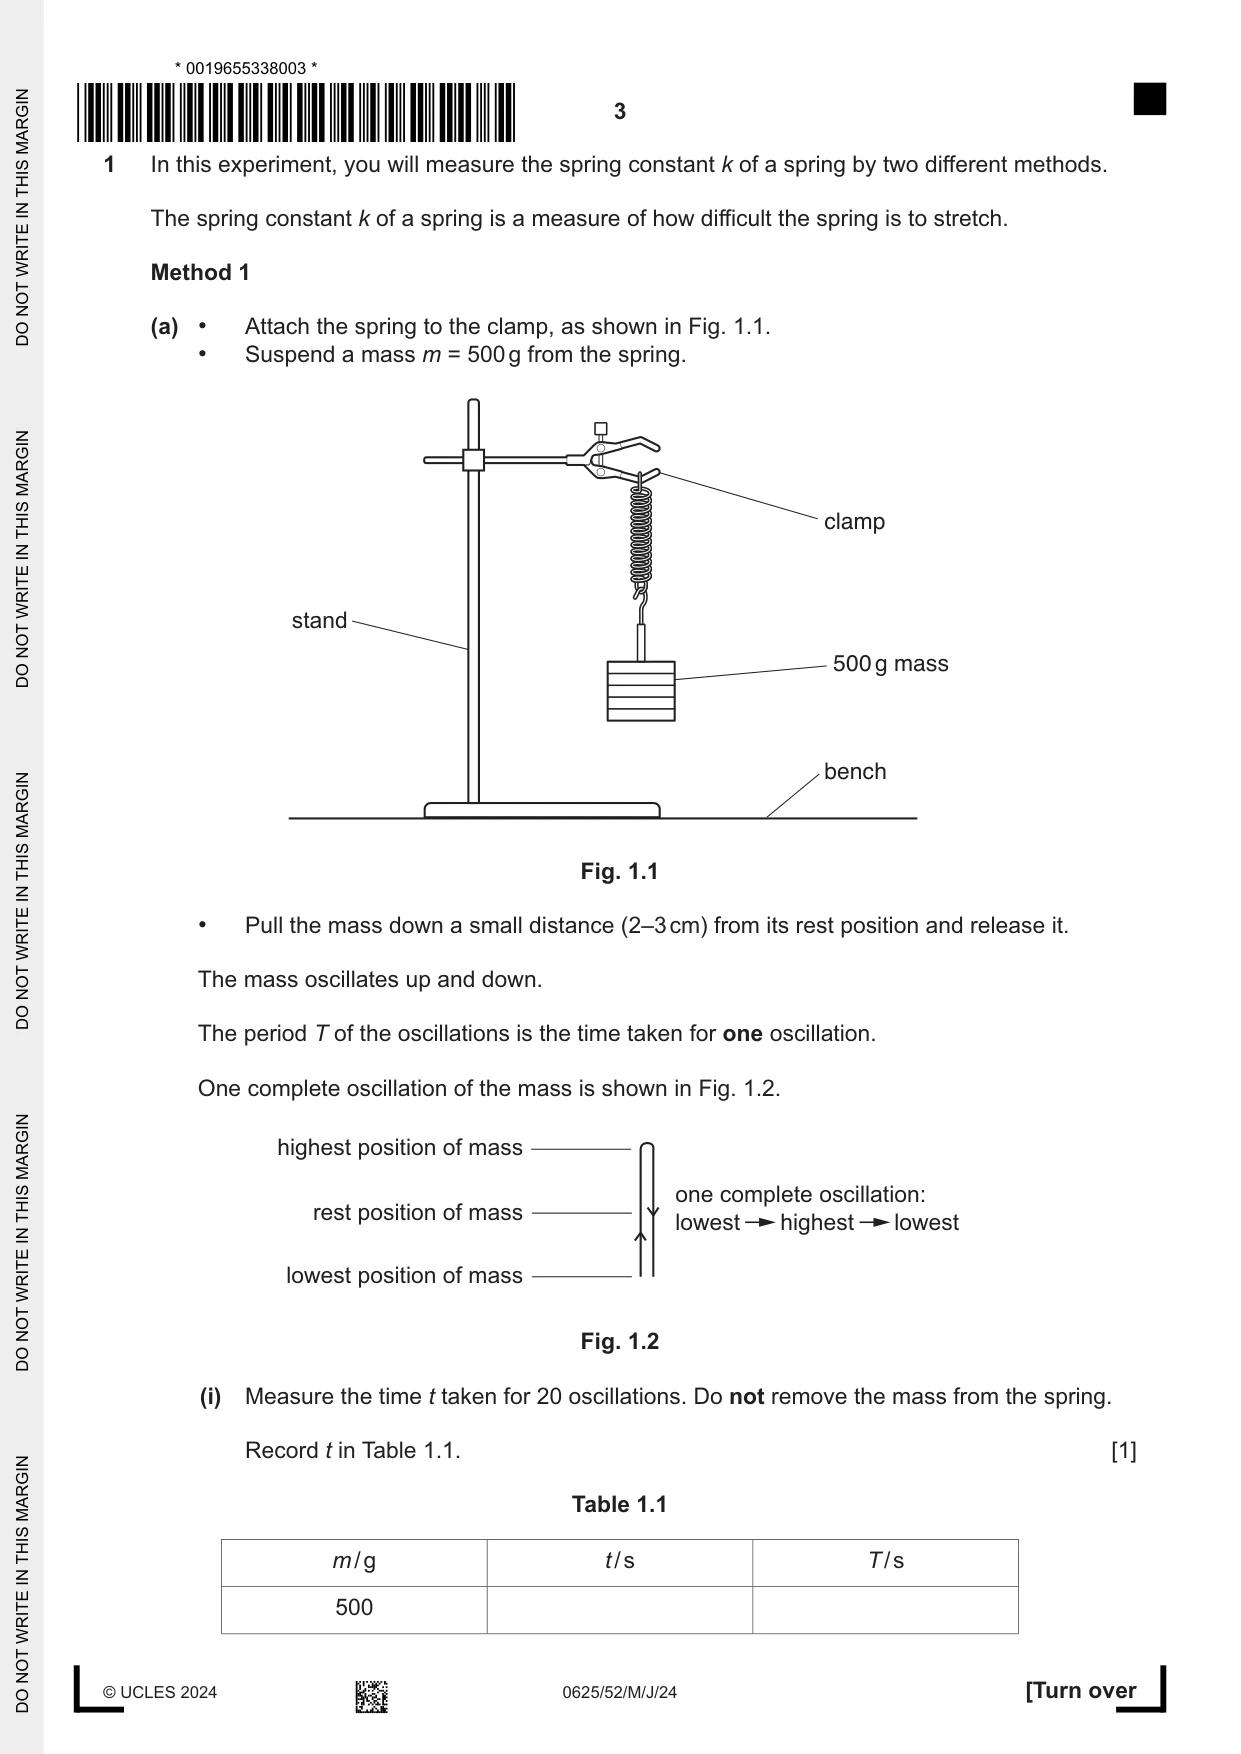
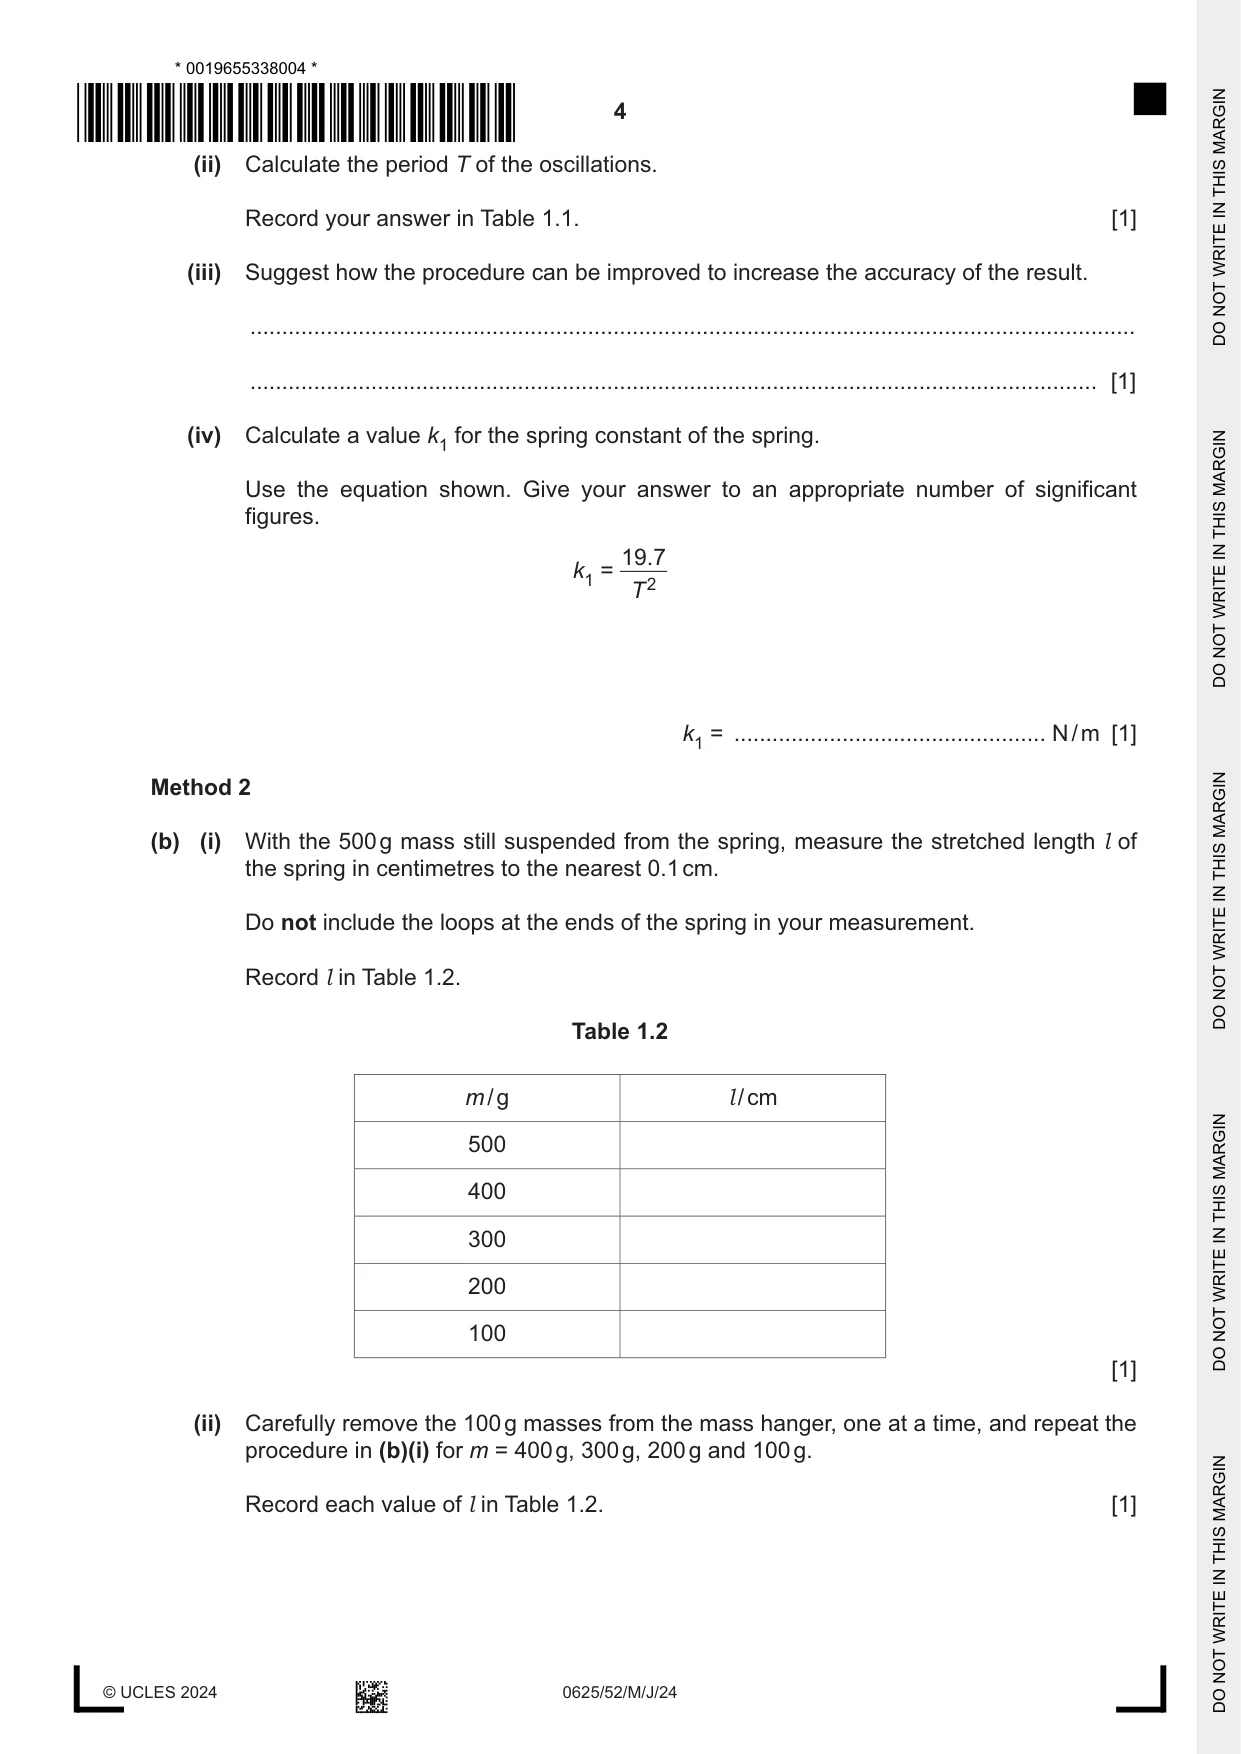
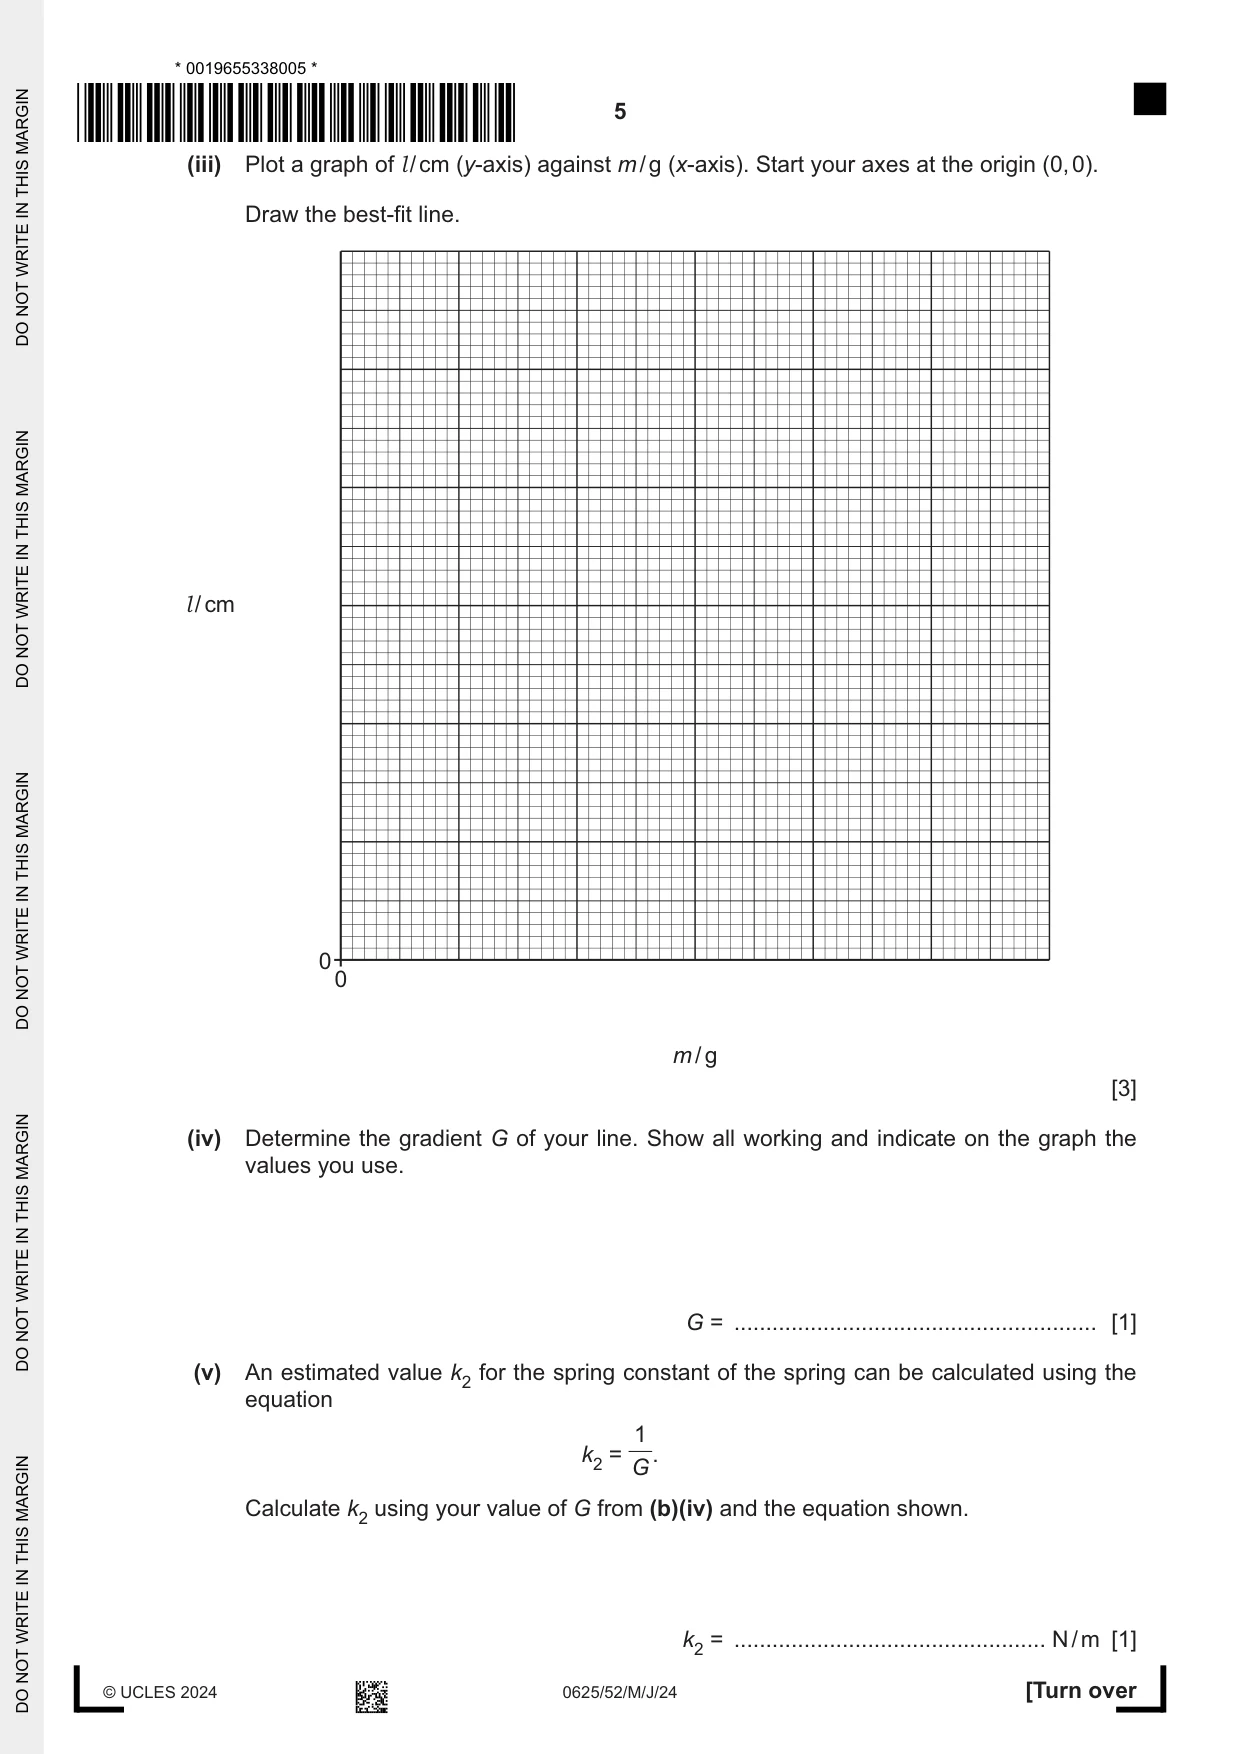
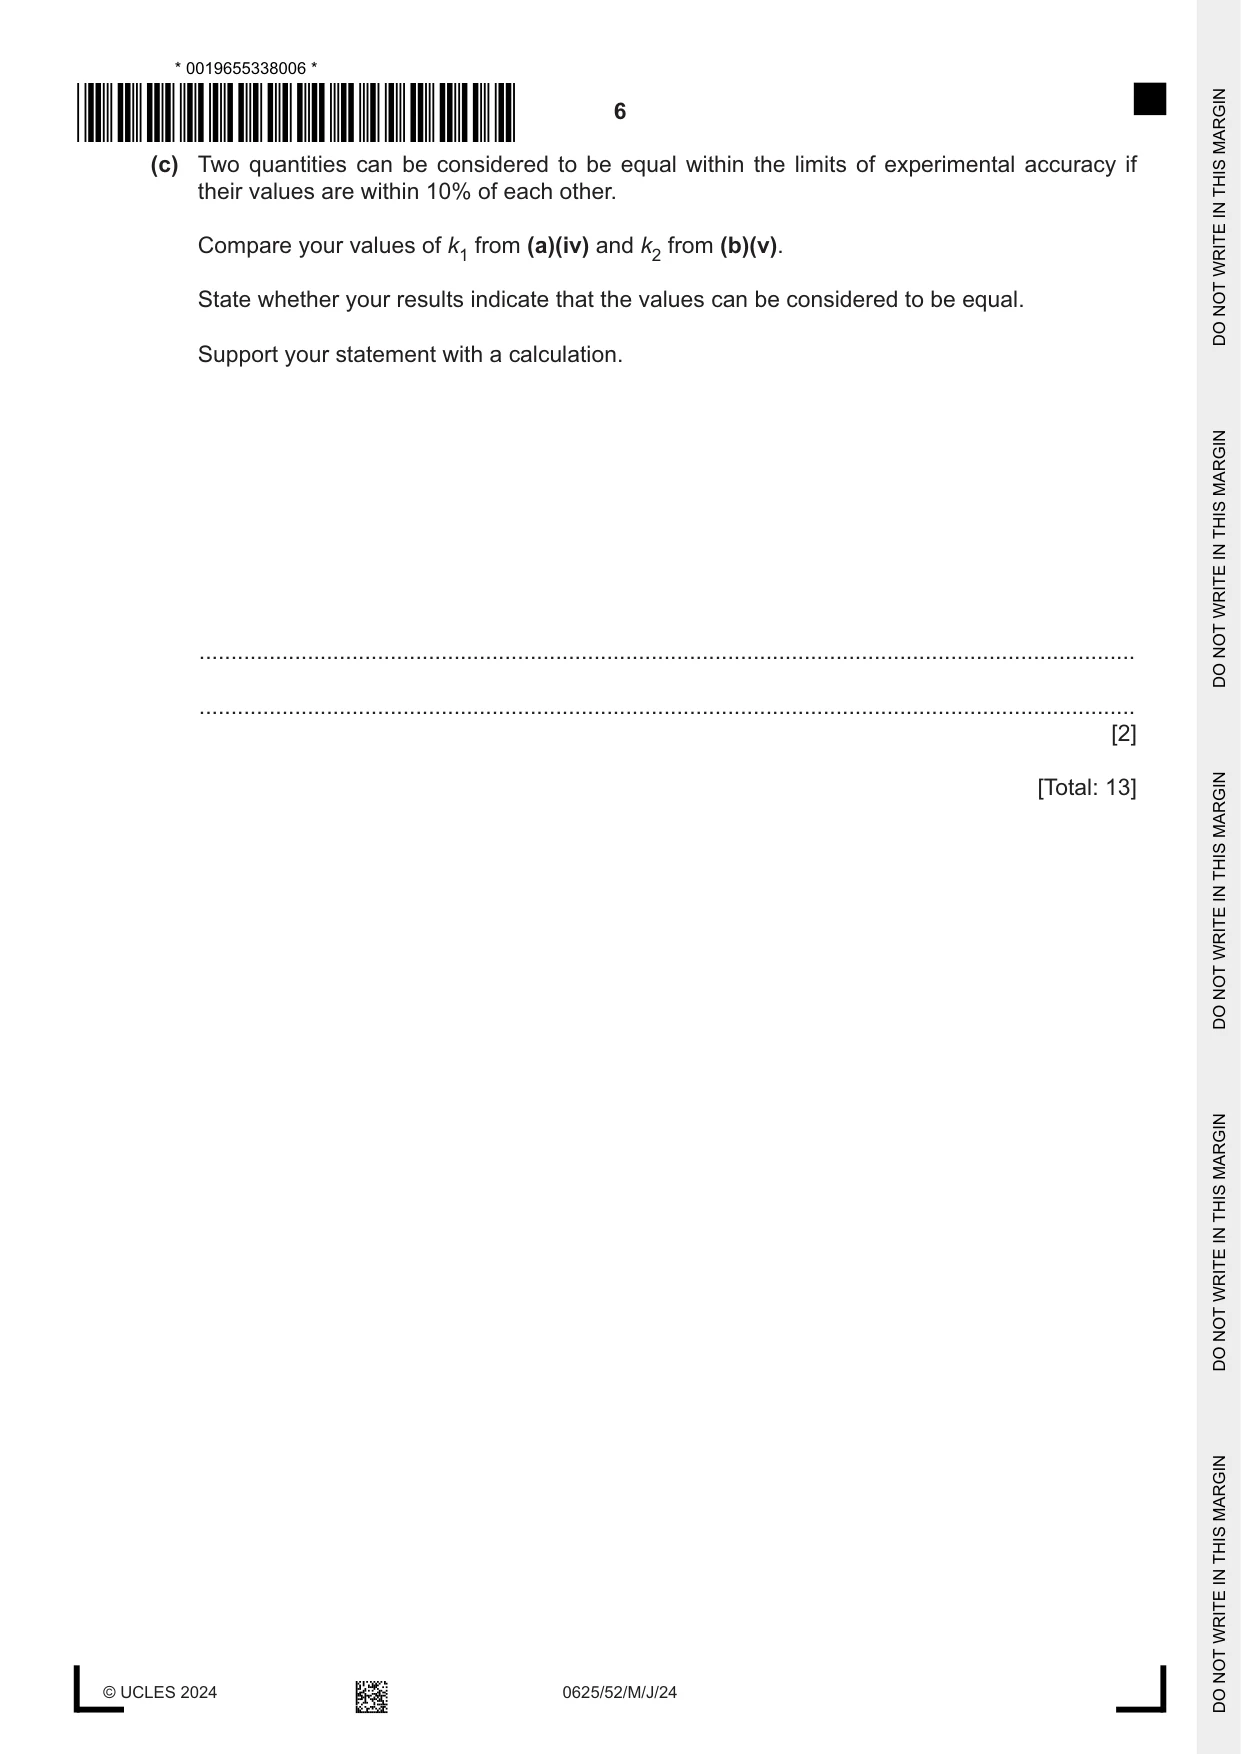
1 In this experiment, you will measure the spring constant k of a spring by two different methods. The spring constant k of a spring is a measure of how difficult the spring is to stretch. Method 1 (a) • Attach the spring to the clamp, as shown in Fig. 1.1. • Suspend a mass m = 500 g from the spring. clamp stand 500 g mass bench Fig. 1.1 • Pull the mass down a small distance (2–3 cm) from its rest position and release it. The mass oscillates up and down. The period T of the oscillations is the time taken for one oscillation. One complete oscillation of the mass is shown in Fig. 1.2. highest position of mass one complete oscillation: rest position of mass lowest highest lowest lowest position of mass Fig. 1.2 (i) Measure the time t taken for 20 oscillations. Do not remove the mass from the spring. Record t in Table 1.1. [1] Table 1.1 m / g t / s T / s 500 (ii) Calculate the period T of the oscillations. Record your answer in Table 1.1. [1] (iii) Suggest how the procedure can be improved to increase the accuracy of the result. ........................................................................................................................................... ..................................................................................................................................... [1] (iv) Calculate a value k1 for the spring constant of the spring. Use the equation shown. Give your answer to an appropriate number of significant figures. 19.7 k1 = T 2 k1 = ................................................. N / m [1] Method 2 (b) (i) With the 500 g mass still suspended from the spring, measure the stretched length l of the spring in centimetres to the nearest 0.1 cm. Do not include the loops at the ends of the spring in your measurement. Record l in Table 1.2. Table 1.2 m / g l / cm 500 400 300 200 100 [1] (ii) Carefully remove the 100 g masses from the mass hanger, one at a time, and repeat the procedure in (b)(i) for m = 400 g, 300 g, 200 g and 100 g. Record each value of l in Table 1.2. [1] (iii) Plot a graph of l / cm (y-axis) against m / g (x-axis). Start your axes at the origin (0, 0). Draw the best-fit line. l / cm 0 0 m / g [3] (iv) Determine the gradient G of your line. Show all working and indicate on the graph the values you use. G = ......................................................... [1] (v) An estimated value k2 for the spring constant of the spring can be calculated using the equation 1 k2 = G. Calculate k2 using your value of G from (b)(iv) and the equation shown. k2 = ................................................. N / m [1] (c) Two quantities can be considered to be equal within the limits of experimental accuracy if their values are within 10% of each other. Compare your values of k1 from (a)(iv) and k2 from (b)(v). State whether your results indicate that the values can be considered to be equal. Support your statement with a calculation. ................................................................................................................................................... ................................................................................................................................................... [2] [Total: 13]
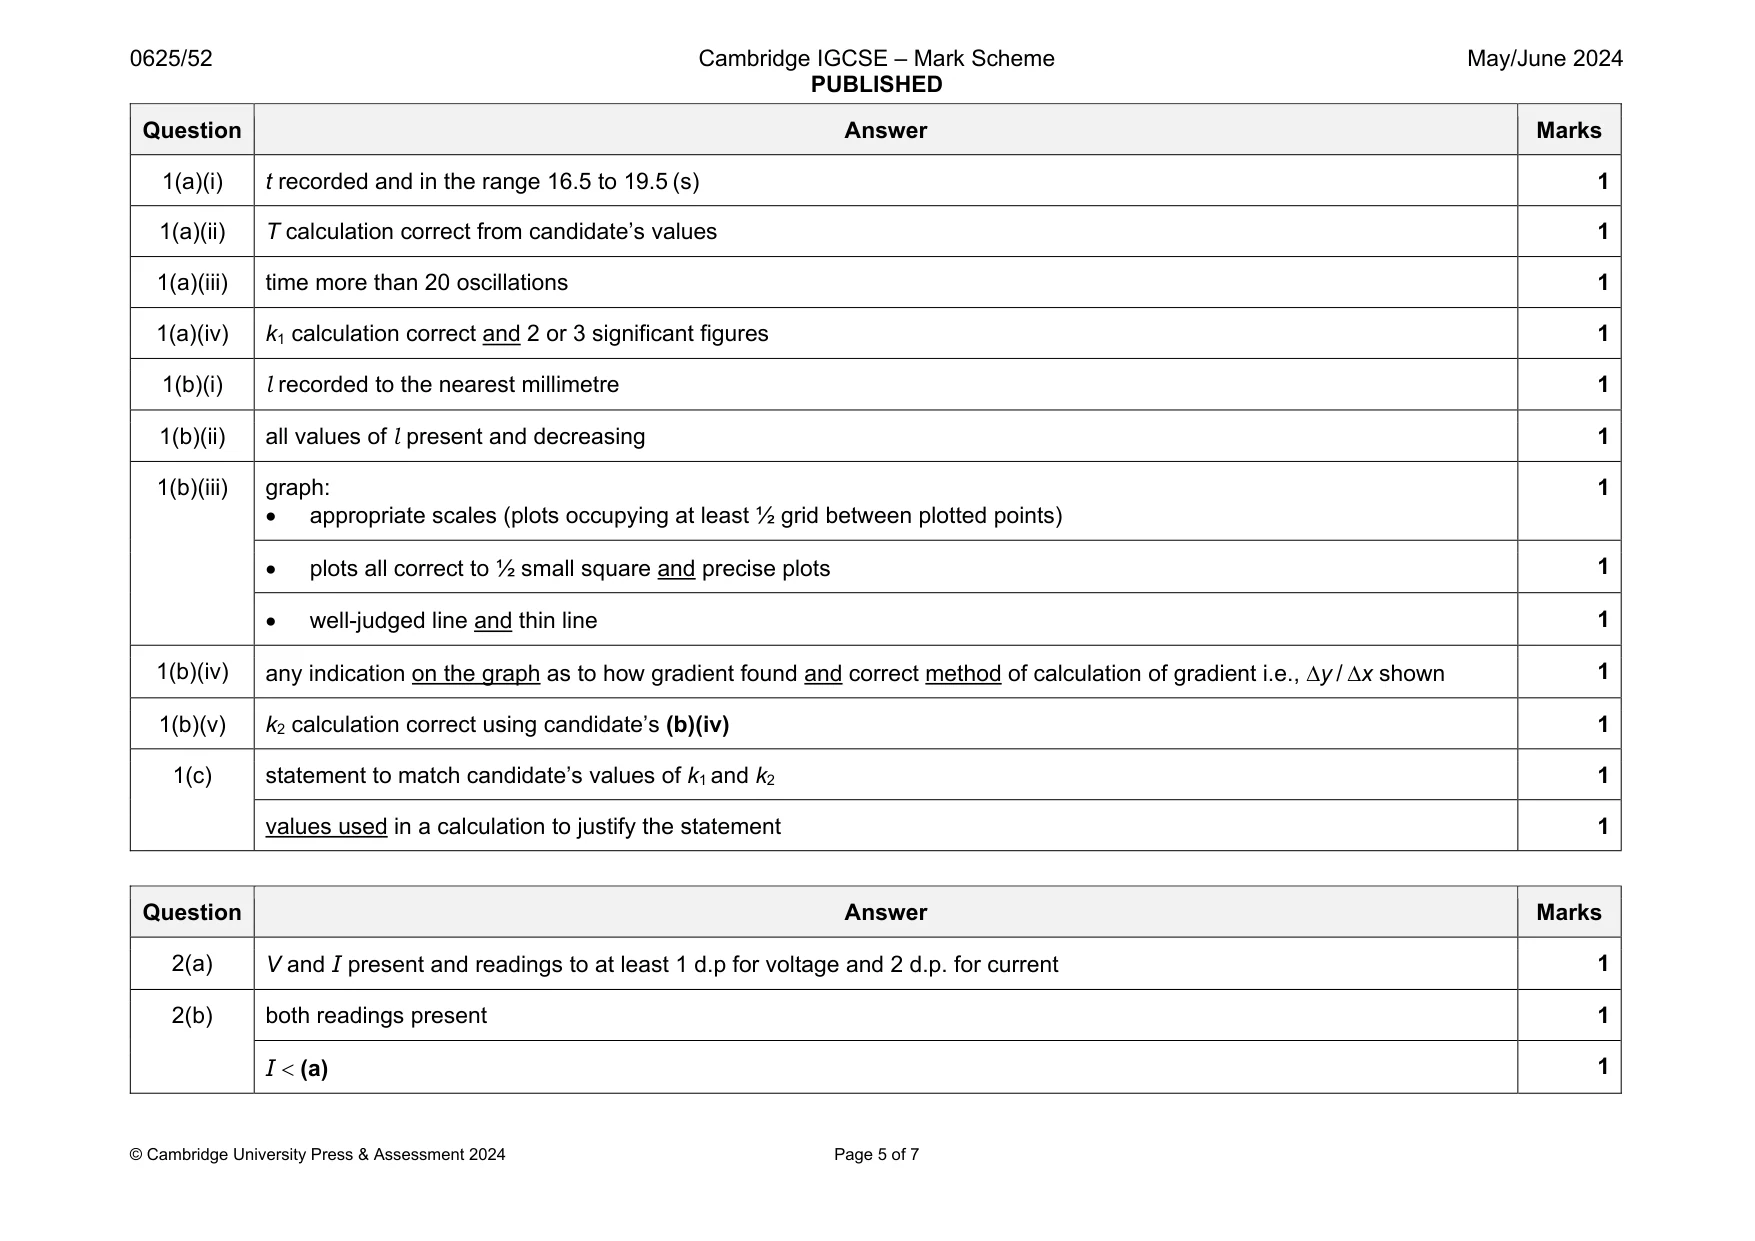
Mark scheme: 1(a)(i) t recorded and in the range 16.5 to 19.5 (s) 1 1(a)(ii) T calculation correct from candidate’s values 1 1(a)(iii) time more than 20 oscillations 1 1(a)(iv) k1 calculation correct and 2 or 3 significant figures 1 1(b)(i) l recorded to the nearest millimetre 1 1(b)(ii) all values of l present and decreasing 1 1(b)(iii) graph: appropriate scales (plots occupying at least ½ grid between plotted points) 1 plots all correct to ½ small square and precise plots 1 well-judged line and thin line 1 1(b)(iv) any indication on the graph as to how gradient found and correct method of calculation of gradient i.e., y / x shown 1 1(b)(v) k2 calculation correct using candidate’s (b)(iv) 1 1(c) statement to match candidate’s values of k1 and k2 1 values used in a calculation to justify the statement 1
More questions on Physical quantities and measurement techniques
Q2 · In this experiment, you will investigate the resistance R of a diode using the circuit…
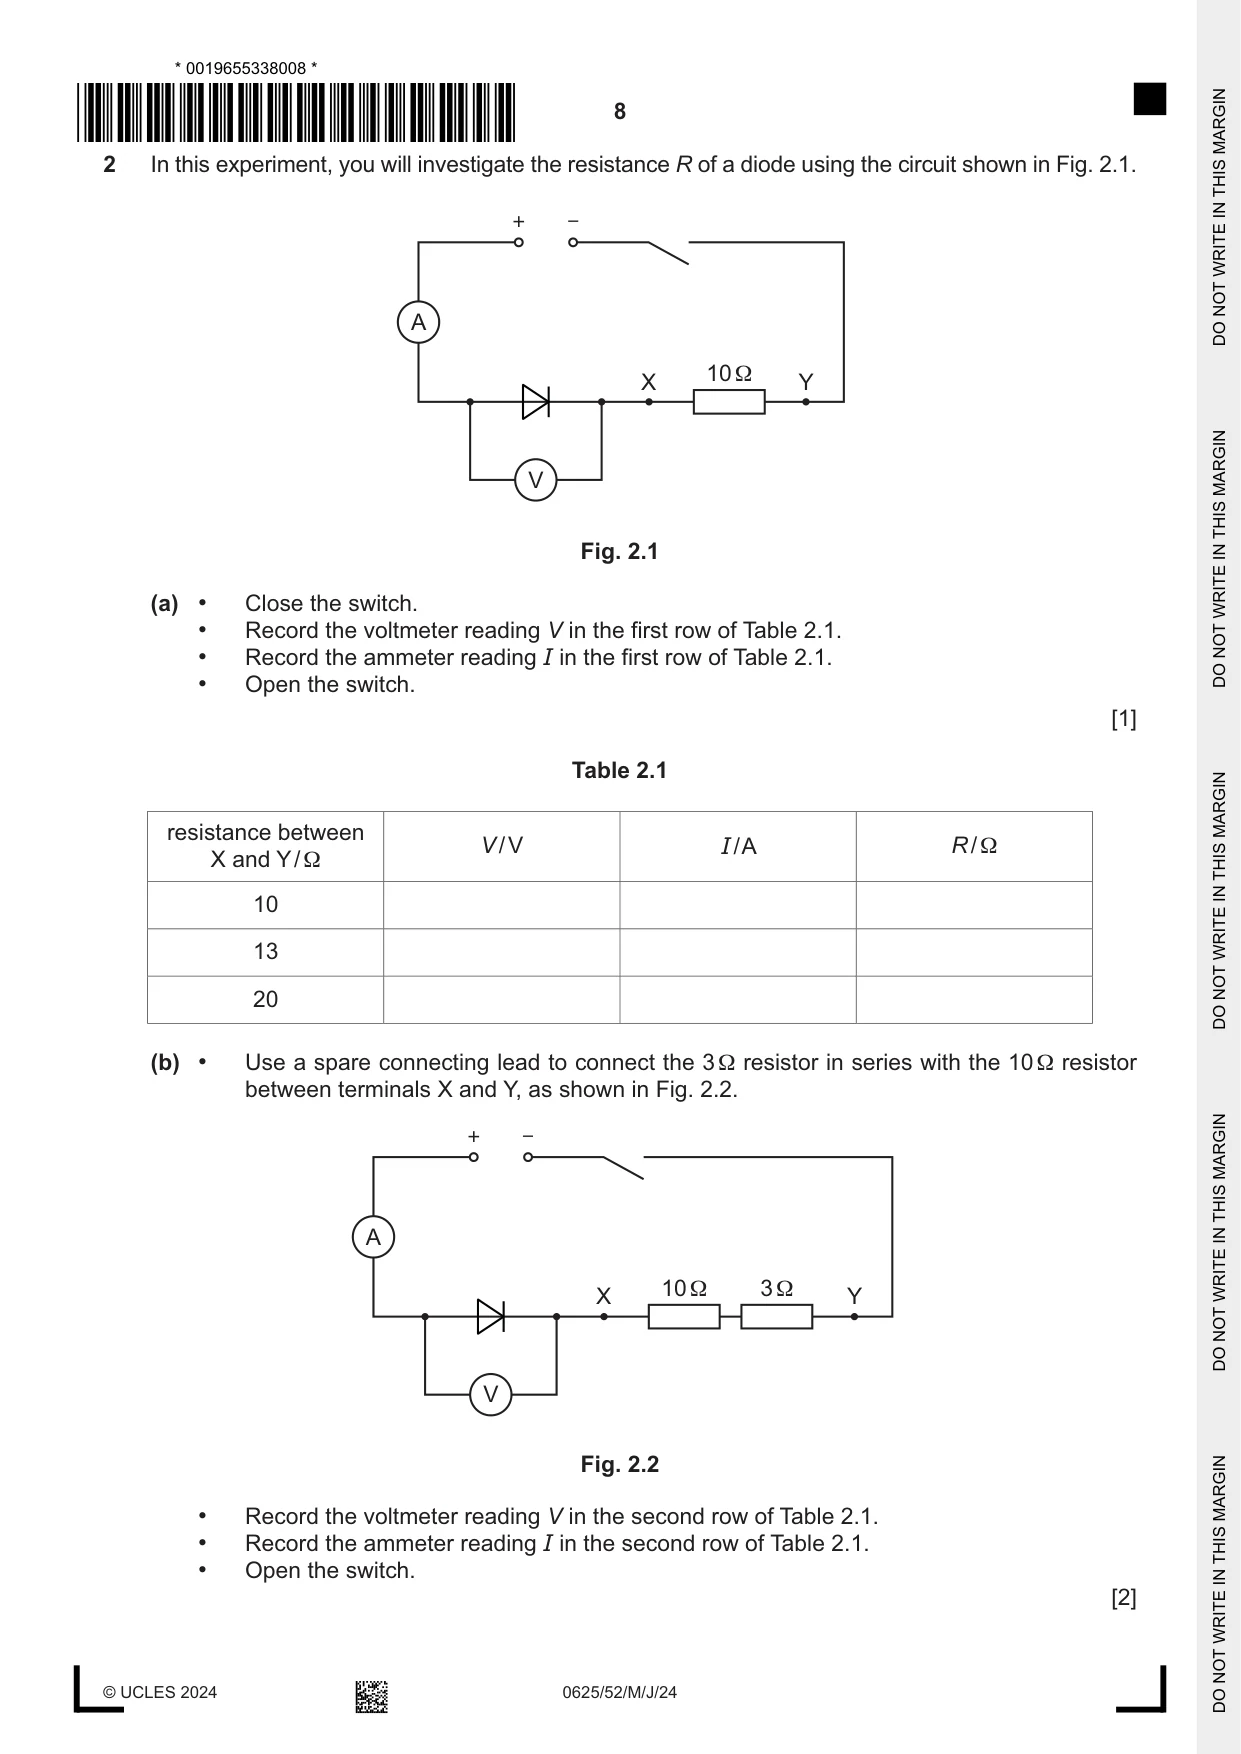
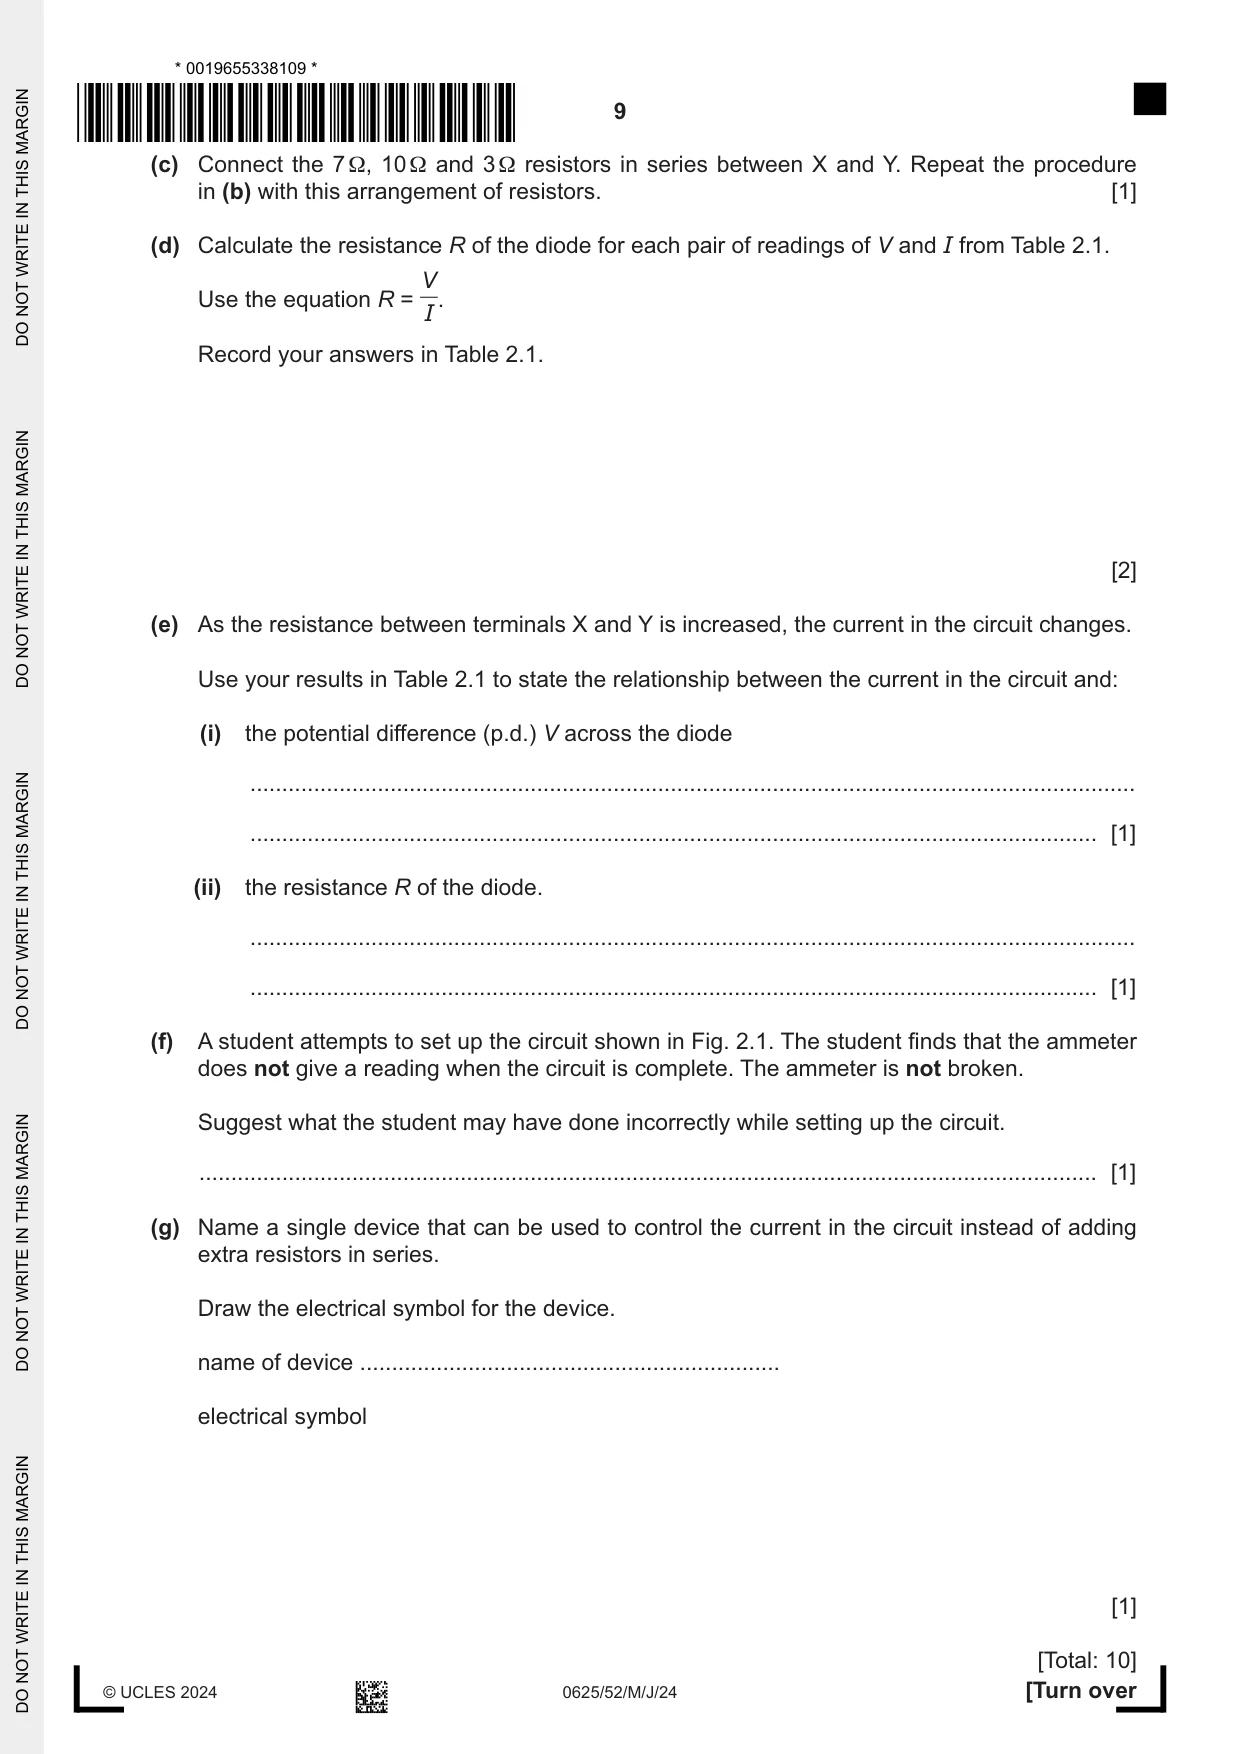
2 In this experiment, you will investigate the resistance R of a diode using the circuit shown in Fig. 2.1. + – A 10 Ω X Y V Fig. 2.1 (a) • Close the switch. • Record the voltmeter reading V in the first row of Table 2.1. • Record the ammeter reading I in the first row of Table 2.1. • Open the switch. [1] Table 2.1 resistance between V / V I / A R / Ω X and Y / Ω 10 13 20 (b) • Use a spare connecting lead to connect the 3 Ω resistor in series with the 10 Ω resistor between terminals X and Y, as shown in Fig. 2.2. + – A 10 Ω 3 Ω X Y V Fig. 2.2 • Record the voltmeter reading V in the second row of Table 2.1. • Record the ammeter reading I in the second row of Table 2.1. • Open the switch. [2] (c) Connect the 7 Ω, 10 Ω and 3 Ω resistors in series between X and Y. Repeat the procedure in (b) with this arrangement of resistors. [1] (d) Calculate the resistance R of the diode for each pair of readings of V and I from Table 2.1. V Use the equation R = . I Record your answers in Table 2.1. [2] (e) As the resistance between terminals X and Y is increased, the current in the circuit changes. Use your results in Table 2.1 to state the relationship between the current in the circuit and: (i) the potential difference (p.d.) V across the diode ........................................................................................................................................... ..................................................................................................................................... [1] (ii) the resistance R of the diode. ........................................................................................................................................... ..................................................................................................................................... [1] (f) A student attempts to set up the circuit shown in Fig. 2.1. The student finds that the ammeter does not give a reading when the circuit is complete. The ammeter is not broken. Suggest what the student may have done incorrectly while setting up the circuit. ............................................................................................................................................. [1] (g) Name a single device that can be used to control the current in the circuit instead of adding extra resistors in series. Draw the electrical symbol for the device. name of device .................................................................. electrical symbol [1] [Total: 10]
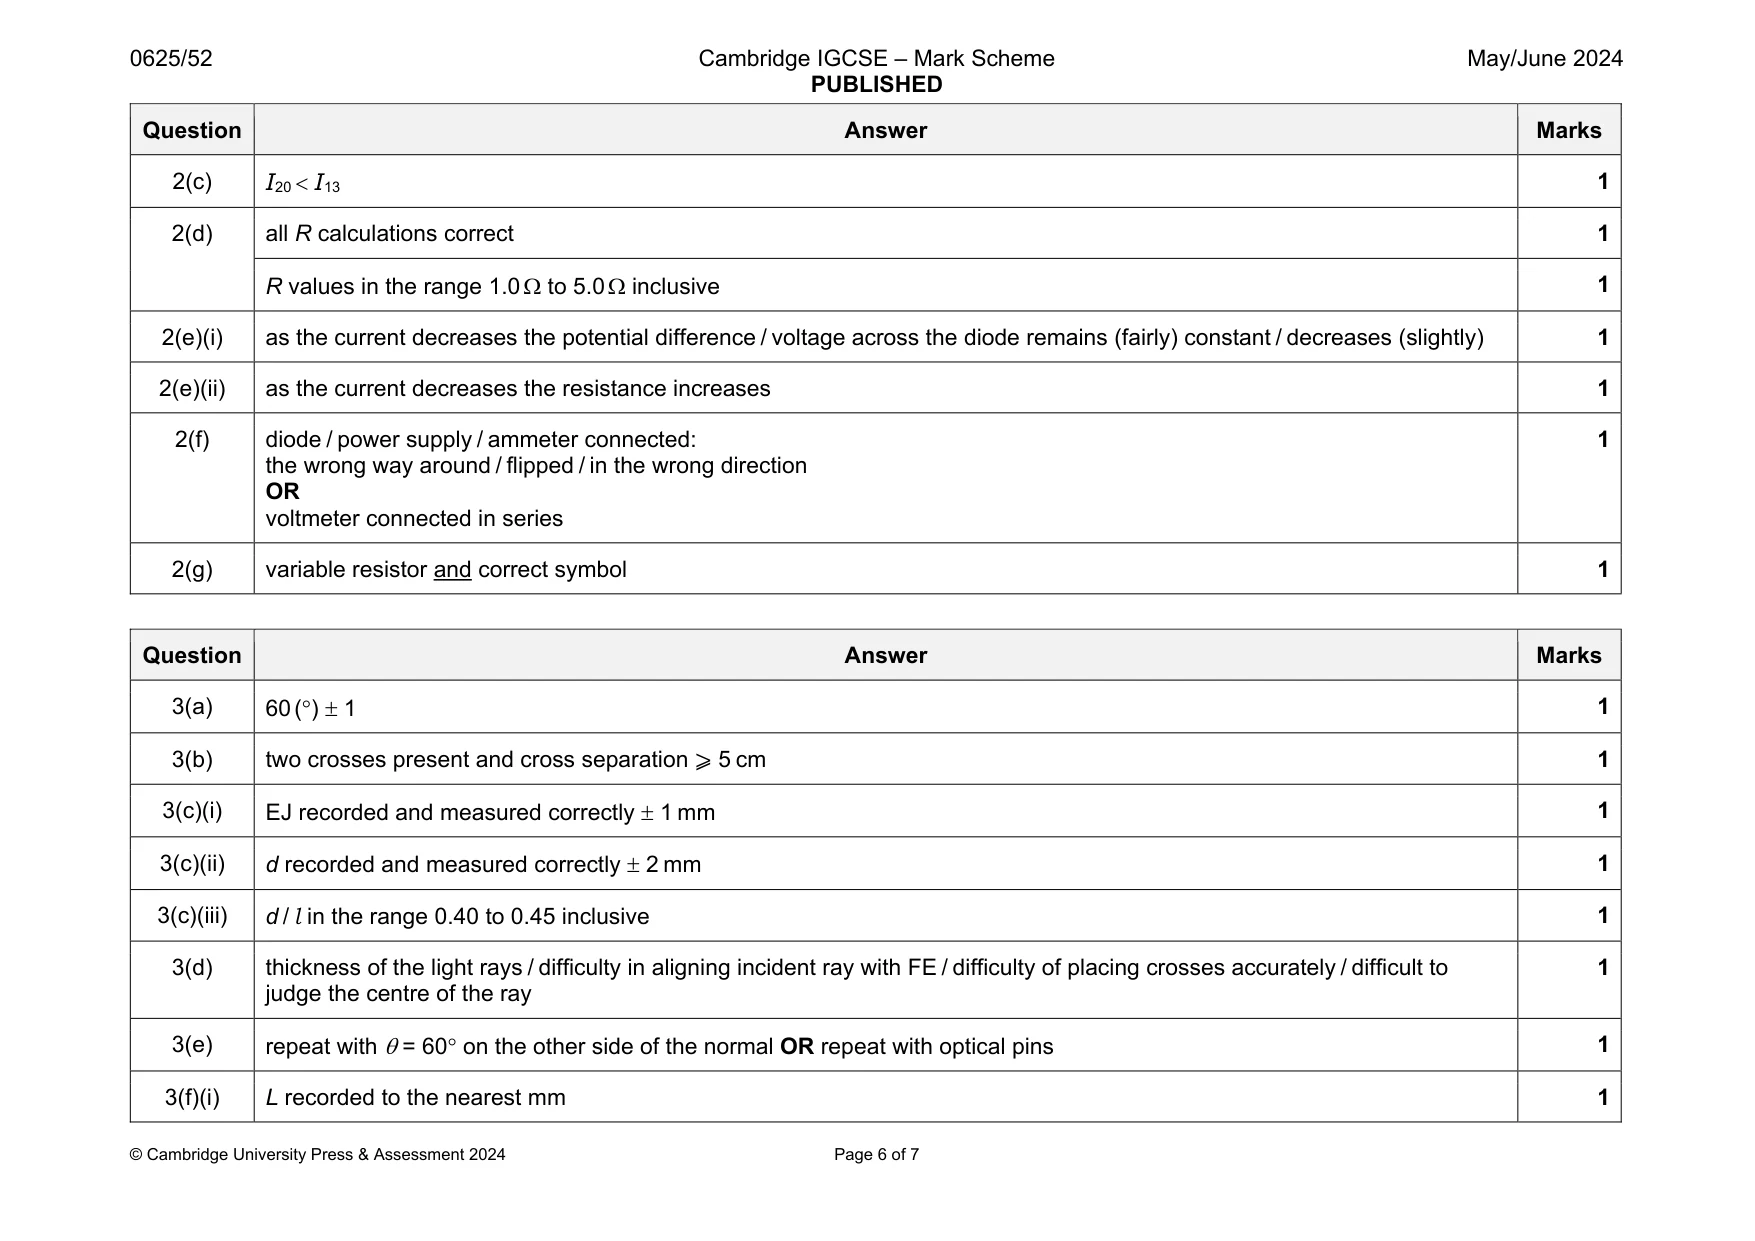
Mark scheme: 2(a) 1 2(b) both readings present 1 I (a) 1 Question Answer Marks 2(c) I20 I13 1 2(d) all R calculations correct 1 R values in the range 1.0 to 5.0 inclusive 1 2(e)(i) as the current decreases the potential difference / voltage across the diode remains (fairly) constant / decreases (slightly) 1 2(e)(ii) as the current decreases the resistance increases 1 2(f) diode / power supply / ammeter connected: the wrong way around / flipped / in the wrong direction OR voltmeter connected in series 1 2(g) variable resistor and correct symbol 1
Q3 · In this experiment, you will investigate the deviation of a ray of light passing through…
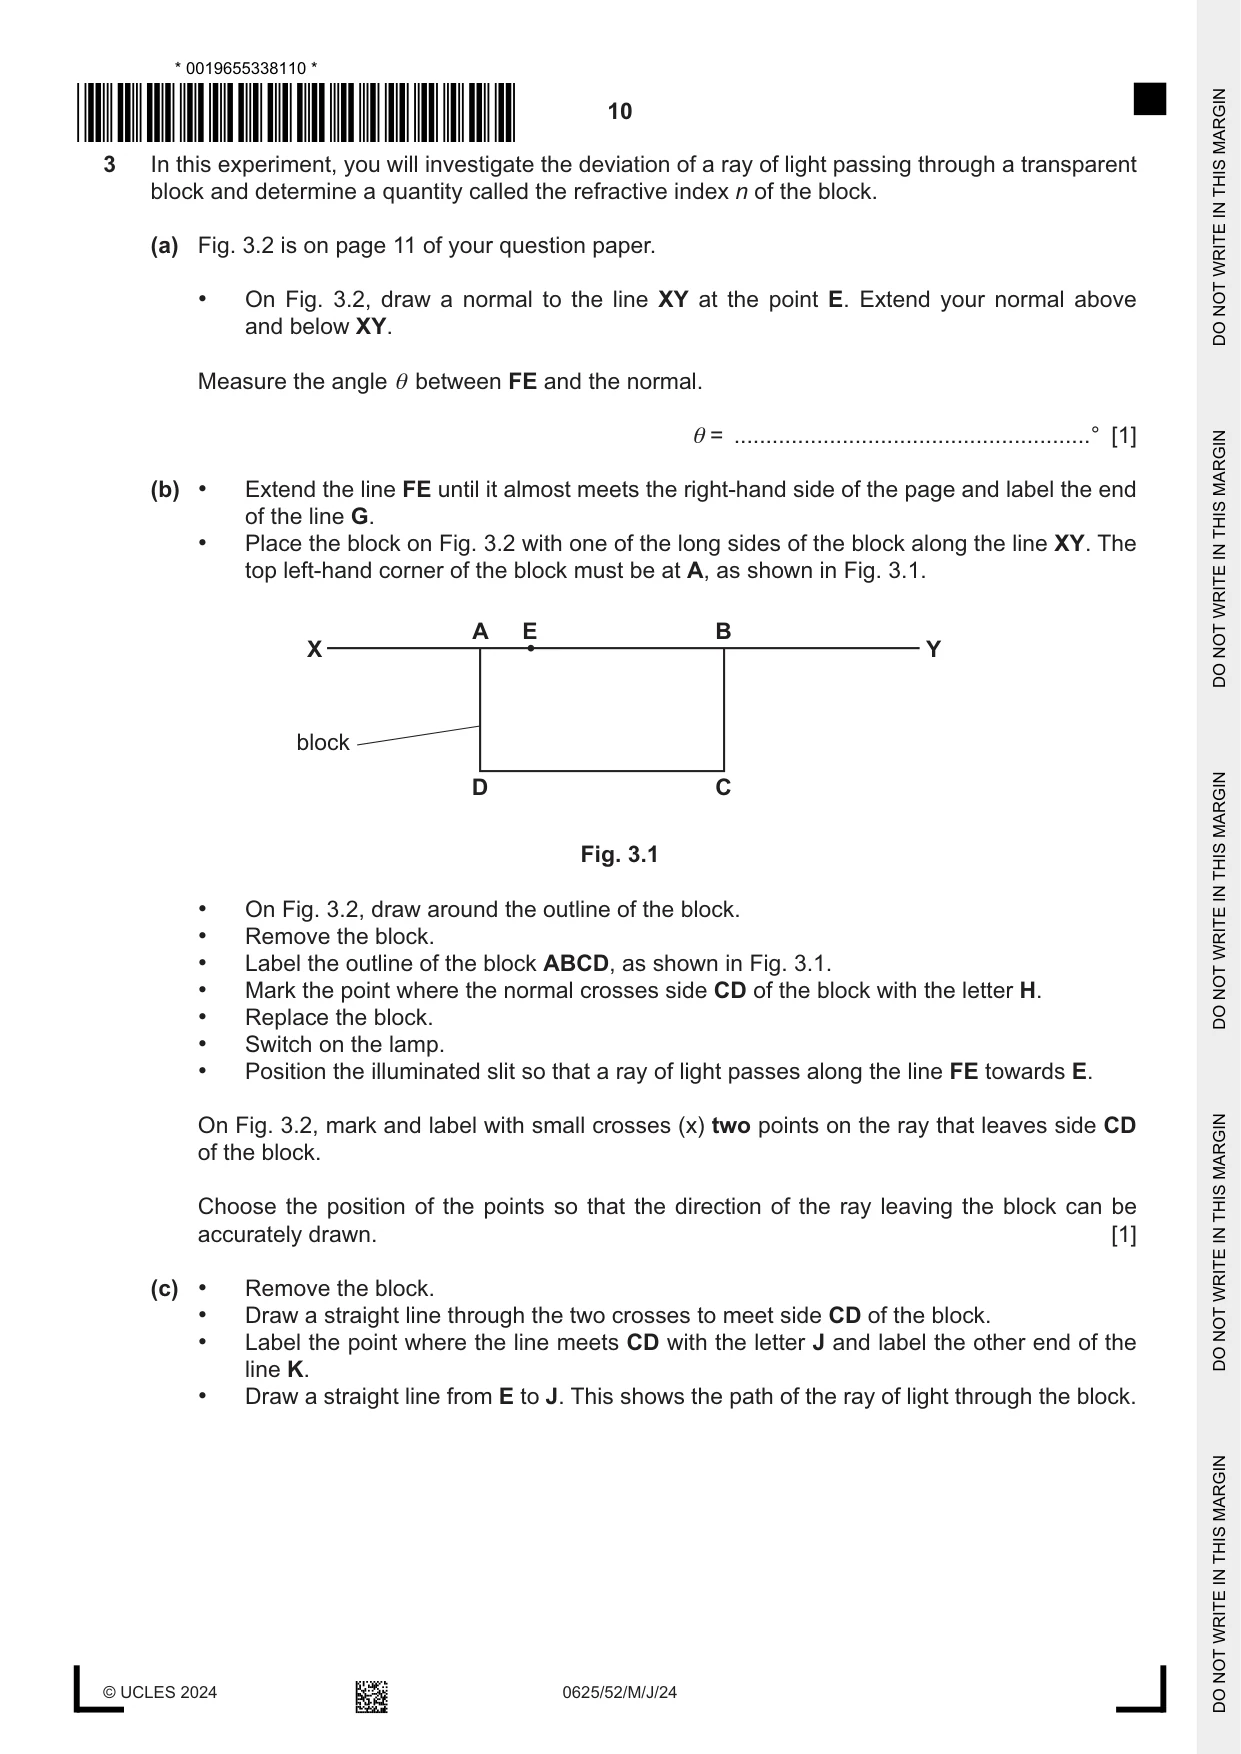
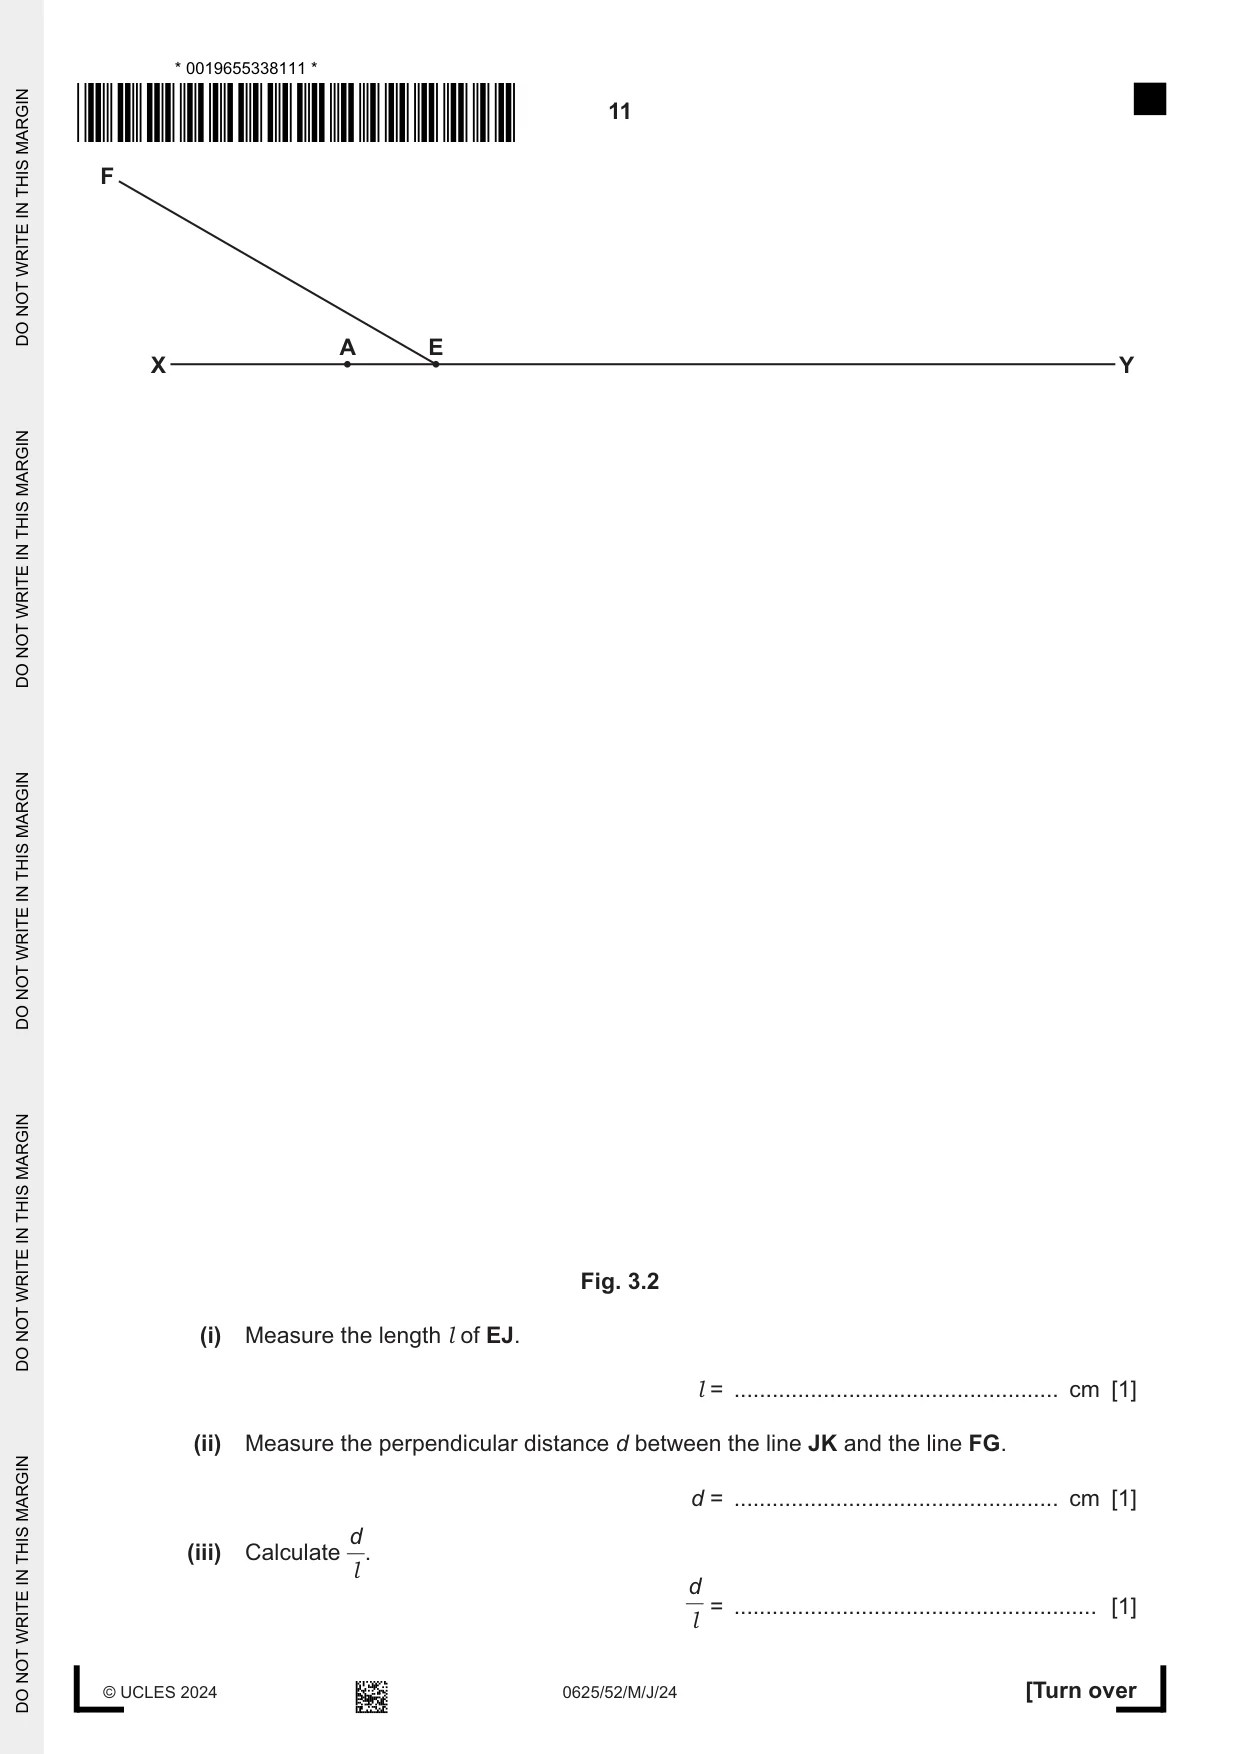
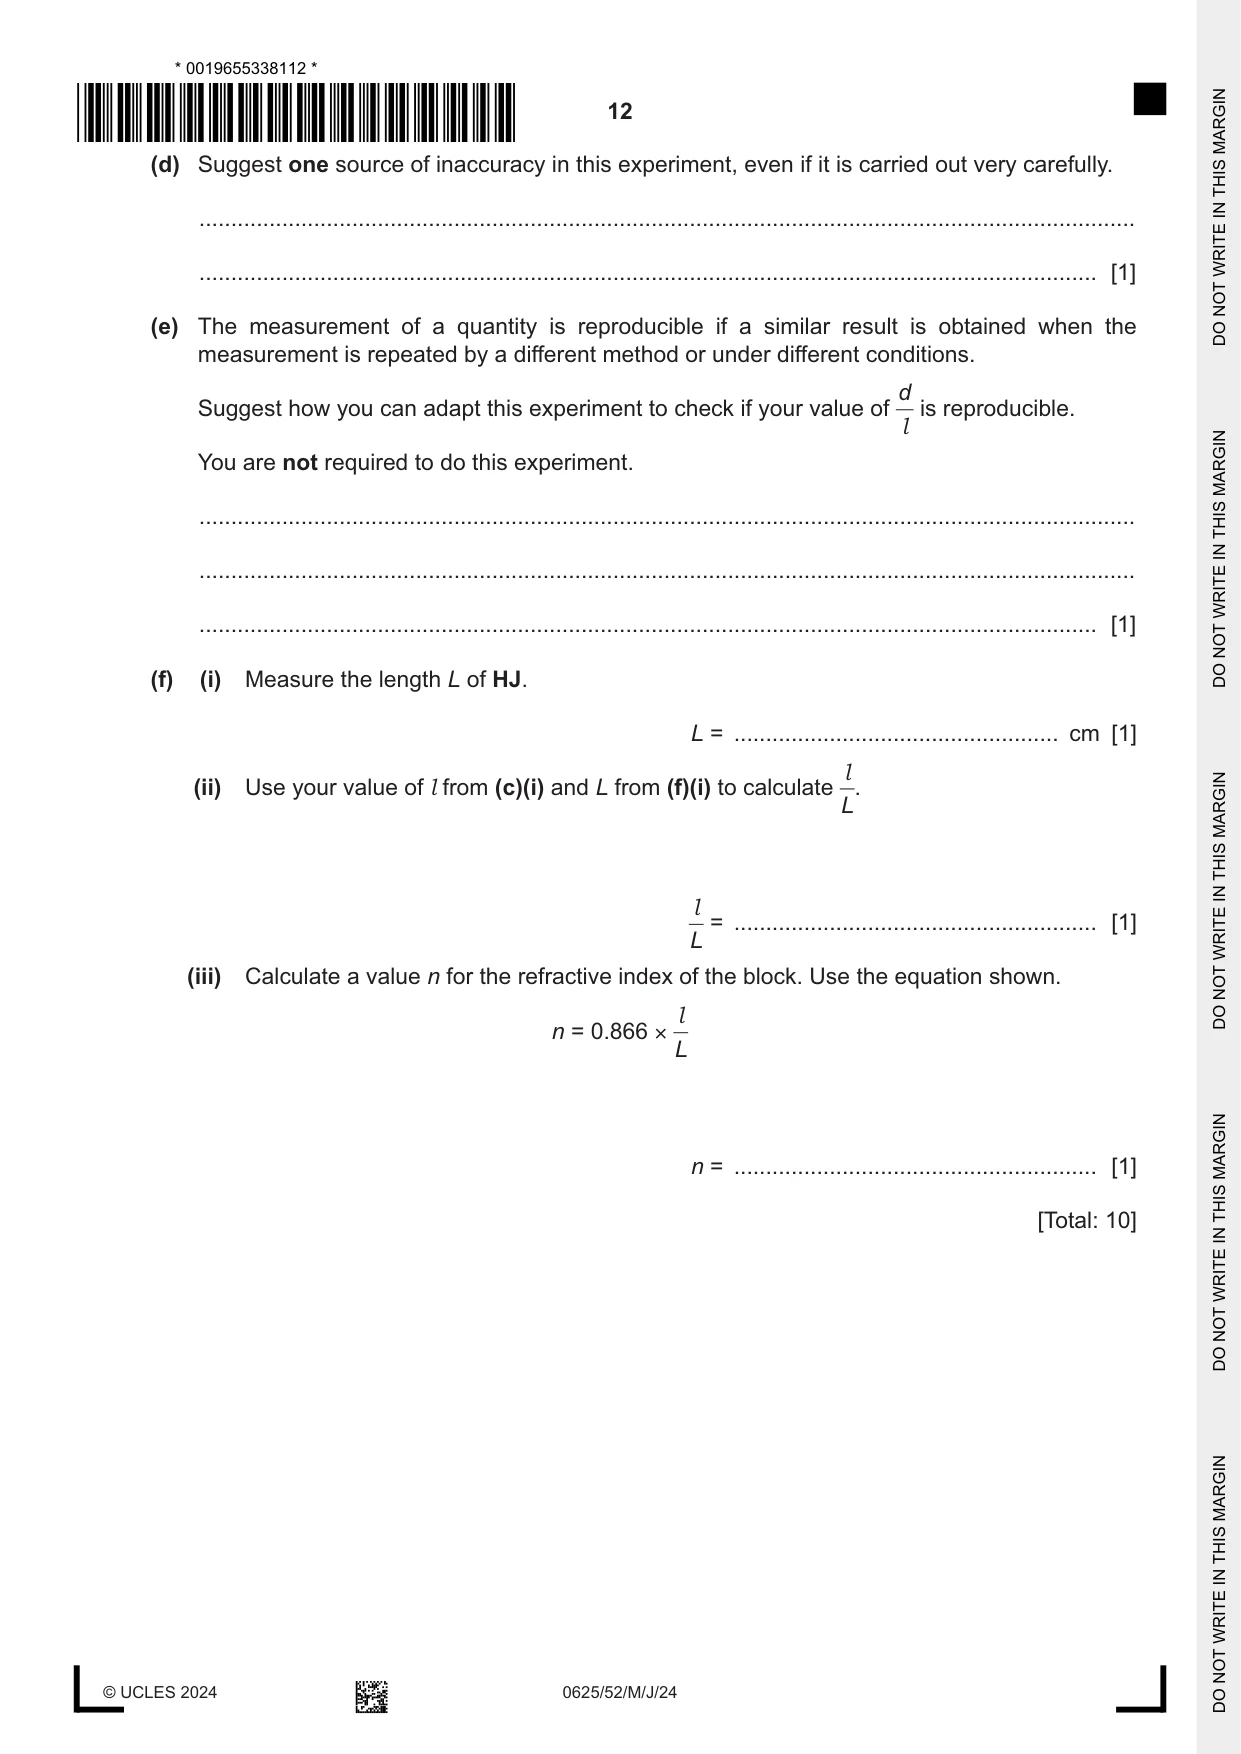
3 In this experiment, you will investigate the deviation of a ray of light passing through a transparent block and determine a quantity called the refractive index n of the block. (a) Fig. 3.2 is on page 11 of your question paper. • On Fig. 3.2, draw a normal to the line XY at the point E. Extend your normal above and below XY. Measure the angle θ between FE and the normal. θ = ........................................................° [1] (b) • Extend the line FE until it almost meets the right-hand side of the page and label the end of the line G. • Place the block on Fig. 3.2 with one of the long sides of the block along the line XY. The top left-hand corner of the block must be at A, as shown in Fig. 3.1. A E B X Y block D C Fig. 3.1 • On Fig. 3.2, draw around the outline of the block. • Remove the block. • Label the outline of the block ABCD, as shown in Fig. 3.1. • Mark the point where the normal crosses side CD of the block with the letter H. • Replace the block. • Switch on the lamp. • Position the illuminated slit so that a ray of light passes along the line FE towards E. On Fig. 3.2, mark and label with small crosses (x) two points on the ray that leaves side CD of the block. Choose the position of the points so that the direction of the ray leaving the block can be accurately drawn. [1] (c) • Remove the block. • Draw a straight line through the two crosses to meet side CD of the block. • Label the point where the line meets CD with the letter J and label the other end of the line K. • Draw a straight line from E to J. This shows the path of the ray of light through the block. F A E X Y Fig. 3.2 (i) Measure the length l of EJ. l = ................................................... cm [1] (ii) Measure the perpendicular distance d between the line JK and the line FG. d = ................................................... cm [1] d (iii) Calculate . l d = ......................................................... [1] l (d) Suggest one source of inaccuracy in this experiment, even if it is carried out very carefully. ................................................................................................................................................... ............................................................................................................................................. [1] (e) The measurement of a quantity is reproducible if a similar result is obtained when the measurement is repeated by a different method or under different conditions. d Suggest how you can adapt this experiment to check if your value of is reproducible. l You are not required to do this experiment. ................................................................................................................................................... ................................................................................................................................................... ............................................................................................................................................. [1] (f) (i) Measure the length L of HJ. L = ................................................... cm [1] l (ii) Use your value of l from (c)(i) and L from (f)(i) to calculate L. l = ......................................................... [1] L (iii) Calculate a value n for the refractive index of the block. Use the equation shown. l n = 0.866 × L n = ......................................................... [1] [Total: 10]
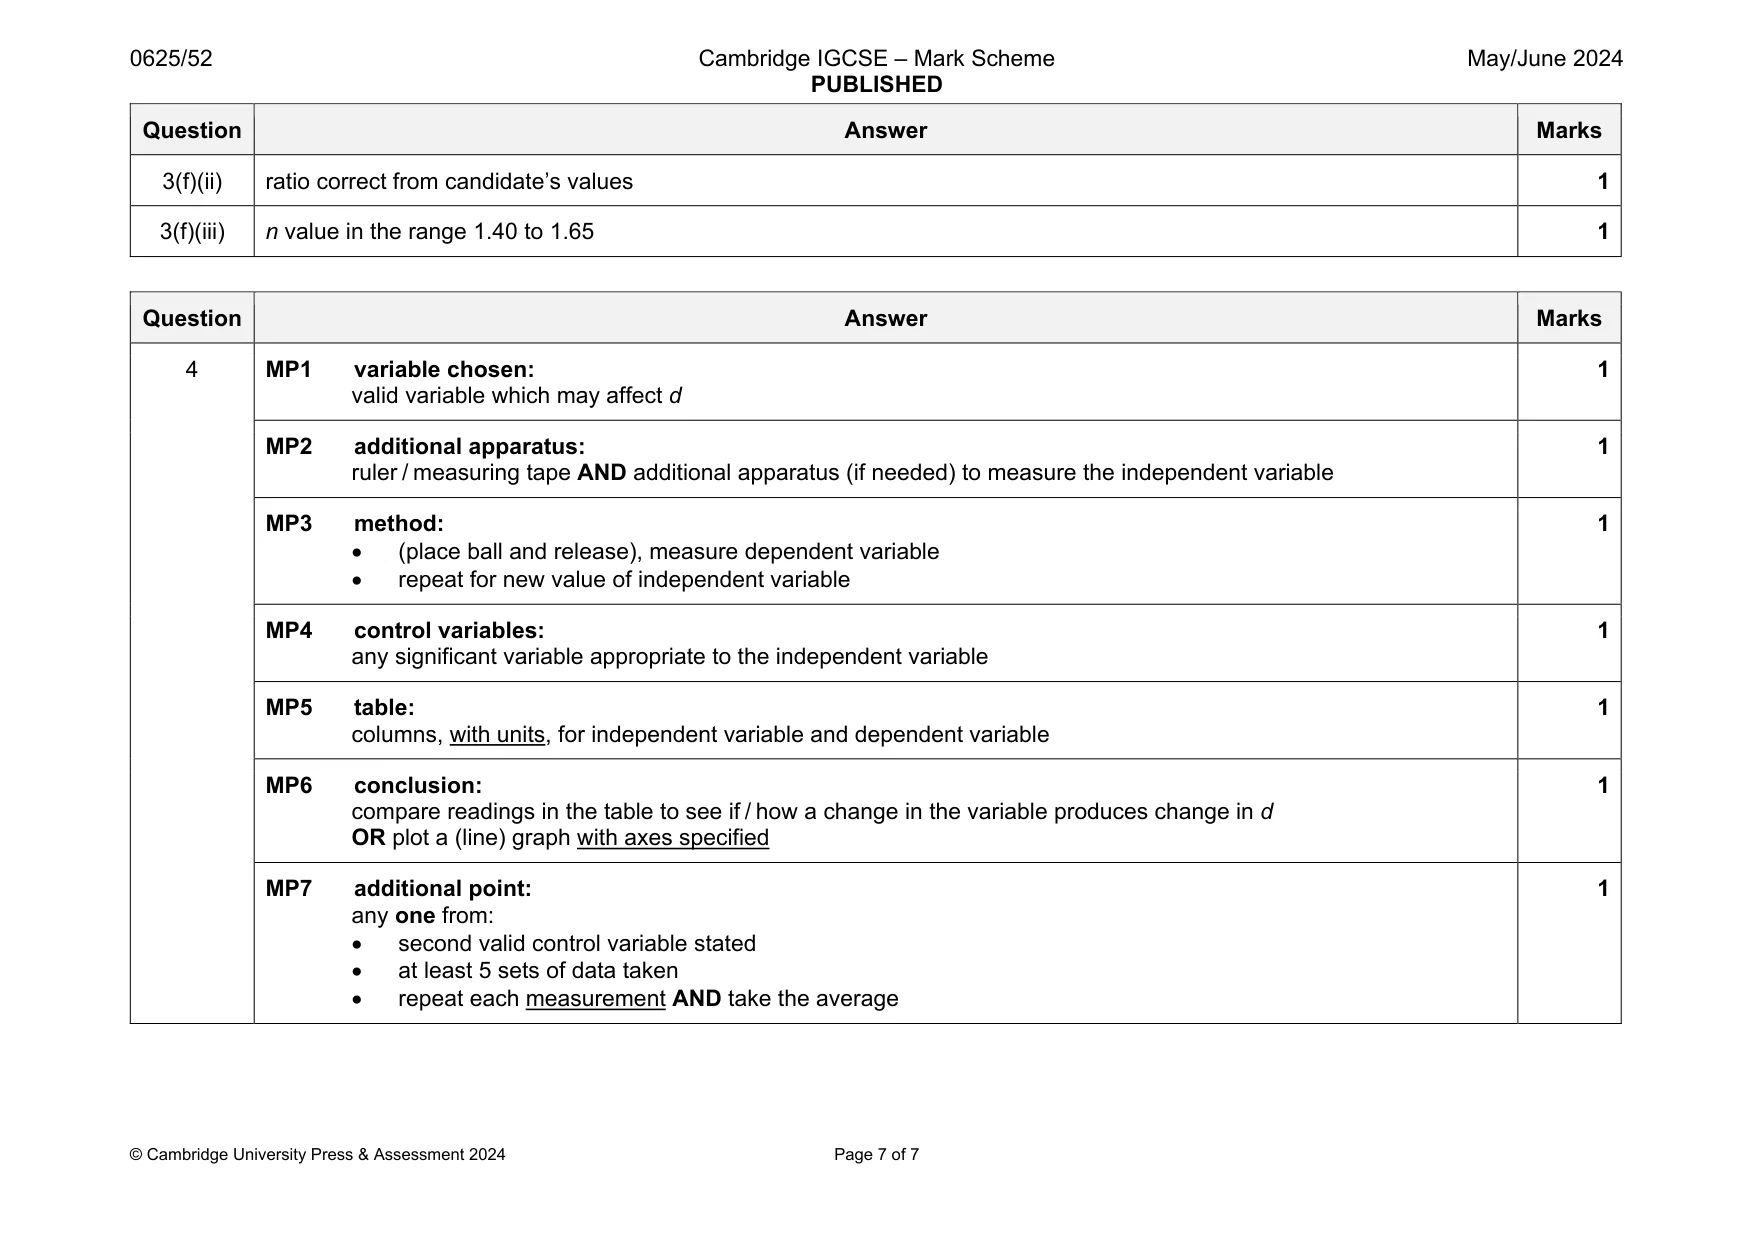
Mark scheme: 3(a) 3(b) two crosses present and cross separation ⩾ 5 cm 1 3(c)(i) EJ recorded and measured correctly 1 mm 1 3(c)(ii) d recorded and measured correctly 2 mm 1 3(c)(iii) d / l in the range 0.40 to 0.45 inclusive 1 3(d) thickness of the light rays / difficulty in aligning incident ray with FE / difficulty of placing crosses accurately / difficult to judge the centre of the ray 1 3(e) repeat with = 60 on the other side of the normal OR repeat with optical pins 1 3(f)(i) L recorded to the nearest mm 1 Question Answer Marks 3(f)(ii) ratio correct from candidate’s values 1 3(f)(iii) n value in the range 1.40 to 1.65 1
Q4 · A student sets up a flexible track at the edge of a bench
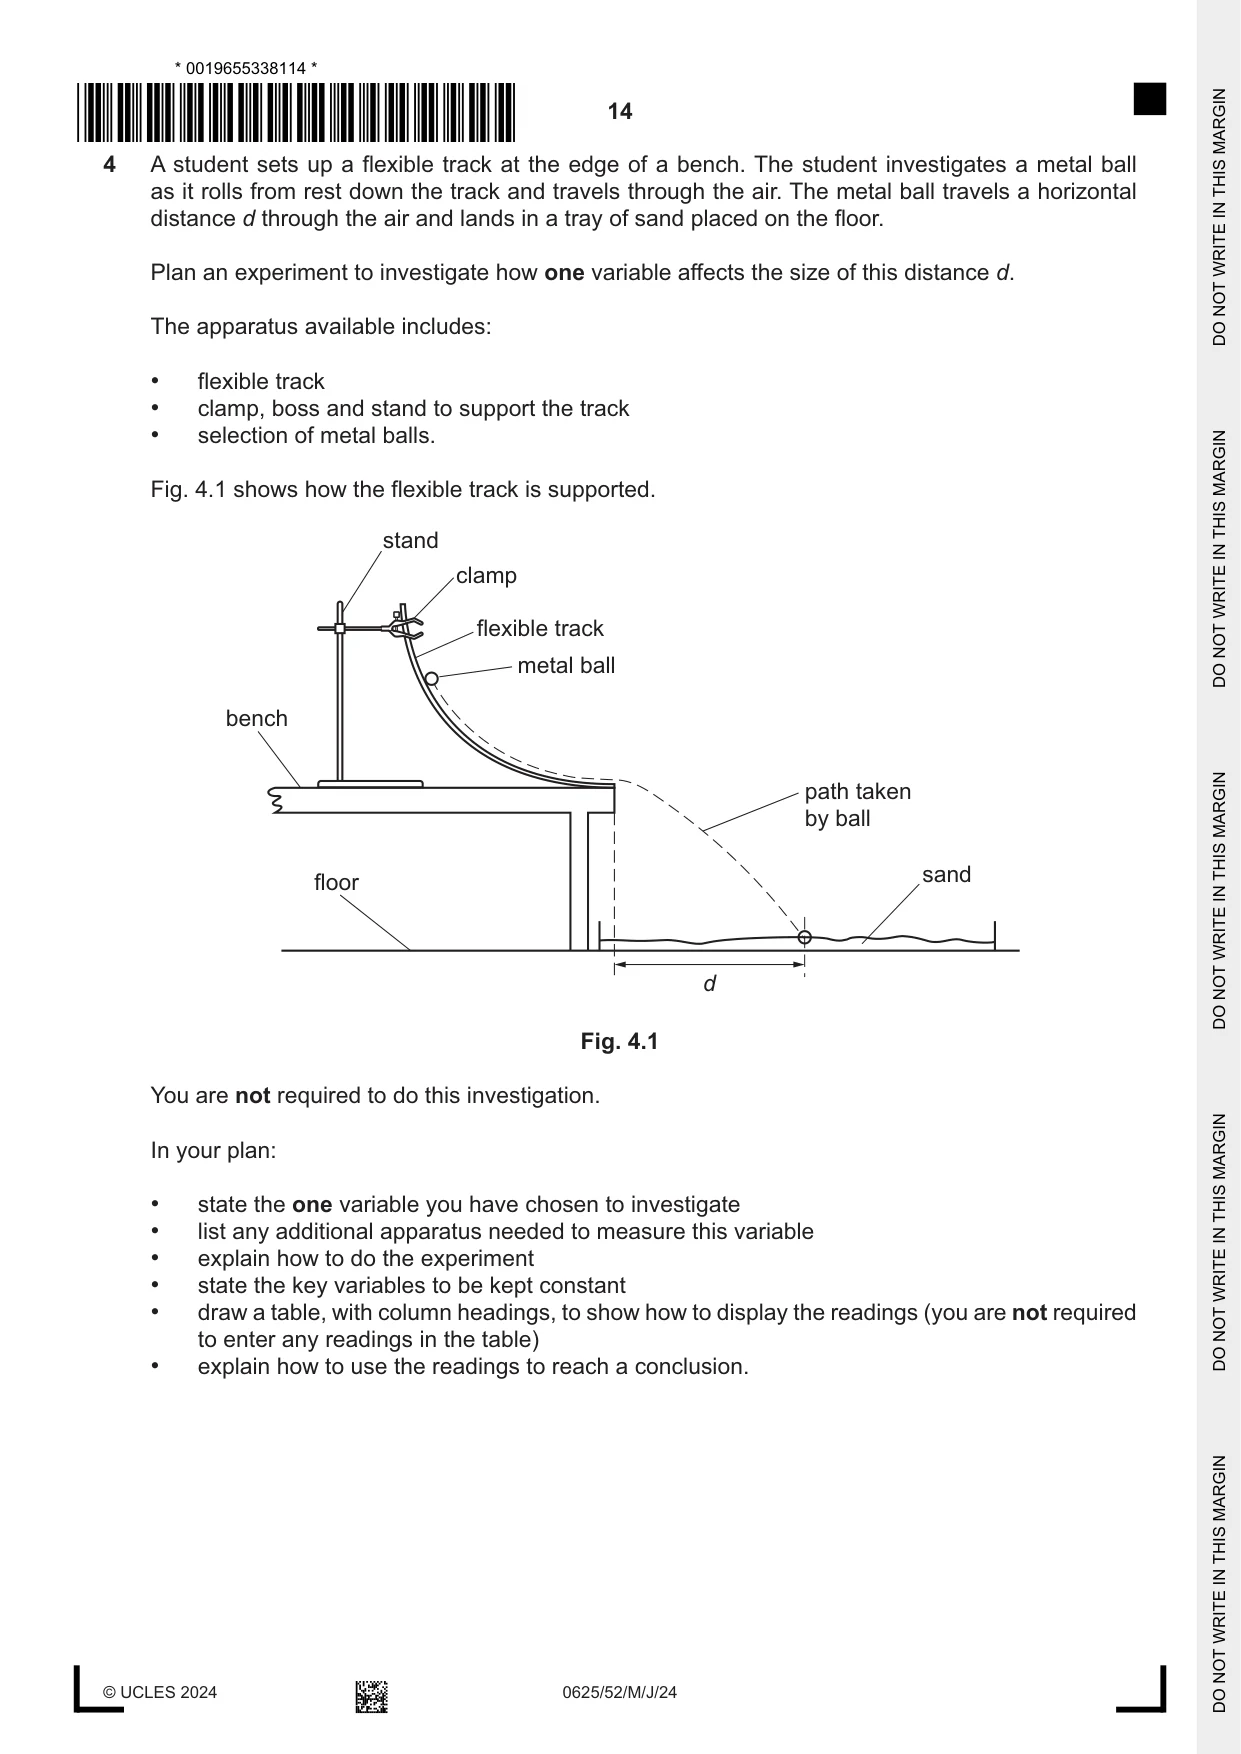
4 A student sets up a flexible track at the edge of a bench. The student investigates a metal ball as it rolls from rest down the track and travels through the air. The metal ball travels a horizontal distance d through the air and lands in a tray of sand placed on the floor. Plan an experiment to investigate how one variable affects the size of this distance d. The apparatus available includes: • flexible track • clamp, boss and stand to support the track • selection of metal balls. Fig. 4.1 shows how the flexible track is supported. stand clamp flexible track metal ball bench path taken by ball sand floor d Fig. 4.1 You are not required to do this investigation. In your plan: • state the one variable you have chosen to investigate • list any additional apparatus needed to measure this variable • explain how to do the experiment • state the key variables to be kept constant • draw a table, with column headings, to show how to display the readings (you are not required to enter any readings in the table) • explain how to use the readings to reach a conclusion. .......................................................................................................................................................... .......................................................................................................................................................... .......................................................................................................................................................... .......................................................................................................................................................... .......................................................................................................................................................... .......................................................................................................................................................... .......................................................................................................................................................... .......................................................................................................................................................... .......................................................................................................................................................... .......................................................................................................................................................... .......................................................................................................................................................... .......................................................................................................................................................... .......................................................................................................................................................... .......................................................................................................................................................... .......................................................................................................................................................... .......................................................................................................................................................... .......................................................................................................................................................... .......................................................................................................................................................... .......................................................................................................................................................... .................................................................................................................................................... [7]
Mark scheme: 4 MP1 variable chosen: valid variable which may affect d 1 MP2 additional apparatus: ruler / measuring tape AND additional apparatus (if needed) to measure the independent variable 1 MP3 method: (place ball and release), measure dependent variable repeat for new value of independent variable 1 MP4 control variables: any significant variable appropriate to the independent variable 1 MP5 table: columns, with units, for independent variable and dependent variable 1 MP6 conclusion: compare readings in the table to see if / how a change in the variable produces change in d OR plot a (line) graph with axes specified 1 MP7 additional point: any one from: second valid control variable stated at least 5 sets of data taken repeat each measurement AND take the average 1
What was in this paper
The subtopics covered by these 4 questions, and how many questions each got. Open one in a new tab to see every Cambridge question on it.
What you needed in this session
Cambridge’s own grade thresholds for 2024 May/June, Paper 5 · Variant 2. A higher threshold means an easier paper — the bar moves with how the cohort did.