Cambridge IGCSE Physics 0625 — 2024 Feb/March Paper 5 · Variant 2
0625/52/F/M/24 · 4 questions · 40 marks · ≈45 min
The question paper and its mark scheme, free to read here and free to download. This is Cambridge’s own paper, exactly as it was sat.
Question paper12 pages

Mark scheme8 pages
Answers below. Sit the paper first if you are practising.
Questions as text
Q1 · In this experiment, you will use a balancing method to determine the mass of a metre ruler
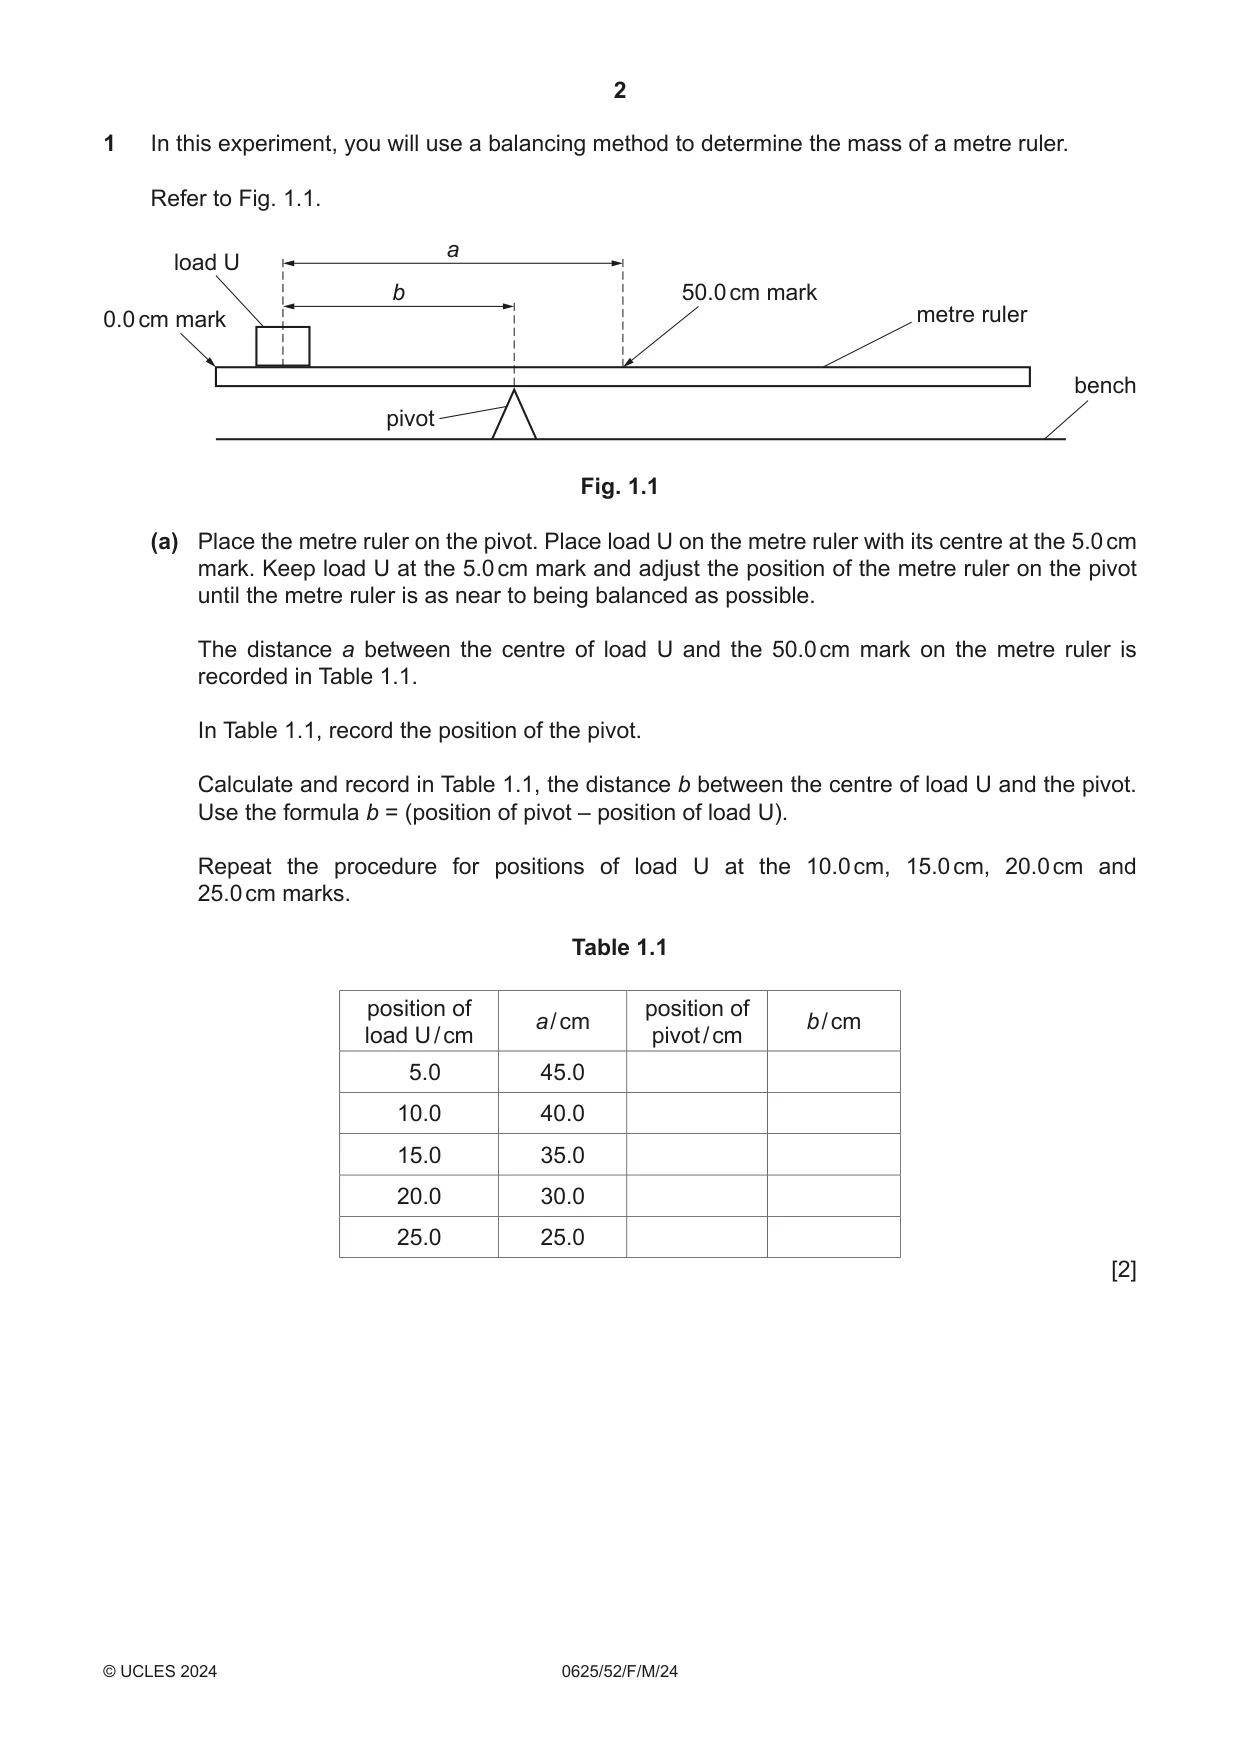
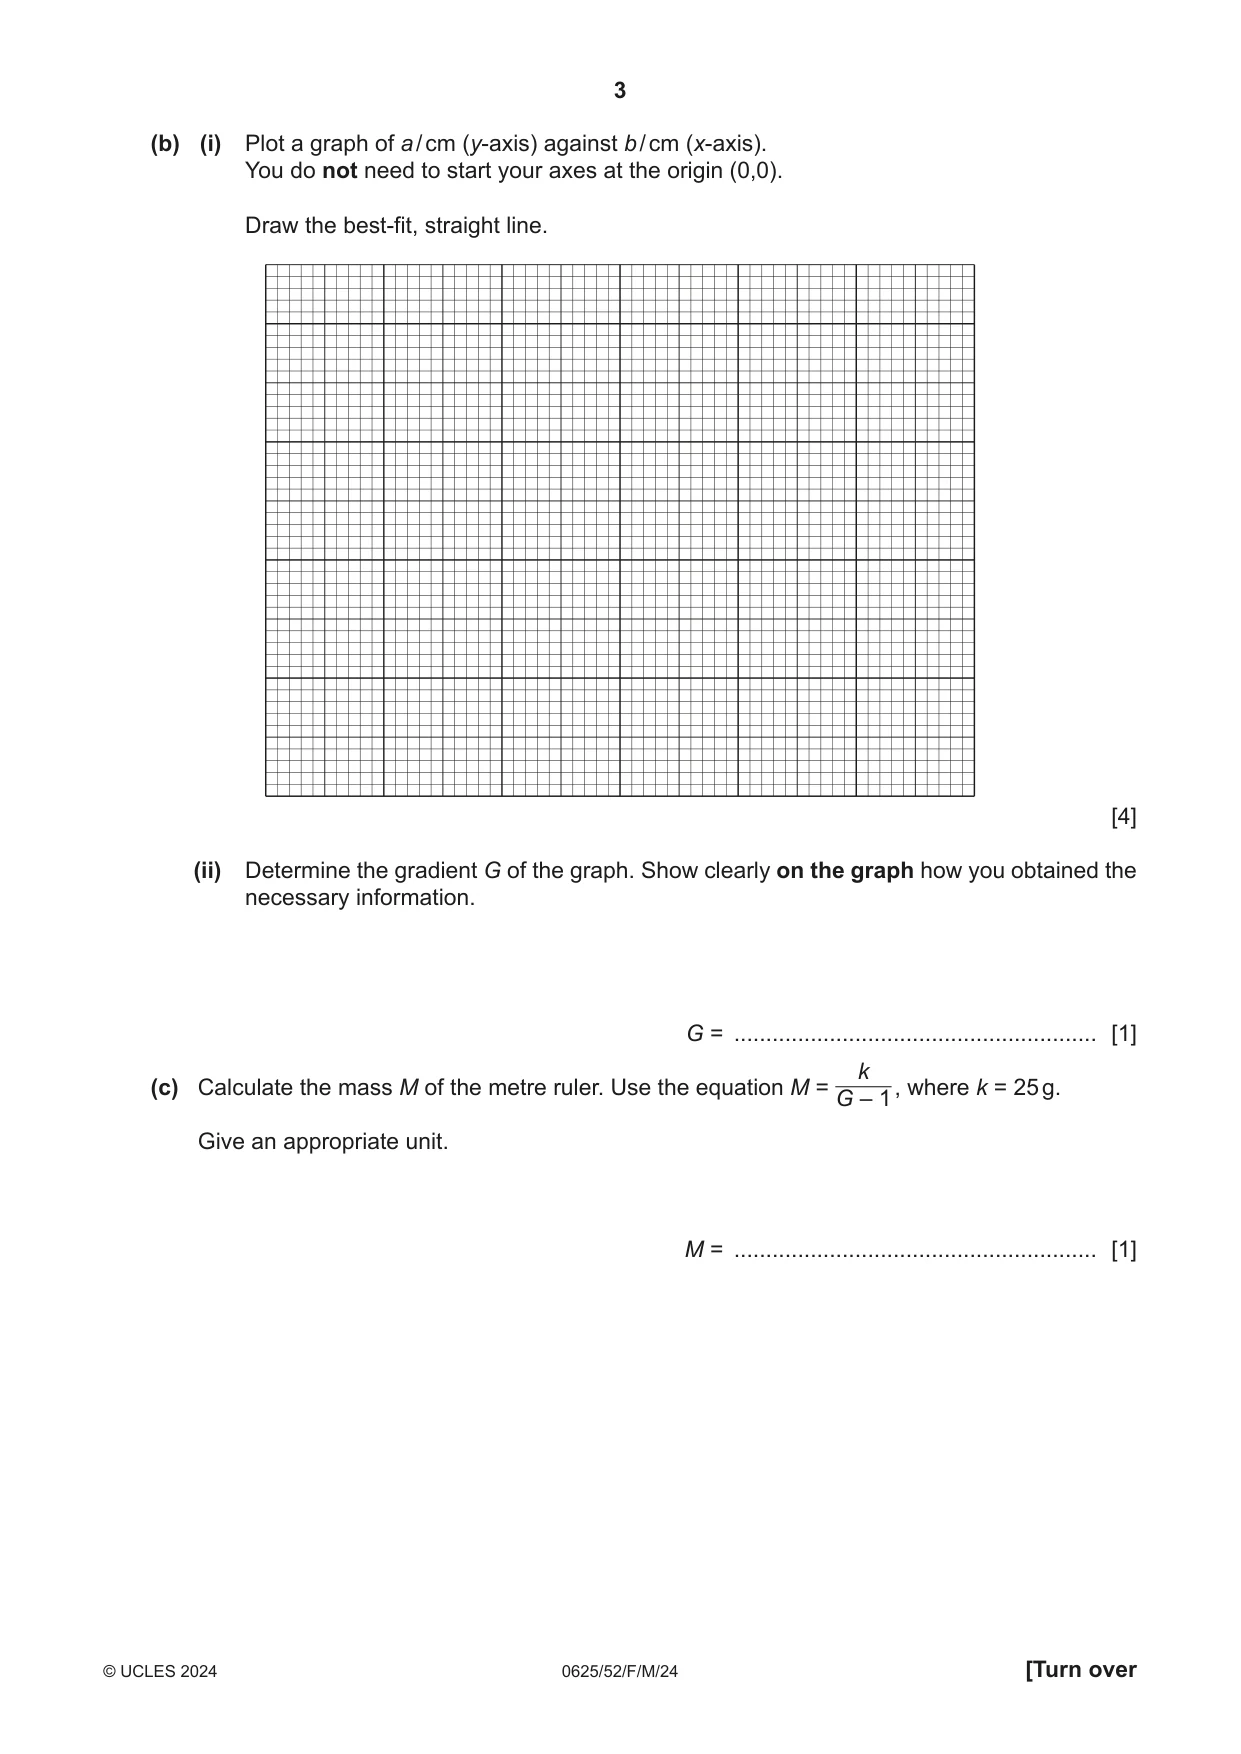
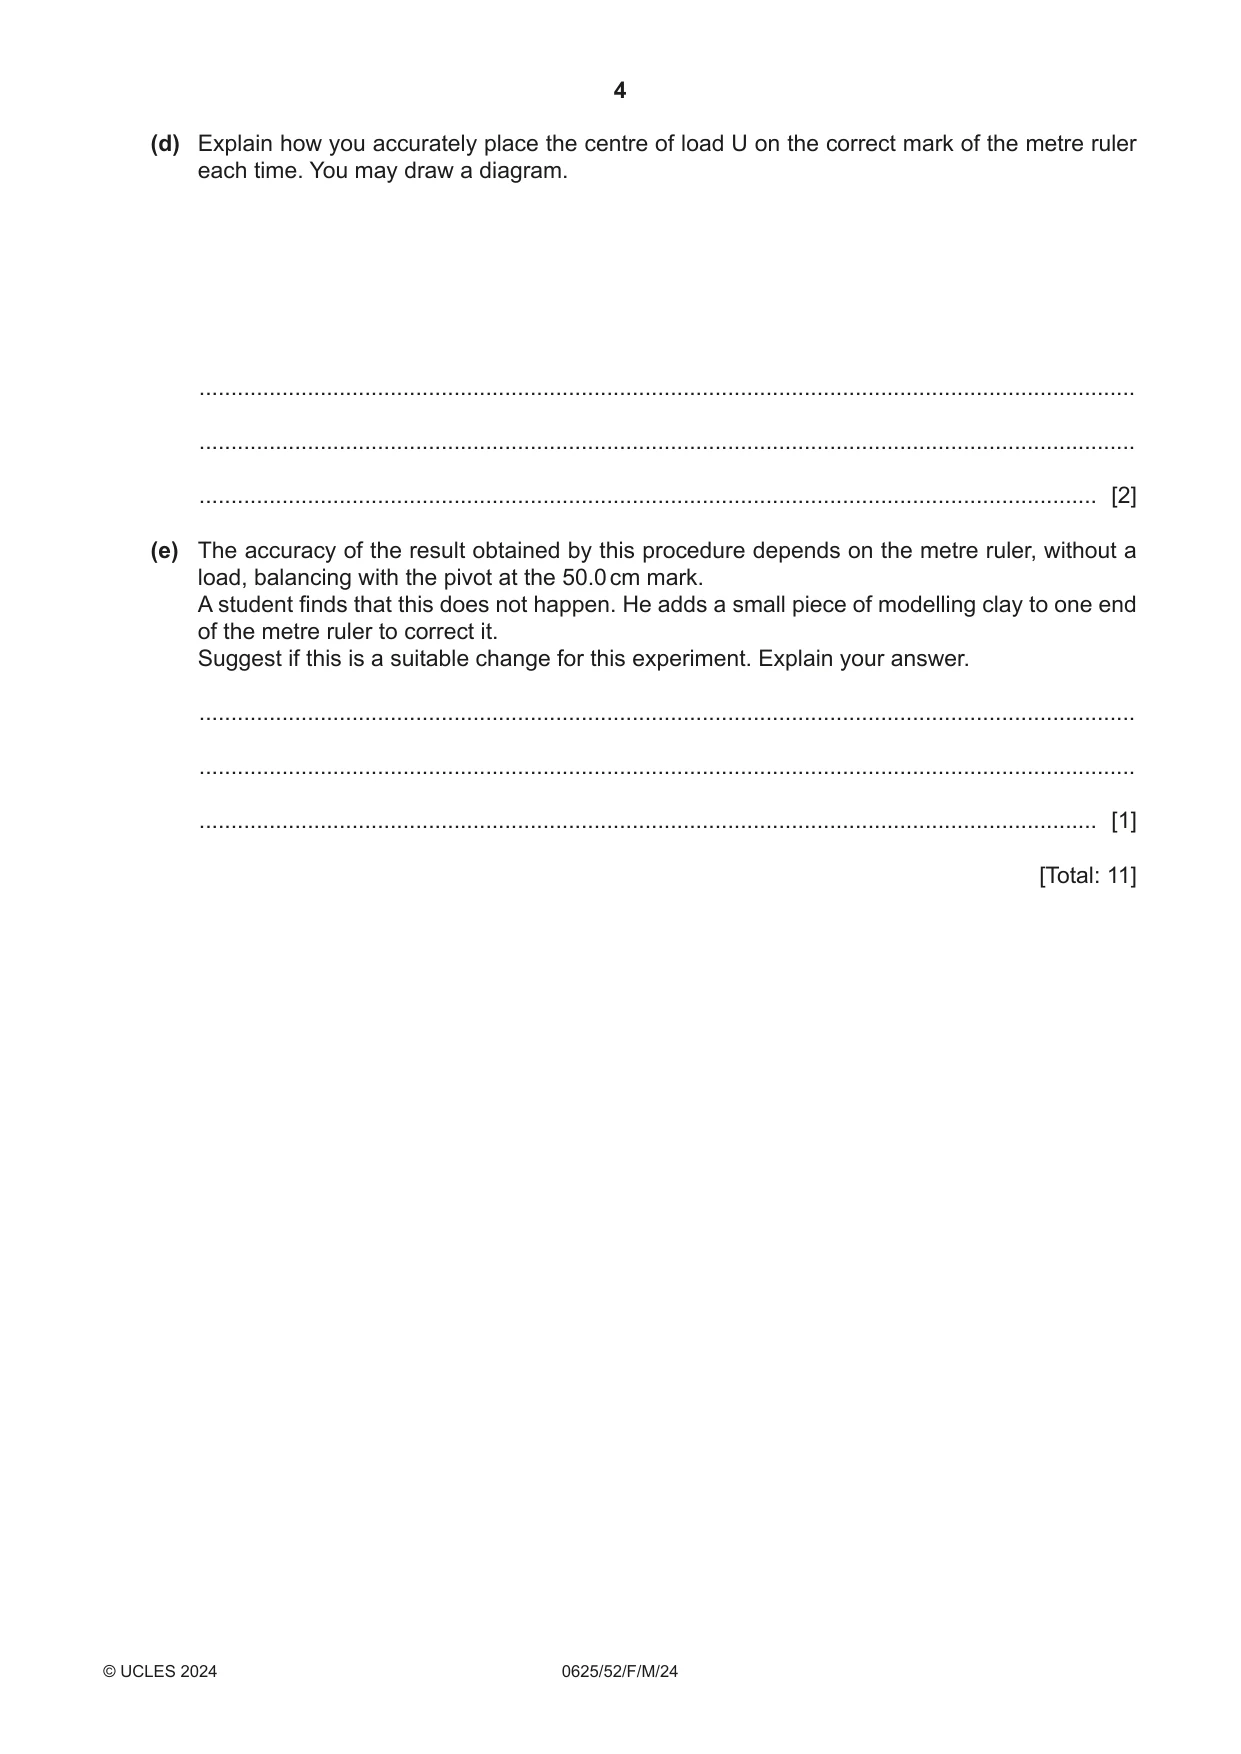
1 In this experiment, you will use a balancing method to determine the mass of a metre ruler. Refer to Fig. 1.1. a load U b 50.0 cm mark 0.0 cm mark metre ruler bench pivot Fig. 1.1 (a) Place the metre ruler on the pivot. Place load U on the metre ruler with its centre at the 5.0 cm mark. Keep load U at the 5.0 cm mark and adjust the position of the metre ruler on the pivot until the metre ruler is as near to being balanced as possible. The distance a between the centre of load U and the 50.0 cm mark on the metre ruler is recorded in Table 1.1. In Table 1.1, record the position of the pivot. Calculate and record in Table 1.1, the distance b between the centre of load U and the pivot. Use the formula b = (position of pivot – position of load U). Repeat the procedure for positions of load U at the 10.0 cm, 15.0 cm, 20.0 cm and 25.0 cm marks. Table 1.1 position of position of a / cm b / cm load U / cm pivot / cm 5.0 45.0 10.0 40.0 15.0 35.0 20.0 30.0 25.0 25.0 [2] (b) (i) Plot a graph of a / cm (y-axis) against b / cm (x-axis). You do not need to start your axes at the origin (0,0). Draw the best-fit, straight line. [4] (ii) Determine the gradient G of the graph. Show clearly on the graph how you obtained the necessary information. G = ......................................................... [1] k (c) Calculate the mass M of the metre ruler. Use the equation M = , where k = 25 g. G – 1 Give an appropriate unit. M = ......................................................... [1] (d) Explain how you accurately place the centre of load U on the correct mark of the metre ruler each time. You may draw a diagram. ................................................................................................................................................... ................................................................................................................................................... ............................................................................................................................................. [2] (e) The accuracy of the result obtained by this procedure depends on the metre ruler, without a load, balancing with the pivot at the 50.0 cm mark. A student finds that this does not happen. He adds a small piece of modelling clay to one end of the metre ruler to correct it. Suggest if this is a suitable change for this experiment. Explain your answer. ................................................................................................................................................... ................................................................................................................................................... ............................................................................................................................................. [1] [Total: 11]
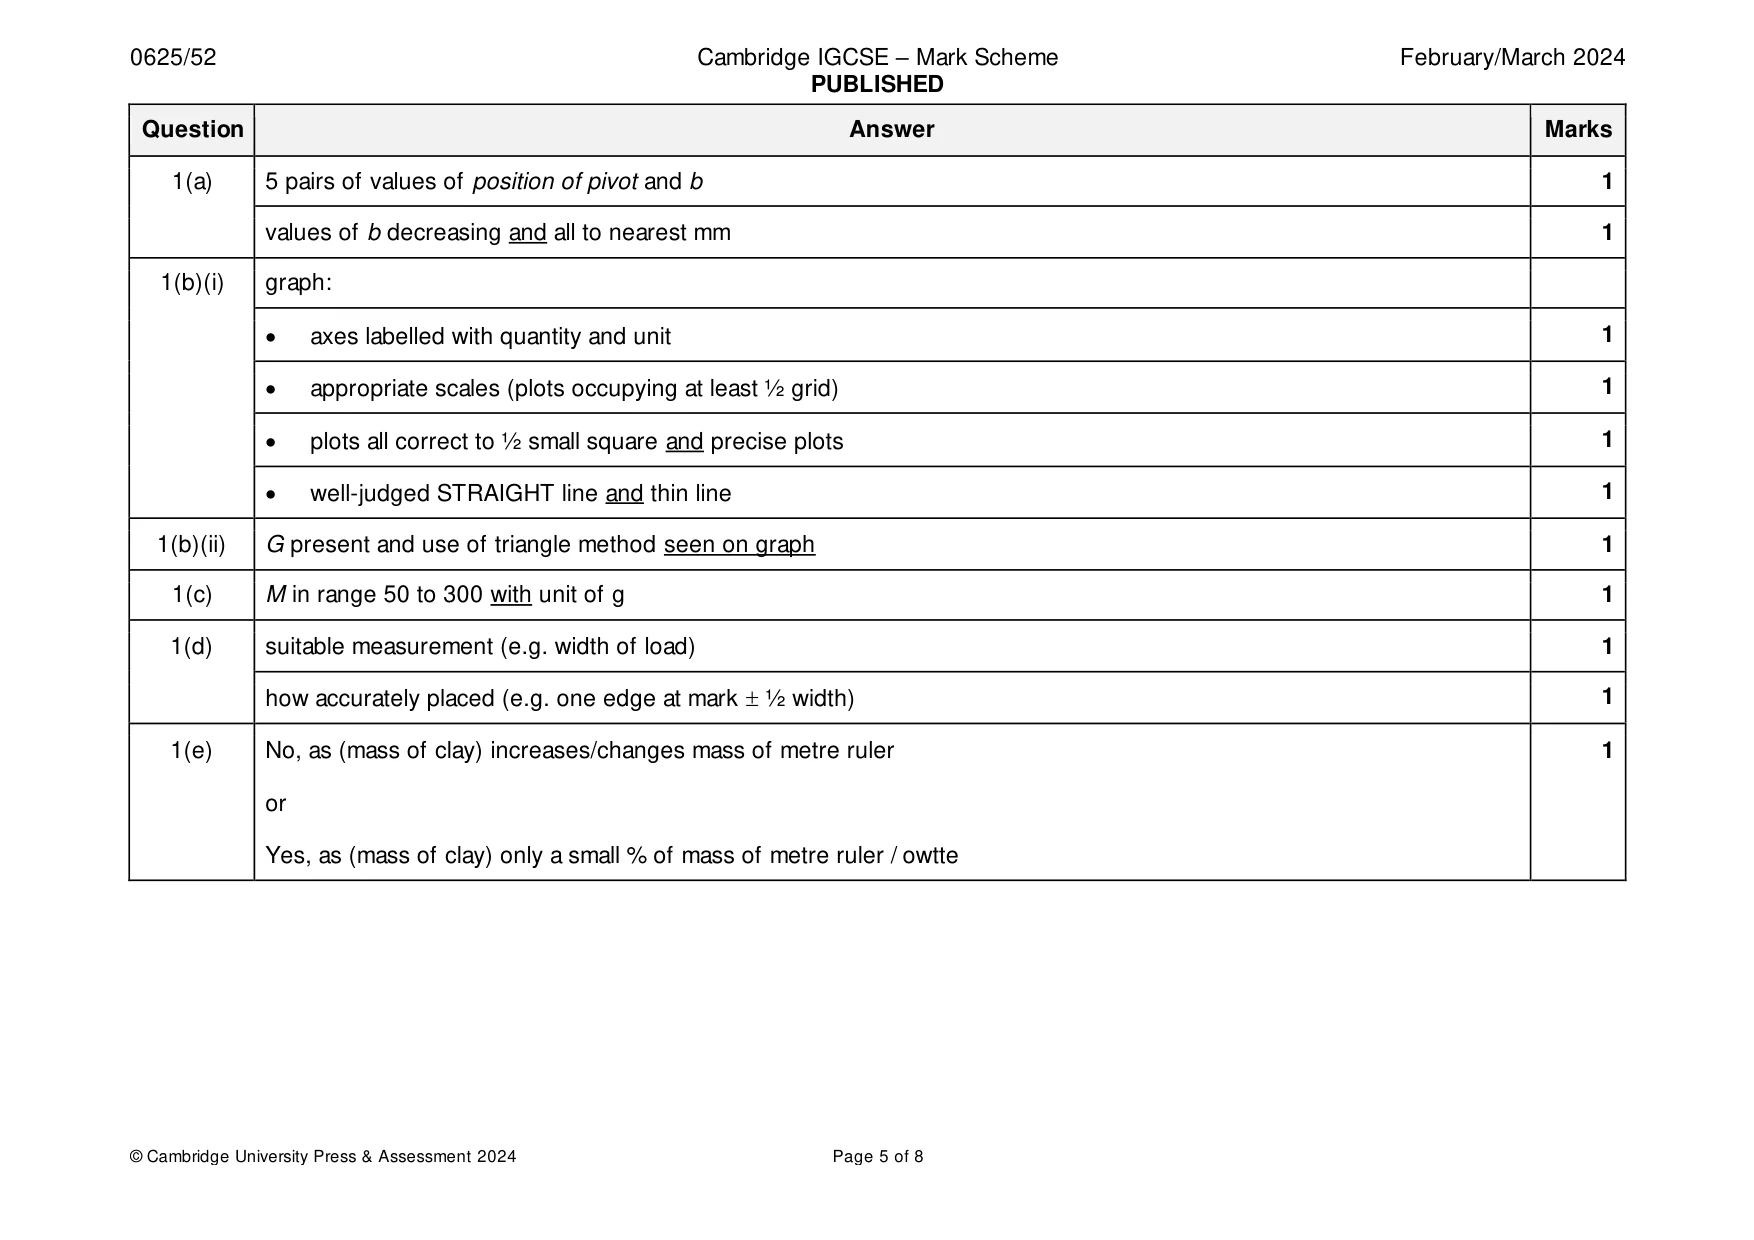
Mark scheme: Question Answer Marks 1(a) 5 pairs of values of position of pivot and b 1 values of b decreasing and all to nearest mm 1 1(b)(i) graph: • axes labelled with quantity and unit 1 • appropriate scales (plots occupying at least ½ grid) 1 • plots all correct to ½ small square and precise plots 1 • well-judged STRAIGHT line and thin line 1 1(b)(ii) G present and use of triangle method seen on graph 1 1(c) M in range 50 to 300 with unit of g 1 1(d) suitable measurement (e.g. width of load) 1 how accurately placed (e.g. one edge at mark ½ width) 1 1(e) No, as (mass of clay) increases/changes mass of metre ruler 1 or Yes, as (mass of clay) only a small % of mass of metre ruler / owtte
Q2 · In this experiment, you will investigate circuits containing different combinations of…
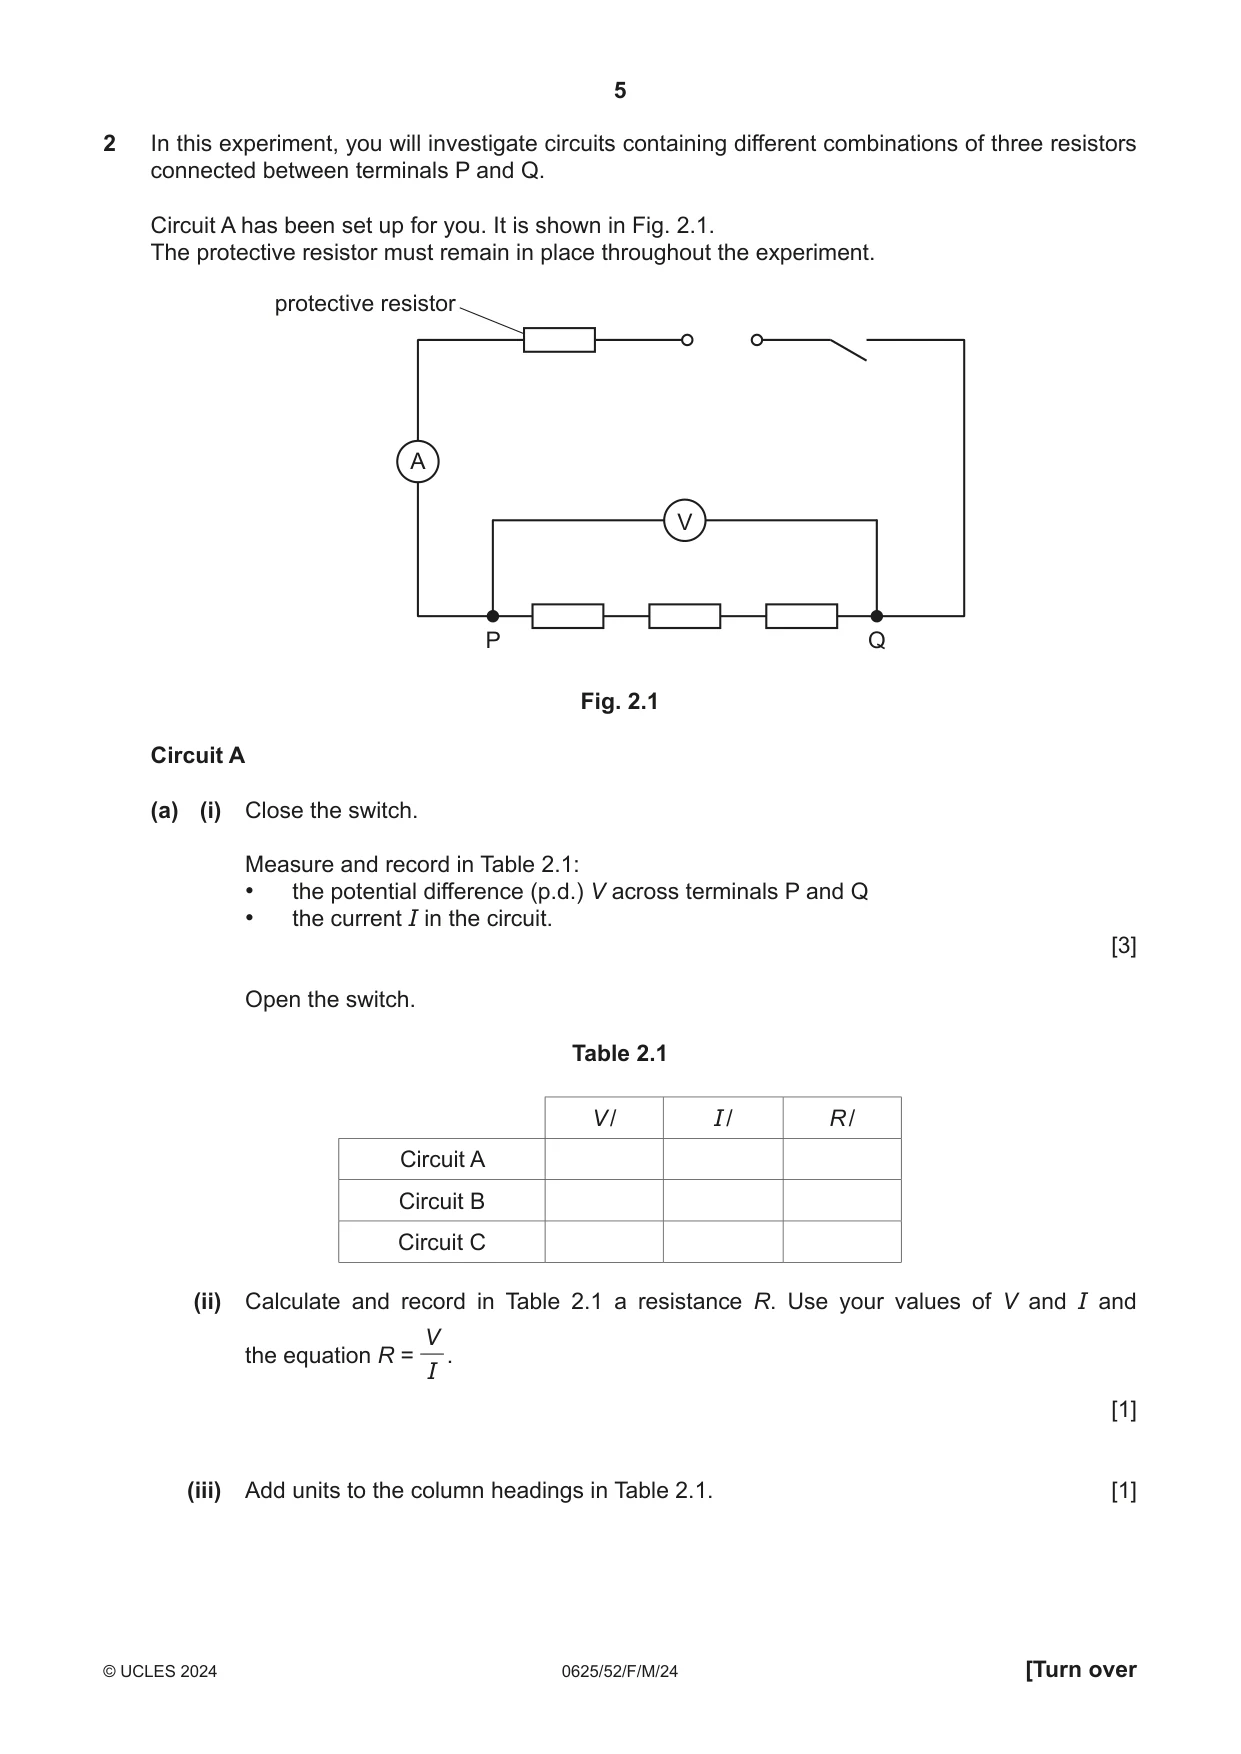
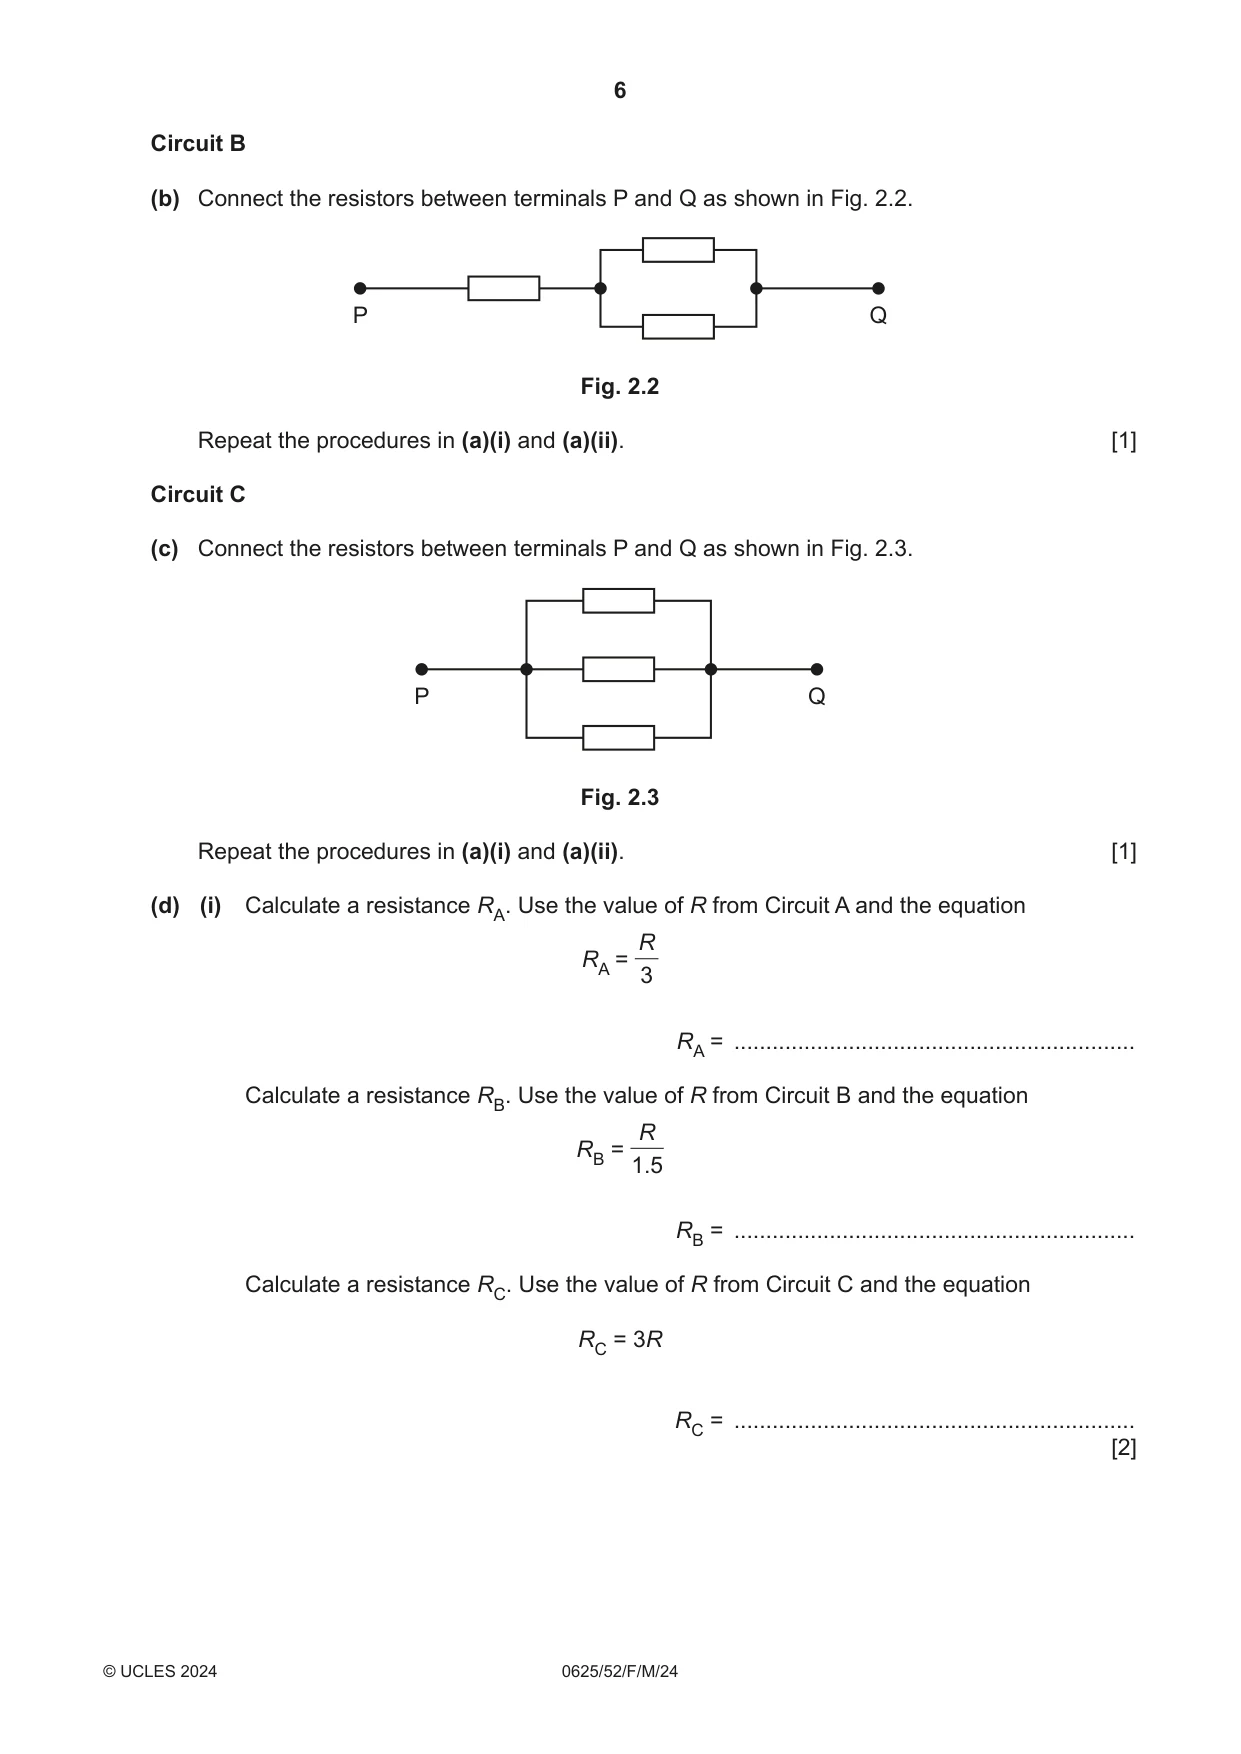
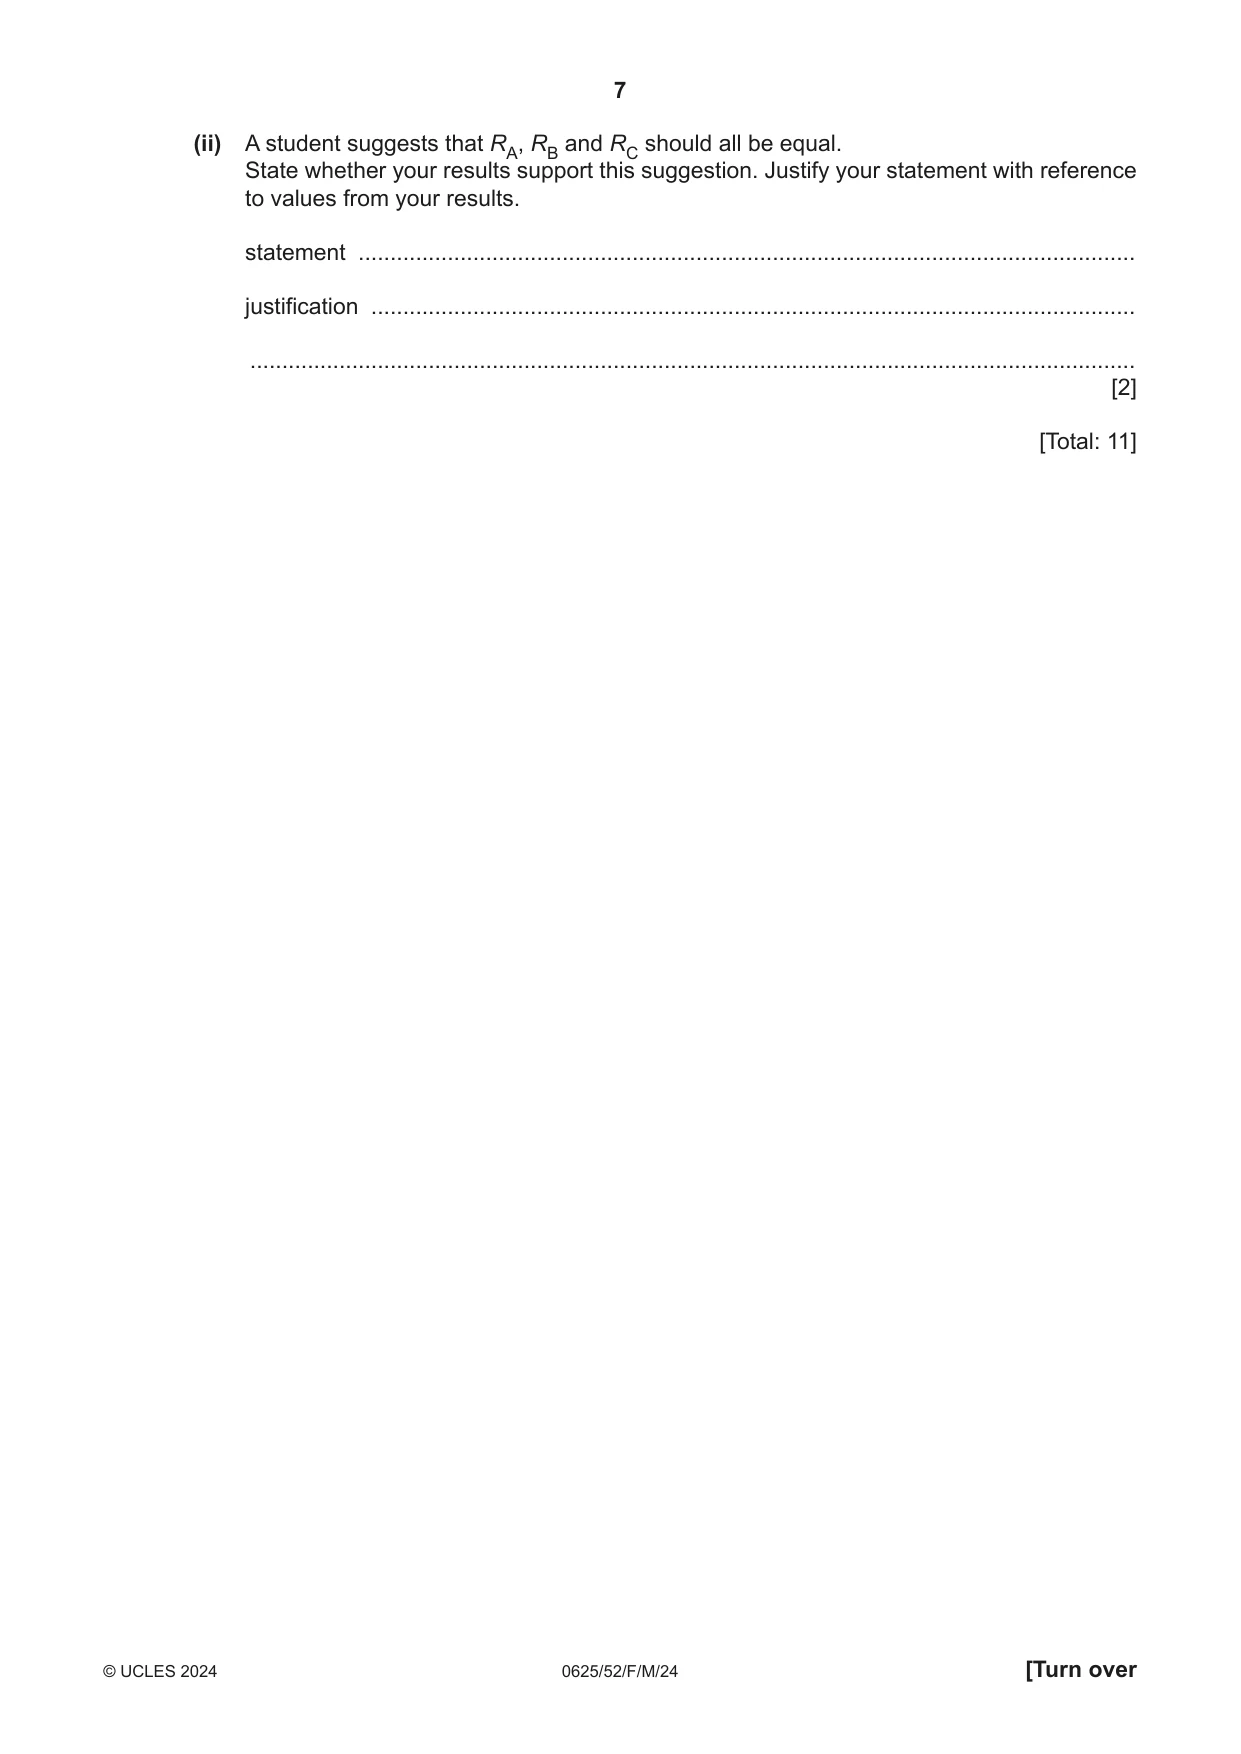
2 In this experiment, you will investigate circuits containing different combinations of three resistors connected between terminals P and Q. Circuit A has been set up for you. It is shown in Fig. 2.1. The protective resistor must remain in place throughout the experiment. protective resistor A V P Q Fig. 2.1 Circuit A (a) (i) Close the switch. Measure and record in Table 2.1: • the potential difference (p.d.) V across terminals P and Q • the current I in the circuit. [3] Open the switch. Table 2.1 V / I / R / Circuit A Circuit B Circuit C (ii) Calculate and record in Table 2.1 a resistance R. Use your values of V and I and V the equation R = . I [1] (iii) Add units to the column headings in Table 2.1. [1] Circuit B (b) Connect the resistors between terminals P and Q as shown in Fig. 2.2. P Q Fig. 2.2 Repeat the procedures in (a)(i) and (a)(ii). [1] Circuit C (c) Connect the resistors between terminals P and Q as shown in Fig. 2.3. P Q Fig. 2.3 Repeat the procedures in (a)(i) and (a)(ii). [1] (d) (i) Calculate a resistance RA. Use the value of R from Circuit A and the equation R RA = 3 RA = ............................................................... Calculate a resistance RB. Use the value of R from Circuit B and the equation R RB = 1.5 RB = ............................................................... Calculate a resistance RC. Use the value of R from Circuit C and the equation RC = 3R RC = ............................................................... [2] (ii) A student suggests that RA, RB and RC should all be equal. State whether your results support this suggestion. Justify your statement with reference to values from your results. statement .......................................................................................................................... justification ........................................................................................................................ ........................................................................................................................................... [2] [Total: 11]
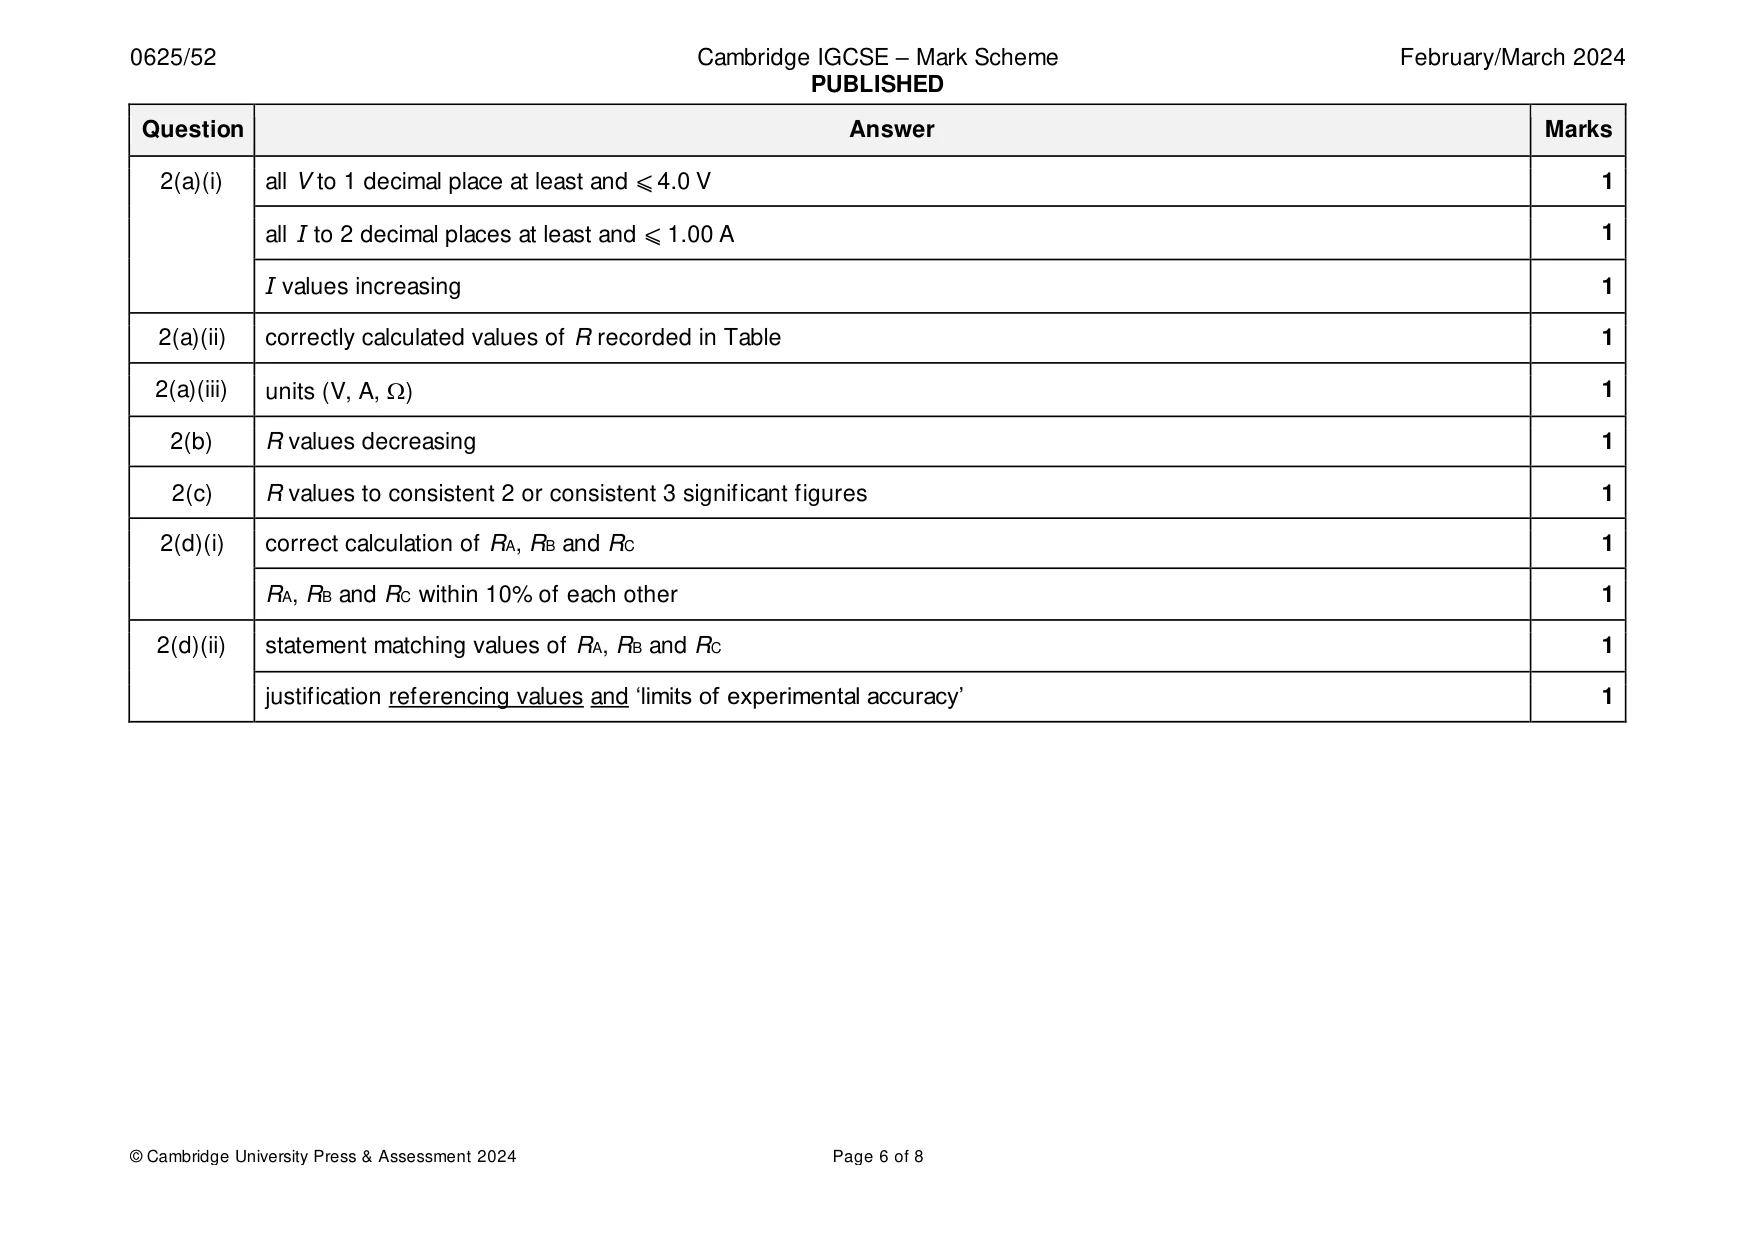
Mark scheme: 2(a)(i) all V to 1 decimal place at least and ⩽ 4.0 V 1 all I to 2 decimal places at least and ⩽ 1.00 A 1 I values increasing 1 2(a)(ii) correctly calculated values of R recorded in Table 1 2(a)(iii) units (V, A, ) 1 2(b) R values decreasing 1 2(c) R values to consistent 2 or consistent 3 significant figures 1 2(d)(i) correct calculation of RA, RB and RC 1 RA, RB and RC within 10% of each other 1 2(d)(ii) statement matching values of RA, RB and RC 1 justification referencing values and ‘limits of experimental accuracy’ 1
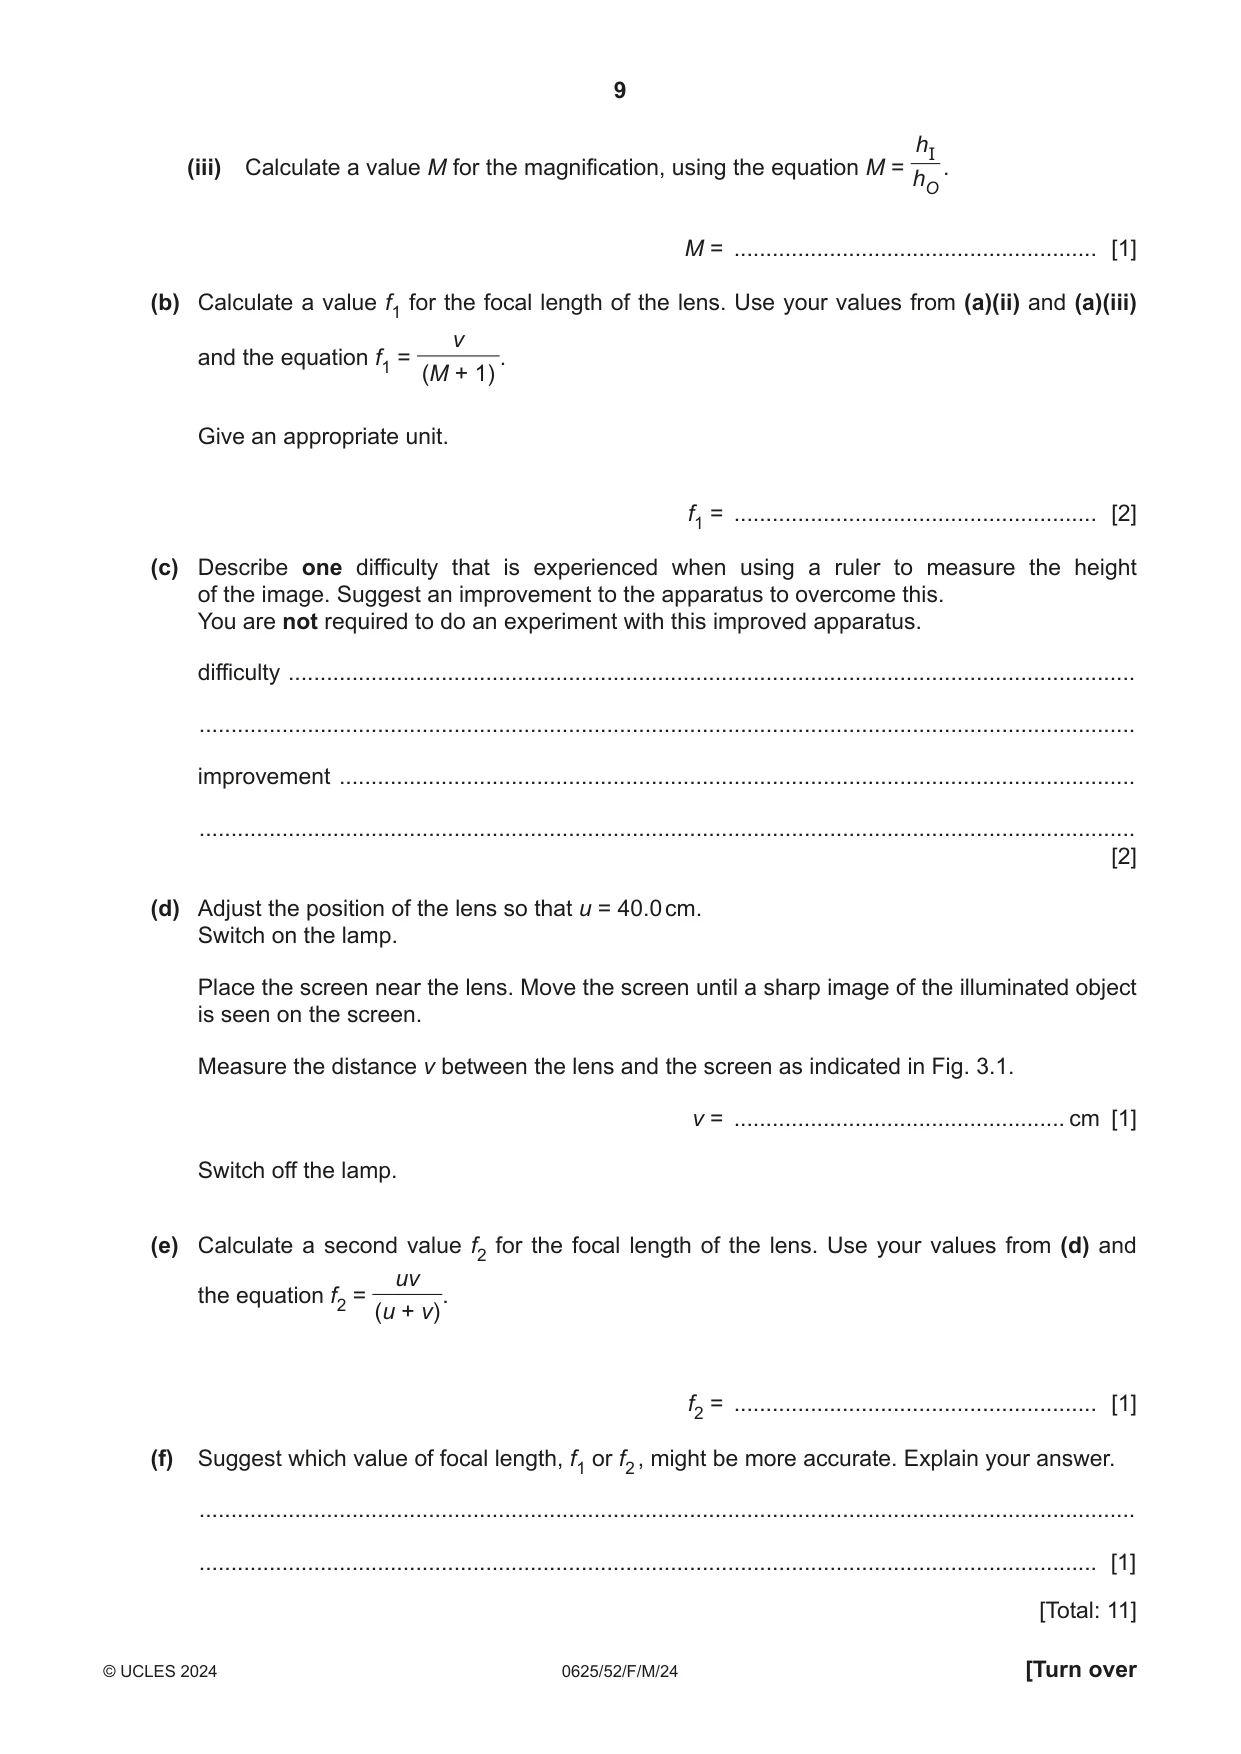
Q3 · In this experiment, you will determine the focal length of a converging lens by two…
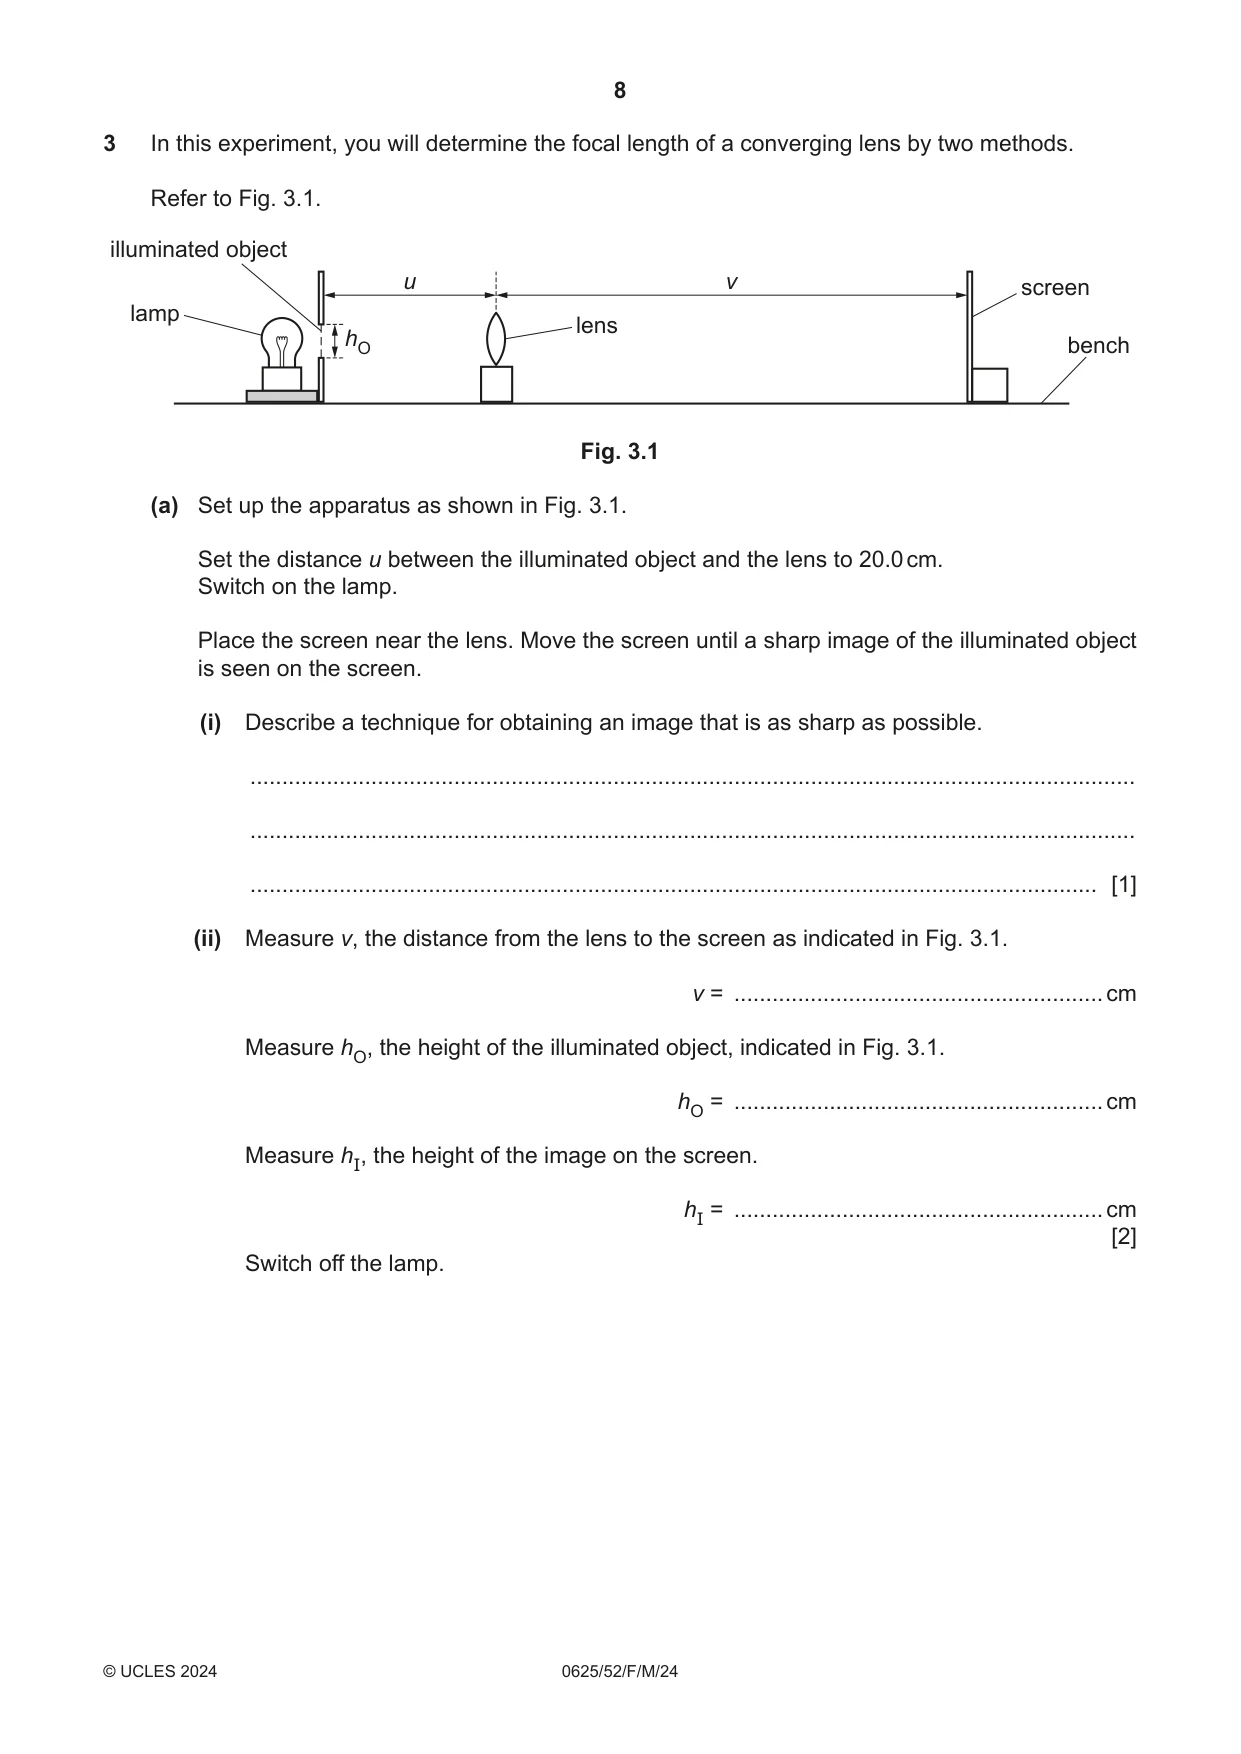
3 In this experiment, you will determine the focal length of a converging lens by two methods. Refer to Fig. 3.1. illuminated object u v screen lamp lens hO bench Fig. 3.1 (a) Set up the apparatus as shown in Fig. 3.1. Set the distance u between the illuminated object and the lens to 20.0 cm. Switch on the lamp. Place the screen near the lens. Move the screen until a sharp image of the illuminated object is seen on the screen. (i) Describe a technique for obtaining an image that is as sharp as possible. ........................................................................................................................................... ........................................................................................................................................... ..................................................................................................................................... [1] (ii) Measure v, the distance from the lens to the screen as indicated in Fig. 3.1. v = ..........................................................cm Measure hO, the height of the illuminated object, indicated in Fig. 3.1. hO = ..........................................................cm Measure hI, the height of the image on the screen. hI = ..........................................................cm [2] Switch off the lamp. hI (iii) Calculate a value M for the magnification, using the equation M = . hO M = ......................................................... [1] (b) Calculate a value f1 for the focal length of the lens. Use your values from (a)(ii) and (a)(iii) v and the equation f1 = . (M + 1) Give an appropriate unit. f1 = ......................................................... [2] (c) Describe one difficulty that is experienced when using a ruler to measure the height of the image. Suggest an improvement to the apparatus to overcome this. You are not required to do an experiment with this improved apparatus. difficulty ..................................................................................................................................... ................................................................................................................................................... improvement ............................................................................................................................. ................................................................................................................................................... [2] (d) Adjust the position of the lens so that u = 40.0 cm. Switch on the lamp. Place the screen near the lens. Move the screen until a sharp image of the illuminated object is seen on the screen. Measure the distance v between the lens and the screen as indicated in Fig. 3.1. v = .................................................... cm [1] Switch off the lamp. (e) Calculate a second value f2 for the focal length of the lens. Use your values from (d) and uv the equation f2 = (u + v). f2 = ......................................................... [1] (f) Suggest which value of focal length, f1 or f2 , might be more accurate. Explain your answer. ................................................................................................................................................... ............................................................................................................................................. [1] [Total: 11]
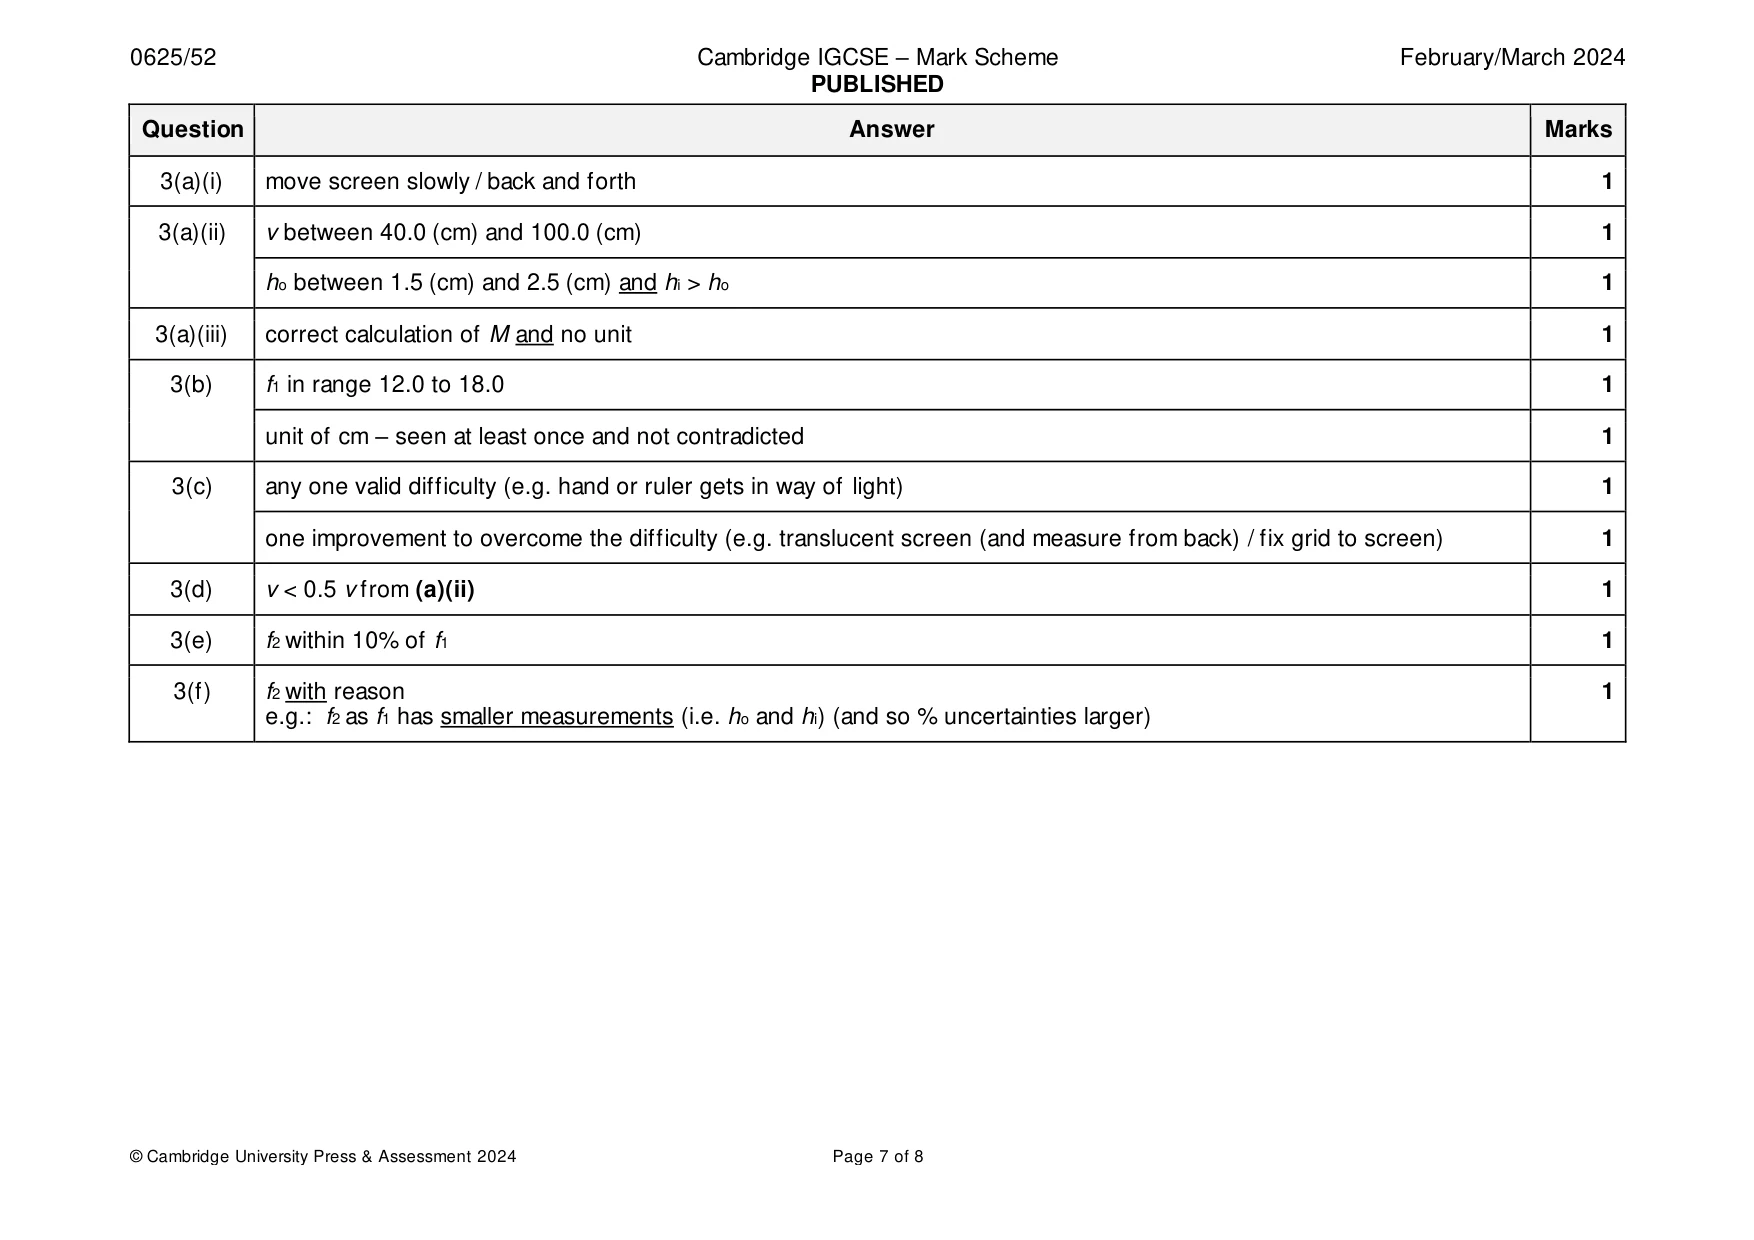
Mark scheme: 3(a)(i) move screen slowly / back and forth 1 3(a)(ii) v between 40.0 (cm) and 100.0 (cm) 1 ho between 1.5 (cm) and 2.5 (cm) and hi > ho 1 3(a)(iii) correct calculation of M and no unit 1 3(b) f1 in range 12.0 to 18.0 1 unit of cm – seen at least once and not contradicted 1 3(c) any one valid difficulty (e.g. hand or ruler gets in way of light) 1 one improvement to overcome the difficulty (e.g. translucent screen (and measure from back) / fix grid to screen) 1 3(d) v < 0.5 v from (a)(ii) 1 3(e) f2 within 10% of f1 1 3(f) f2 with reason 1 e.g.: f2 as f1 has smaller measurements (i.e. ho and hi) (and so % uncertainties larger)
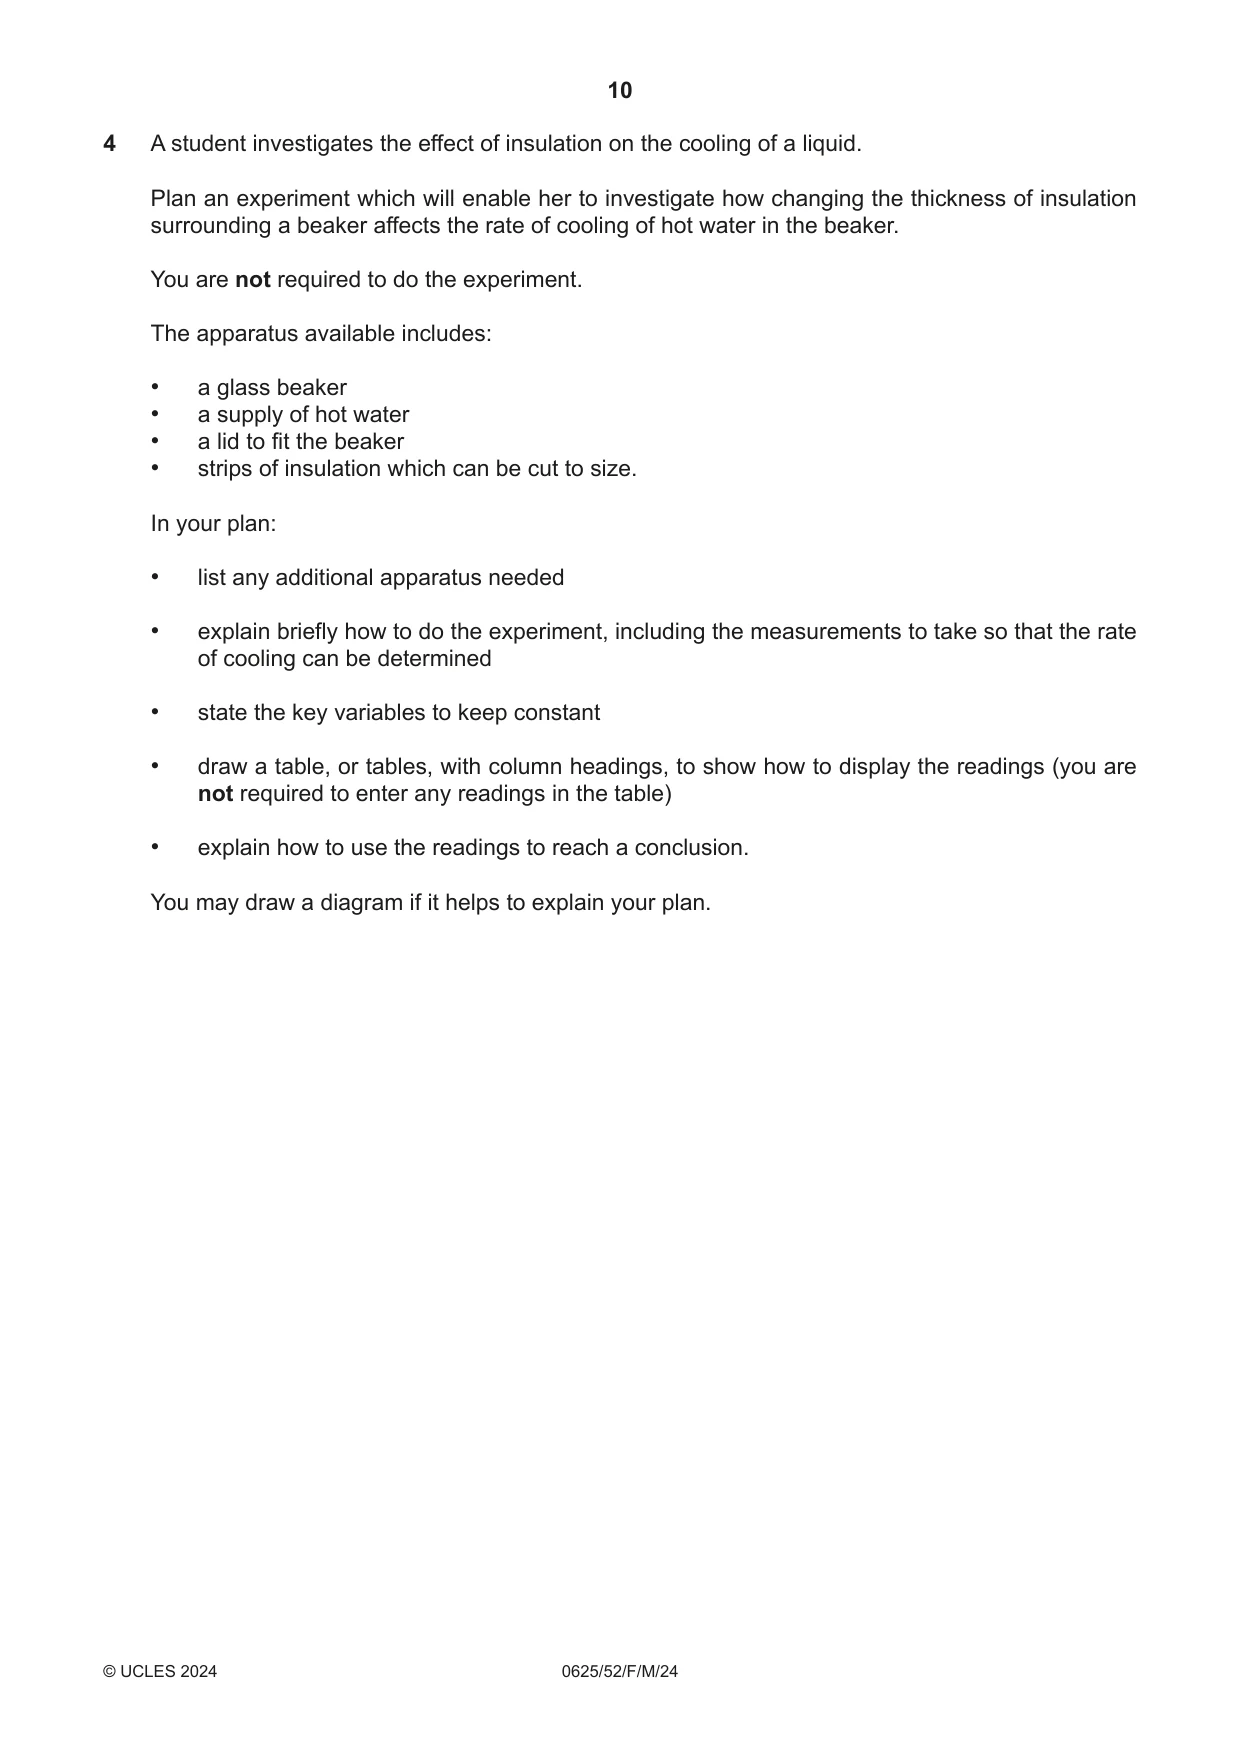
Q4 · A student investigates the effect of insulation on the cooling of a liquid
4 A student investigates the effect of insulation on the cooling of a liquid. Plan an experiment which will enable her to investigate how changing the thickness of insulation surrounding a beaker affects the rate of cooling of hot water in the beaker. You are not required to do the experiment. The apparatus available includes: • a glass beaker • a supply of hot water • a lid to fit the beaker • strips of insulation which can be cut to size. In your plan: • list any additional apparatus needed • explain briefly how to do the experiment, including the measurements to take so that the rate of cooling can be determined • state the key variables to keep constant • draw a table, or tables, with column headings, to show how to display the readings (you are not required to enter any readings in the table) • explain how to use the readings to reach a conclusion. You may draw a diagram if it helps to explain your plan. .................................................................................................................................................................. .................................................................................................................................................................. .................................................................................................................................................................. .................................................................................................................................................................. .................................................................................................................................................................. .................................................................................................................................................................. .................................................................................................................................................................. .................................................................................................................................................................. .................................................................................................................................................................. .................................................................................................................................................................. .................................................................................................................................................................. .................................................................................................................................................................. .................................................................................................................................................................. .................................................................................................................................................................. .................................................................................................................................................................. .................................................................................................................................................................. .................................................................................................................................................................. .................................................................................................................................................................. .................................................................................................................................................................. .................................................................................................................................................................. .................................................................................................................................................................. .................................................................................................................................................................. ............................................................................................................................................................ [7]
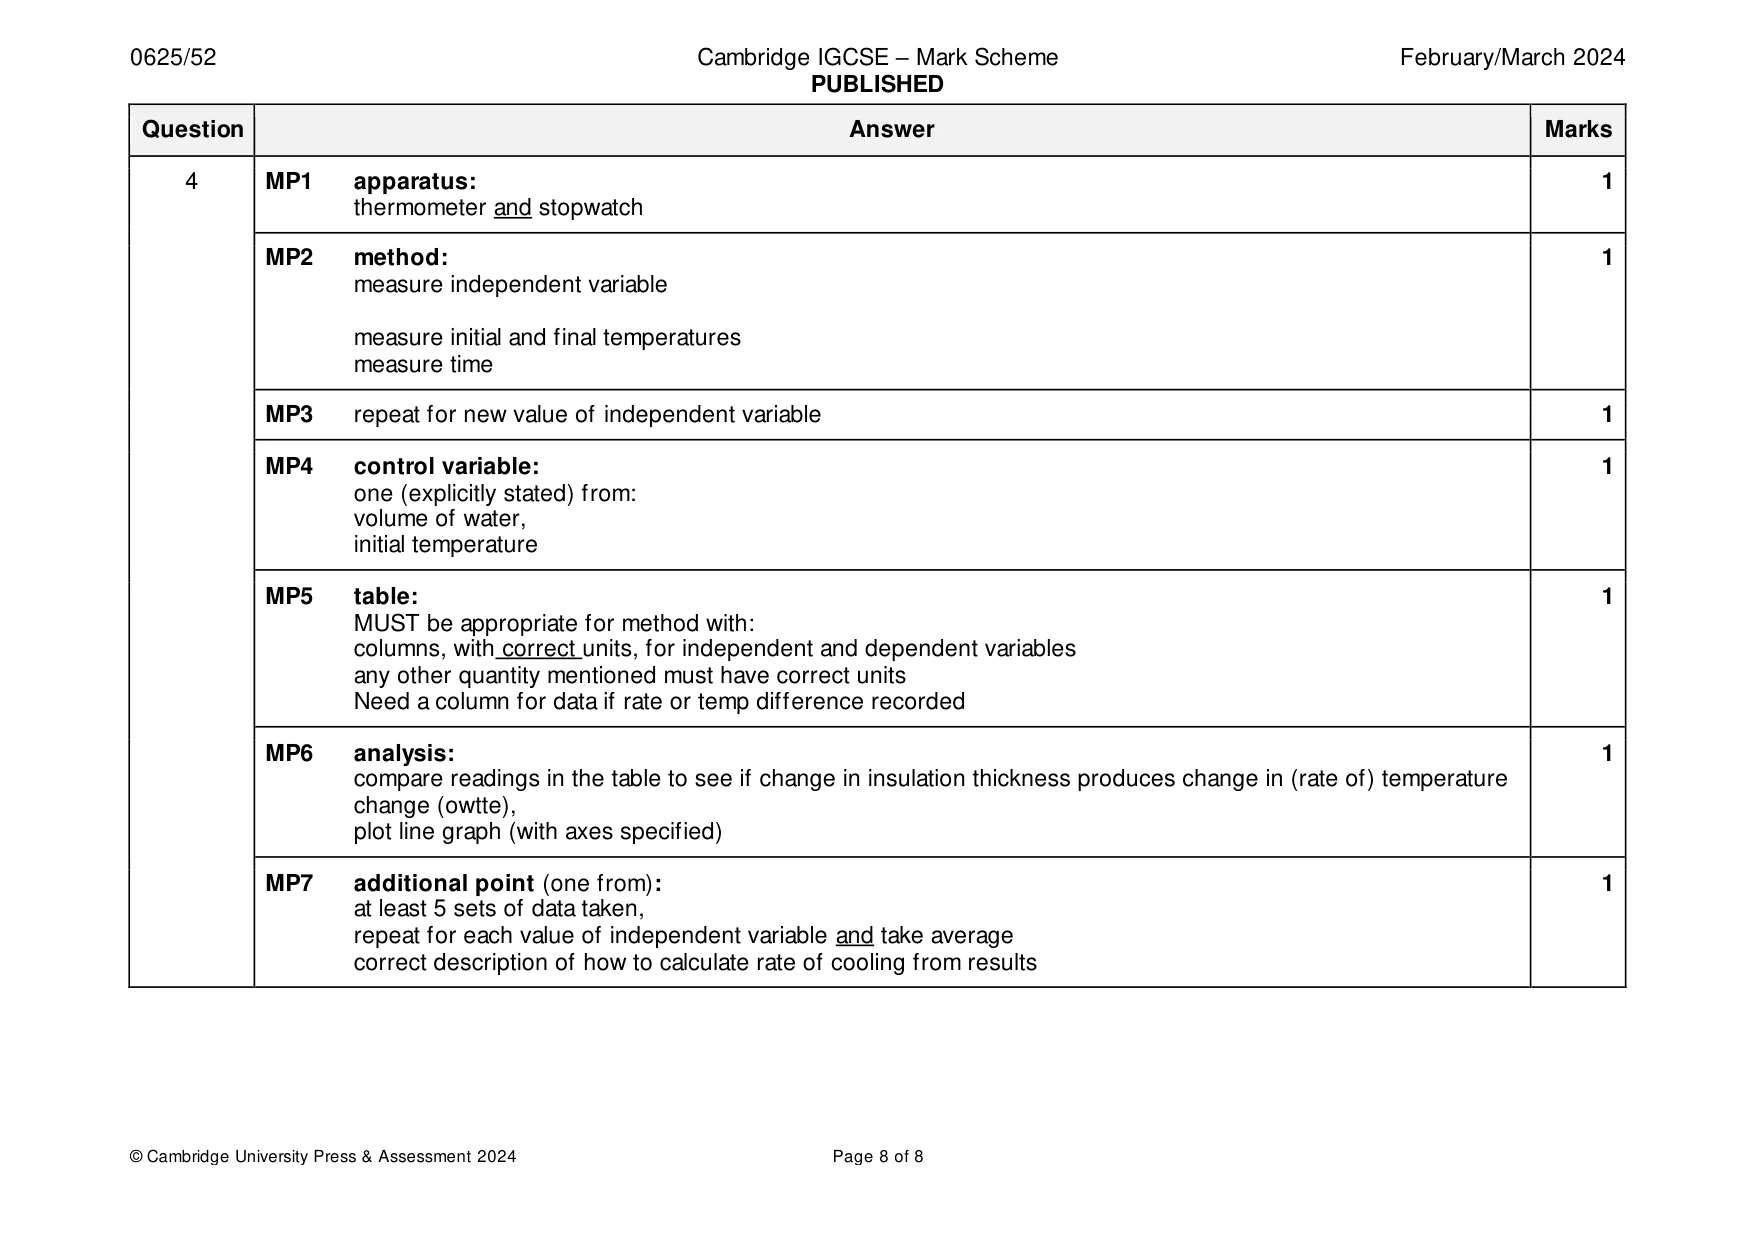
Mark scheme: 4 MP1 apparatus: 1 thermometer and stopwatch MP2 method: 1 measure independent variable measure initial and final temperatures measure time MP3 repeat for new value of independent variable 1 MP4 control variable: 1 one (explicitly stated) from: volume of water, initial temperature MP5 table: 1 MUST be appropriate for method with: columns, with correct units, for independent and dependent variables any other quantity mentioned must have correct units Need a column for data if rate or temp difference recorded MP6 analysis: 1 compare readings in the table to see if change in insulation thickness produces change in (rate of) temperature change (owtte), plot line graph (with axes specified) MP7 additional point (one from): 1 at least 5 sets of data taken, repeat for each value of independent variable and take average correct description of how to calculate rate of cooling from results
What was in this paper
The subtopics covered by these 4 questions, and how many questions each got. Open one in a new tab to see every Cambridge question on it.
What you needed in this session
Cambridge’s own grade thresholds for 2024 Feb/March, Paper 5 · Variant 2. A higher threshold means an easier paper — the bar moves with how the cohort did.