Cambridge IGCSE Physics 0625 — 2019 May/June Paper 5 · Variant 3
0625/53/M/J/19 · 4 questions · 40 marks · ≈45 min
The question paper and its mark scheme, free to read here and free to download. This is Cambridge’s own paper, exactly as it was sat.
Question paper12 pages

Mark scheme7 pages
Answers below. Sit the paper first if you are practising.
Questions as text
Q1 · In this experiment, you will determine the mass of a block U by a balancing method
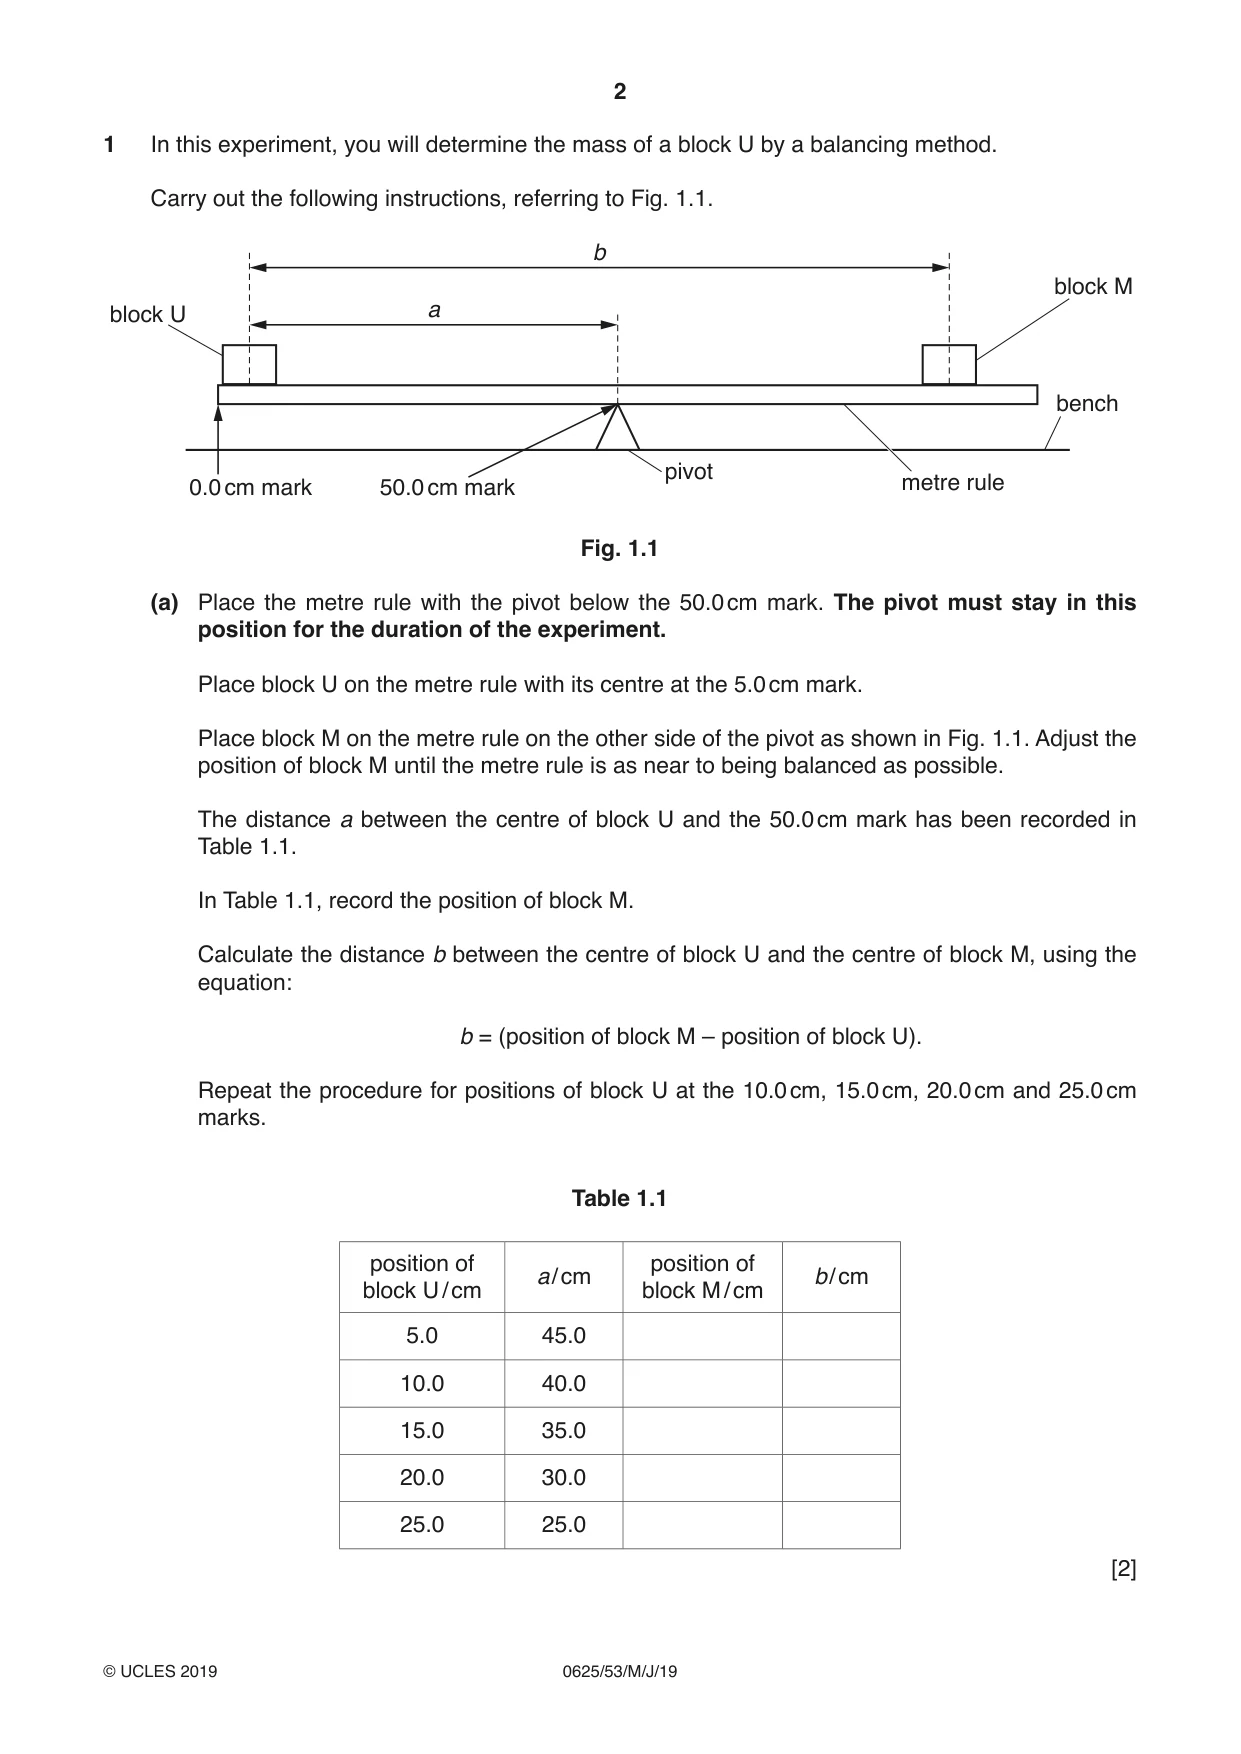
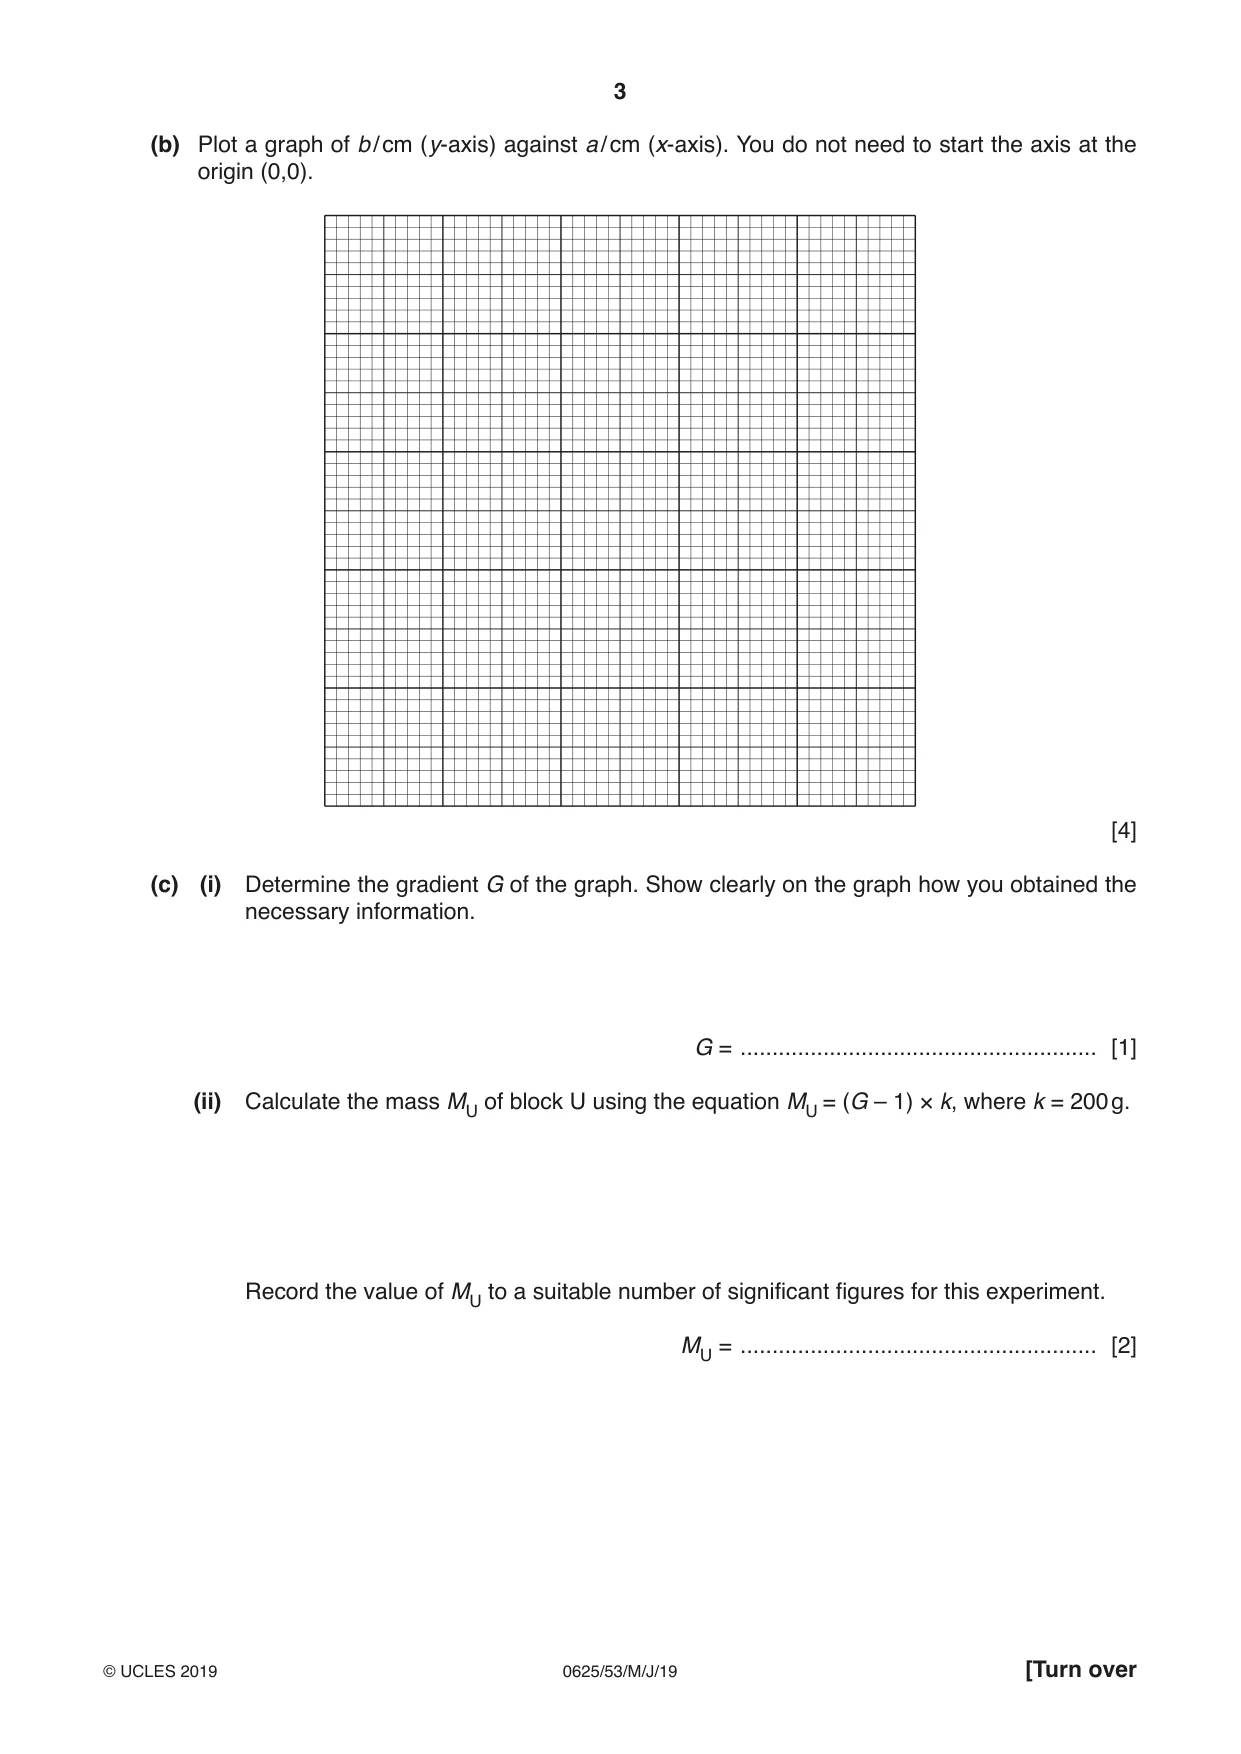
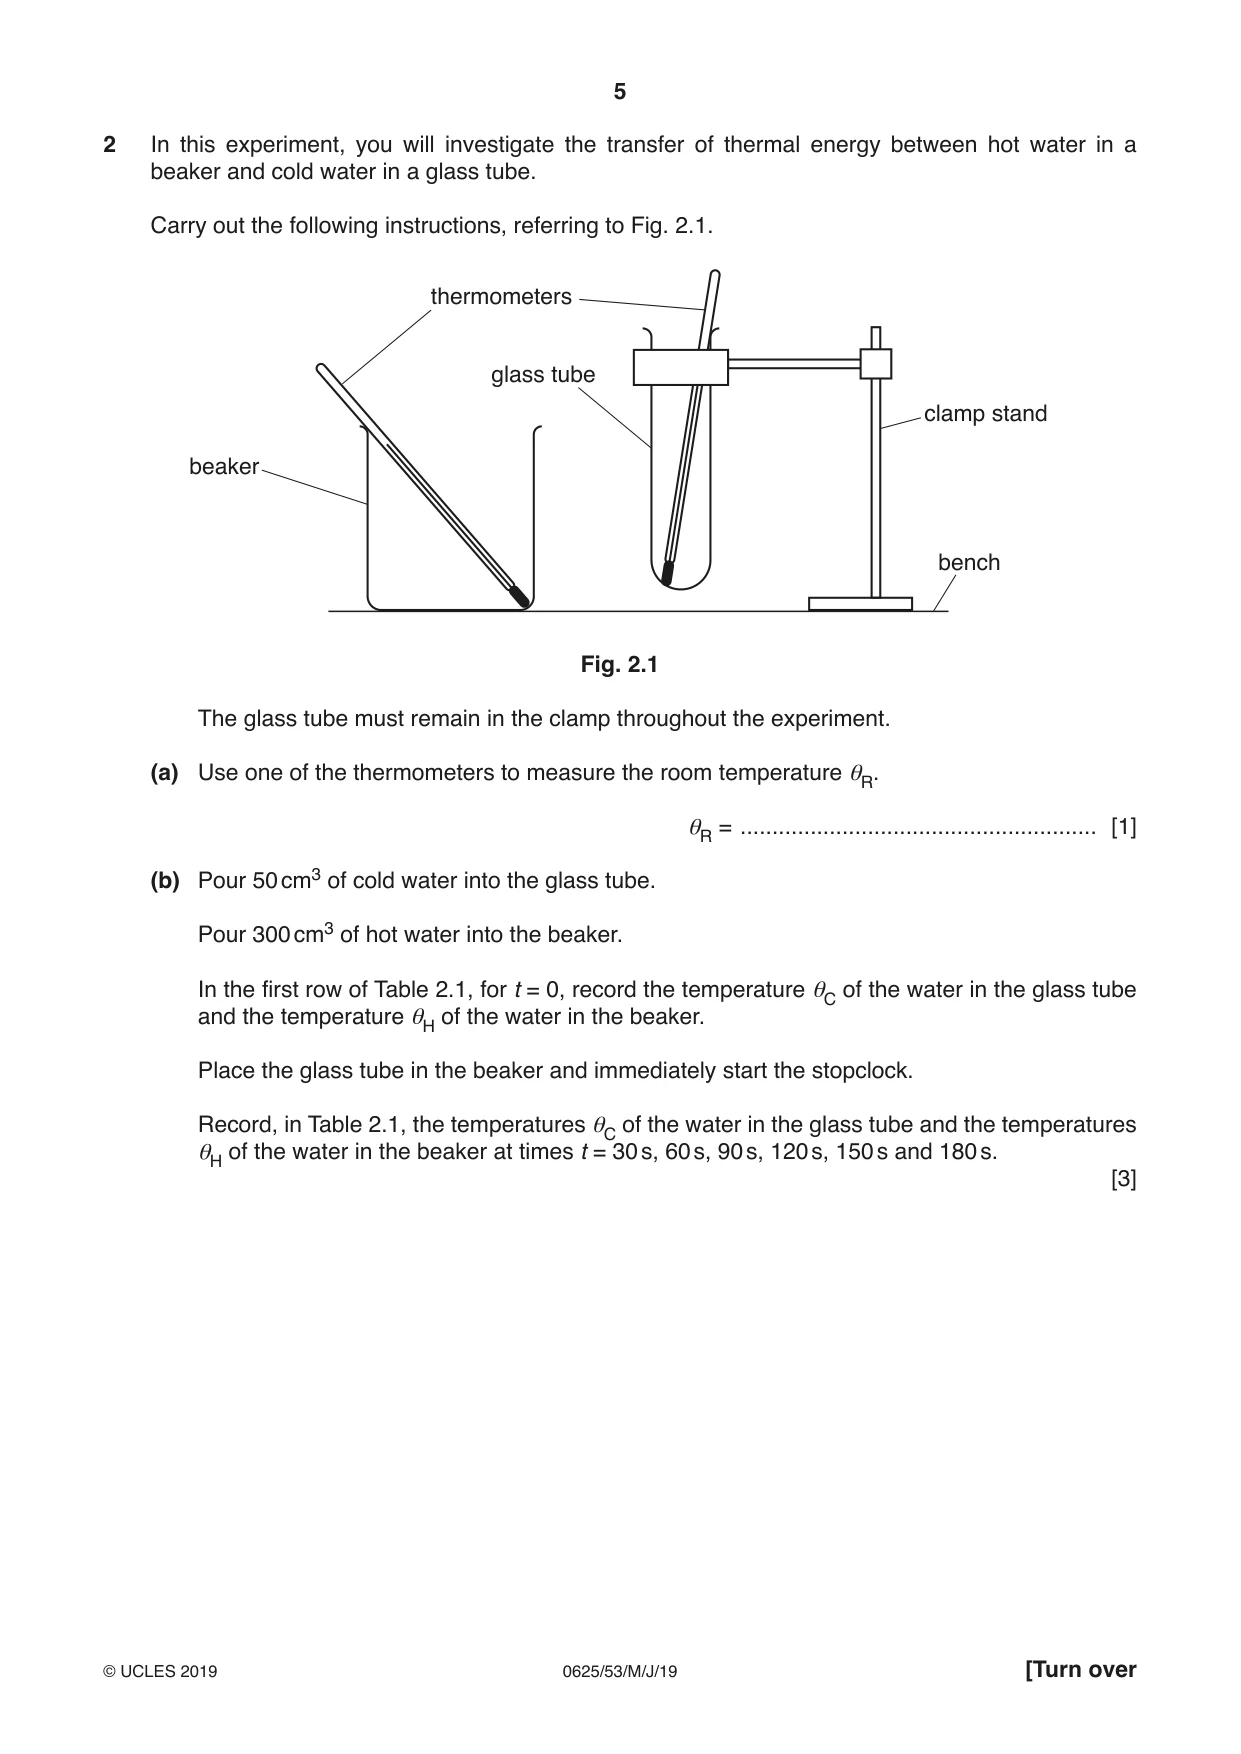
1 In this experiment, you will determine the mass of a block U by a balancing method. Carry out the following instructions, referring to Fig. 1.1. b block M block U a bench pivot 0.0 cm mark 50.0 cm mark metre rule Fig. 1.1 (a) Place the metre rule with the pivot below the 50.0 cm mark. The pivot must stay in this position for the duration of the experiment. Place block U on the metre rule with its centre at the 5.0 cm mark. Place block M on the metre rule on the other side of the pivot as shown in Fig. 1.1. Adjust the position of block M until the metre rule is as near to being balanced as possible. The distance a between the centre of block U and the 50.0 cm mark has been recorded in Table 1.1. In Table 1.1, record the position of block M. Calculate the distance b between the centre of block U and the centre of block M, using the equation: b = (position of block M – position of block U). Repeat the procedure for positions of block U at the 10.0 cm, 15.0 cm, 20.0 cm and 25.0 cm marks. Table 1.1 position of position of a / cm b / cm block U / cm block M / cm 5.0 45.0 10.0 40.0 15.0 35.0 20.0 30.0 25.0 25.0 [2] (b) Plot a graph of b / cm (y-axis) against a / cm (x-axis). You do not need to start the axis at the origin (0,0). [4] (c) (i) Determine the gradient G of the graph. Show clearly on the graph how you obtained the necessary information. G = ........................................................ [1] (ii) Calculate the mass MU of block U using the equation MU = (G – 1) × k, where k = 200 g. Record the value of MU to a suitable number of significant figures for this experiment. MU = ........................................................ [2] (d) Describe why it is difficult to place the block U at the correct mark on the metre rule each time. Explain how you overcame this difficulty. You may draw a diagram. ................................................................................................................................................... ................................................................................................................................................... ............................................................................................................................................. [1] (e) It is difficult to balance the metre rule in this type of experiment. Describe how to adjust the position of block M on the metre rule until the metre rule is as close to balance as possible. You may draw a diagram if it helps your explanation. ................................................................................................................................................... ................................................................................................................................................... ............................................................................................................................................. [1] [Total: 11]
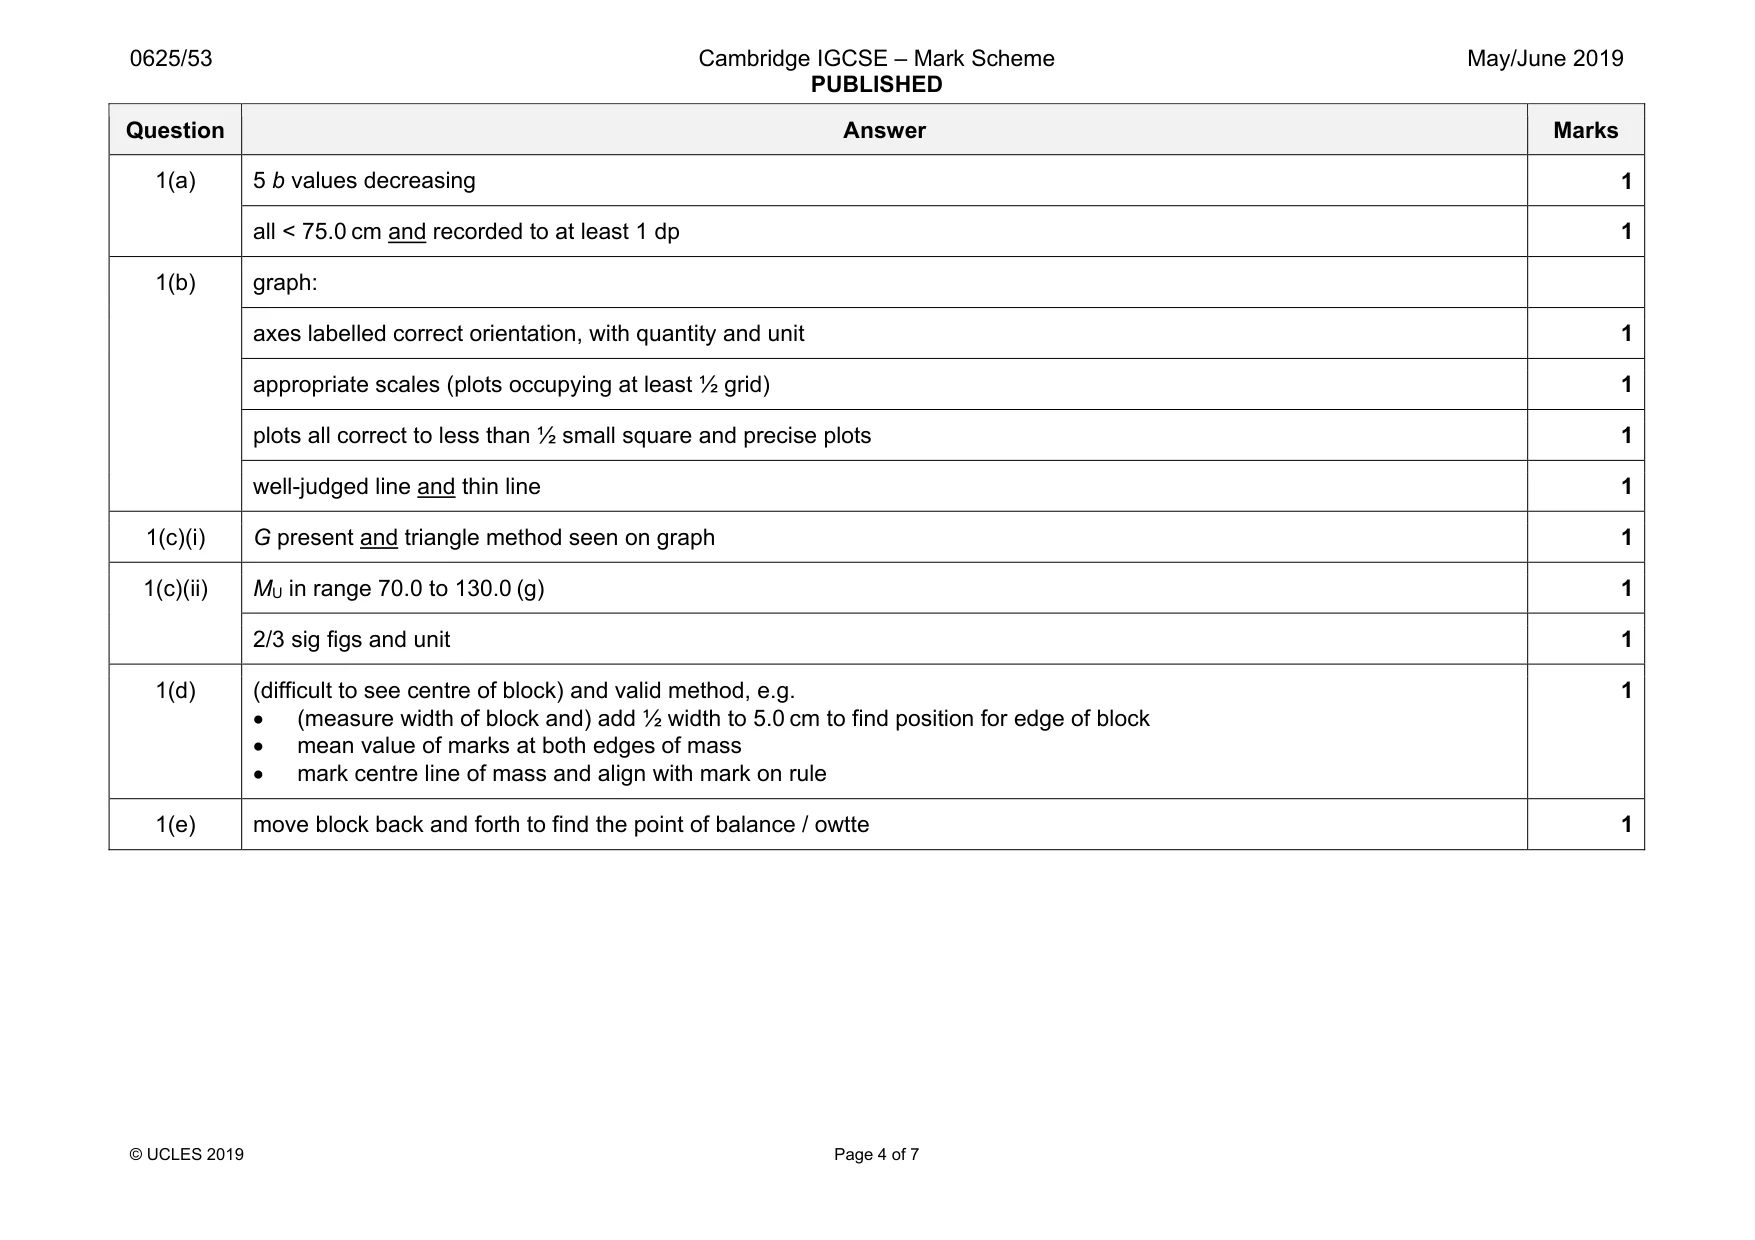
Mark scheme: 1(a) 5 b values decreasing 1 all < 75.0 cm and recorded to at least 1 dp 1 1(b) graph: axes labelled correct orientation, with quantity and unit 1 appropriate scales (plots occupying at least ½ grid) 1 plots all correct to less than ½ small square and precise plots 1 well-judged line and thin line 1 1(c)(i) G present and triangle method seen on graph 1 1(c)(ii) MU in range 70.0 to 130.0 (g) 1 2/3 sig figs and unit 1 1(d) (difficult to see centre of block) and valid method, e.g. • (measure width of block and) add ½ width to 5.0 cm to find position for edge of block • mean value of marks at both edges of mass • mark centre line of mass and align with mark on rule 1 1(e) move block back and forth to find the point of balance / owtte 1
More questions on Physical quantities and measurement techniques
Q2 · In this experiment, you will investigate the transfer of thermal energy between hot water…
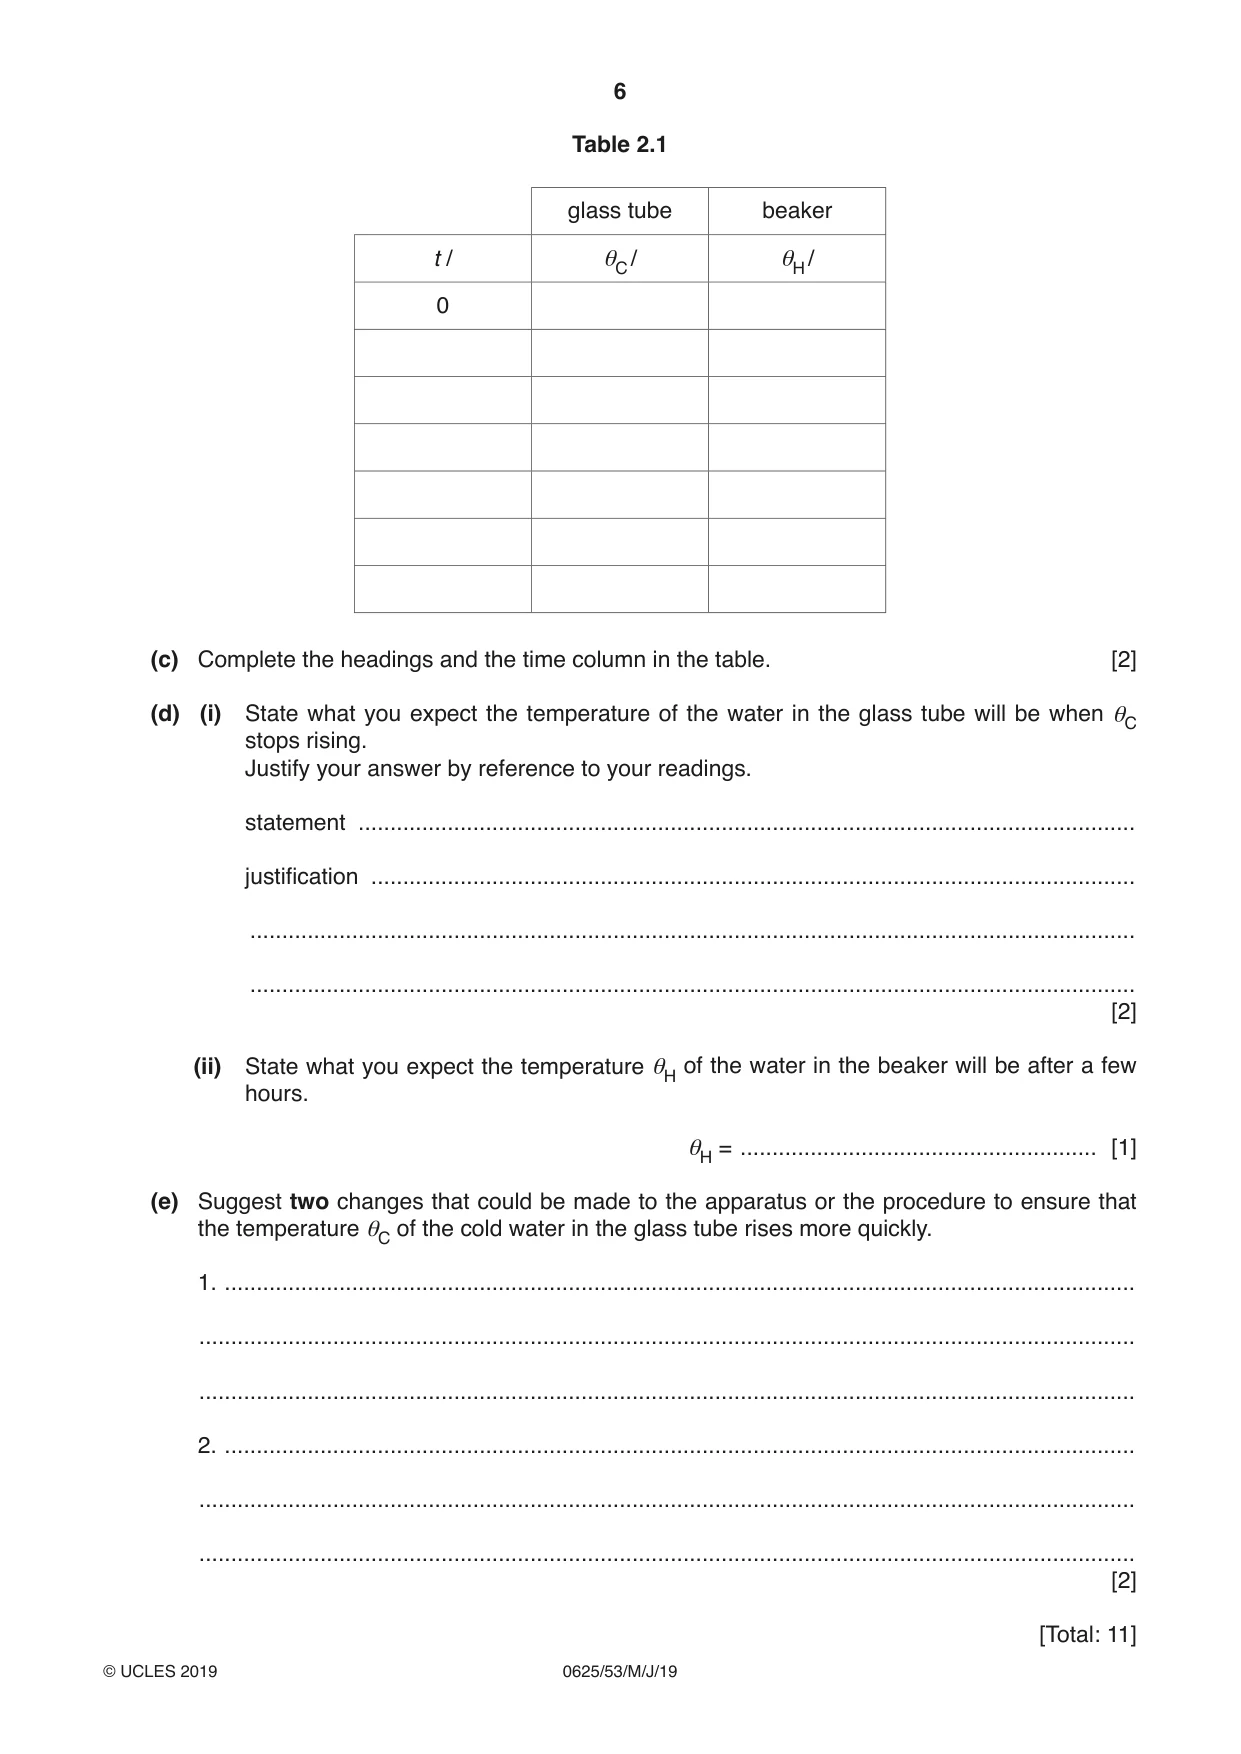
2 In this experiment, you will investigate the transfer of thermal energy between hot water in a beaker and cold water in a glass tube. Carry out the following instructions, referring to Fig. 2.1. thermometers glass tube clamp stand beaker bench Fig. 2.1 The glass tube must remain in the clamp throughout the experiment. (a) Use one of the thermometers to measure the room temperature θR. θR = ........................................................ [1] (b) Pour 50 cm3 of cold water into the glass tube. Pour 300 cm3 of hot water into the beaker. In the first row of Table 2.1, for t = 0, record the temperature θC of the water in the glass tube and the temperature θH of the water in the beaker. Place the glass tube in the beaker and immediately start the stopclock. Record, in Table 2.1, the temperatures θC of the water in the glass tube and the temperatures θH of the water in the beaker at times t = 30 s, 60 s, 90 s, 120 s, 150 s and 180 s. [3] Table 2.1 glass tube beaker t / θC / θH / 0 (c) Complete the headings and the time column in the table. [2] (d) (i) State what you expect the temperature of the water in the glass tube will be when θC stops rising. Justify your answer by reference to your readings. statement .......................................................................................................................... justification ........................................................................................................................ ........................................................................................................................................... ........................................................................................................................................... [2] (ii) State what you expect the temperature θH of the water in the beaker will be after a few hours. θH = ........................................................ [1] (e) Suggest two changes that could be made to the apparatus or the procedure to ensure that the temperature θC of the cold water in the glass tube rises more quickly. 1. ............................................................................................................................................... ................................................................................................................................................... ................................................................................................................................................... 2. ............................................................................................................................................... ................................................................................................................................................... ................................................................................................................................................... [2] [Total: 11]
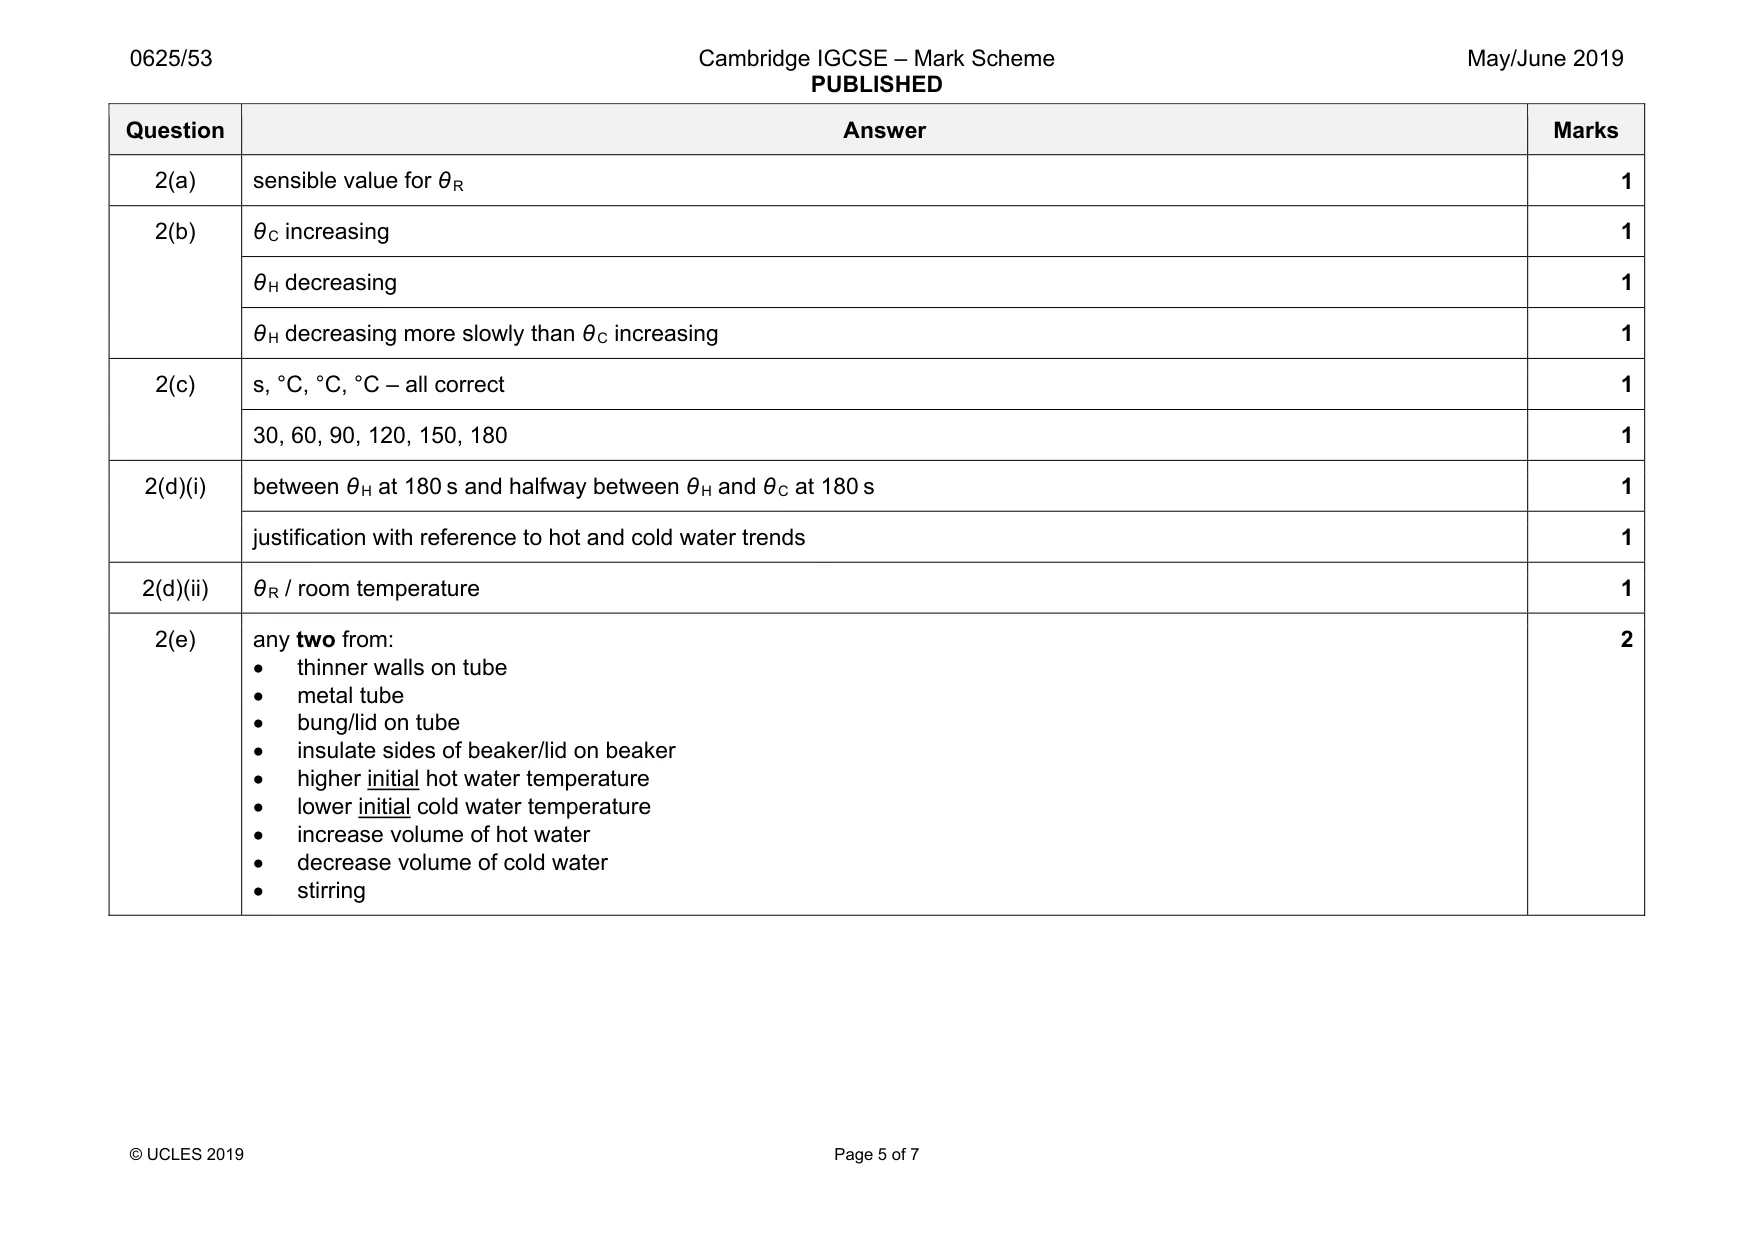
Mark scheme: 2(a) sensible value for θ R 1 2(b) θ C increasing 1 θ H decreasing 1 θ H decreasing more slowly than θ C increasing 1 2(c) s, °C, °C, °C – all correct 1 30, 60, 90, 120, 150, 180 1 2(d)(i) between θ H at 180 s and halfway between θ H and θ C at 180 s 1 justification with reference to hot and cold water trends 1 2(d)(ii) θ R / room temperature 1 2(e) any two from: • thinner walls on tube • metal tube • bung/lid on tube • insulate sides of beaker/lid on beaker • higher initial hot water temperature • lower initial cold water temperature • increase volume of hot water • decrease volume of cold water • stirring 2
Q3 · In this experiment, you will investigate a circuit containing different resistors
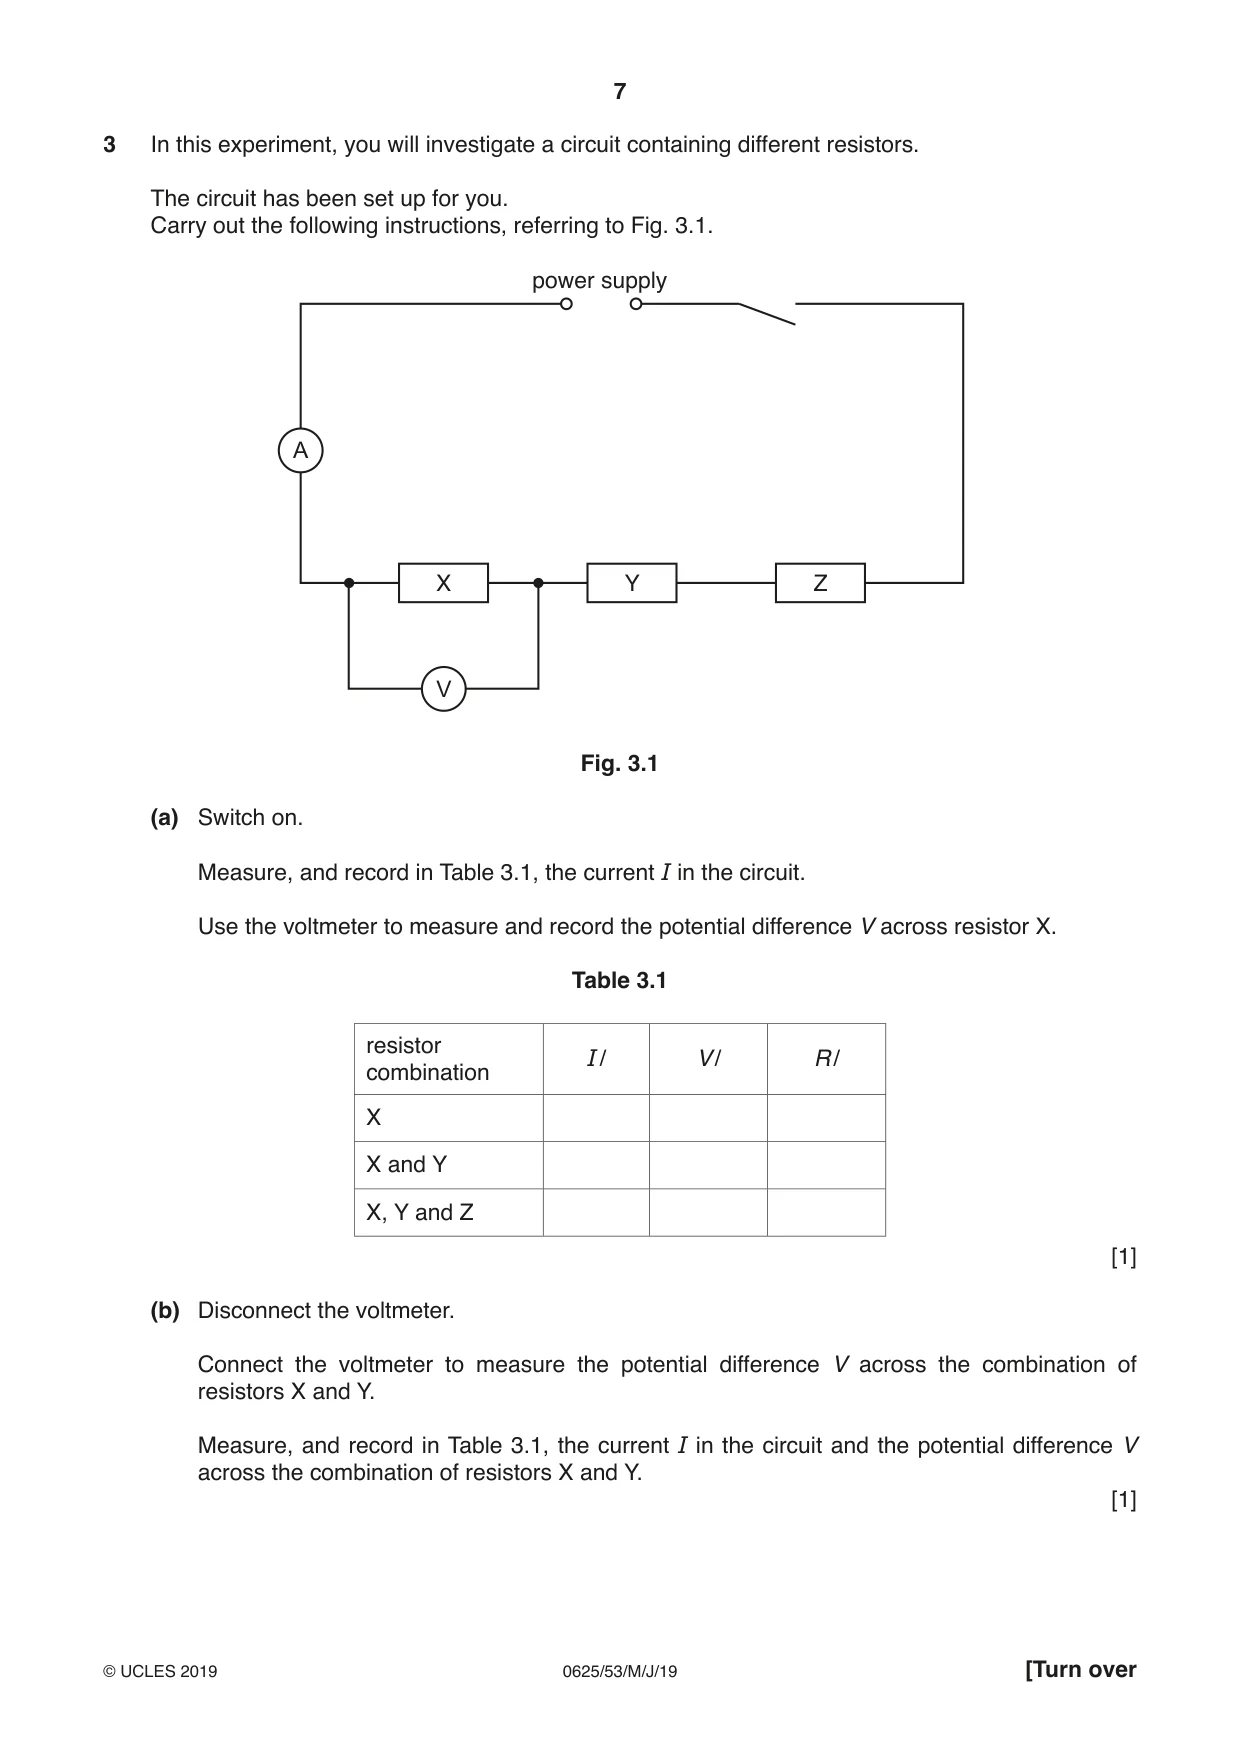
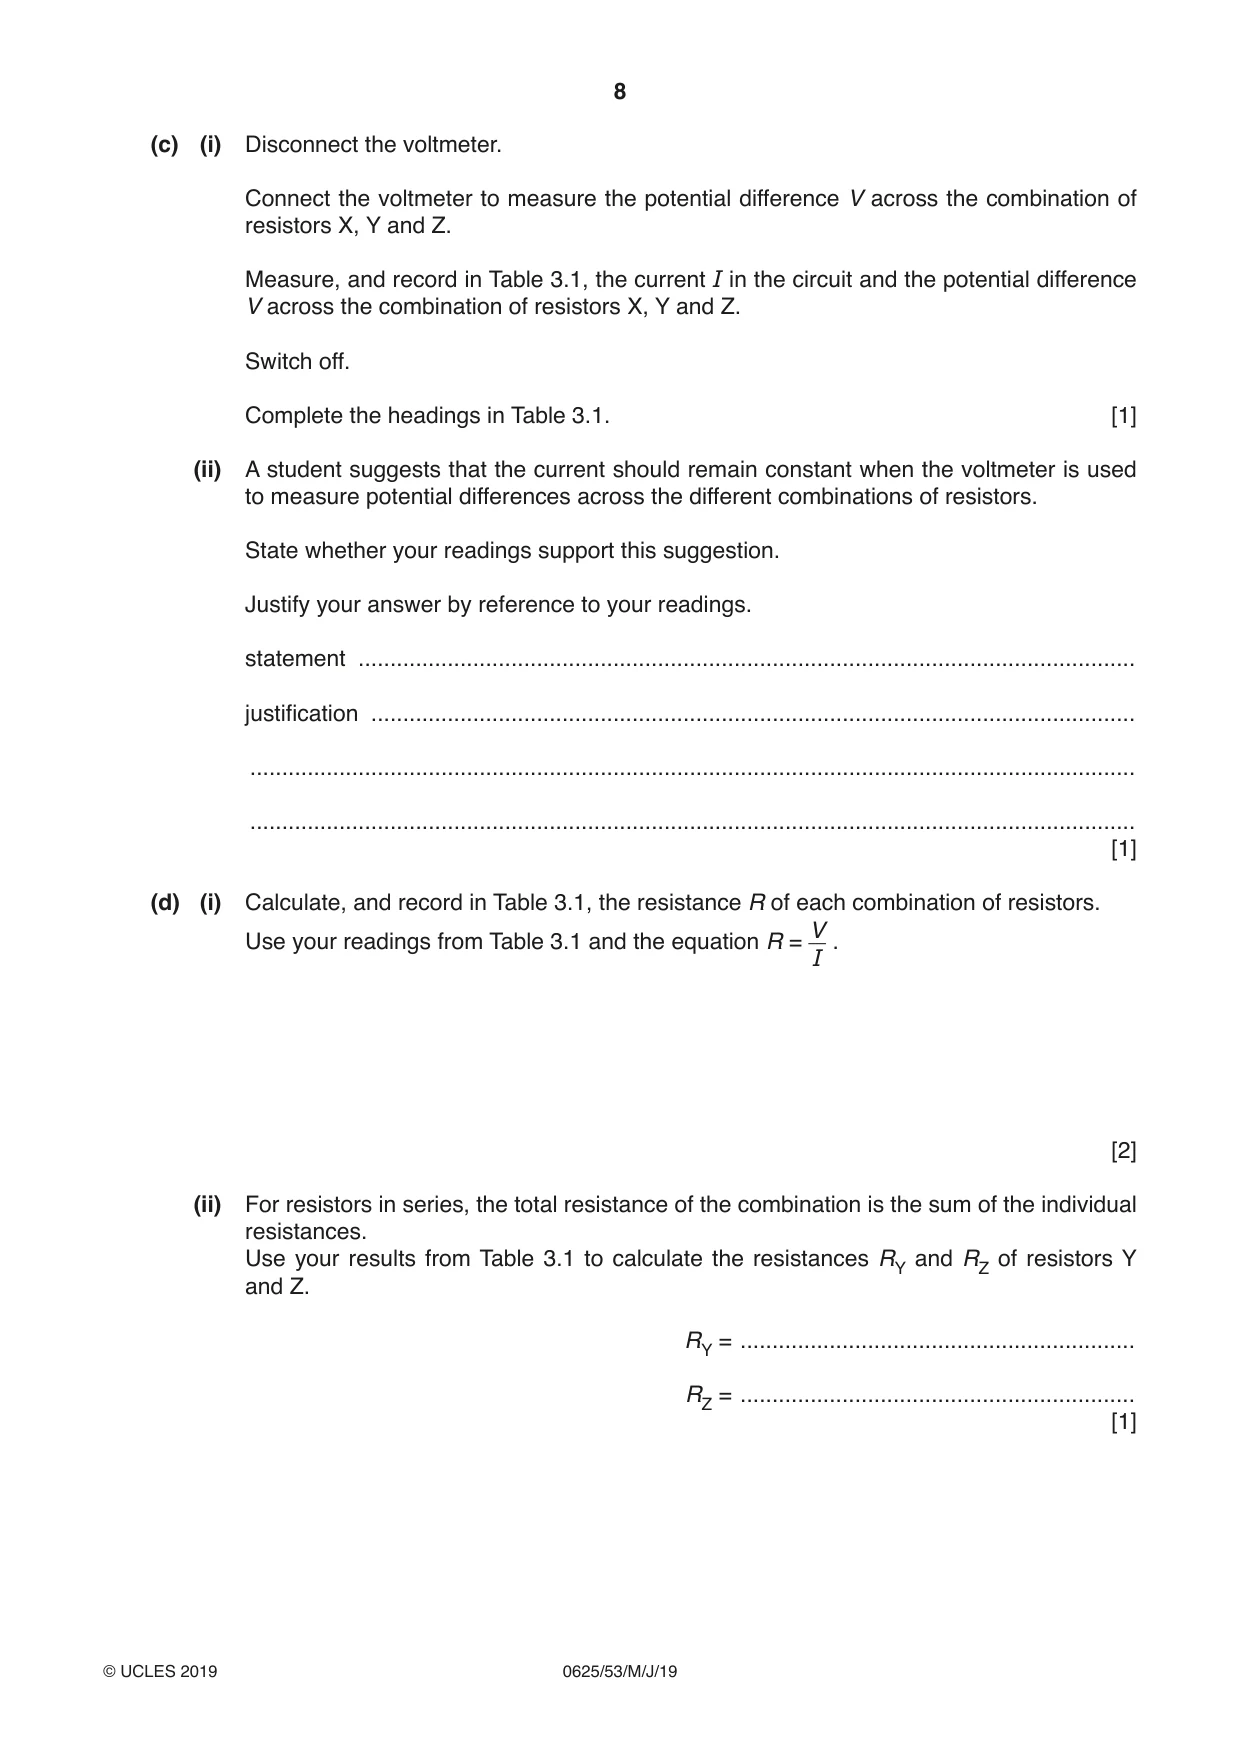
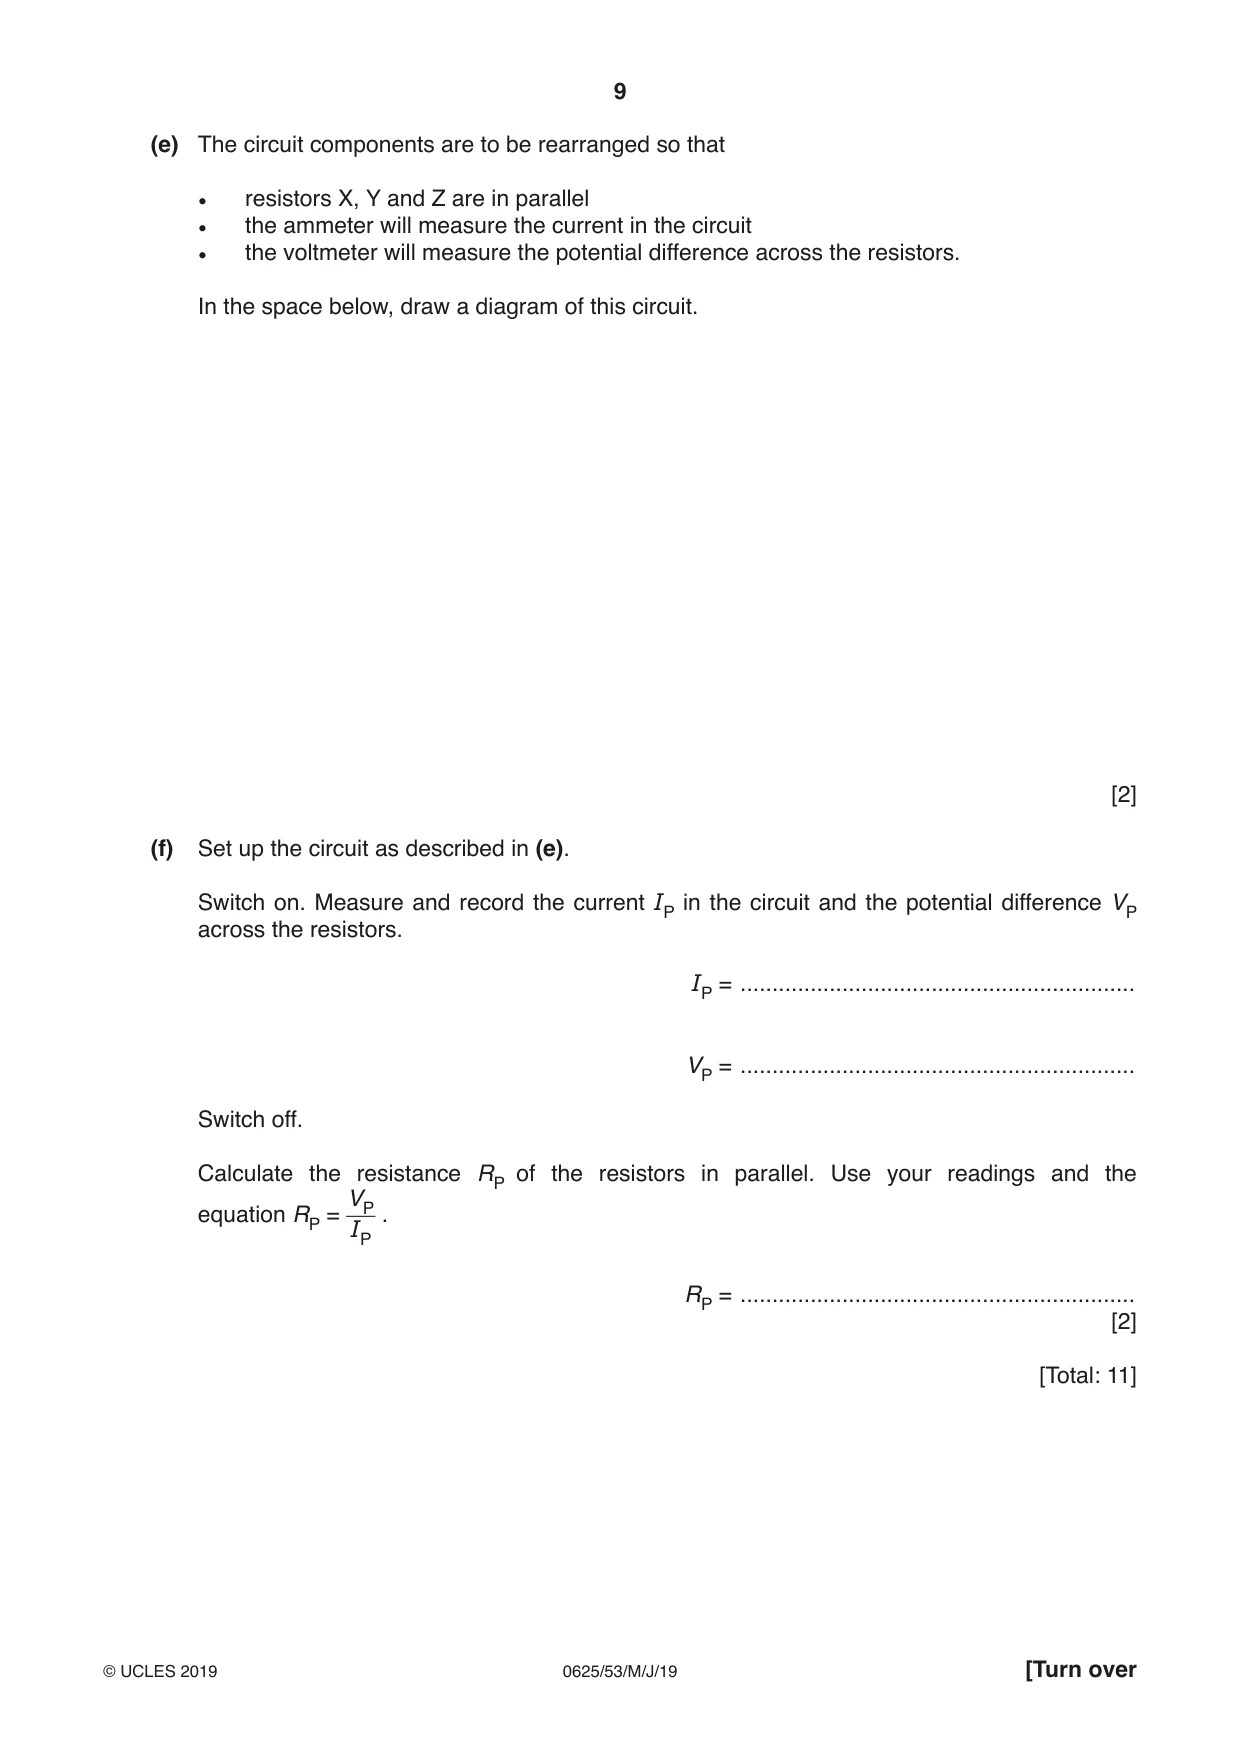
3 In this experiment, you will investigate a circuit containing different resistors. The circuit has been set up for you. Carry out the following instructions, referring to Fig. 3.1. power supply A X Y Z V Fig. 3.1 (a) Switch on. Measure, and record in Table 3.1, the current I in the circuit. Use the voltmeter to measure and record the potential difference V across resistor X. Table 3.1 resistor I / V / R / combination X X and Y X, Y and Z [1] (b) Disconnect the voltmeter. Connect the voltmeter to measure the potential difference V across the combination of resistors X and Y. Measure, and record in Table 3.1, the current I in the circuit and the potential difference V across the combination of resistors X and Y. [1] (c) (i) Disconnect the voltmeter. Connect the voltmeter to measure the potential difference V across the combination of resistors X, Y and Z. Measure, and record in Table 3.1, the current I in the circuit and the potential difference V across the combination of resistors X, Y and Z. Switch off. Complete the headings in Table 3.1. [1] (ii) A student suggests that the current should remain constant when the voltmeter is used to measure potential differences across the different combinations of resistors. State whether your readings support this suggestion. Justify your answer by reference to your readings. statement .......................................................................................................................... justification ........................................................................................................................ ........................................................................................................................................... ........................................................................................................................................... [1] (d) (i) Calculate, and record in Table 3.1, the resistance R of each combination of resistors. V Use your readings from Table 3.1 and the equation R = . I [2] (ii) For resistors in series, the total resistance of the combination is the sum of the individual resistances. Use your results from Table 3.1 to calculate the resistances RY and RZ of resistors Y and Z. RY = .............................................................. RZ = .............................................................. [1] (e) The circuit components are to be rearranged so that • resistors X, Y and Z are in parallel • the ammeter will measure the current in the circuit • the voltmeter will measure the potential difference across the resistors. In the space below, draw a diagram of this circuit. [2] (f) Set up the circuit as described in (e). Switch on. Measure and record the current IP in the circuit and the potential difference VP across the resistors. IP = .............................................................. VP = .............................................................. Switch off. Calculate the resistance RP of the resistors in parallel. Use your readings and the VP equation RP = . IP RP = .............................................................. [2] [Total: 11]
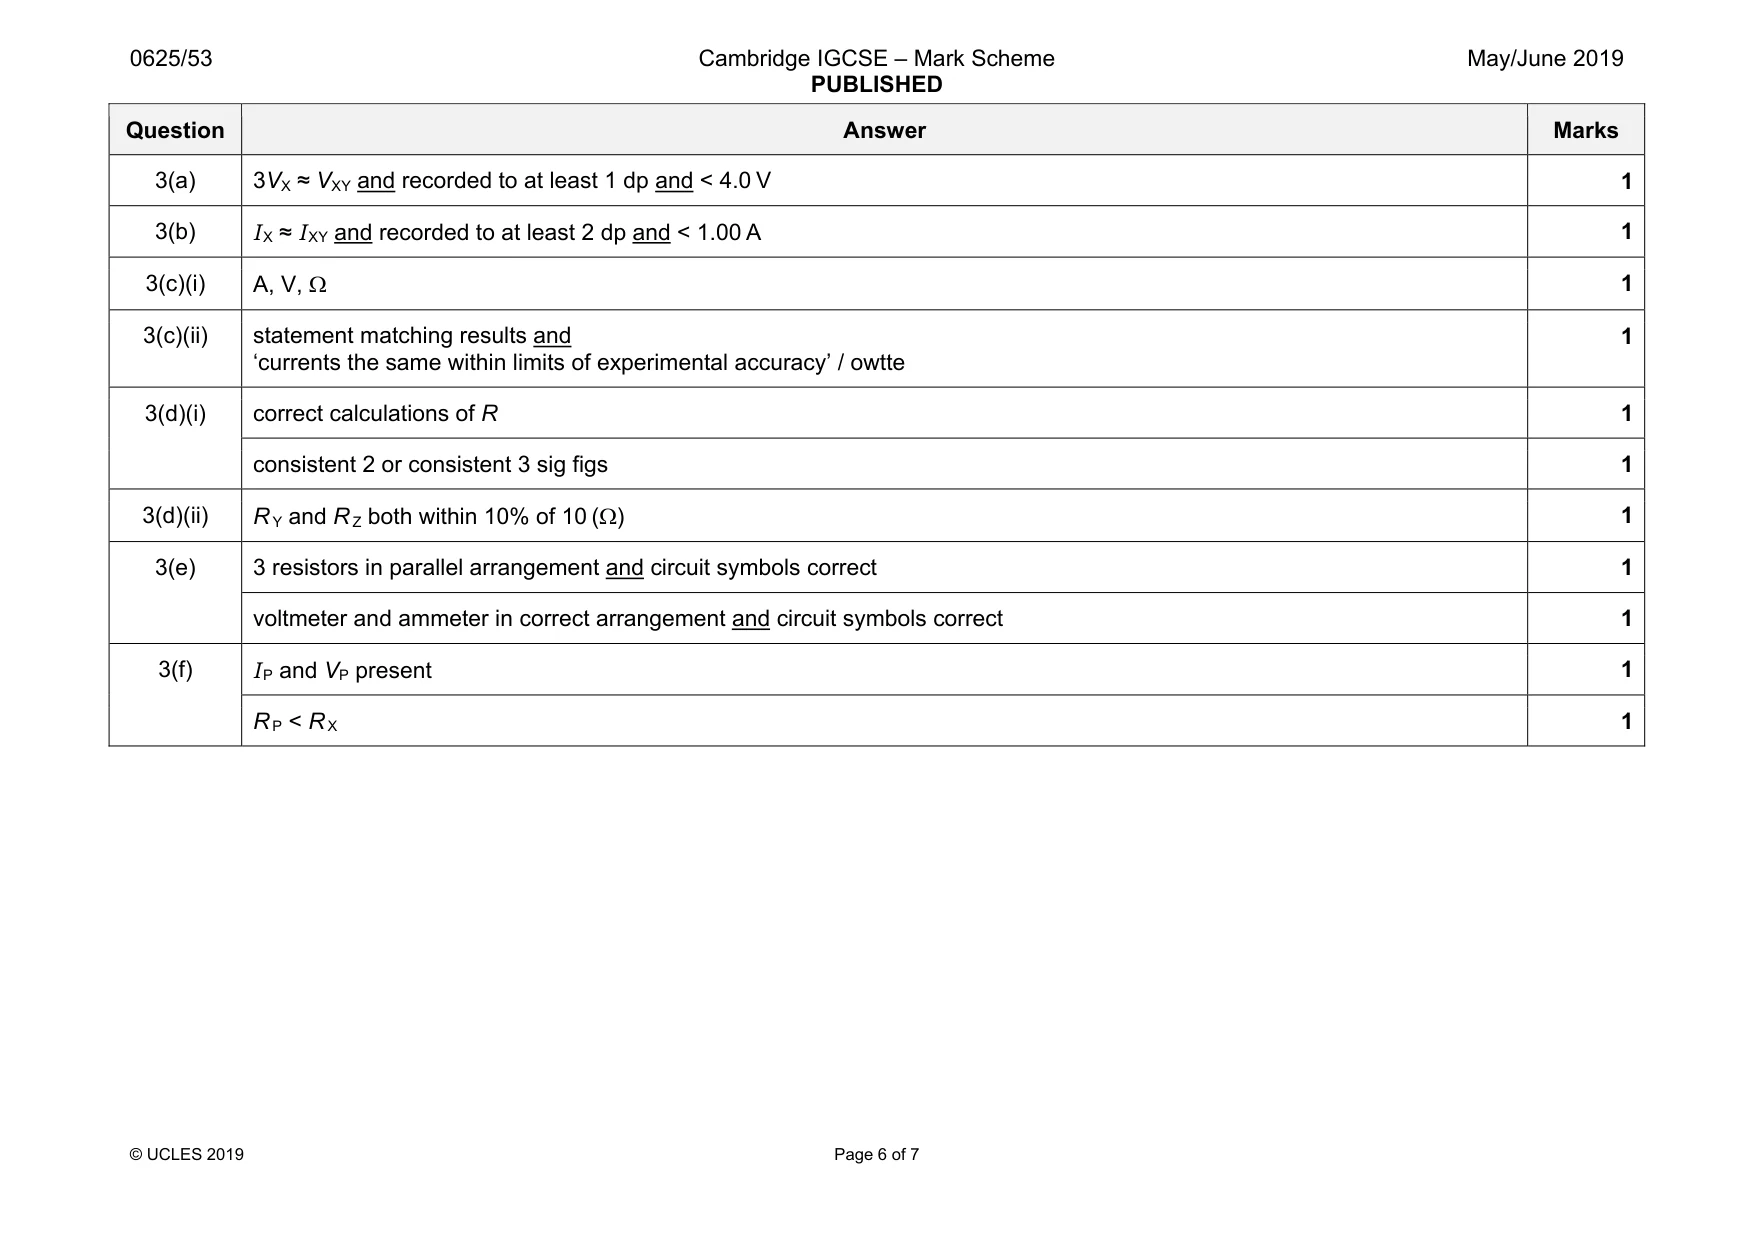
Mark scheme: 3(a) 3VX ≈ VXY and recorded to at least 1 dp and < 4.0 V 1 3(b) I X ≈ I XY and recorded to at least 2 dp and < 1.00 A 1 3(c)(i) A, V, Ω 1 3(c)(ii) statement matching results and ‘currents the same within limits of experimental accuracy’ / owtte 1 3(d)(i) correct calculations of R 1 consistent 2 or consistent 3 sig figs 1 3(d)(ii) R Y and R Z both within 10% of 10 (Ω) 1 3(e) 3 resistors in parallel arrangement and circuit symbols correct 1 voltmeter and ammeter in correct arrangement and circuit symbols correct 1 3(f) I P and VP present 1 R P < R X 1
Q4 · A student wants to investigate the factors that affect the height to which a ball bounces…
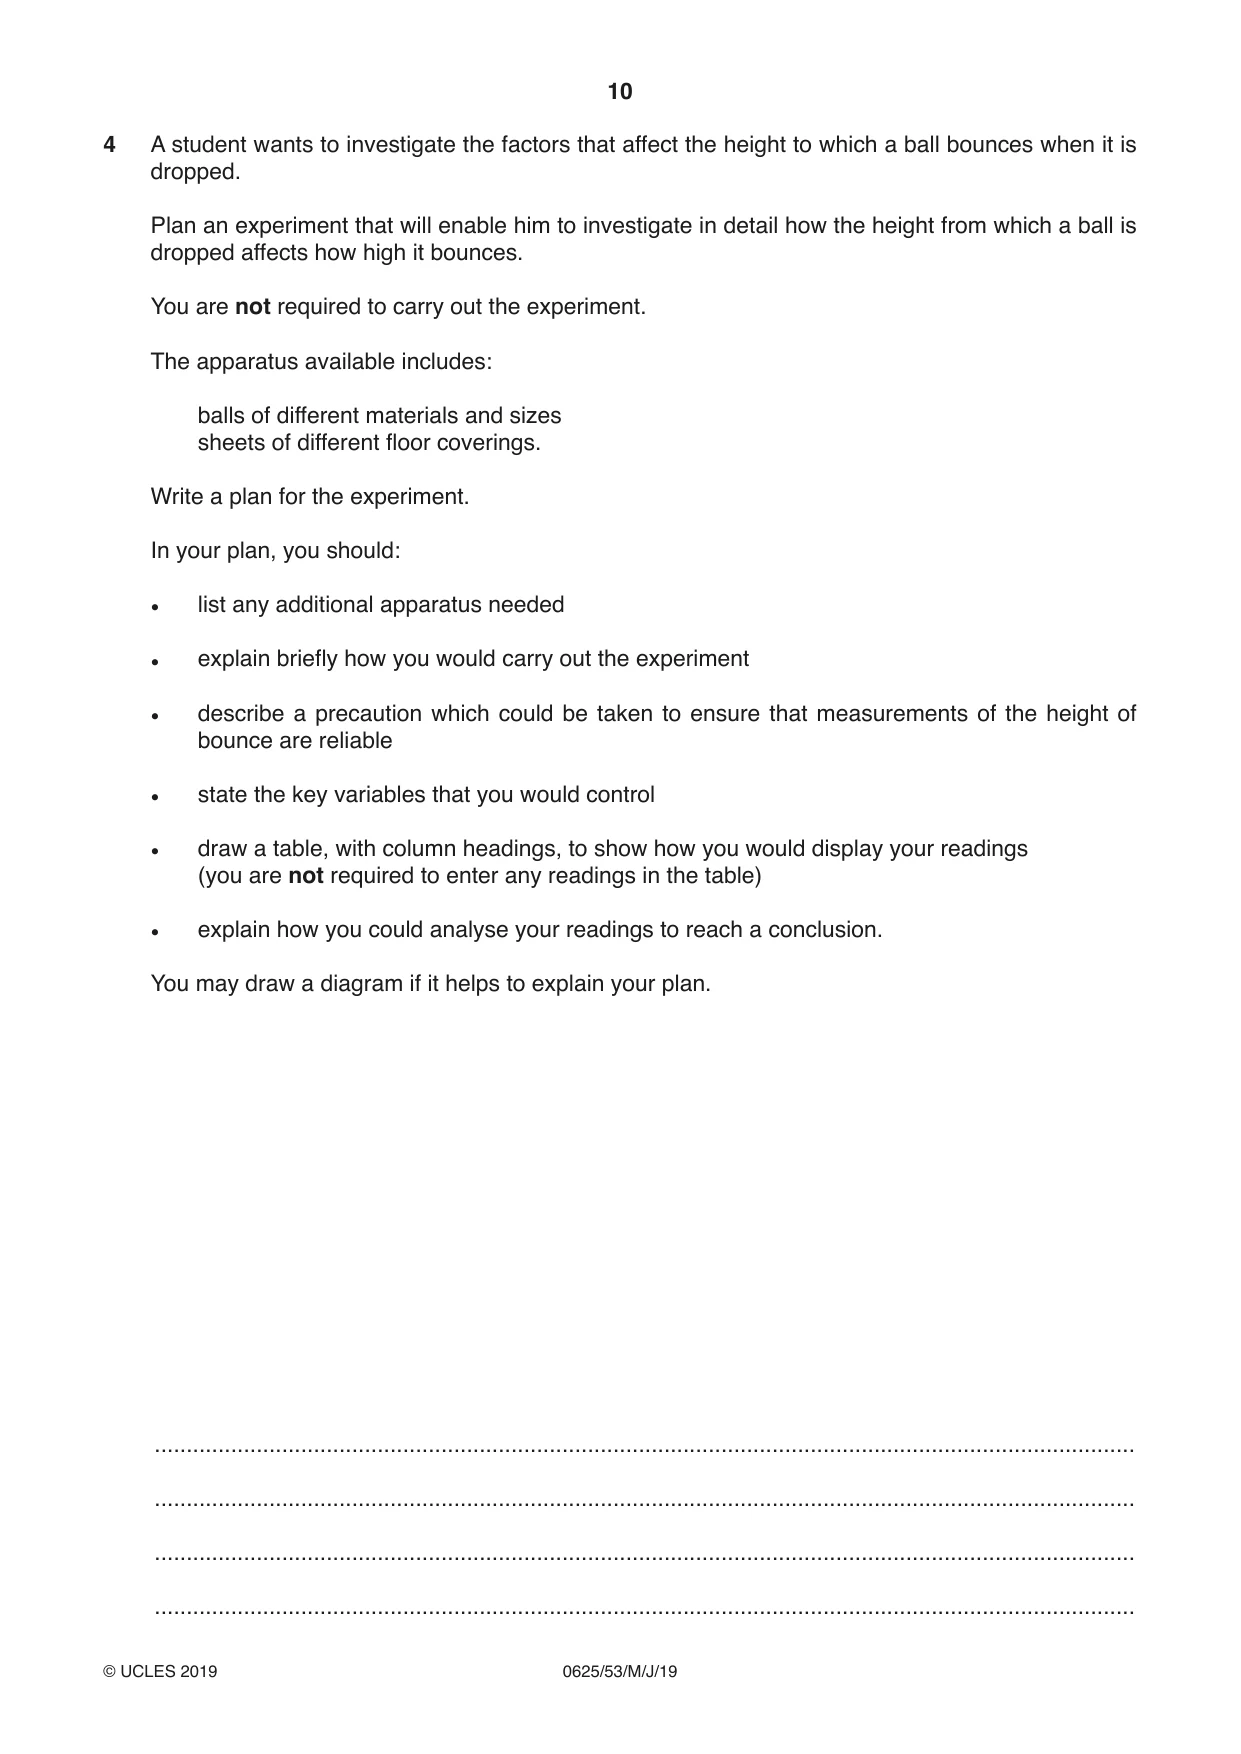
4 A student wants to investigate the factors that affect the height to which a ball bounces when it is dropped. Plan an experiment that will enable him to investigate in detail how the height from which a ball is dropped affects how high it bounces. You are not required to carry out the experiment. The apparatus available includes: balls of different materials and sizes sheets of different floor coverings. Write a plan for the experiment. In your plan, you should: • list any additional apparatus needed • explain briefly how you would carry out the experiment • describe a precaution which could be taken to ensure that measurements of the height of bounce are reliable • state the key variables that you would control • draw a table, with column headings, to show how you would display your readings (you are not required to enter any readings in the table) • explain how you could analyse your readings to reach a conclusion. You may draw a diagram if it helps to explain your plan. .......................................................................................................................................................... .......................................................................................................................................................... .......................................................................................................................................................... .......................................................................................................................................................... .......................................................................................................................................................... .......................................................................................................................................................... .......................................................................................................................................................... .......................................................................................................................................................... .......................................................................................................................................................... .......................................................................................................................................................... .......................................................................................................................................................... .......................................................................................................................................................... .......................................................................................................................................................... .......................................................................................................................................................... .......................................................................................................................................................... .......................................................................................................................................................... .......................................................................................................................................................... .......................................................................................................................................................... .......................................................................................................................................................... .......................................................................................................................................................... .......................................................................................................................................................... .......................................................................................................................................................... .......................................................................................................................................................... .......................................................................................................................................................... .......................................................................................................................................................... .................................................................................................................................................... [7] [Total: 7]
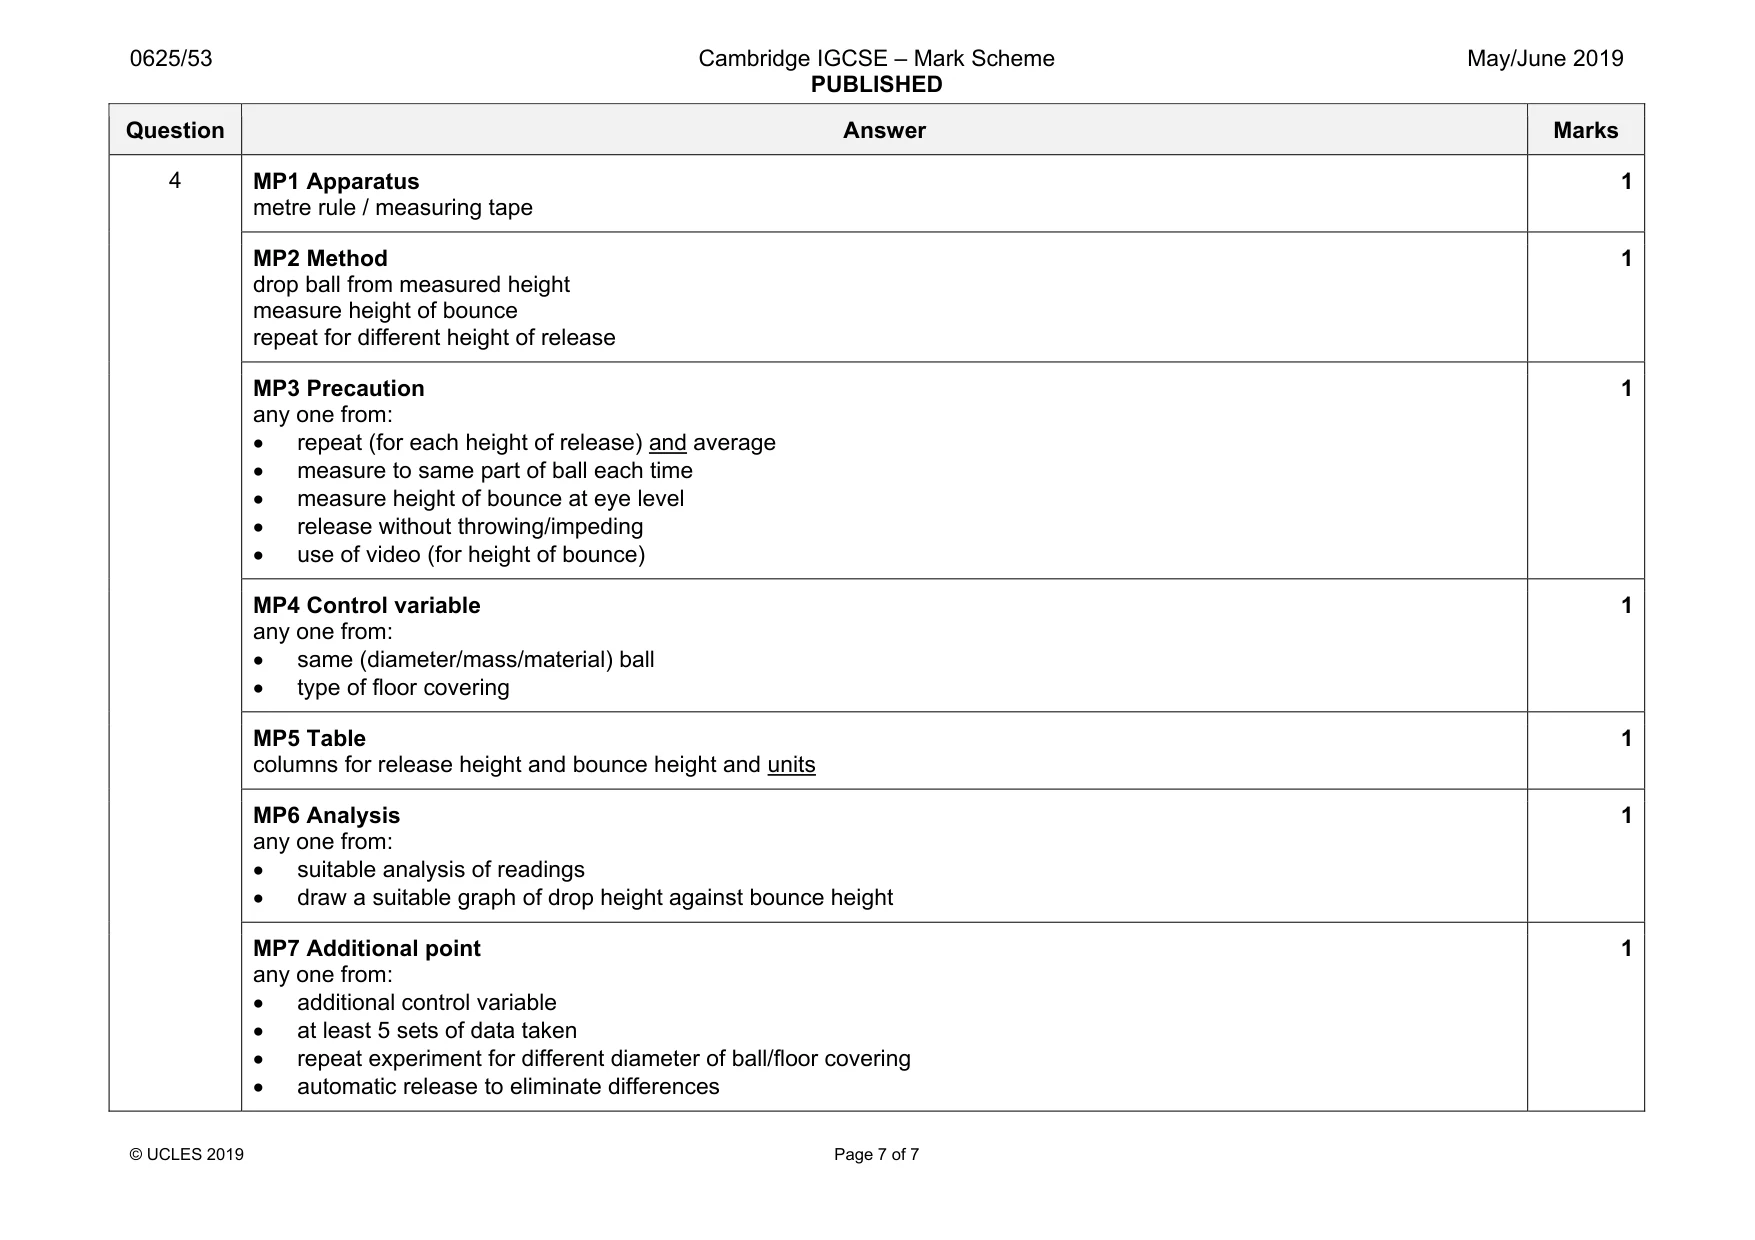
Mark scheme: 4 MP1 Apparatus metre rule / measuring tape 1 MP2 Method drop ball from measured height measure height of bounce repeat for different height of release 1 MP3 Precaution any one from: • repeat (for each height of release) and average • measure to same part of ball each time • measure height of bounce at eye level • release without throwing/impeding • use of video (for height of bounce) 1 MP4 Control variable any one from: • same (diameter/mass/material) ball • type of floor covering 1 MP5 Table columns for release height and bounce height and units 1 MP6 Analysis any one from: • suitable analysis of readings • draw a suitable graph of drop height against bounce height 1 MP7 Additional point any one from: • additional control variable • at least 5 sets of data taken • repeat experiment for different diameter of ball/floor covering • automatic release to eliminate differences 1
More questions on Physical quantities and measurement techniques
What was in this paper
The subtopics covered by these 4 questions, and how many questions each got. Open one in a new tab to see every Cambridge question on it.
What you needed in this session
Cambridge’s own grade thresholds for 2019 May/June, Paper 5 · Variant 3. A higher threshold means an easier paper — the bar moves with how the cohort did.