Cambridge IGCSE Physics 0625 — 2025 Oct/Nov Paper 5 · Variant 2
0625/52/O/N/25 · 4 questions · 40 marks · ≈45 min
The question paper and its mark scheme, free to read here and free to download. This is Cambridge’s own paper, exactly as it was sat.
Question paper16 pages



Mark scheme13 pages
Answers below. Sit the paper first if you are practising.
Questions as text
Q1 · In this experiment, you will investigate the reflection of light by a plane mirror
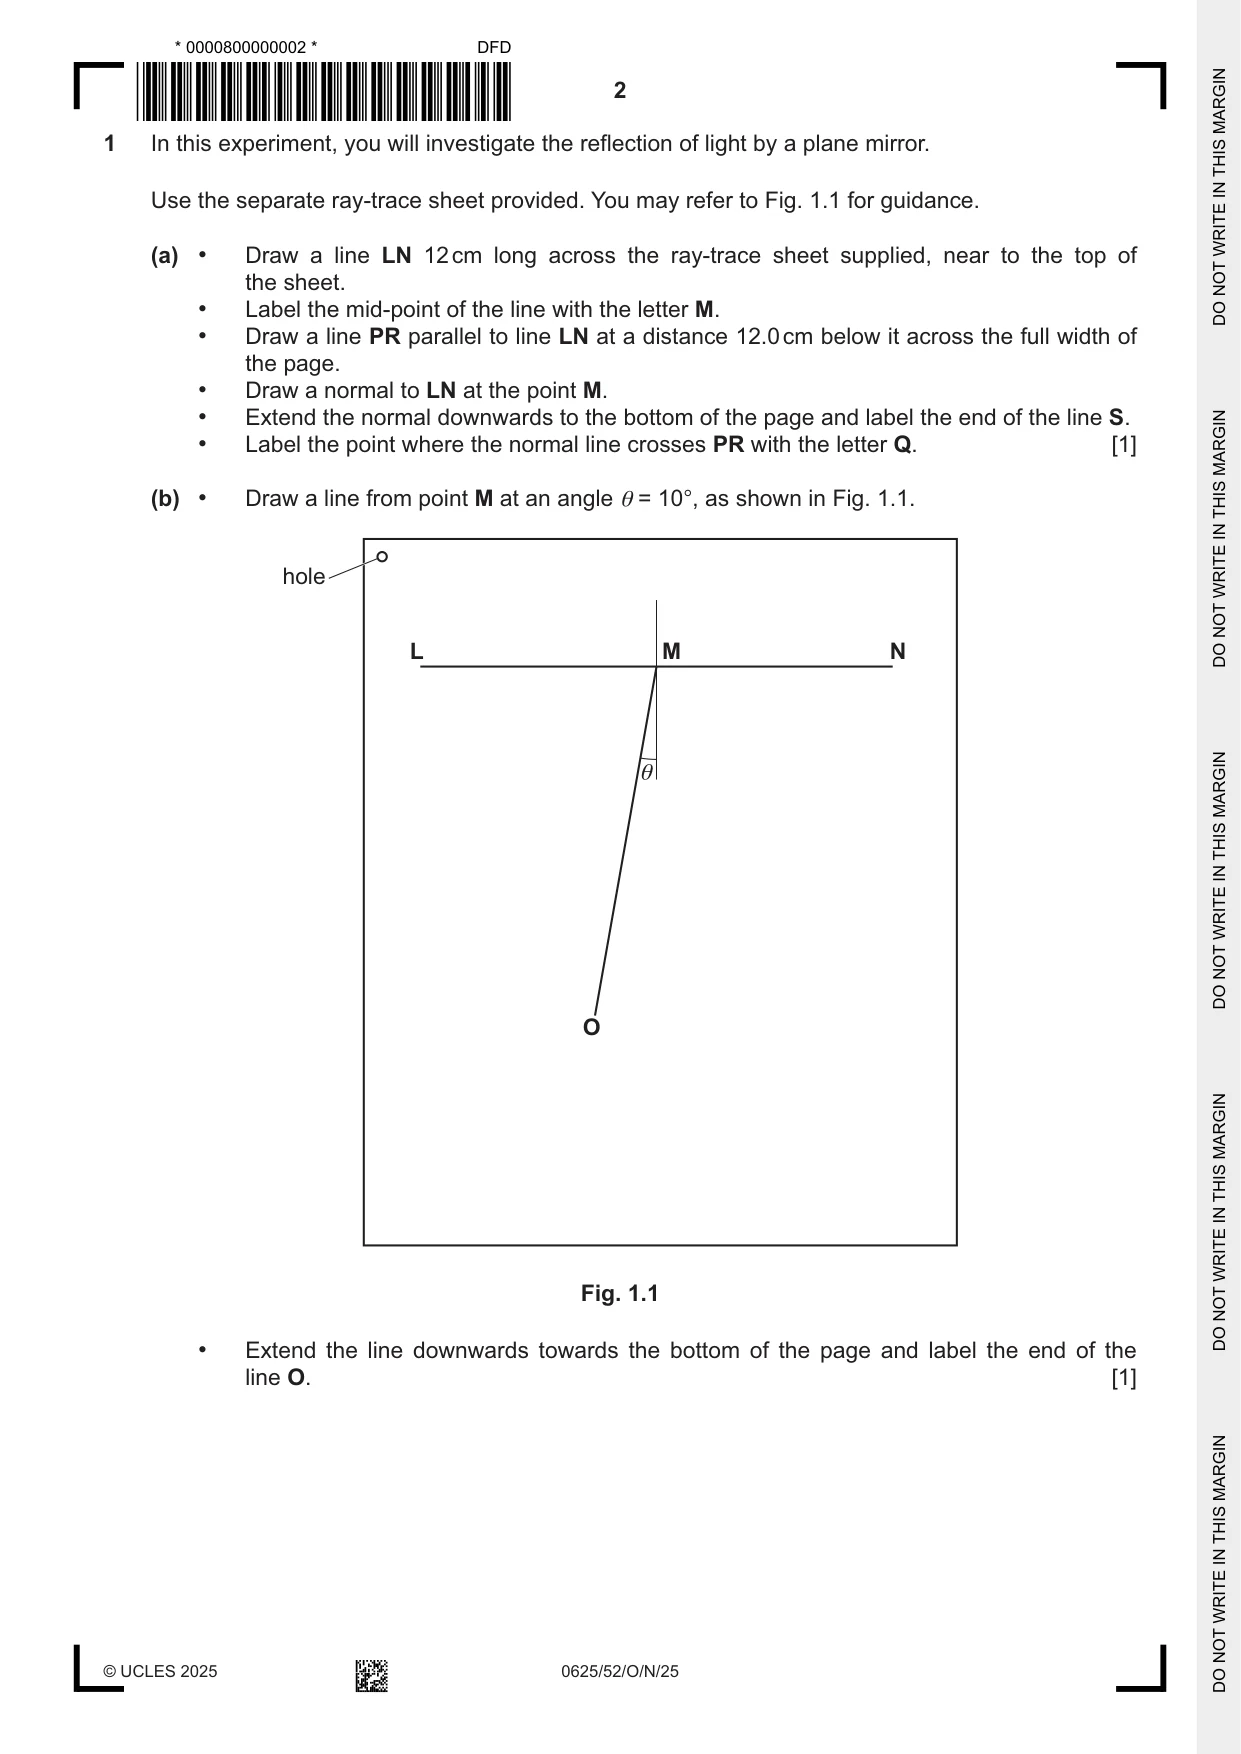
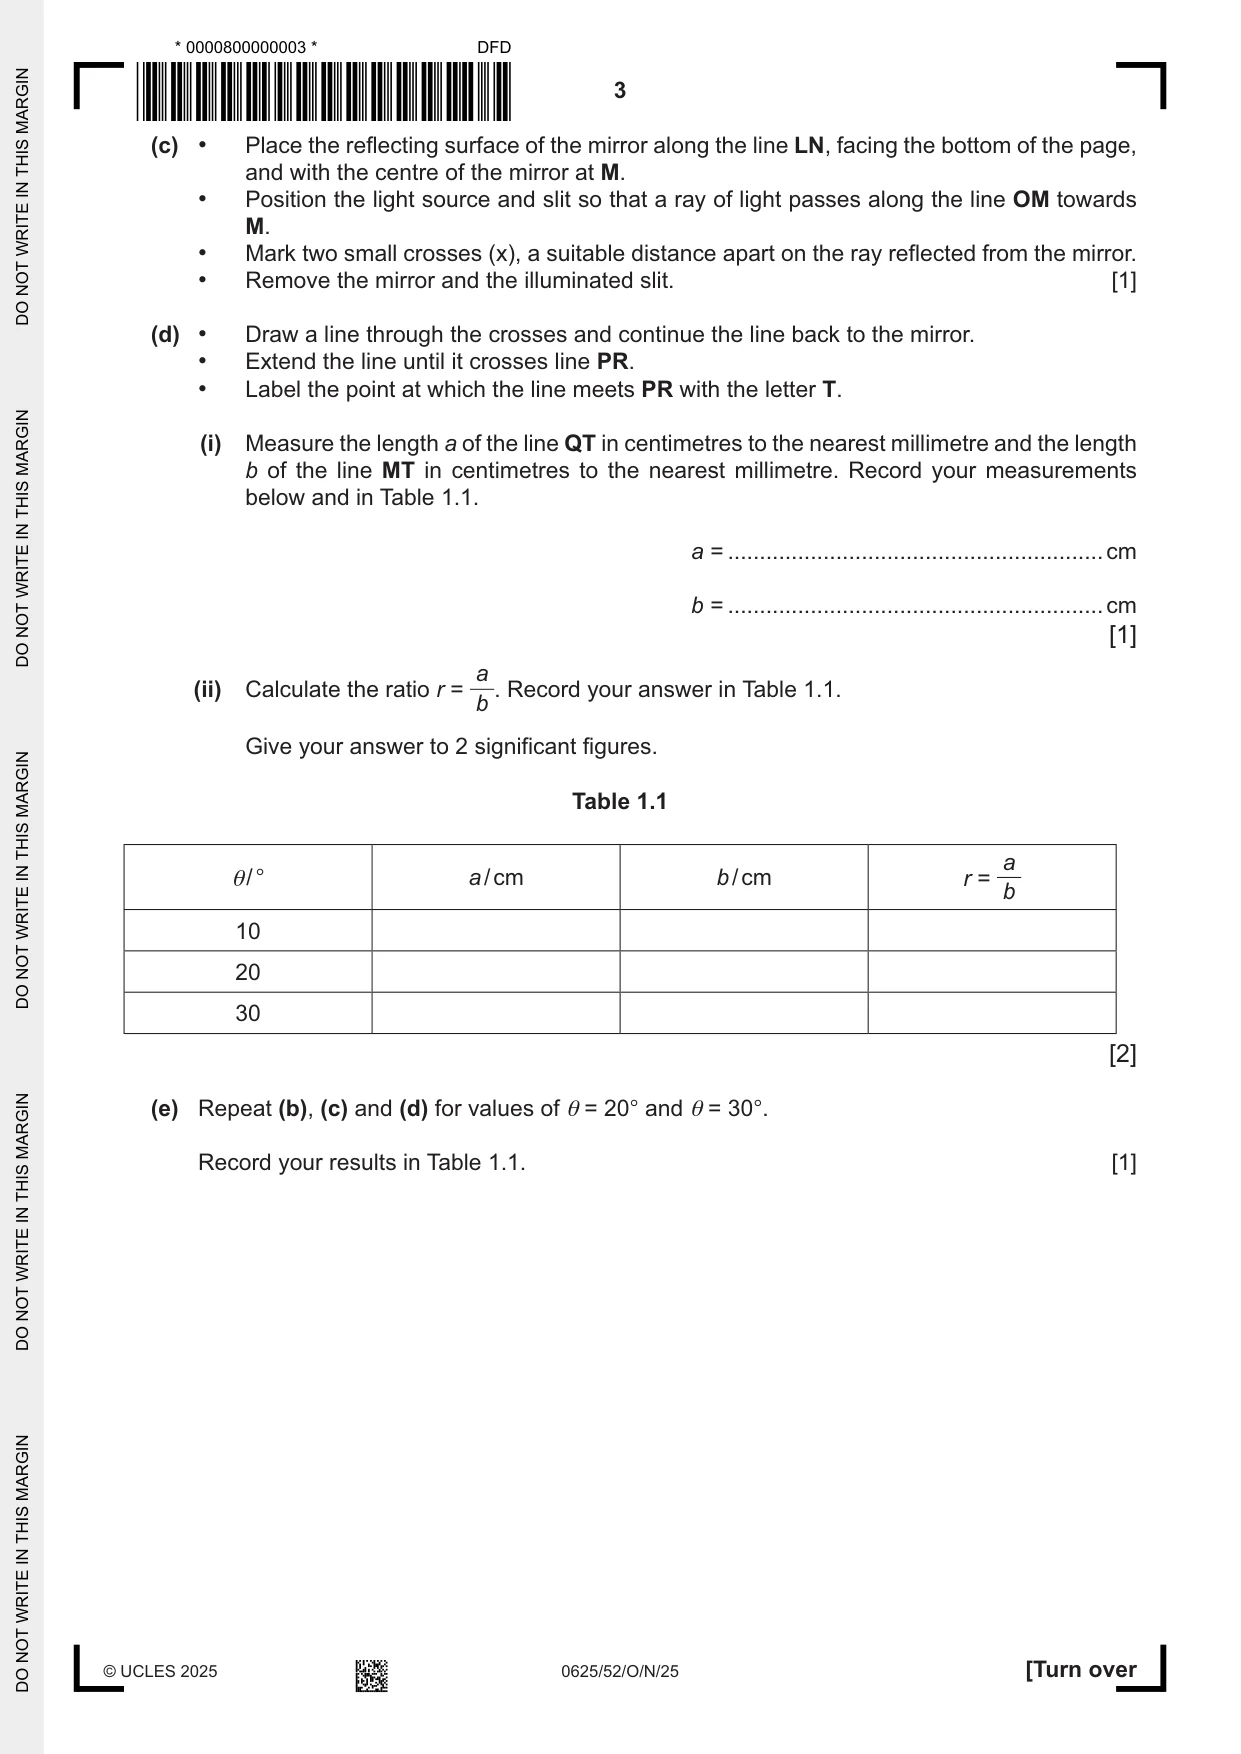
1 In this experiment, you will investigate the reflection of light by a plane mirror. Use the separate ray-trace sheet provided. You may refer to Fig. 1.1 for guidance. (a) • Draw a line LN 12 cm long across the ray-trace sheet supplied, near to the top of the sheet. • Label the mid-point of the line with the letter M. • Draw a line PR parallel to line LN at a distance 12.0 cm below it across the full width of the page. • Draw a normal to LN at the point M. • Extend the normal downwards to the bottom of the page and label the end of the line S. • Label the point where the normal line crosses PR with the letter Q. [1] (b) • Draw a line from point M at an angle θ = 10°, as shown in Fig. 1.1. hole L M N θ O Fig. 1.1 • Extend the line downwards towards the bottom of the page and label the end of the line O. [1] (c) • Place the reflecting surface of the mirror along the line LN, facing the bottom of the page, and with the centre of the mirror at M. • Position the light source and slit so that a ray of light passes along the line OM towards M. • Mark two small crosses (x), a suitable distance apart on the ray reflected from the mirror. • Remove the mirror and the illuminated slit. [1] (d) • Draw a line through the crosses and continue the line back to the mirror. • Extend the line until it crosses line PR. • Label the point at which the line meets PR with the letter T. (i) Measure the length a of the line QT in centimetres to the nearest millimetre and the length b of the line MT in centimetres to the nearest millimetre. Record your measurements below and in Table 1.1. a = ...........................................................cm b = ...........................................................cm [1] a (ii) Calculate the ratio r = . Record your answer in Table 1.1. b Give your answer to 2 significant figures. Table 1.1 a θ/ ° a / cm b / cm r = b 10 20 30 [2] (e) Repeat (b), (c) and (d) for values of θ = 20° and θ = 30°. Record your results in Table 1.1. [1] (f) A student says that r is directly proportional to θ . State if you agree with the student’s statement. Use values from Table 1.1 to justify your answer. statement .................................................................................................................................. justification ................................................................................................................................ ................................................................................................................................................... ................................................................................................................................................... [2] (g) Suggest what you can do to have more confidence in your answer to part (f). ................................................................................................................................................... ................................................................................................................................................... ............................................................................................................................................. [1] (h) Suggest one source of inaccuracy in this experiment, even if it is carried out very carefully. ................................................................................................................................................... ............................................................................................................................................. [1] [Total: 11] Write your name, centre number and candidate number on your ray-trace sheet. Tie your ray-trace sheet into this Booklet between pages 2 and 3.
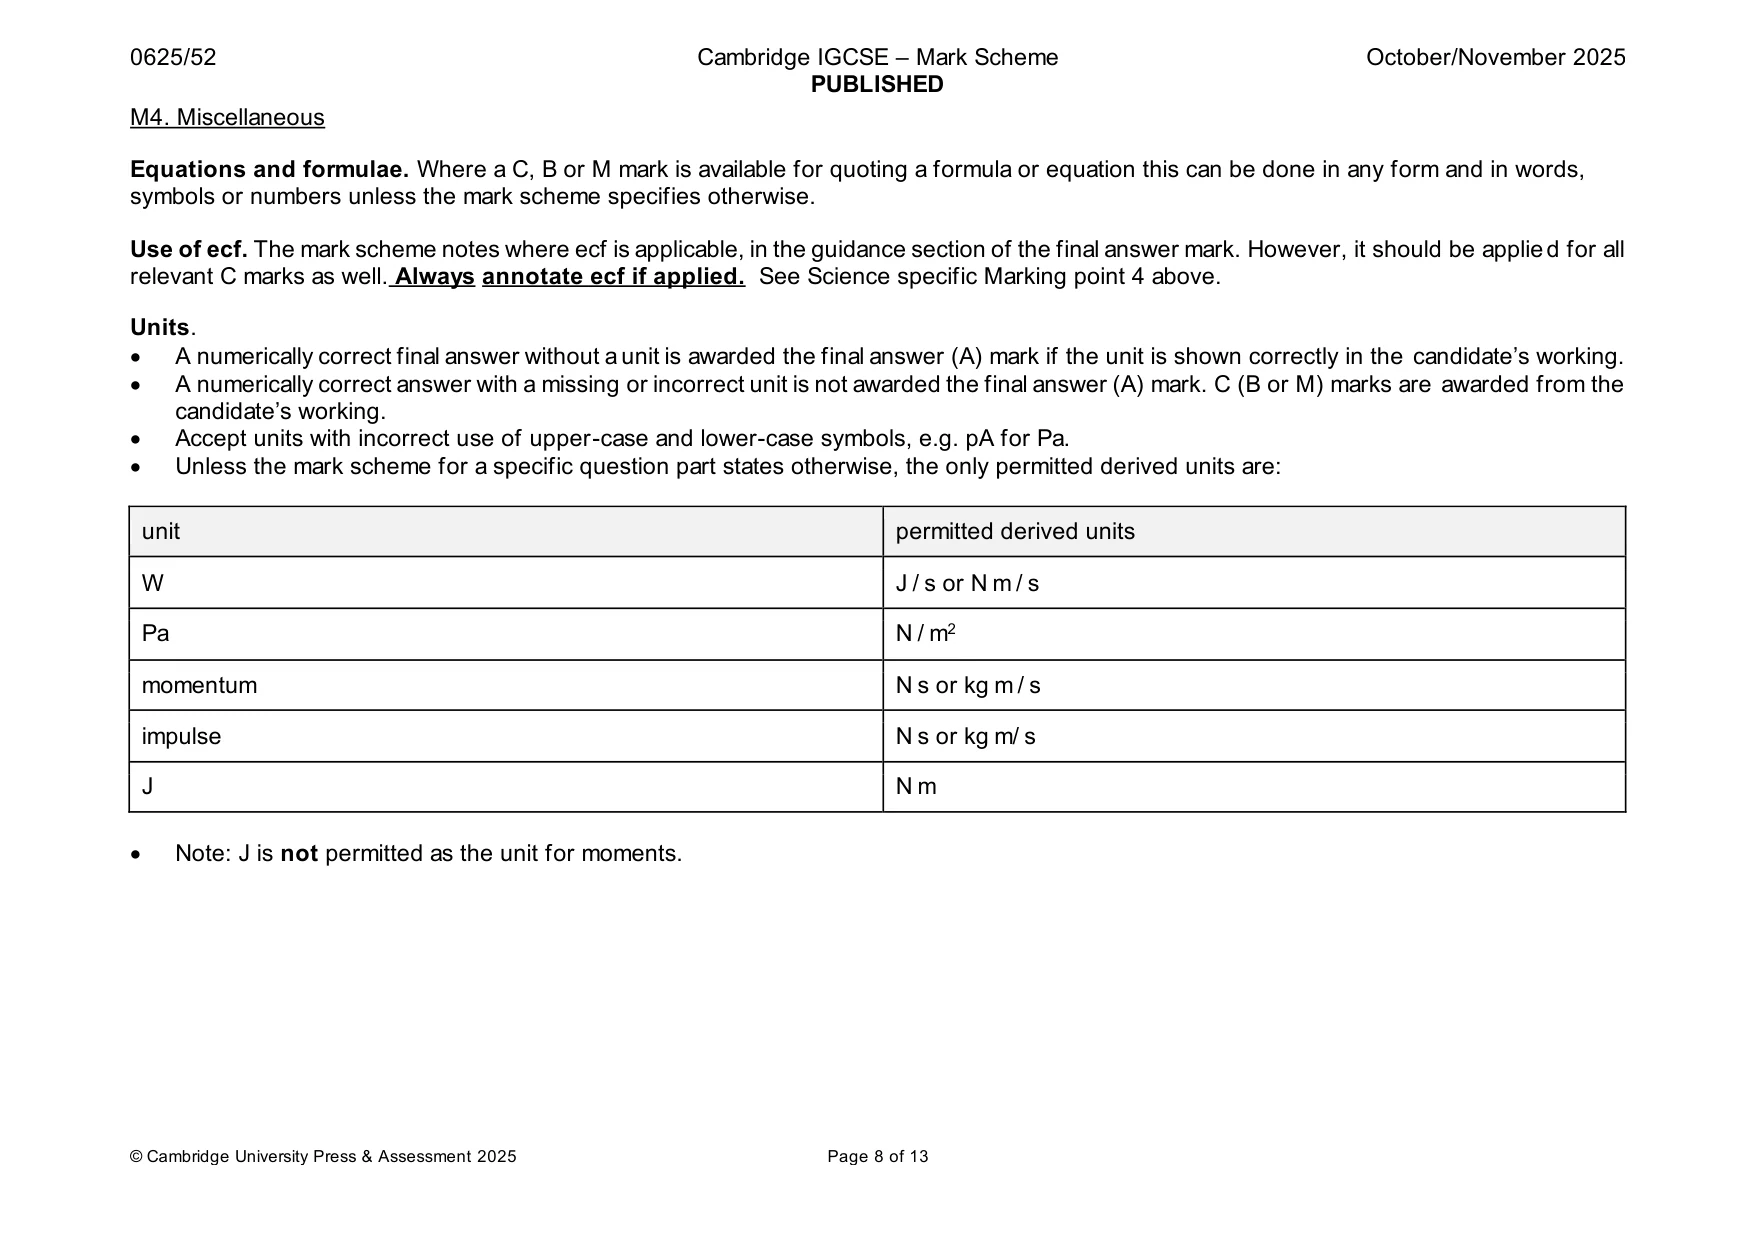
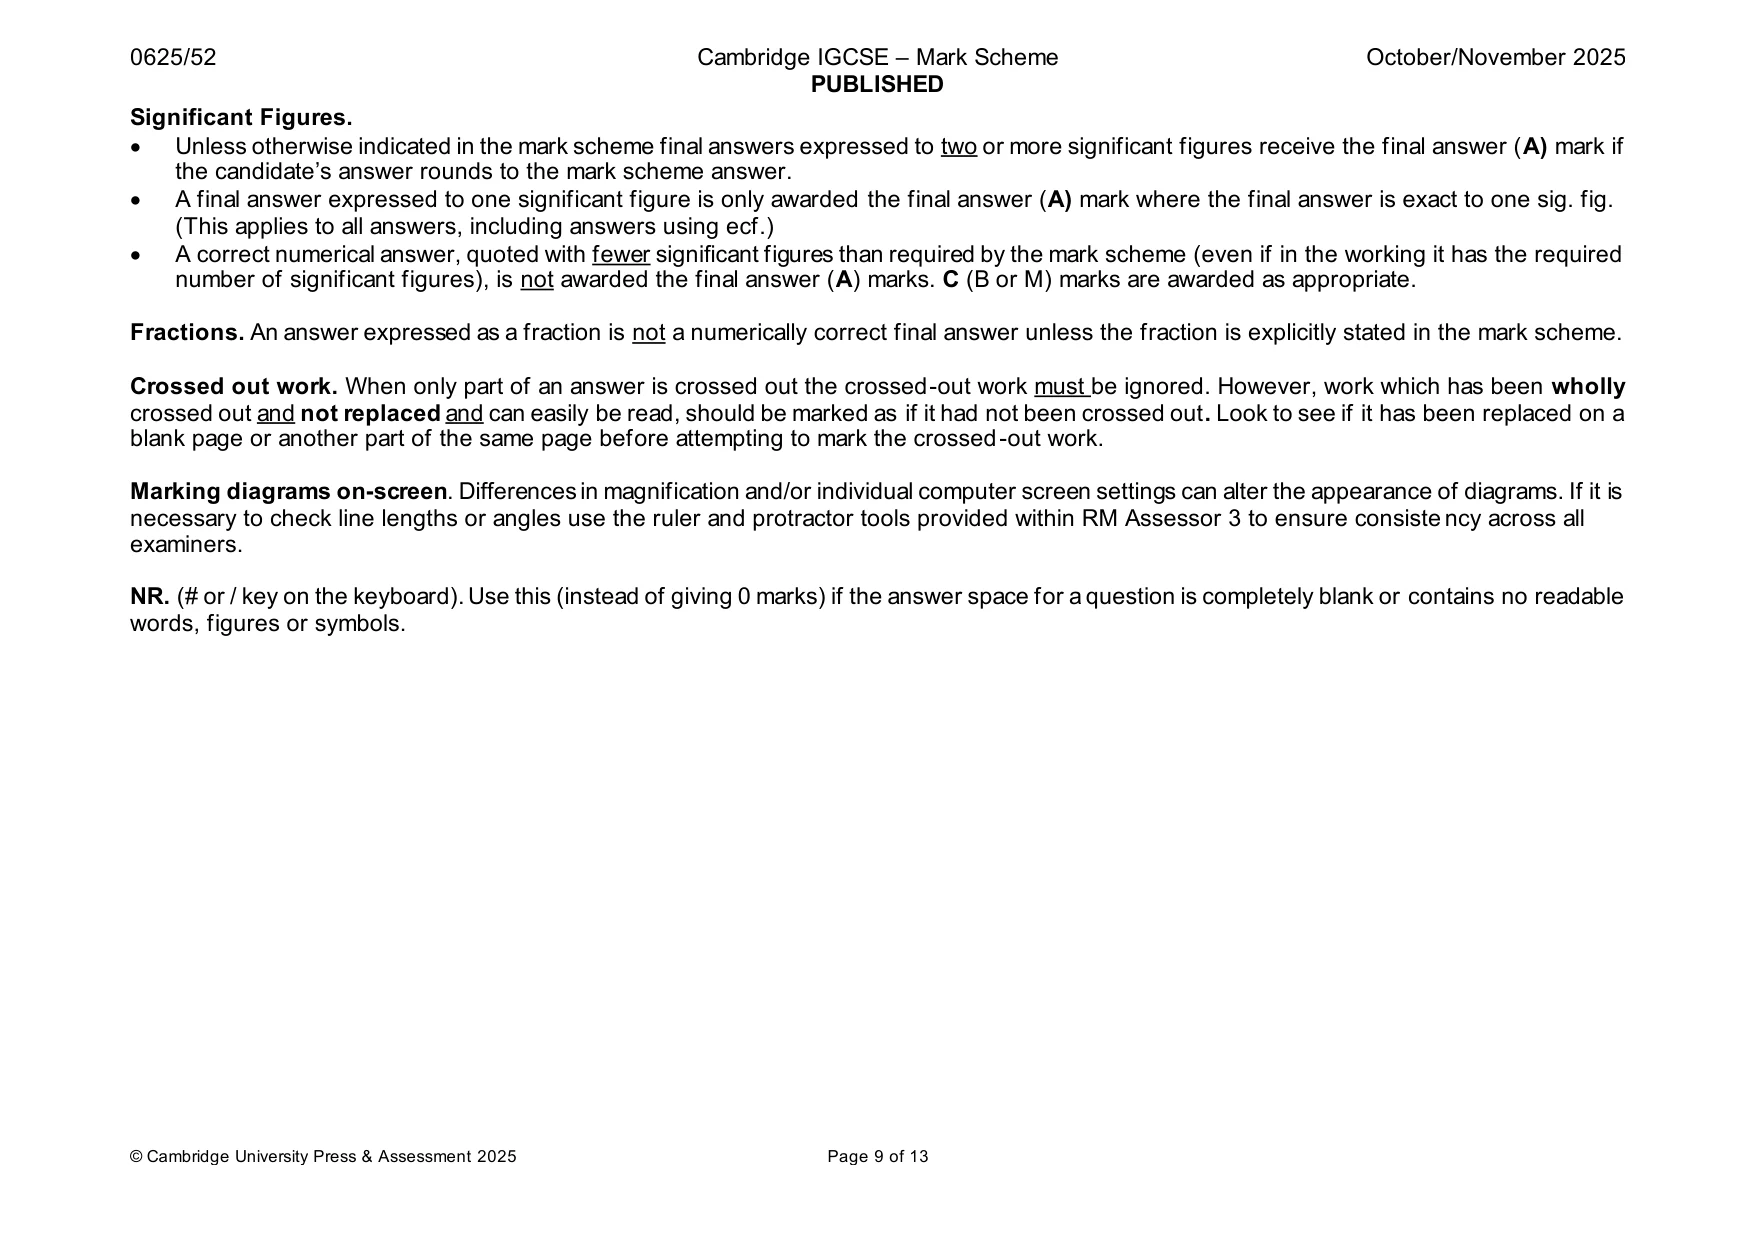
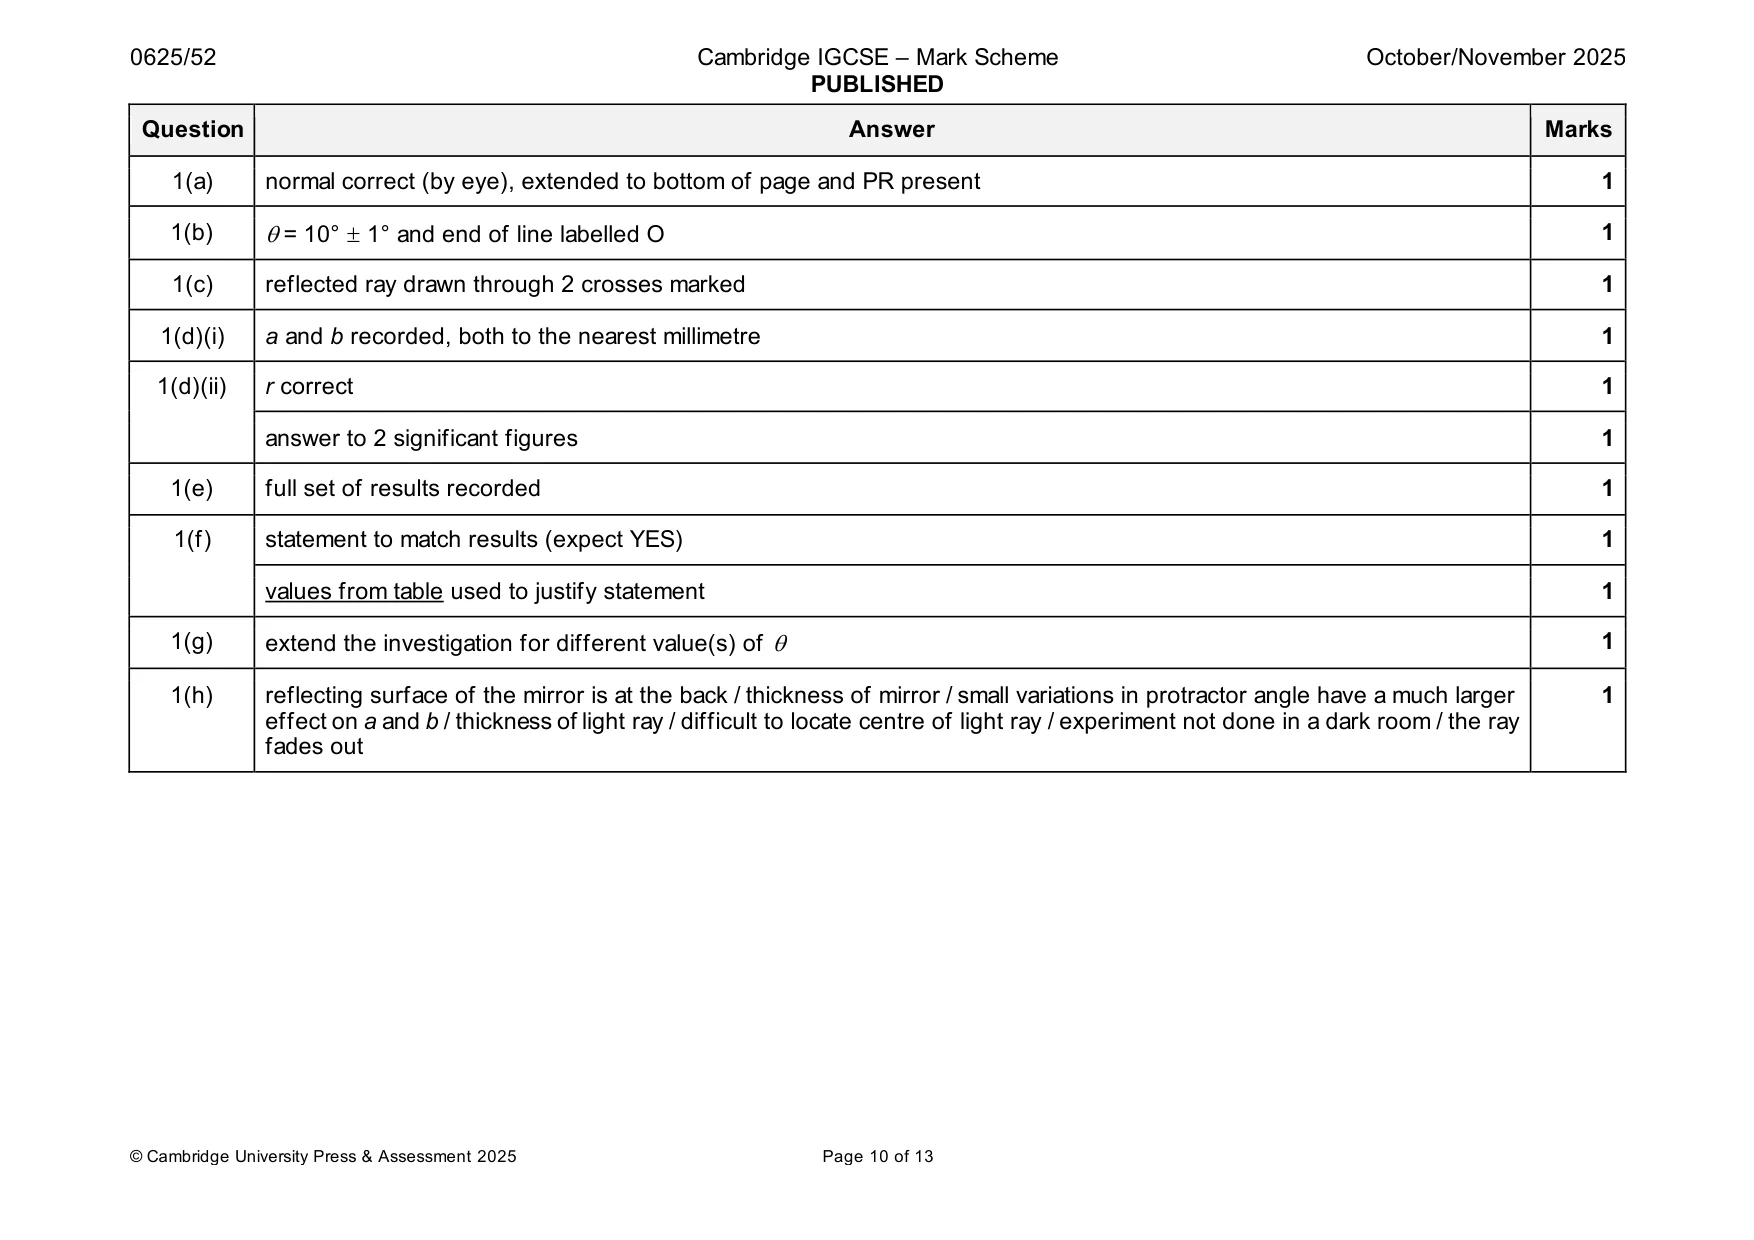
Mark scheme: Question Answer Marks 1(a) normal correct (by eye), extended to bottom of page and PR present 1 1(b) = 10° 1° and end of line labelled O 1 1(c) reflected ray drawn through 2 crosses marked 1 1(d)(i) a and b recorded, both to the nearest millimetre 1 1(d)(ii) r correct 1 answer to 2 significant figures 1 1(e) full set of results recorded 1 1(f) statement to match results (expect YES) 1 values from table used to justify statement 1 1(g) extend the investigation for different value(s) of 1 1(h) reflecting surface of the mirror is at the back / thickness of mirror / small variations in protractor angle have a much larger 1 effect on a and b / thickness of light ray / difficult to locate centre of light ray / experiment not done in a dark room / the ray fades out
Q2 · In this experiment, you will investigate an electric circuit and find the resistance of…
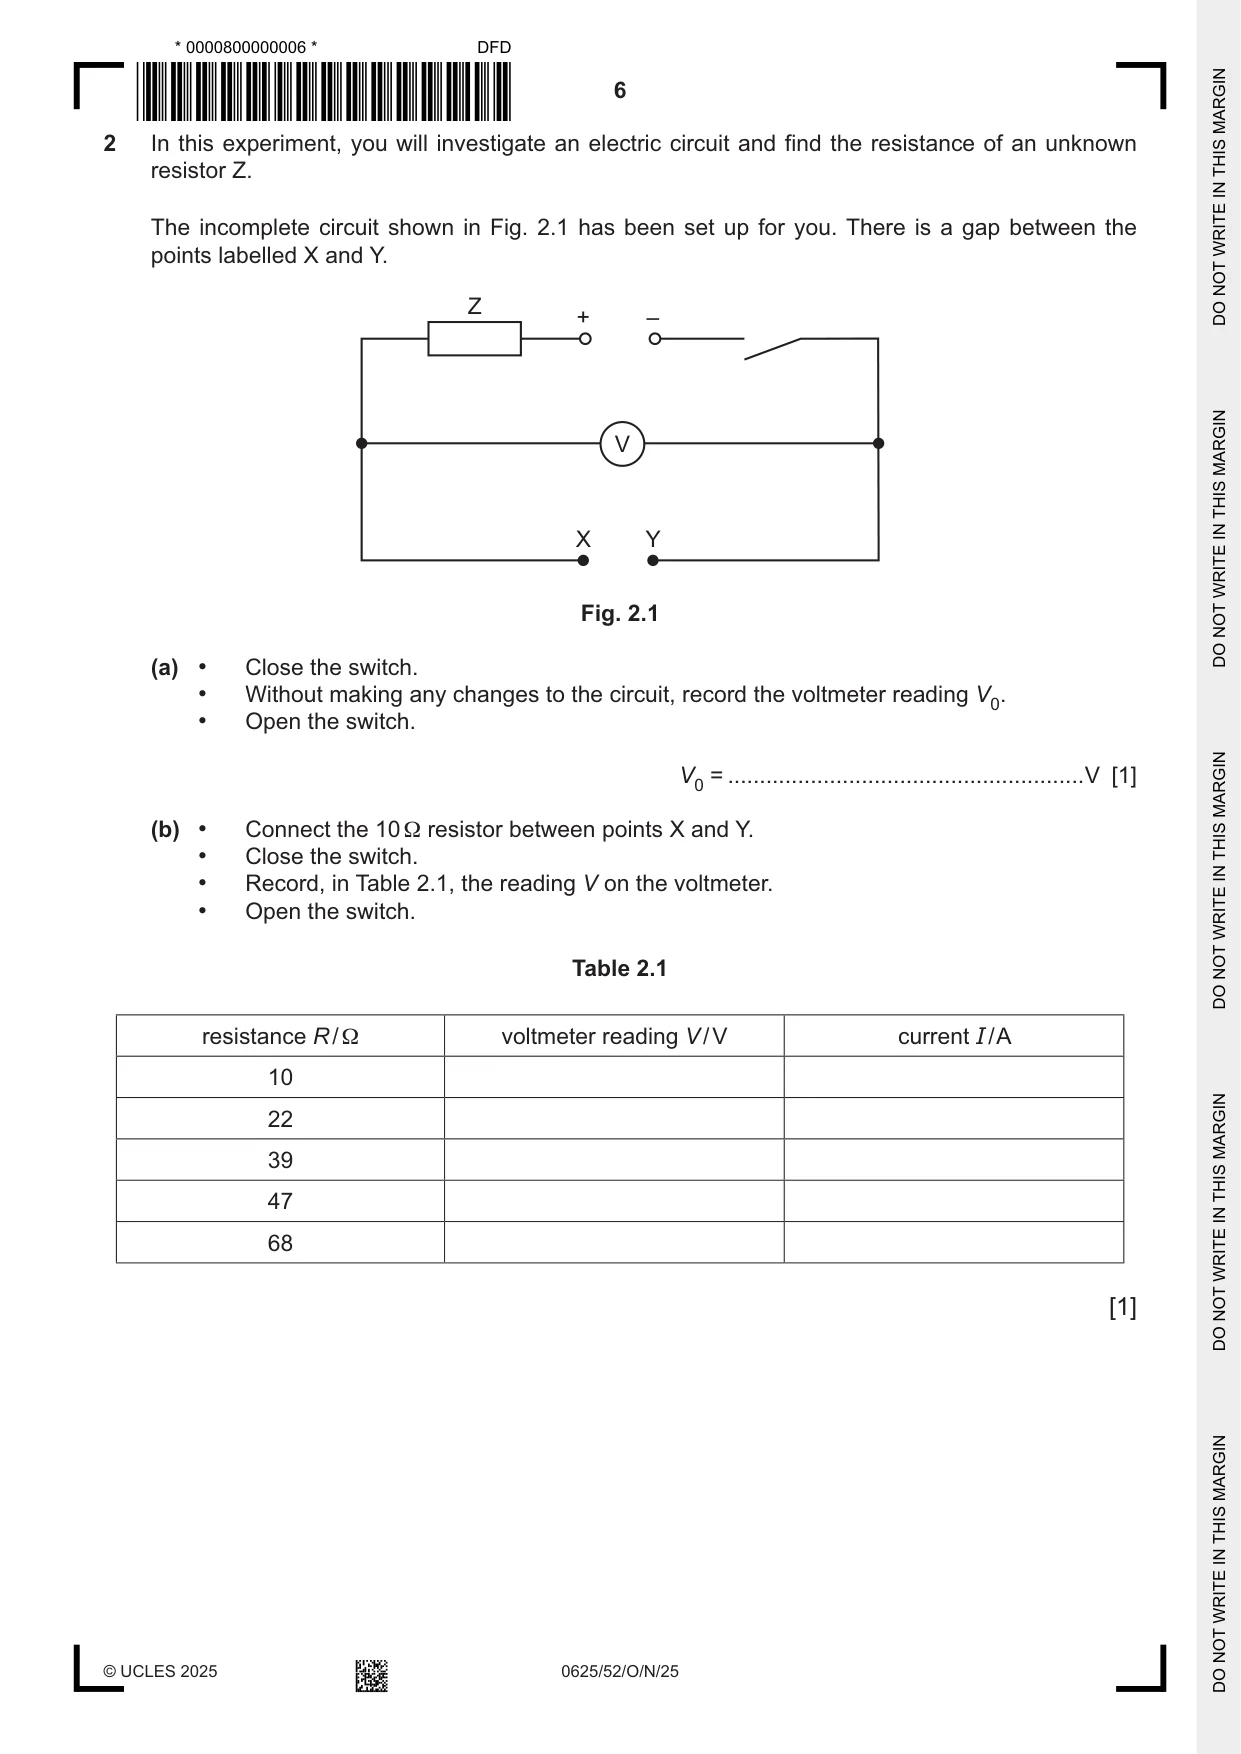
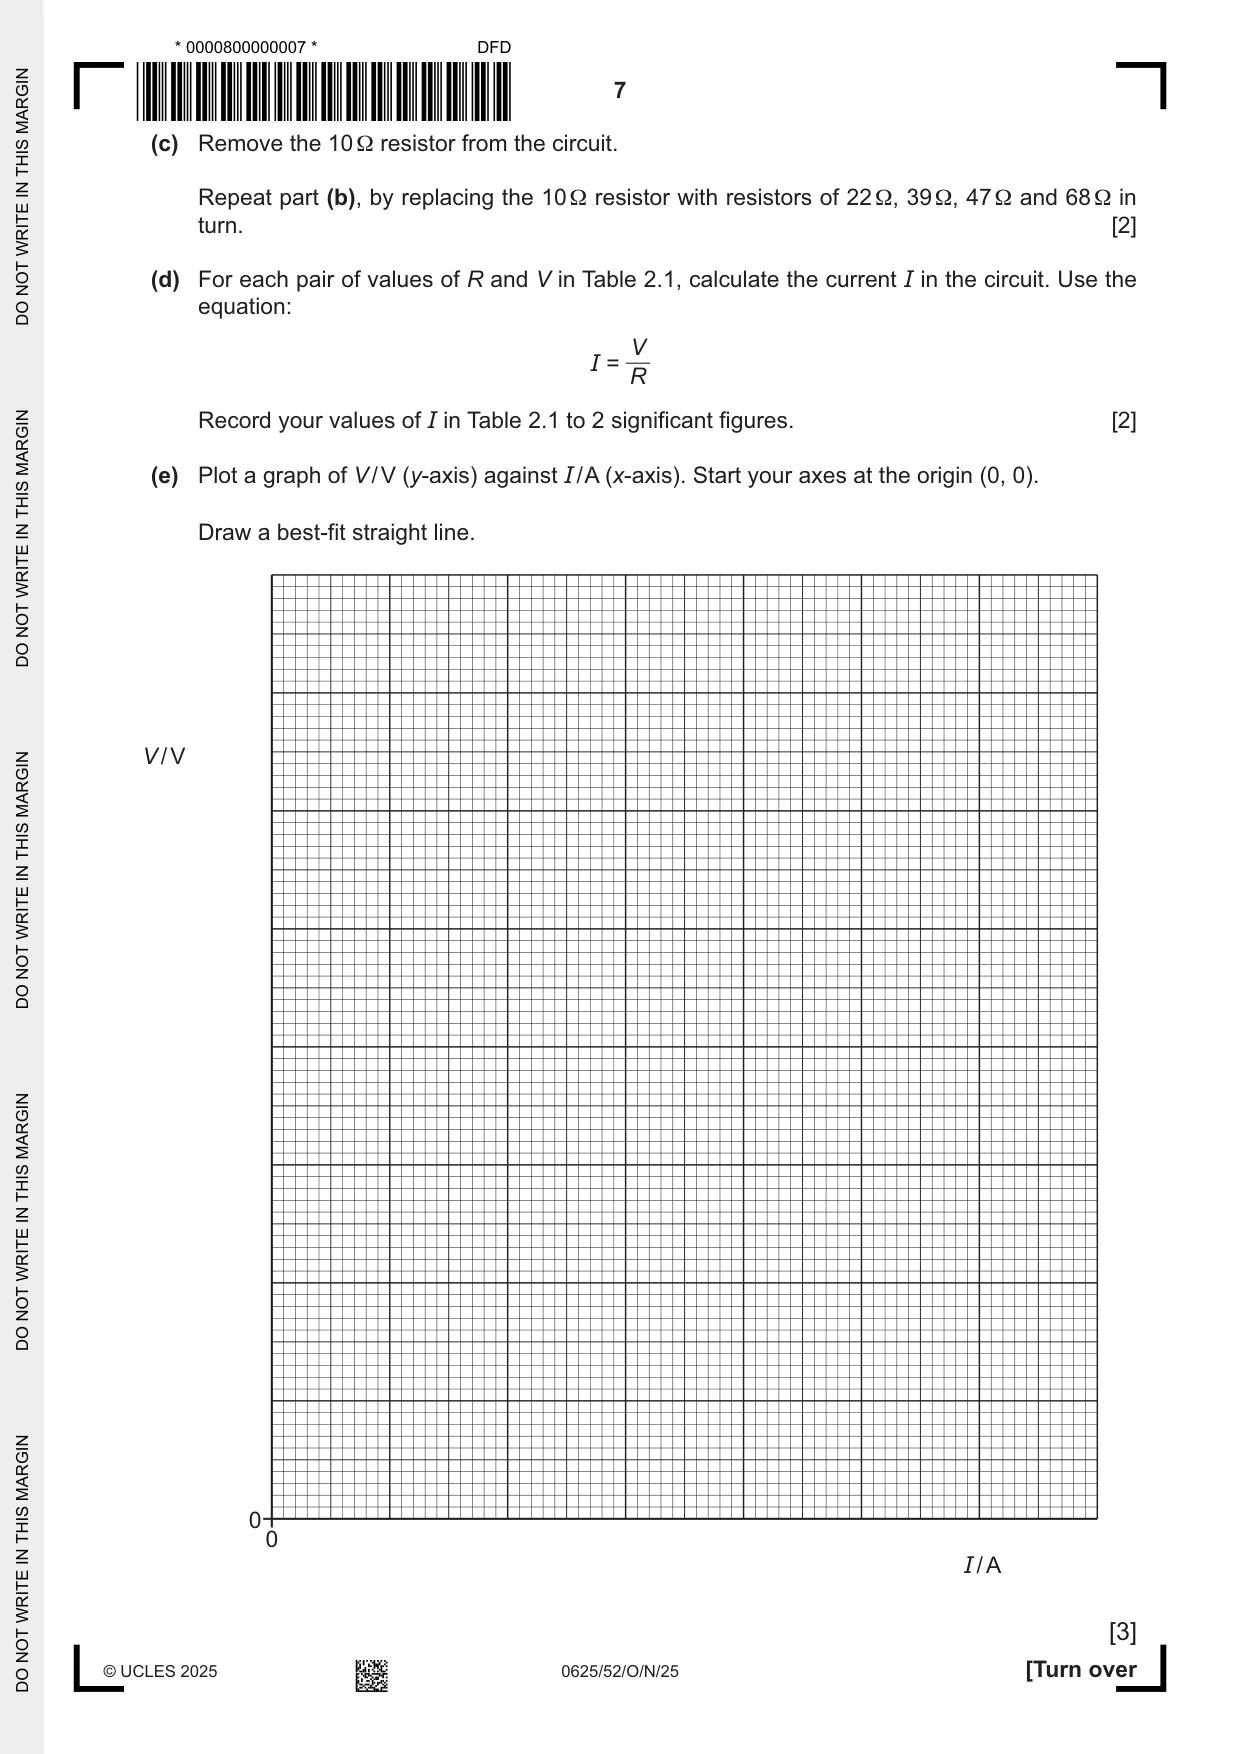
2 In this experiment, you will investigate an electric circuit and find the resistance of an unknown resistor Z. The incomplete circuit shown in Fig. 2.1 has been set up for you. There is a gap between the points labelled X and Y. Z + – V X Y Fig. 2.1 (a) • Close the switch. • Without making any changes to the circuit, record the voltmeter reading V0. • Open the switch. V0 = ........................................................V [1] (b) • Connect the 10 Ω resistor between points X and Y. • Close the switch. • Record, in Table 2.1, the reading V on the voltmeter. • Open the switch. Table 2.1 resistance R / Ω voltmeter reading V / V current I / A 10 22 39 47 68 [1] (c) Remove the 10 Ω resistor from the circuit. Repeat part (b), by replacing the 10 Ω resistor with resistors of 22 Ω, 39 Ω, 47 Ω and 68 Ω in turn. [2] (d) For each pair of values of R and V in Table 2.1, calculate the current I in the circuit. Use the equation: V I = R Record your values of I in Table 2.1 to 2 significant figures. [2] (e) Plot a graph of V / V (y-axis) against I / A (x-axis). Start your axes at the origin (0, 0). Draw a best-fit straight line. V / V 0 0 I / A [3] (f) Determine the gradient G of your line. Show all working and indicate on the graph the values you use. G = .......................................................... [1] (g) The gradient of your line is numerically equal to the resistance RZ of the unknown resistor Z. Write down the value of the resistance RZ. Record your answer to the nearest ohm. RZ = ....................................................... Ω [1] [Total: 11]
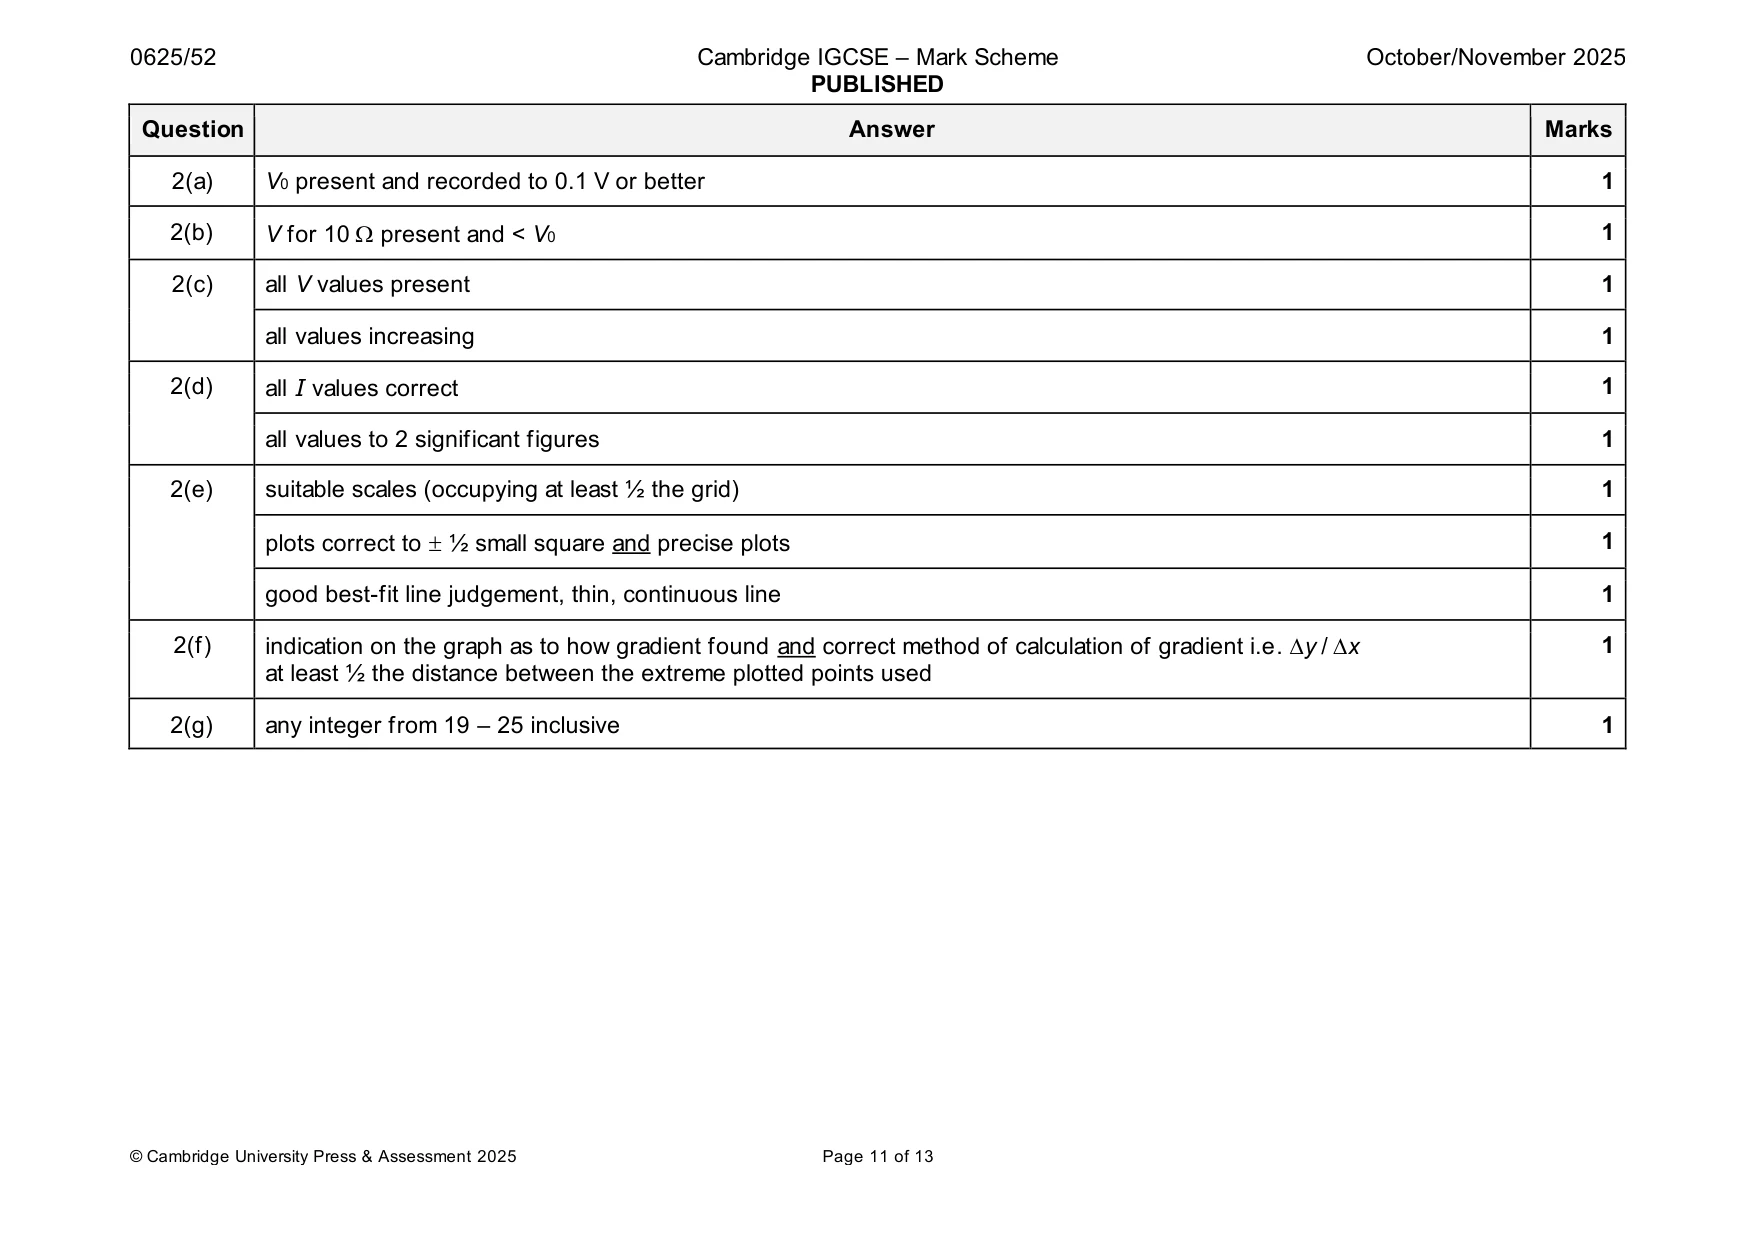
Mark scheme: 2(a) V0 present and recorded to 0.1 V or better 1 2(b) V for 10 present and < V0 1 2(c) all V values present 1 all values increasing 1 2(d) all I values correct 1 all values to 2 significant figures 1 2(e) suitable scales (occupying at least ½ the grid) 1 plots correct to ½ small square and precise plots 1 good best-fit line judgement, thin, continuous line 1 2(f) indication on the graph as to how gradient found and correct method of calculation of gradient i.e. y / x 1 at least ½ the distance between the extreme plotted points used 2(g) any integer from 19 – 25 inclusive 1
Q3 · In this experiment, you will investigate the cooling of water
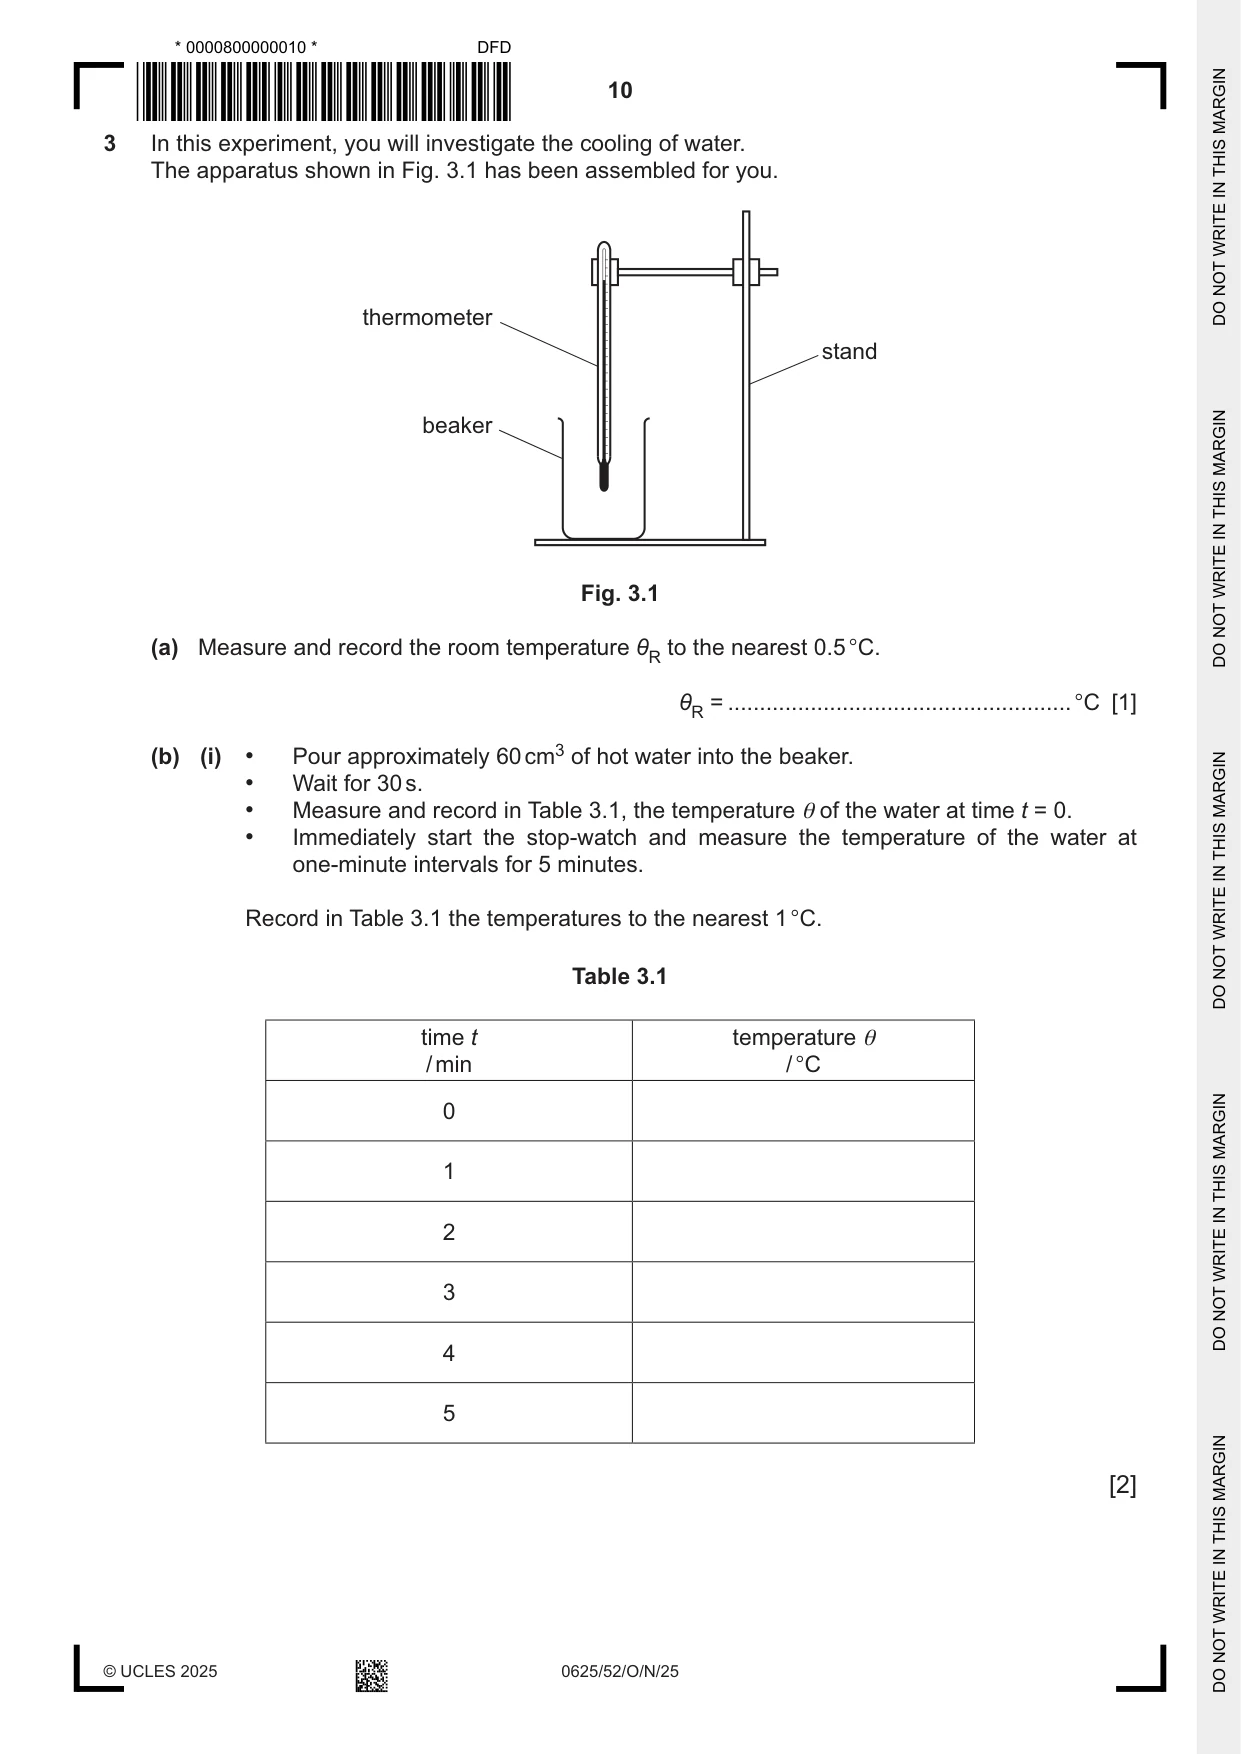
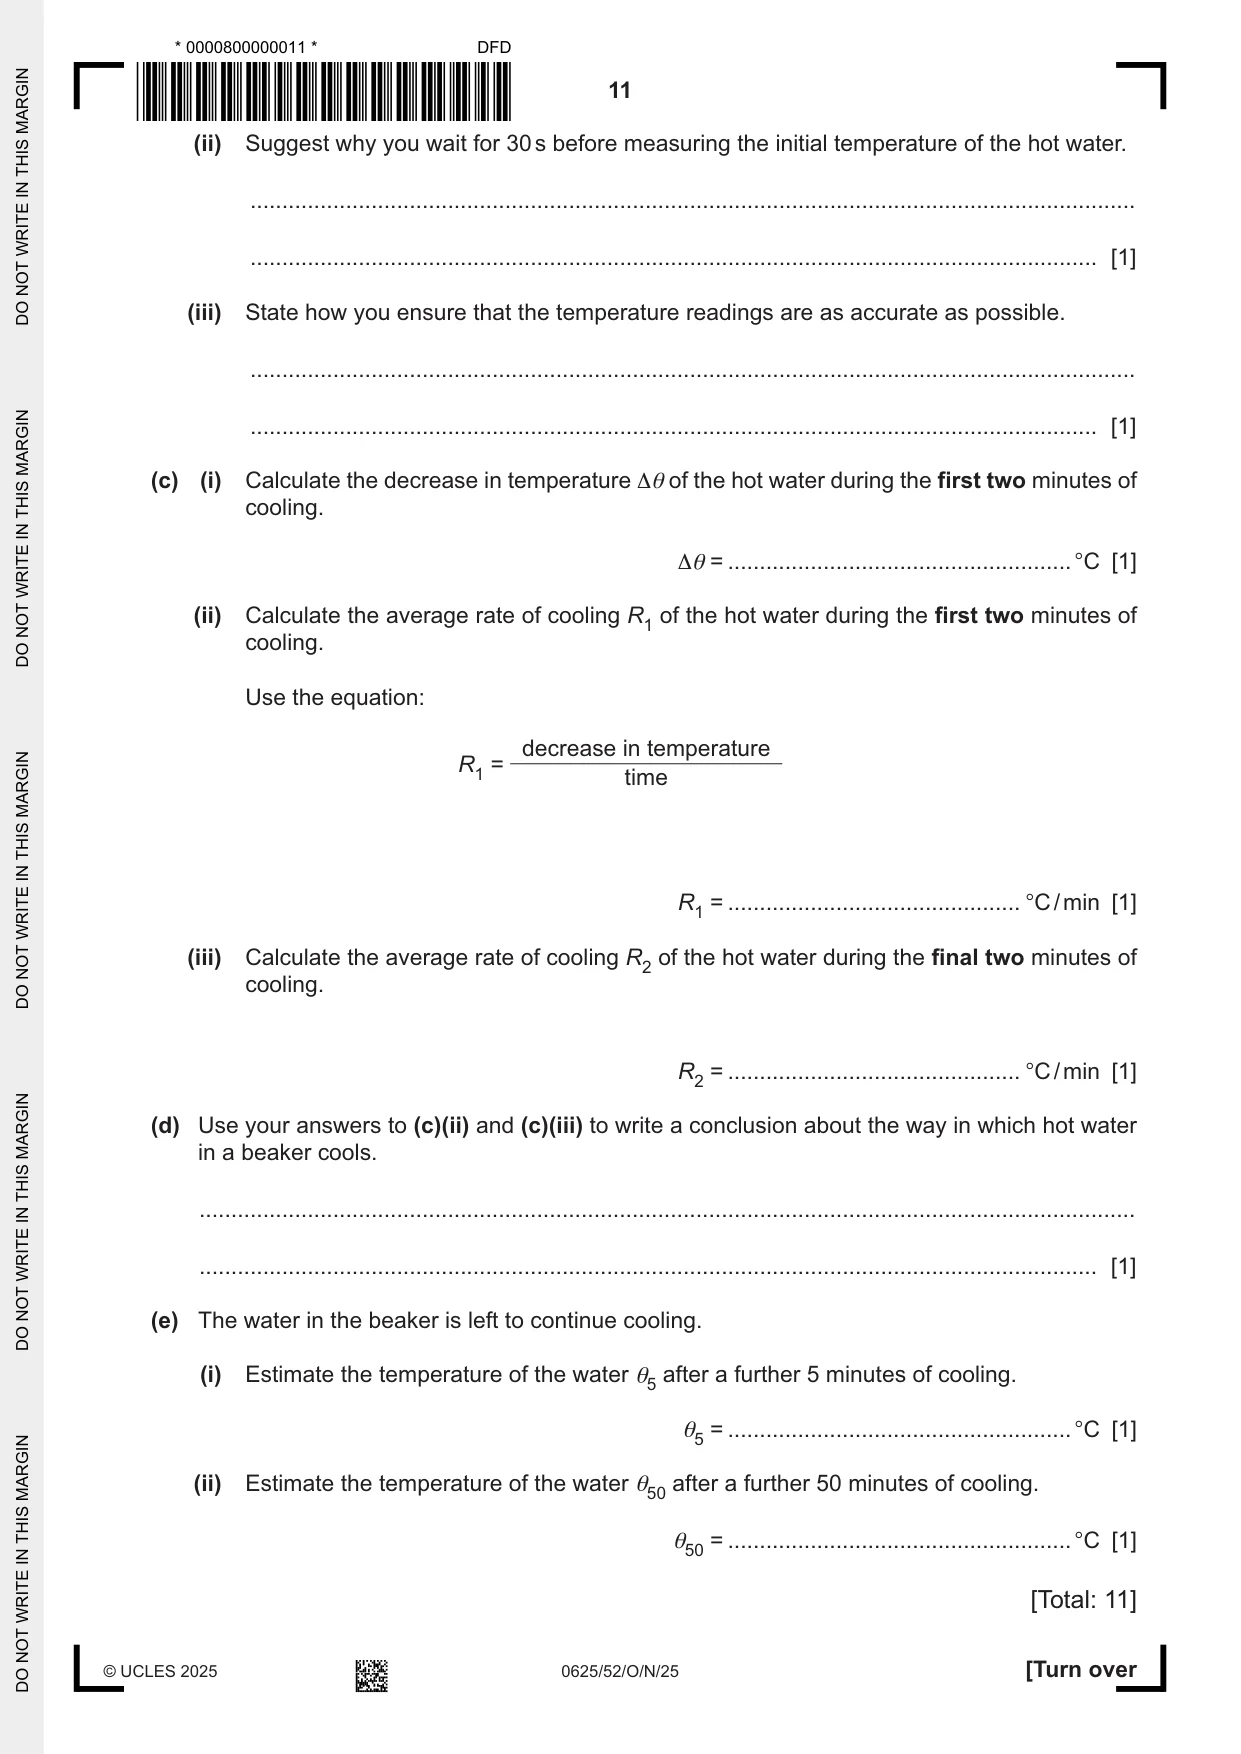
3 In this experiment, you will investigate the cooling of water. The apparatus shown in Fig. 3.1 has been assembled for you. thermometer stand beaker Fig. 3.1 (a) Measure and record the room temperature θR to the nearest 0.5 °C. θR = ......................................................°C [1] (b) (i) • Pour approximately 60 cm3 of hot water into the beaker. • Wait for 30 s. • Measure and record in Table 3.1, the temperature θ of the water at time t = 0. • Immediately start the stop-watch and measure the temperature of the water at one-minute intervals for 5 minutes. Record in Table 3.1 the temperatures to the nearest 1 °C. Table 3.1 time t temperature θ / min / °C 0 1 2 3 4 5 [2] (ii) Suggest why you wait for 30 s before measuring the initial temperature of the hot water. ........................................................................................................................................... ..................................................................................................................................... [1] (iii) State how you ensure that the temperature readings are as accurate as possible. ........................................................................................................................................... ..................................................................................................................................... [1] (c) (i) Calculate the decrease in temperature Δθ of the hot water during the first two minutes of cooling. Δθ = ......................................................°C [1] (ii) Calculate the average rate of cooling R1 of the hot water during the first two minutes of cooling. Use the equation: decrease in temperature R1 = time R1 = .............................................. °C / min [1] (iii) Calculate the average rate of cooling R2 of the hot water during the final two minutes of cooling. R2 = .............................................. °C / min [1] (d) Use your answers to (c)(ii) and (c)(iii) to write a conclusion about the way in which hot water in a beaker cools. ................................................................................................................................................... ............................................................................................................................................. [1] (e) The water in the beaker is left to continue cooling. (i) Estimate the temperature of the water θ5 after a further 5 minutes of cooling. θ5 = ......................................................°C [1] (ii) Estimate the temperature of the water θ50 after a further 50 minutes of cooling. θ50 = ......................................................°C [1] [Total: 11]
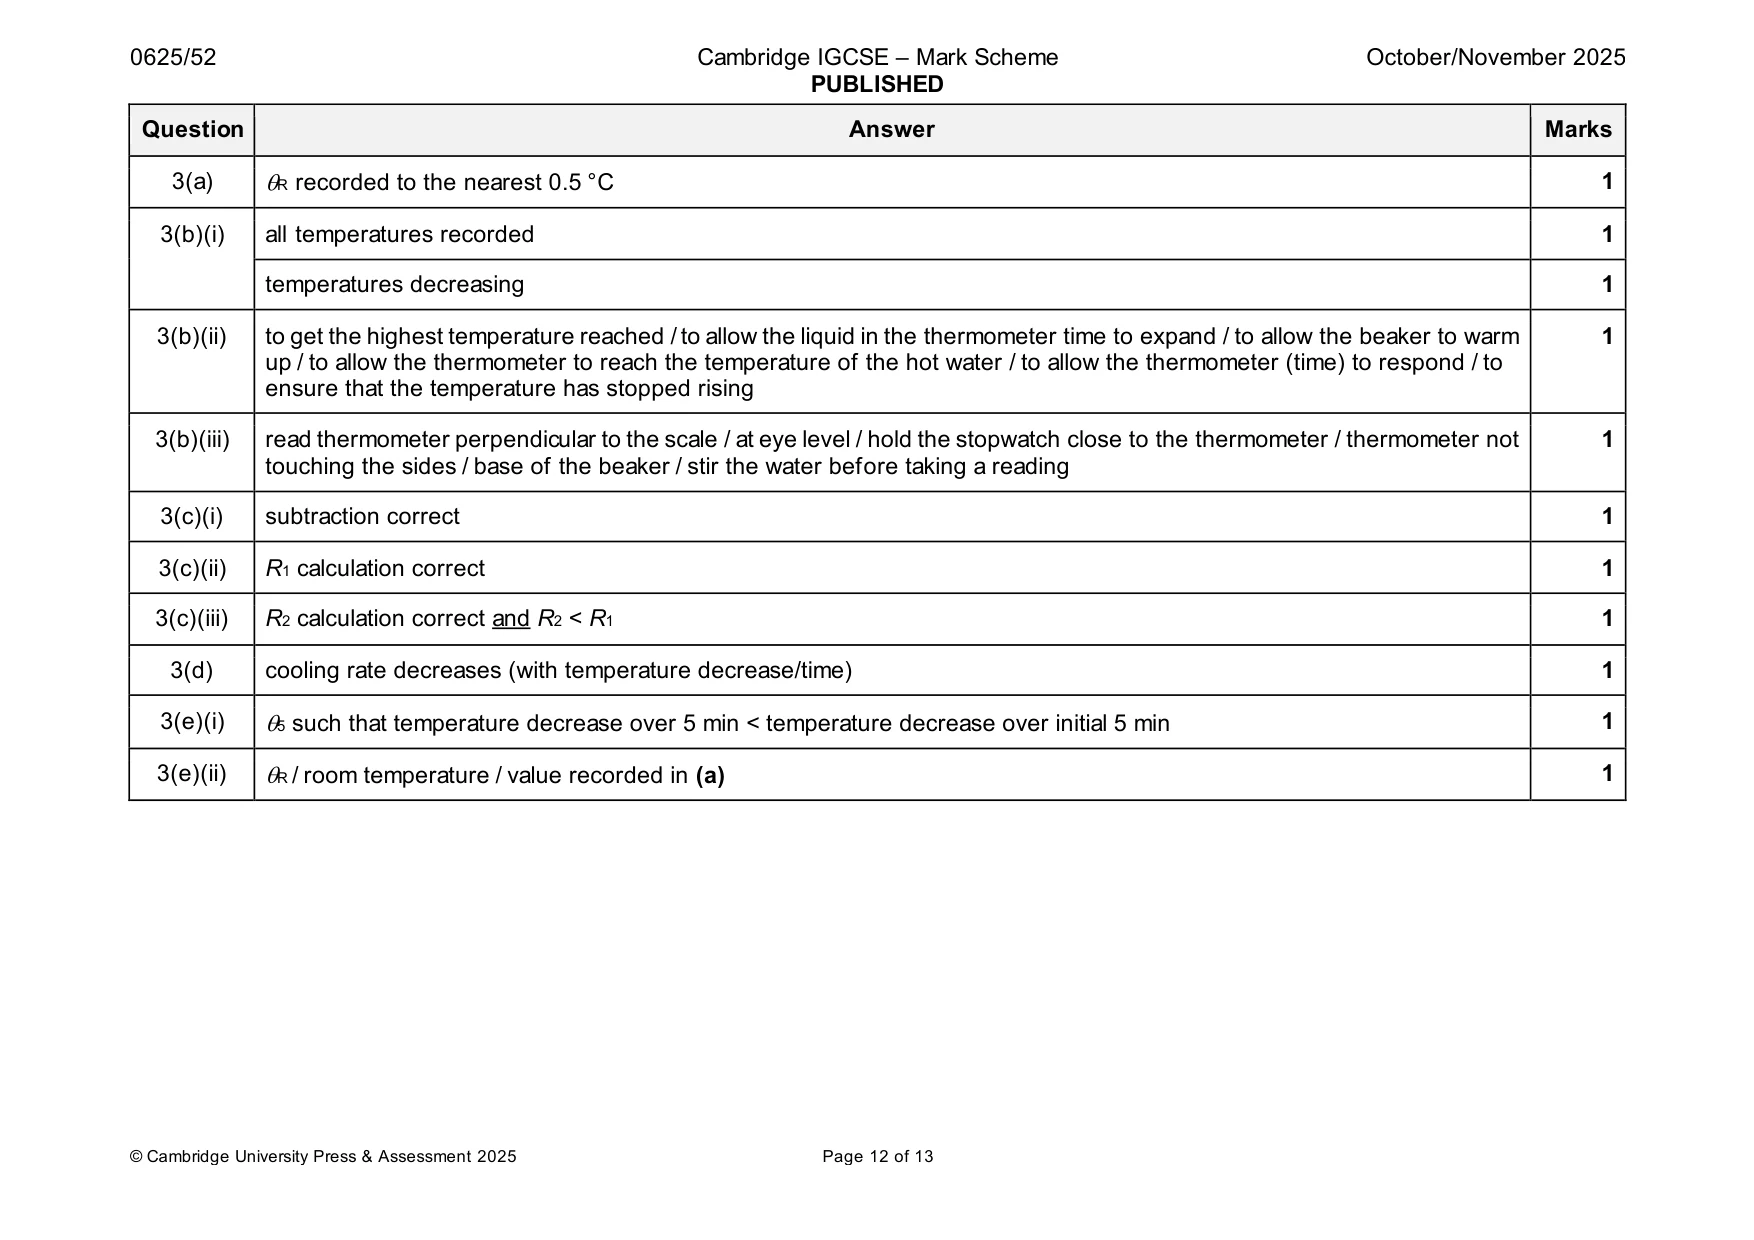
Mark scheme: 3(a) R recorded to the nearest 0.5 °C 1 3(b)(i) all temperatures recorded 1 temperatures decreasing 1 3(b)(ii) to get the highest temperature reached / to allow the liquid in the thermometer time to expand / to allow the beaker to warm 1 up / to allow the thermometer to reach the temperature of the hot water / to allow the thermometer (time) to respond / to ensure that the temperature has stopped rising 3(b)(iii) read thermometer perpendicular to the scale / at eye level / hold the stopwatch close to the thermometer / thermometer not 1 touching the sides / base of the beaker / stir the water before taking a reading 3(c)(i) subtraction correct 1 3(c)(ii) R1 calculation correct 1 3(c)(iii) R2 calculation correct and R2 < R1 1 3(d) cooling rate decreases (with temperature decrease/time) 1 3(e)(i) 5 such that temperature decrease over 5 min < temperature decrease over initial 5 min 1 3(e)(ii) R / room temperature / value recorded in (a) 1
Q4 · A student sets up a flexible track on the laboratory bench
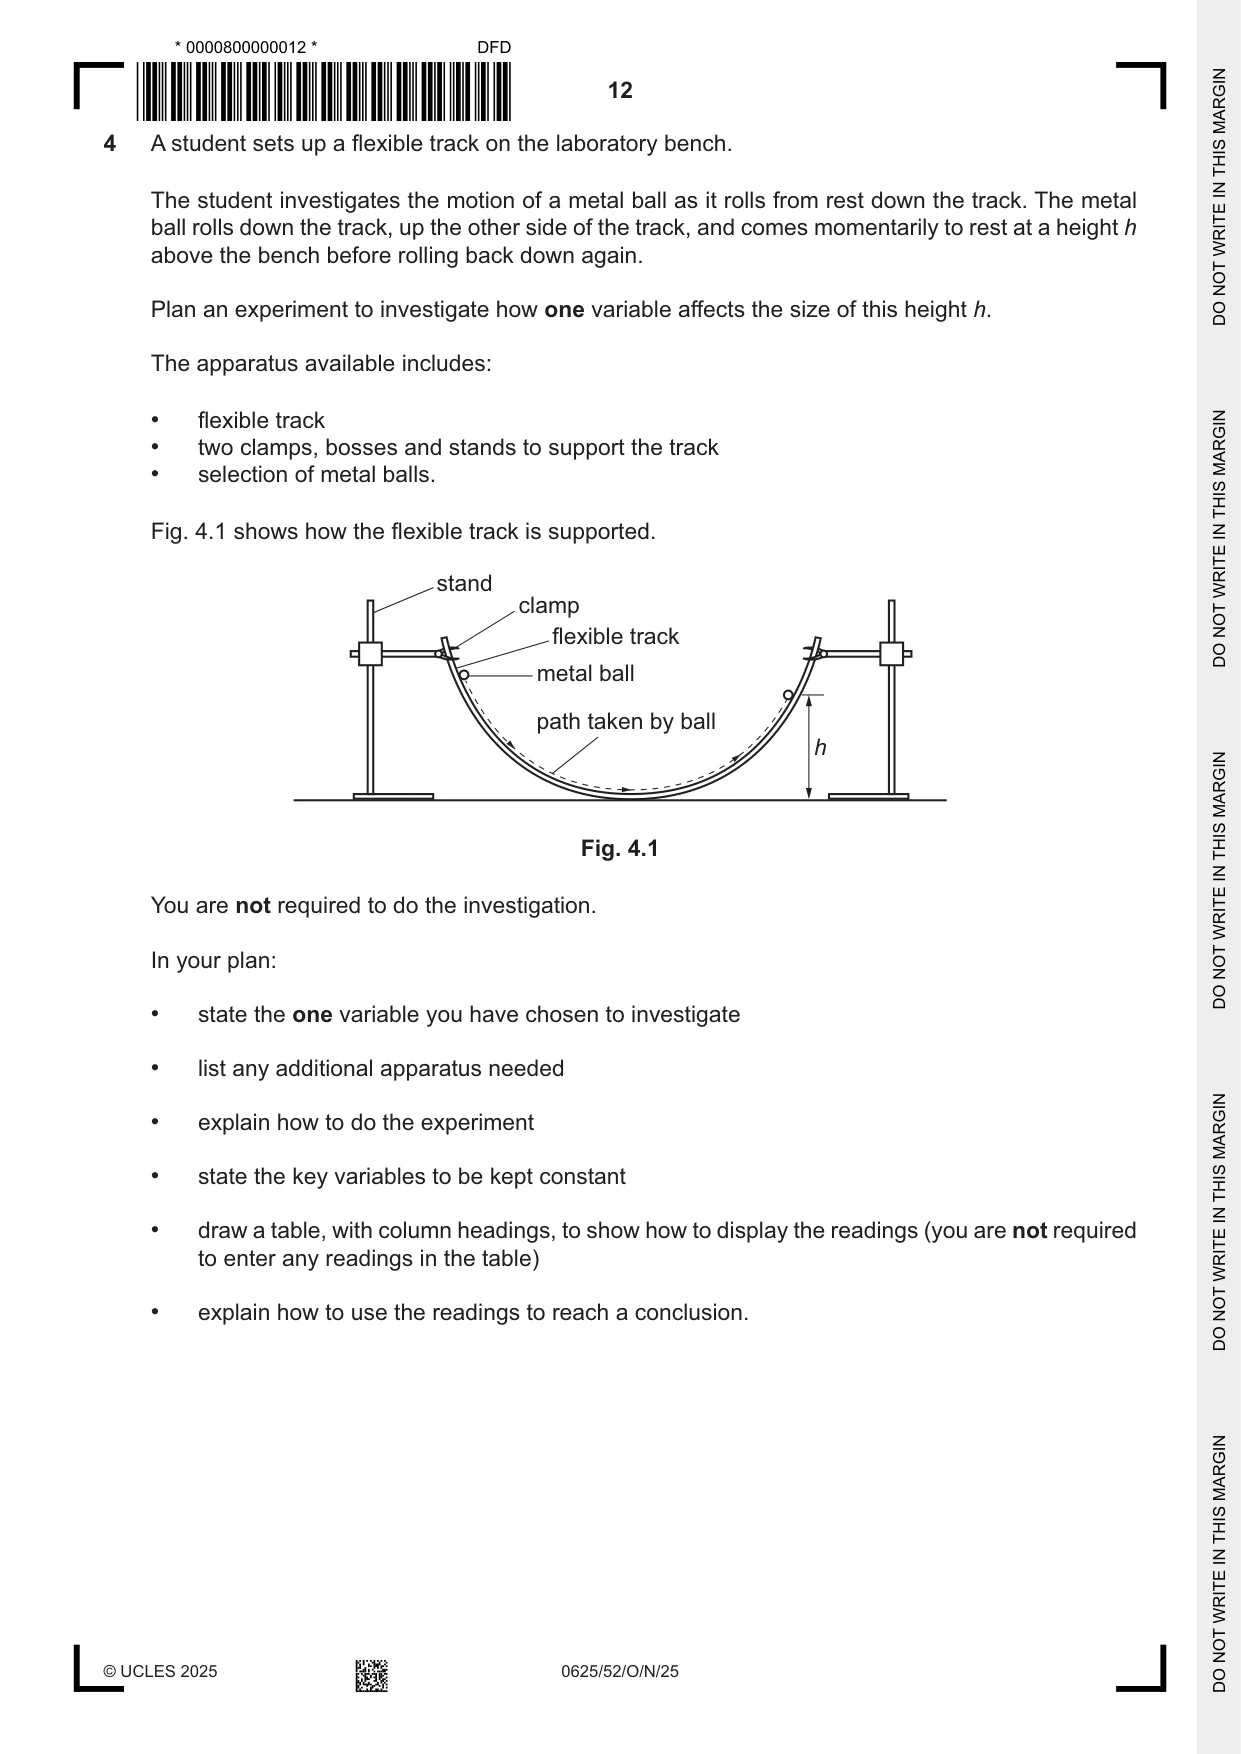
4 A student sets up a flexible track on the laboratory bench. The student investigates the motion of a metal ball as it rolls from rest down the track. The metal ball rolls down the track, up the other side of the track, and comes momentarily to rest at a height h above the bench before rolling back down again. Plan an experiment to investigate how one variable affects the size of this height h. The apparatus available includes: • flexible track • two clamps, bosses and stands to support the track • selection of metal balls. Fig. 4.1 shows how the flexible track is supported. stand clamp flexible track metal ball path taken by ball h Fig. 4.1 You are not required to do the investigation. In your plan: • state the one variable you have chosen to investigate • list any additional apparatus needed • explain how to do the experiment • state the key variables to be kept constant • draw a table, with column headings, to show how to display the readings (you are not required to enter any readings in the table) • explain how to use the readings to reach a conclusion. .......................................................................................................................................................... .......................................................................................................................................................... .......................................................................................................................................................... .......................................................................................................................................................... .......................................................................................................................................................... .......................................................................................................................................................... .......................................................................................................................................................... .......................................................................................................................................................... .......................................................................................................................................................... .......................................................................................................................................................... .......................................................................................................................................................... .......................................................................................................................................................... .......................................................................................................................................................... .......................................................................................................................................................... .......................................................................................................................................................... .......................................................................................................................................................... .......................................................................................................................................................... .......................................................................................................................................................... .......................................................................................................................................................... .................................................................................................................................................... [7]
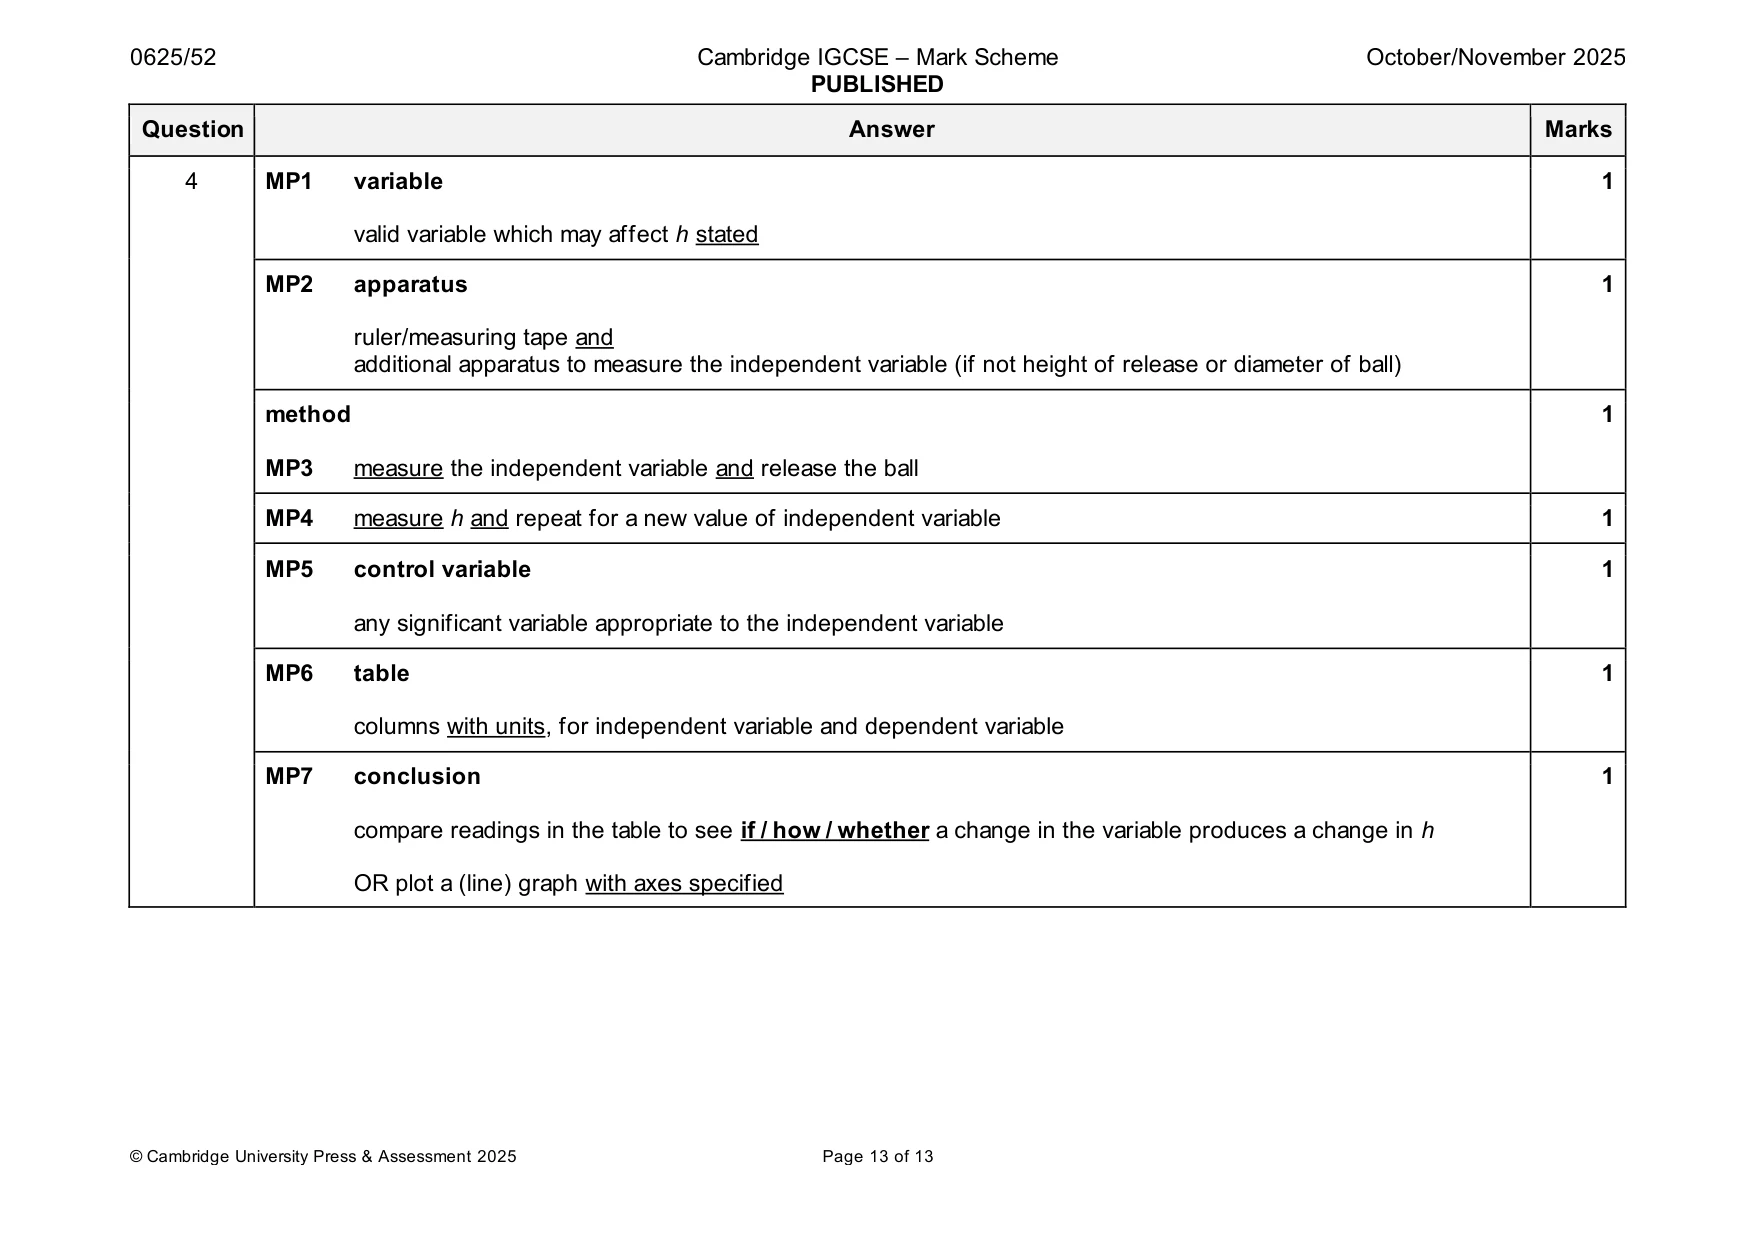
Mark scheme: 4 MP1 variable 1 valid variable which may affect h stated MP2 apparatus 1 ruler/measuring tape and additional apparatus to measure the independent variable (if not height of release or diameter of ball) method 1 MP3 measure the independent variable and release the ball MP4 measure h and repeat for a new value of independent variable 1 MP5 control variable 1 any significant variable appropriate to the independent variable MP6 table 1 columns with units, for independent variable and dependent variable MP7 conclusion 1 compare readings in the table to see if / how / whether a change in the variable produces a change in h OR plot a (line) graph with axes specified
What was in this paper
The subtopics covered by these 4 questions, and how many questions each got. Open one in a new tab to see every Cambridge question on it.
What you needed in this session
Cambridge’s own grade thresholds for 2025 Oct/Nov, Paper 5 · Variant 2. A higher threshold means an easier paper — the bar moves with how the cohort did.