Cambridge IGCSE Physics 0625 — 2018 May/June Paper 5 · Variant 2
0625/52/M/J/18 · 4 questions · 40 marks · ≈45 min
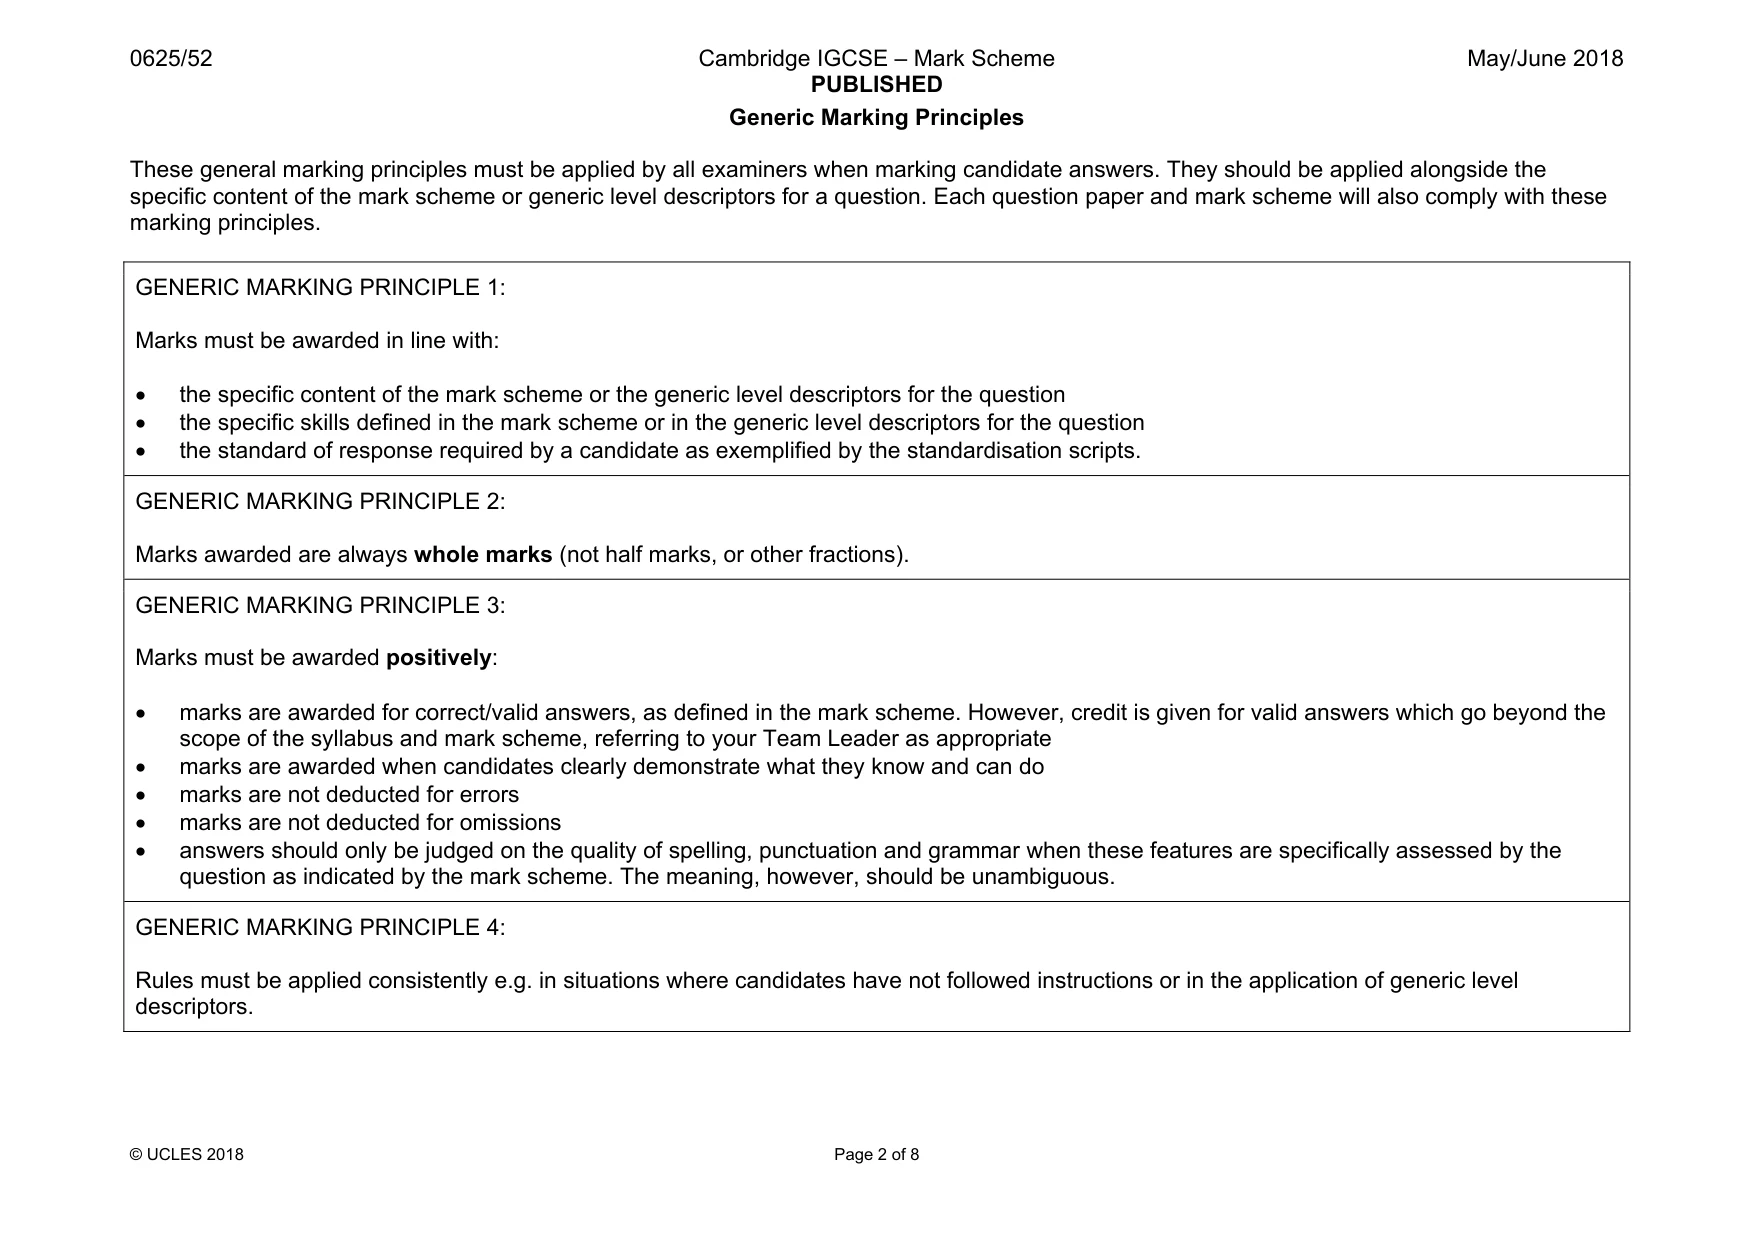
The question paper and its mark scheme, free to read here and free to download. This is Cambridge’s own paper, exactly as it was sat.
Question paper12 pages

Mark scheme8 pages
Answers below. Sit the paper first if you are practising.
Questions as text
Q1 · In this experiment, you will determine the density of water
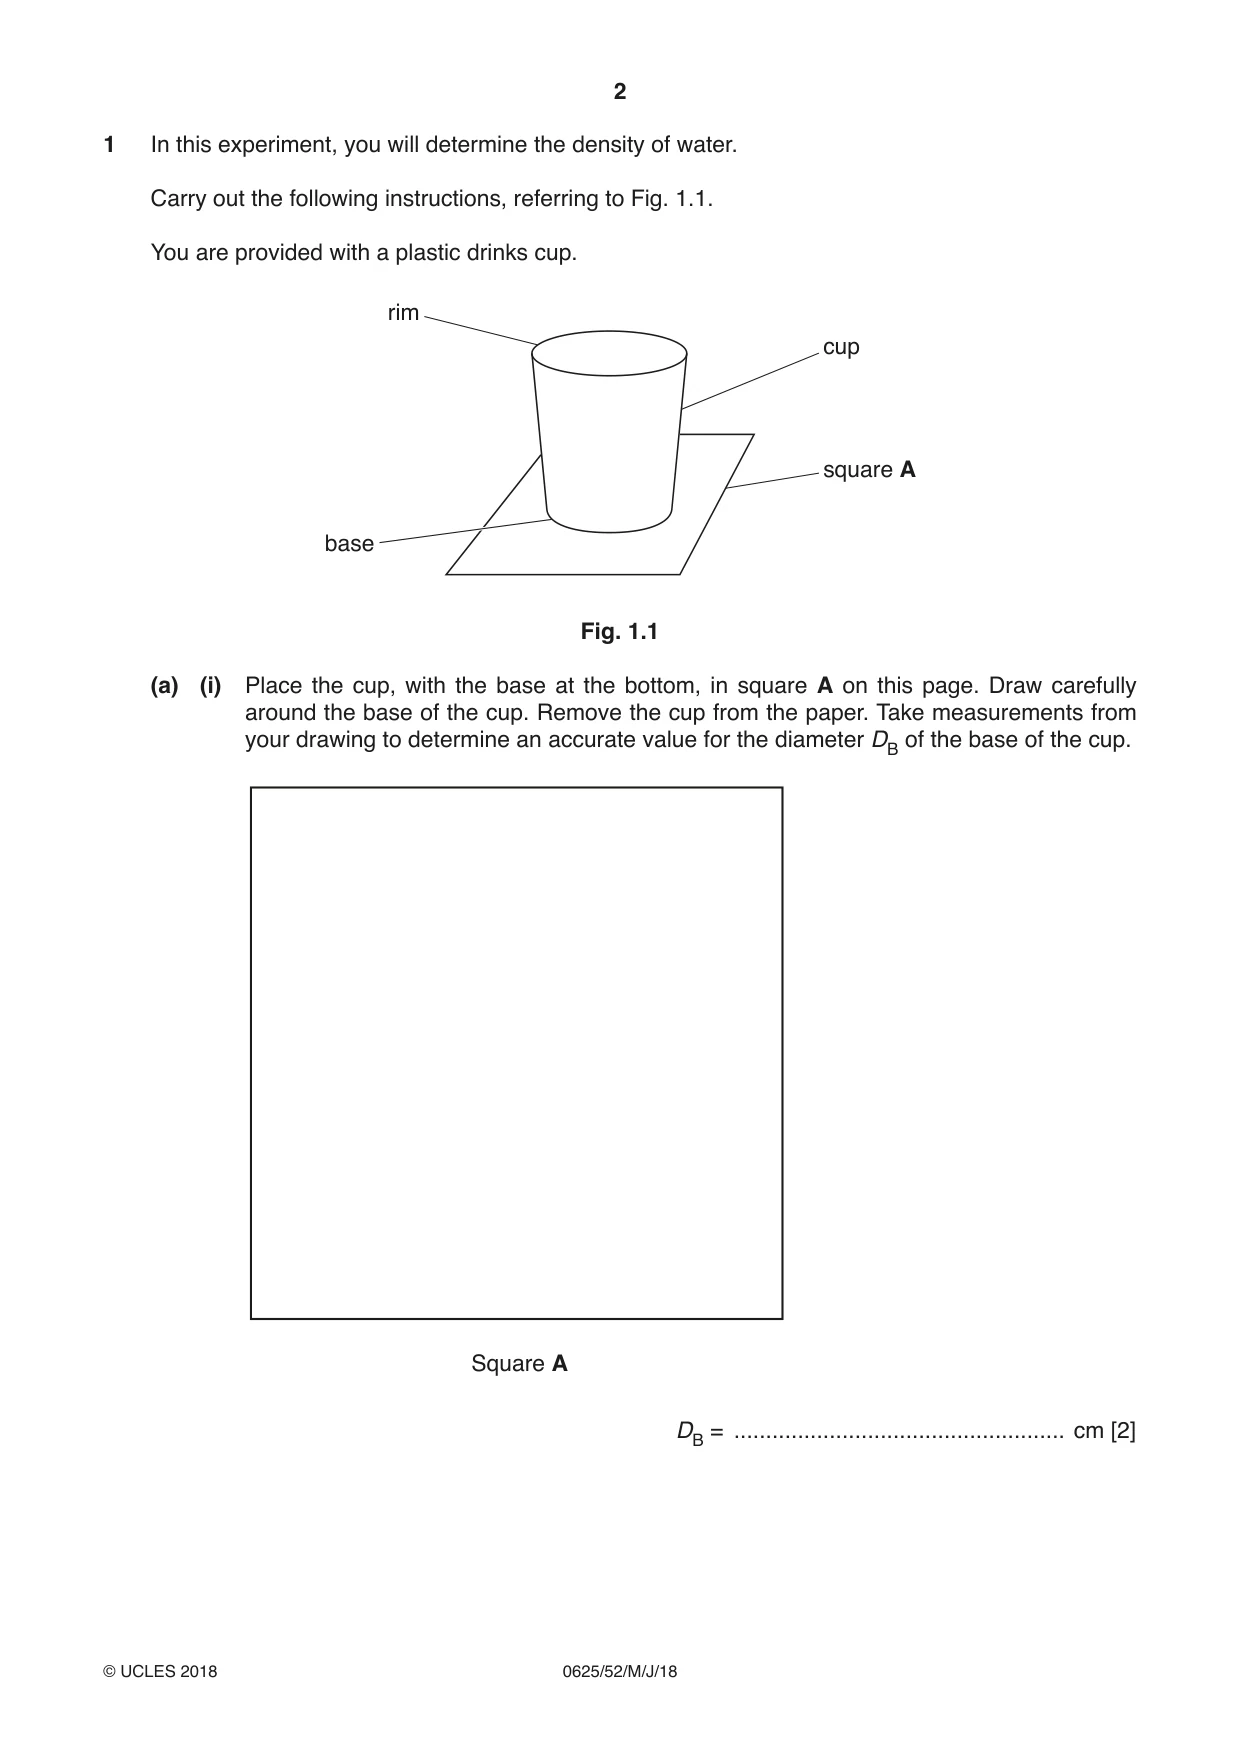
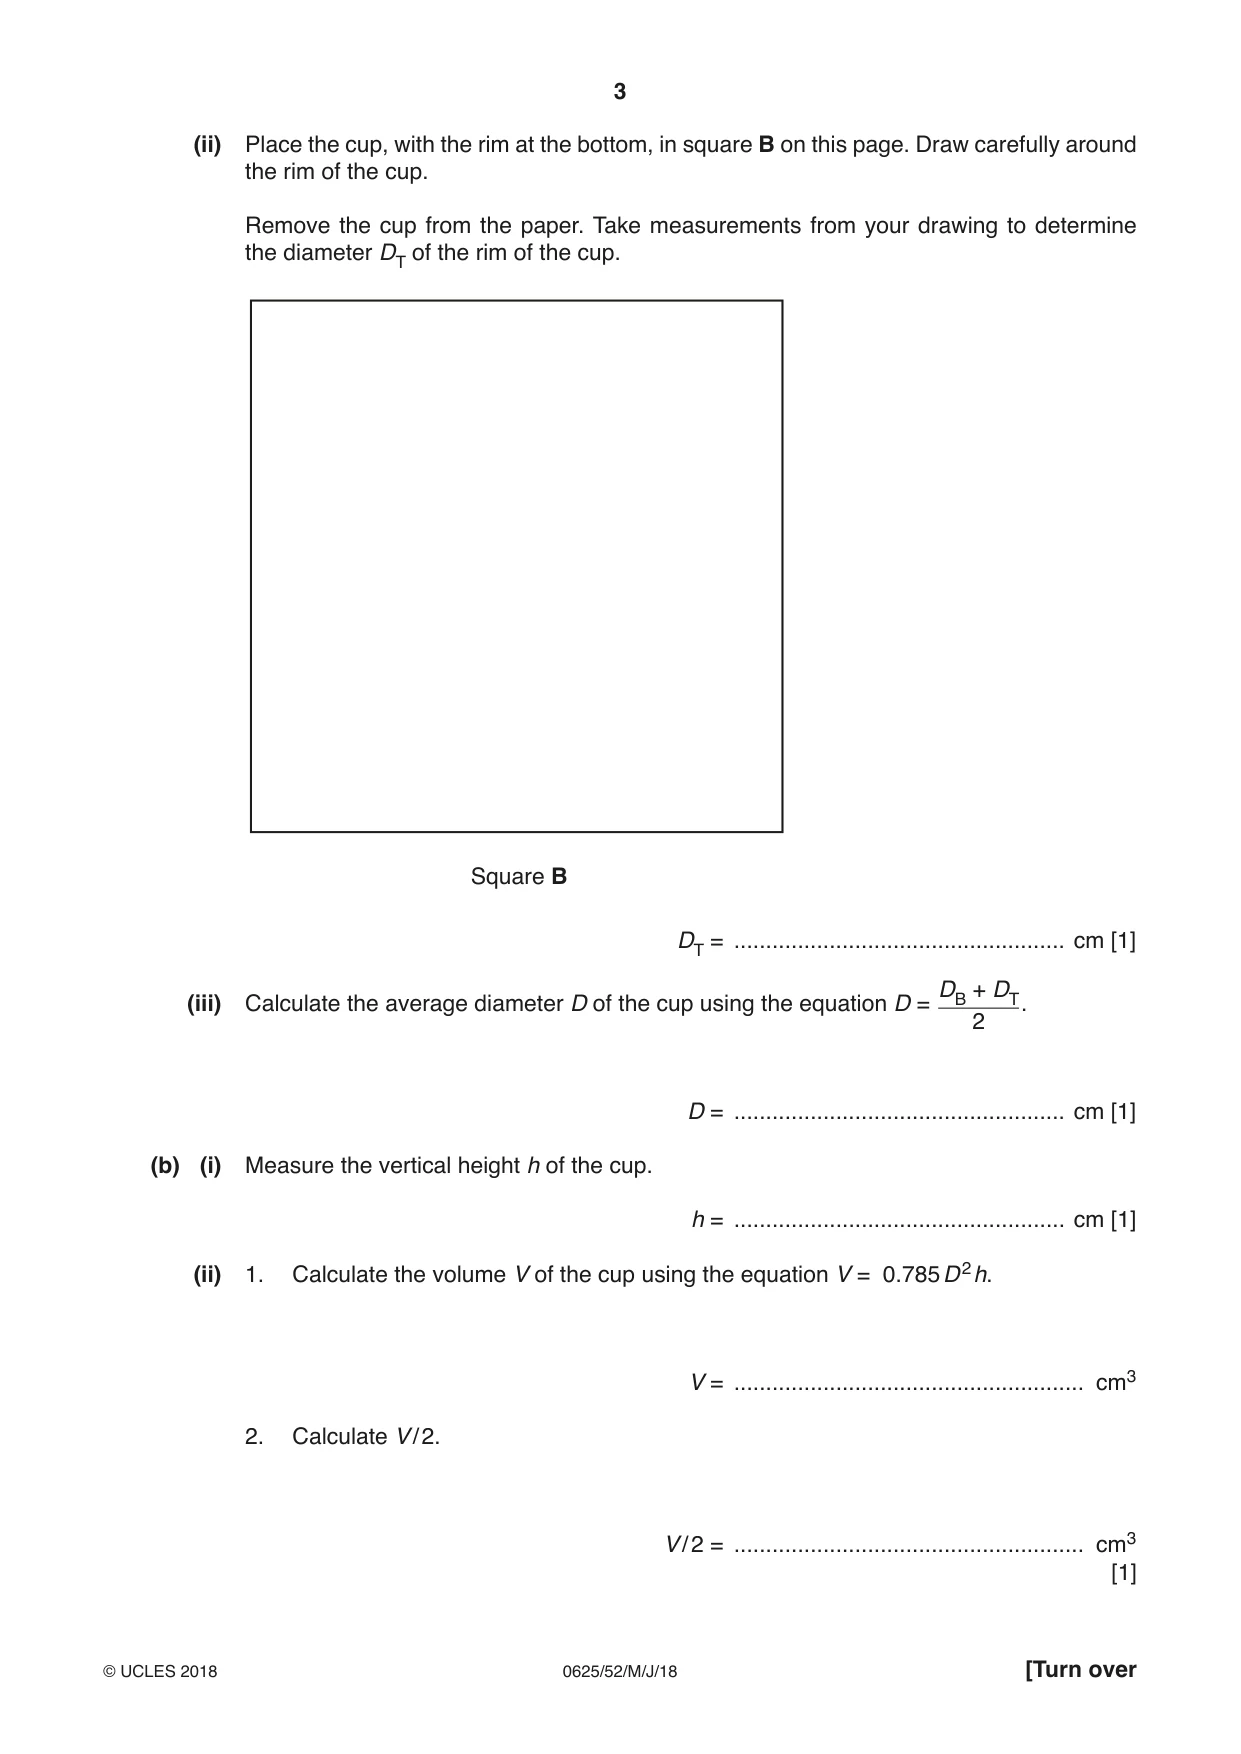
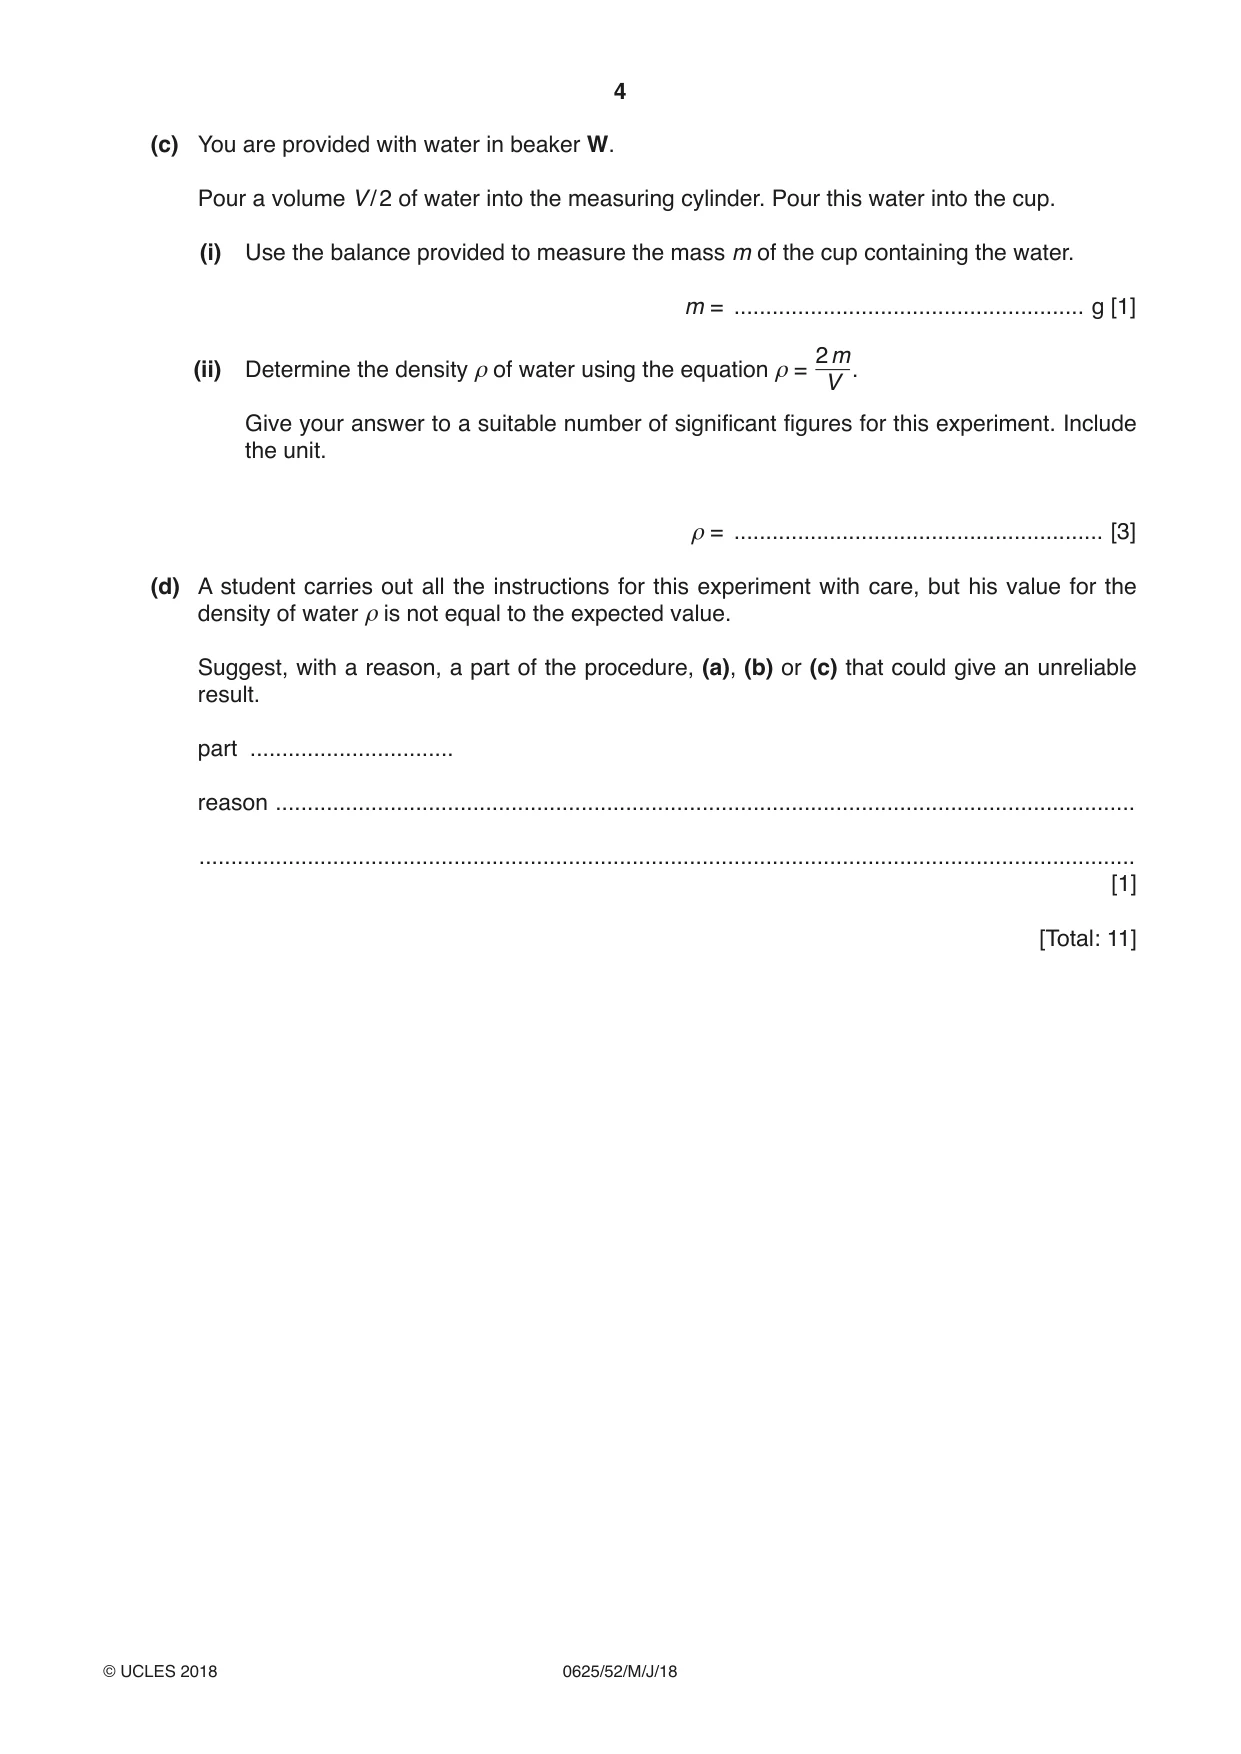
1 In this experiment, you will determine the density of water. Carry out the following instructions, referring to Fig. 1.1. You are provided with a plastic drinks cup. rim cup square A base Fig. 1.1 (a) (i) Place the cup, with the base at the bottom, in square A on this page. Draw carefully around the base of the cup. Remove the cup from the paper. Take measurements from your drawing to determine an accurate value for the diameter DB of the base of the cup. Square A DB = .................................................... cm [2] (ii) Place the cup, with the rim at the bottom, in square B on this page. Draw carefully around the rim of the cup. Remove the cup from the paper. Take measurements from your drawing to determine the diameter DT of the rim of the cup. Square B DT = .................................................... cm [1] DB + DT (iii) Calculate the average diameter D of the cup using the equation D = . 2 D = .................................................... cm [1] (b) (i) Measure the vertical height h of the cup. h = .................................................... cm [1] (ii) 1. Calculate the volume V of the cup using the equation V = 0.785 D 2 h. V = ....................................................... cm3 2. Calculate V / 2. V / 2 = ....................................................... cm3 [1] (c) You are provided with water in beaker W. Pour a volume V / 2 of water into the measuring cylinder. Pour this water into the cup. (i) Use the balance provided to measure the mass m of the cup containing the water. m = ....................................................... g [1] 2 m (ii) Determine the density ρ of water using the equation ρ = . V Give your answer to a suitable number of significant figures for this experiment. Include the unit. ρ = .......................................................... [3] (d) A student carries out all the instructions for this experiment with care, but his value for the density of water ρ is not equal to the expected value. Suggest, with a reason, a part of the procedure, (a), (b) or (c) that could give an unreliable result. part ................................ reason ....................................................................................................................................... ................................................................................................................................................... [1] [Total: 11]
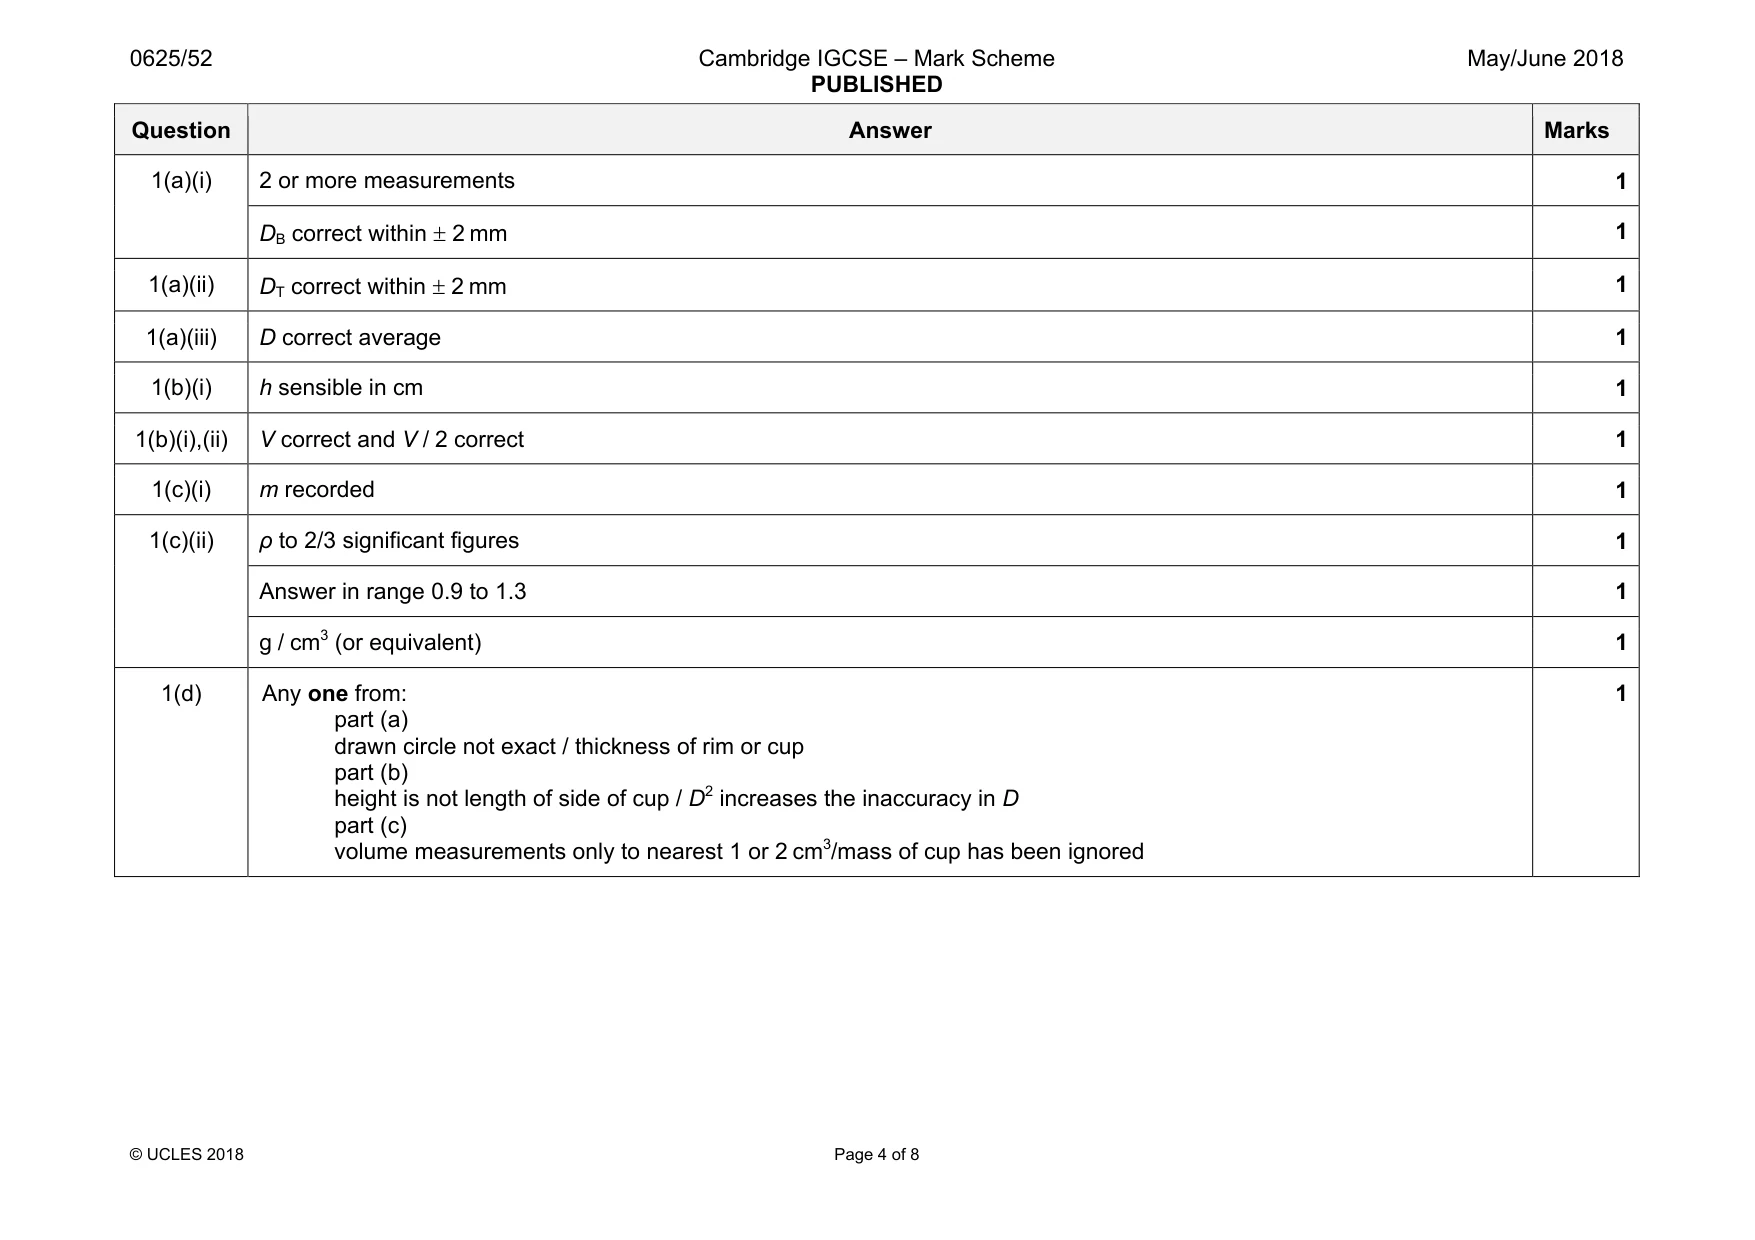
Mark scheme: 1(a)(i) 2 or more measurements 1 DB correct within ± 2 mm 1 1(a)(ii) DT correct within ± 2 mm 1 1(a)(iii) D correct average 1 1(b)(i) h sensible in cm 1 1(b)(i),(ii) V correct and V / 2 correct 1 1(c)(i) m recorded 1 1(c)(ii) ρ to 2/3 significant figures 1 Answer in range 0.9 to 1.3 1 g / cm3 (or equivalent) 1 1(d) Any one from: part (a) drawn circle not exact / thickness of rim or cup part (b) height is not length of side of cup / D2 increases the inaccuracy in D part (c) volume measurements only to nearest 1 or 2 cm3/mass of cup has been ignored 1
More questions on Physical quantities and measurement techniques
Q2 · In this experiment, you will investigate the cooling of water
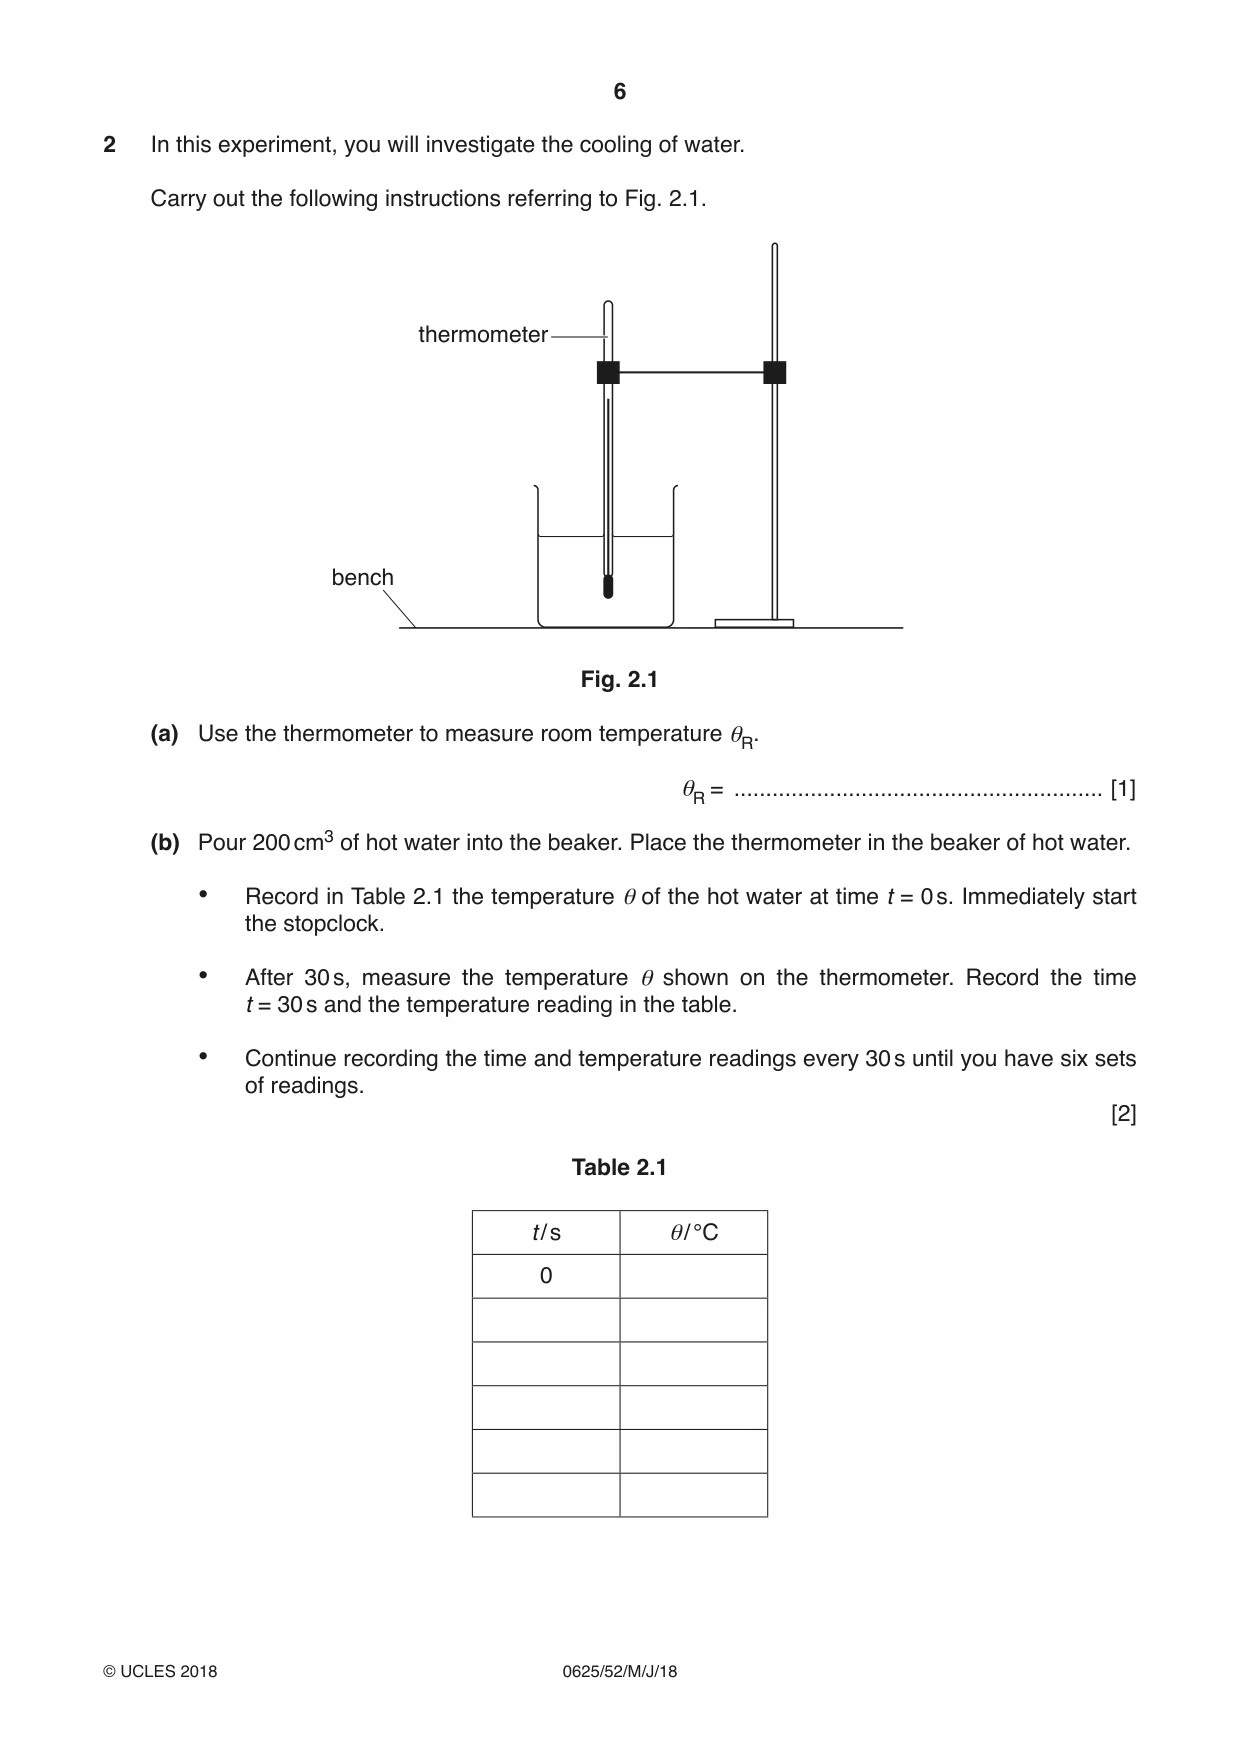
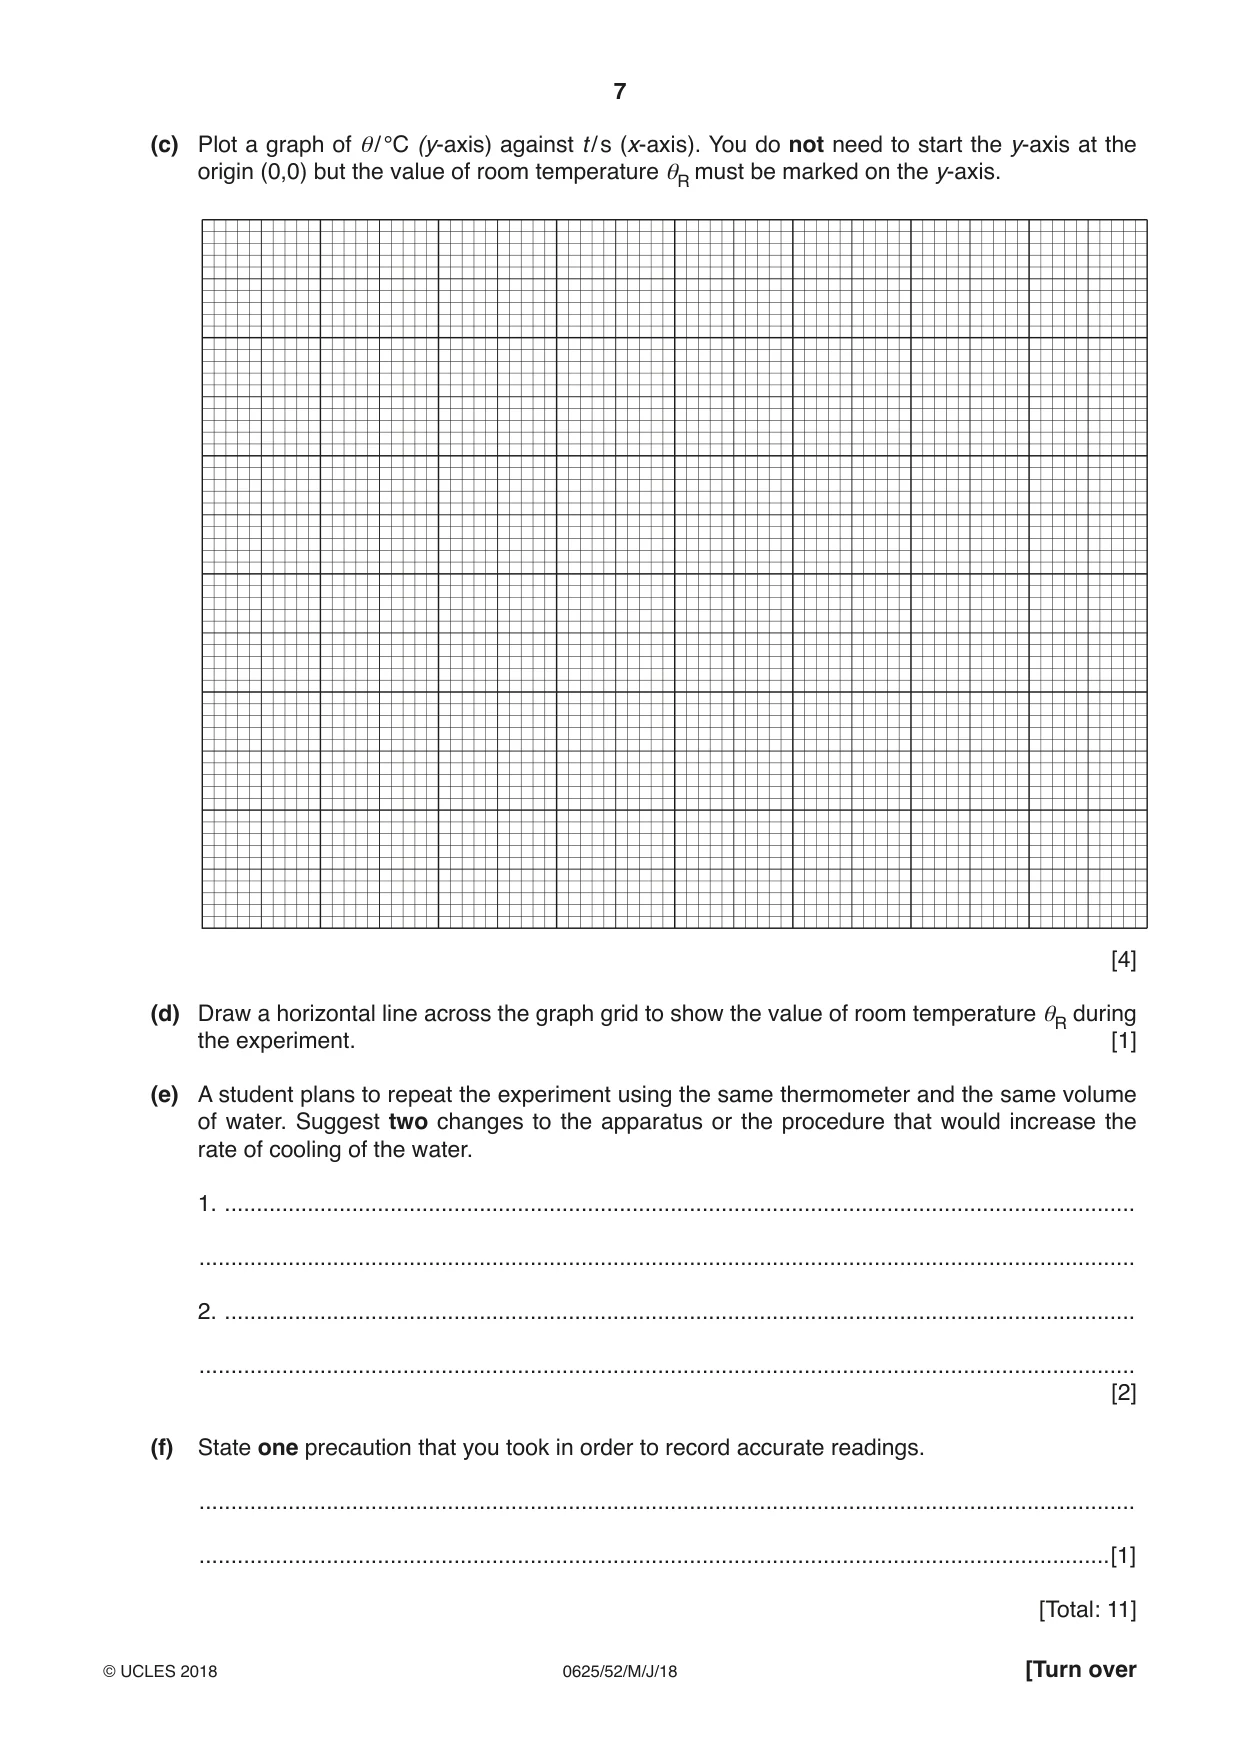
2 In this experiment, you will investigate the cooling of water. Carry out the following instructions referring to Fig. 2.1. thermometer bench Fig. 2.1 (a) Use the thermometer to measure room temperature θR. θR = .......................................................... [1] (b) Pour 200 cm3 of hot water into the beaker. Place the thermometer in the beaker of hot water. • Record in Table 2.1 the temperature θ of the hot water at time t = 0 s. Immediately start the stopclock. • After 30 s, measure the temperature θ shown on the thermometer. Record the time t = 30 s and the temperature reading in the table. • Continue recording the time and temperature readings every 30 s until you have six sets of readings. [2] Table 2.1 t / s θ/ °C 0 (c) Plot a graph of θ/ °C (y-axis) against t / s (x-axis). You do not need to start the y-axis at the origin (0,0) but the value of room temperature θR must be marked on the y-axis. [4] (d) Draw a horizontal line across the graph grid to show the value of room temperature θR during the experiment. [1] (e) A student plans to repeat the experiment using the same thermometer and the same volume of water. Suggest two changes to the apparatus or the procedure that would increase the rate of cooling of the water. 1. ............................................................................................................................................... ................................................................................................................................................... 2. ............................................................................................................................................... ................................................................................................................................................... [2] (f) State one precaution that you took in order to record accurate readings. ................................................................................................................................................... ...............................................................................................................................................[1] [Total: 11]
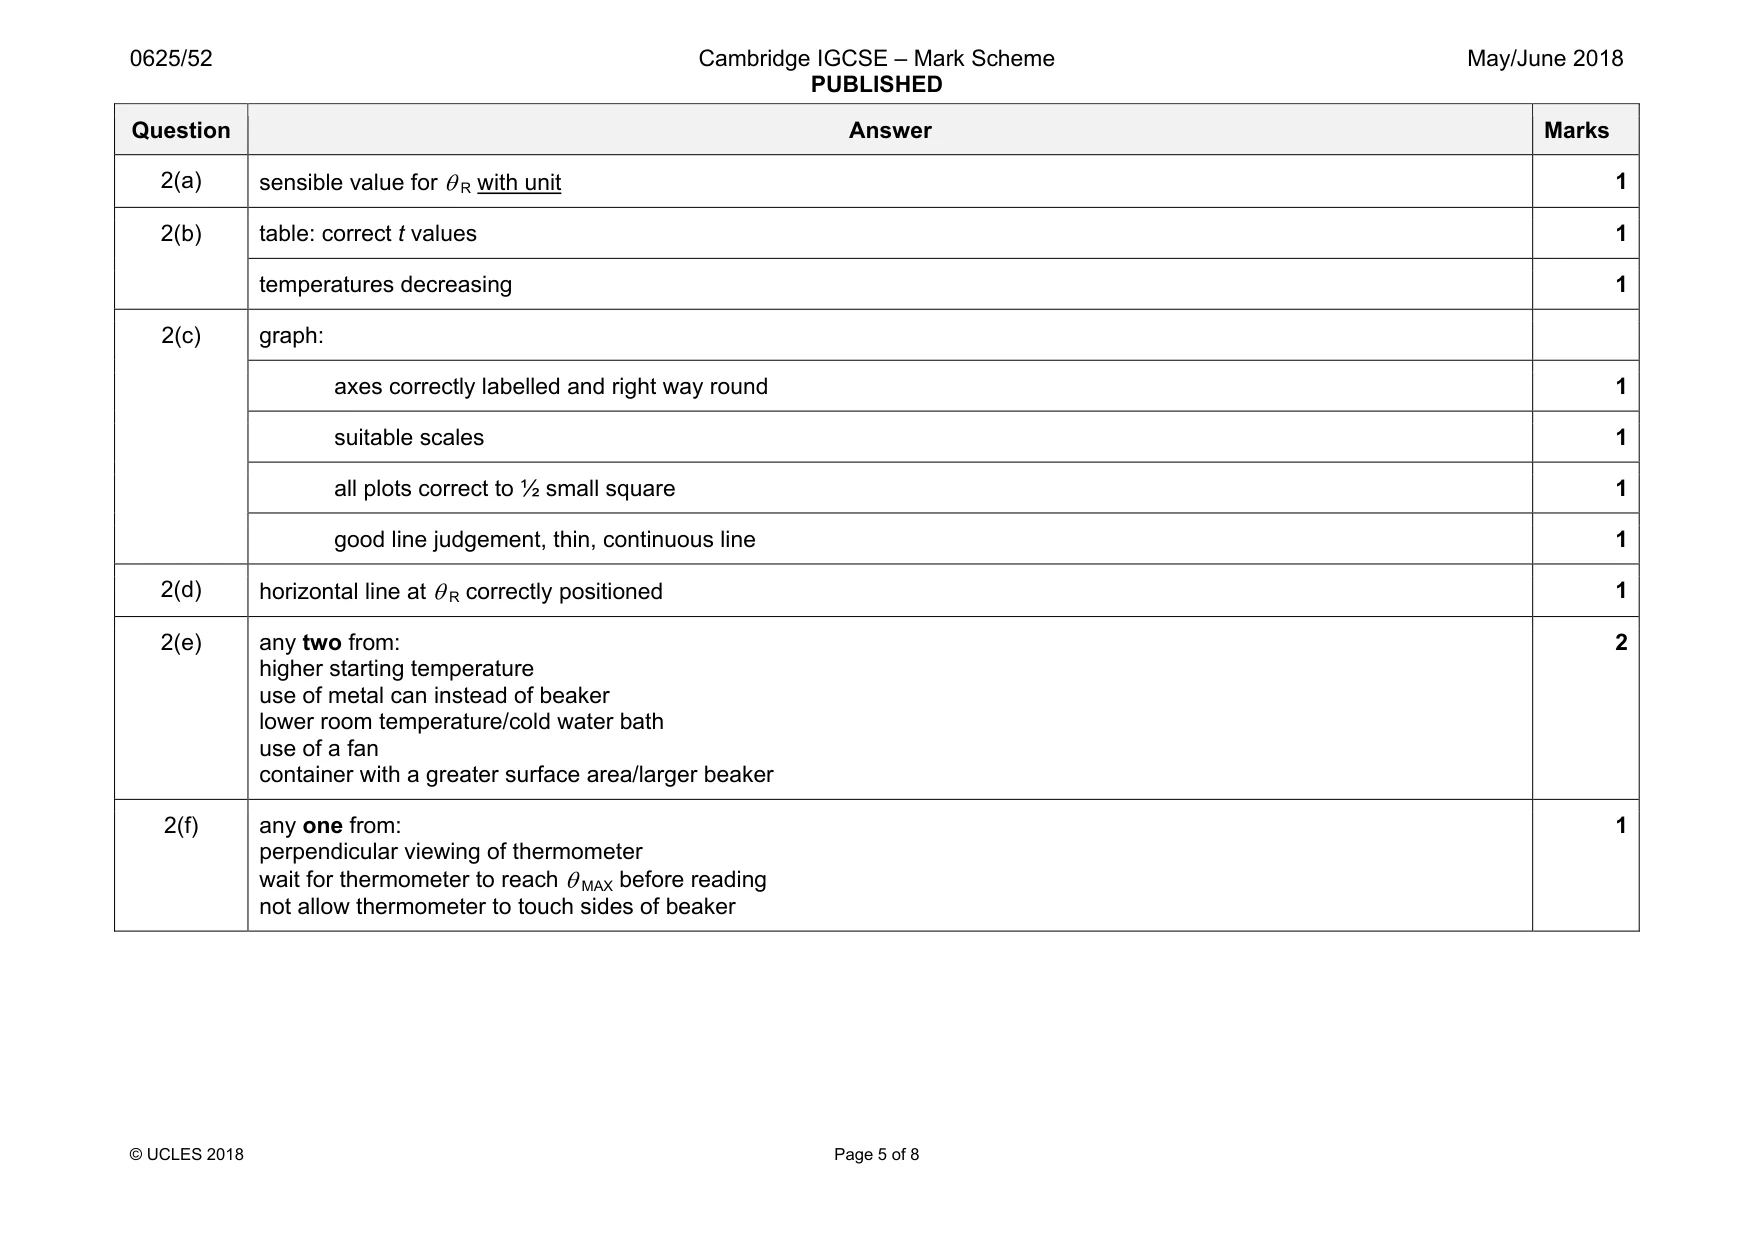
Mark scheme: 2(a) 1 2(b) table: correct t values 1 temperatures decreasing 1 2(c) graph: axes correctly labelled and right way round 1 suitable scales 1 all plots correct to ½ small square 1 good line judgement, thin, continuous line 1 2(d) horizontal line at θ R correctly positioned 1 2(e) any two from: higher starting temperature use of metal can instead of beaker lower room temperature/cold water bath use of a fan container with a greater surface area/larger beaker 2 2(f) any one from: perpendicular viewing of thermometer wait for thermometer to reach θ MAX before reading not allow thermometer to touch sides of beaker 1
Q3 · In this experiment, you will determine the focal length f of a lens
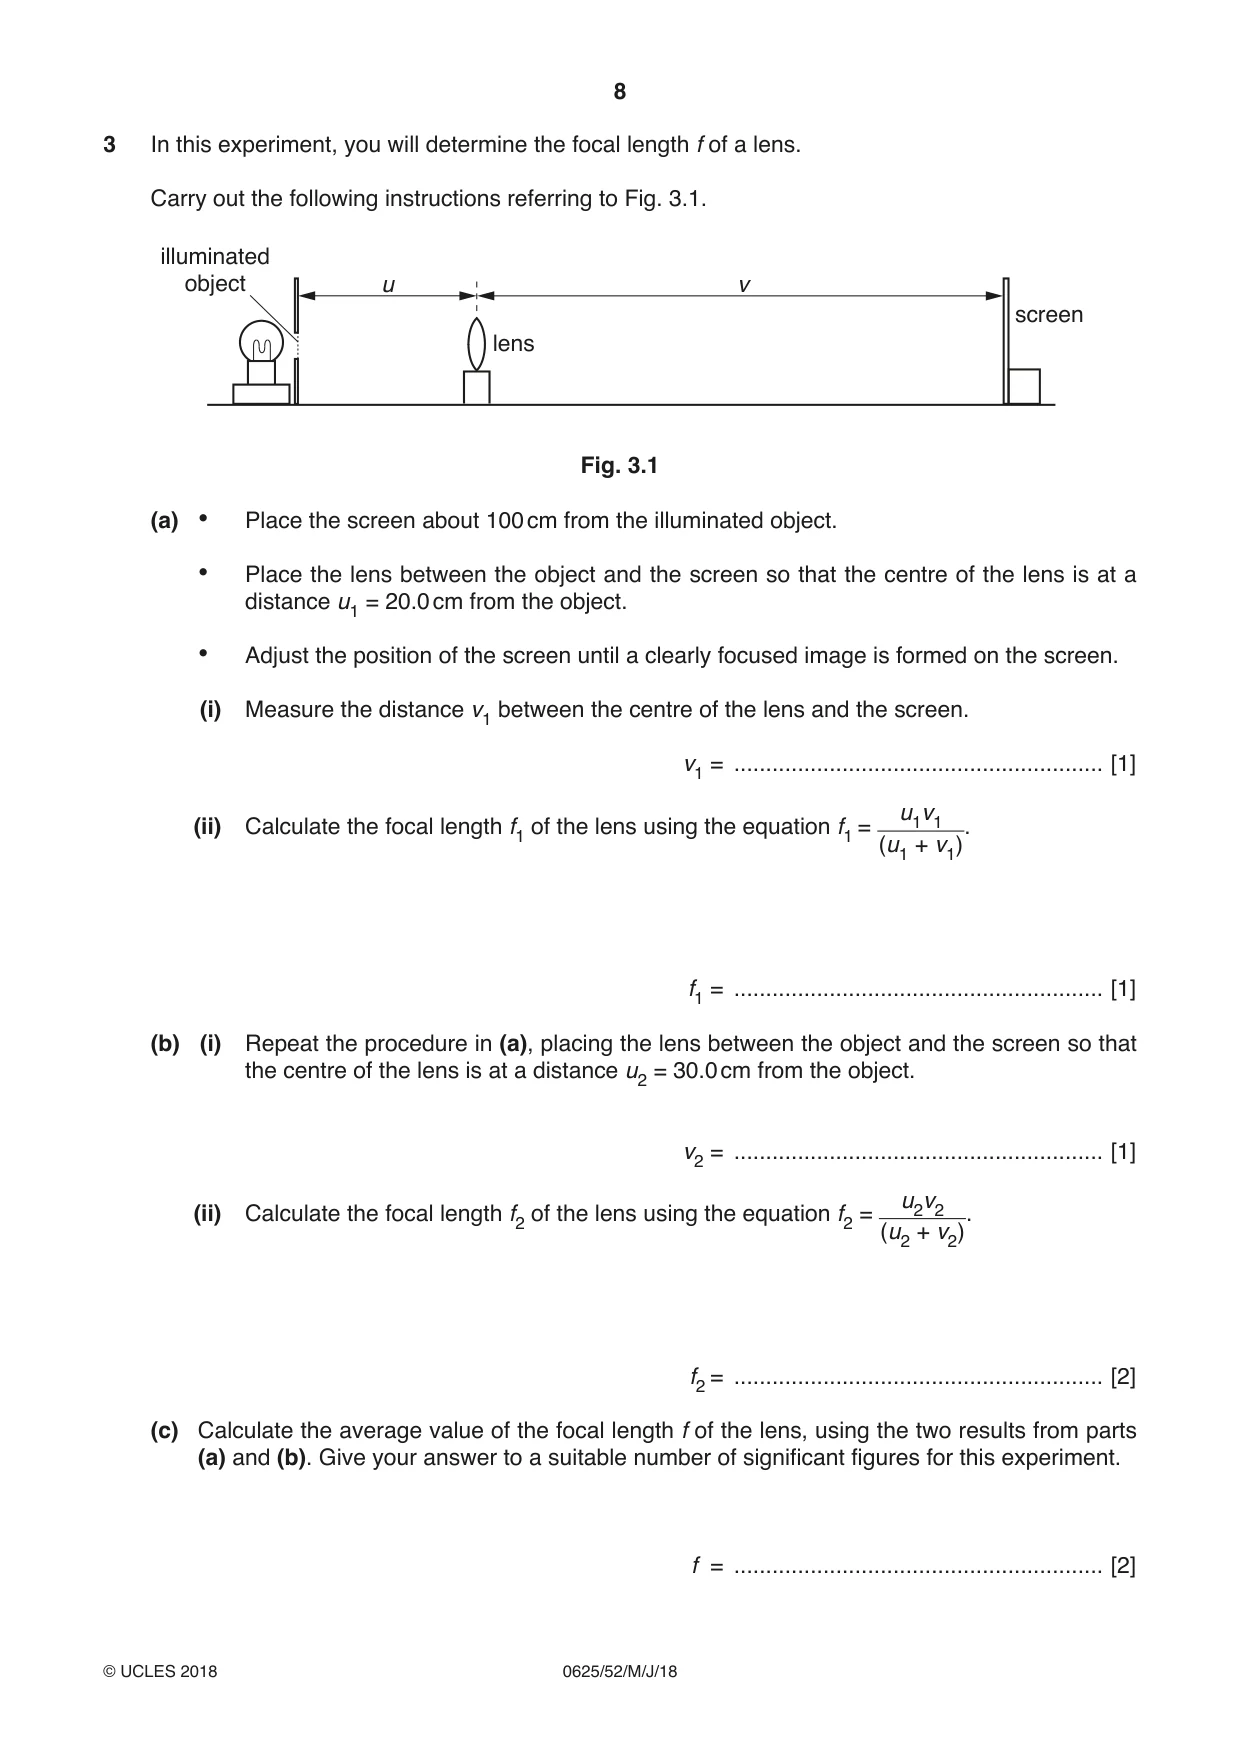
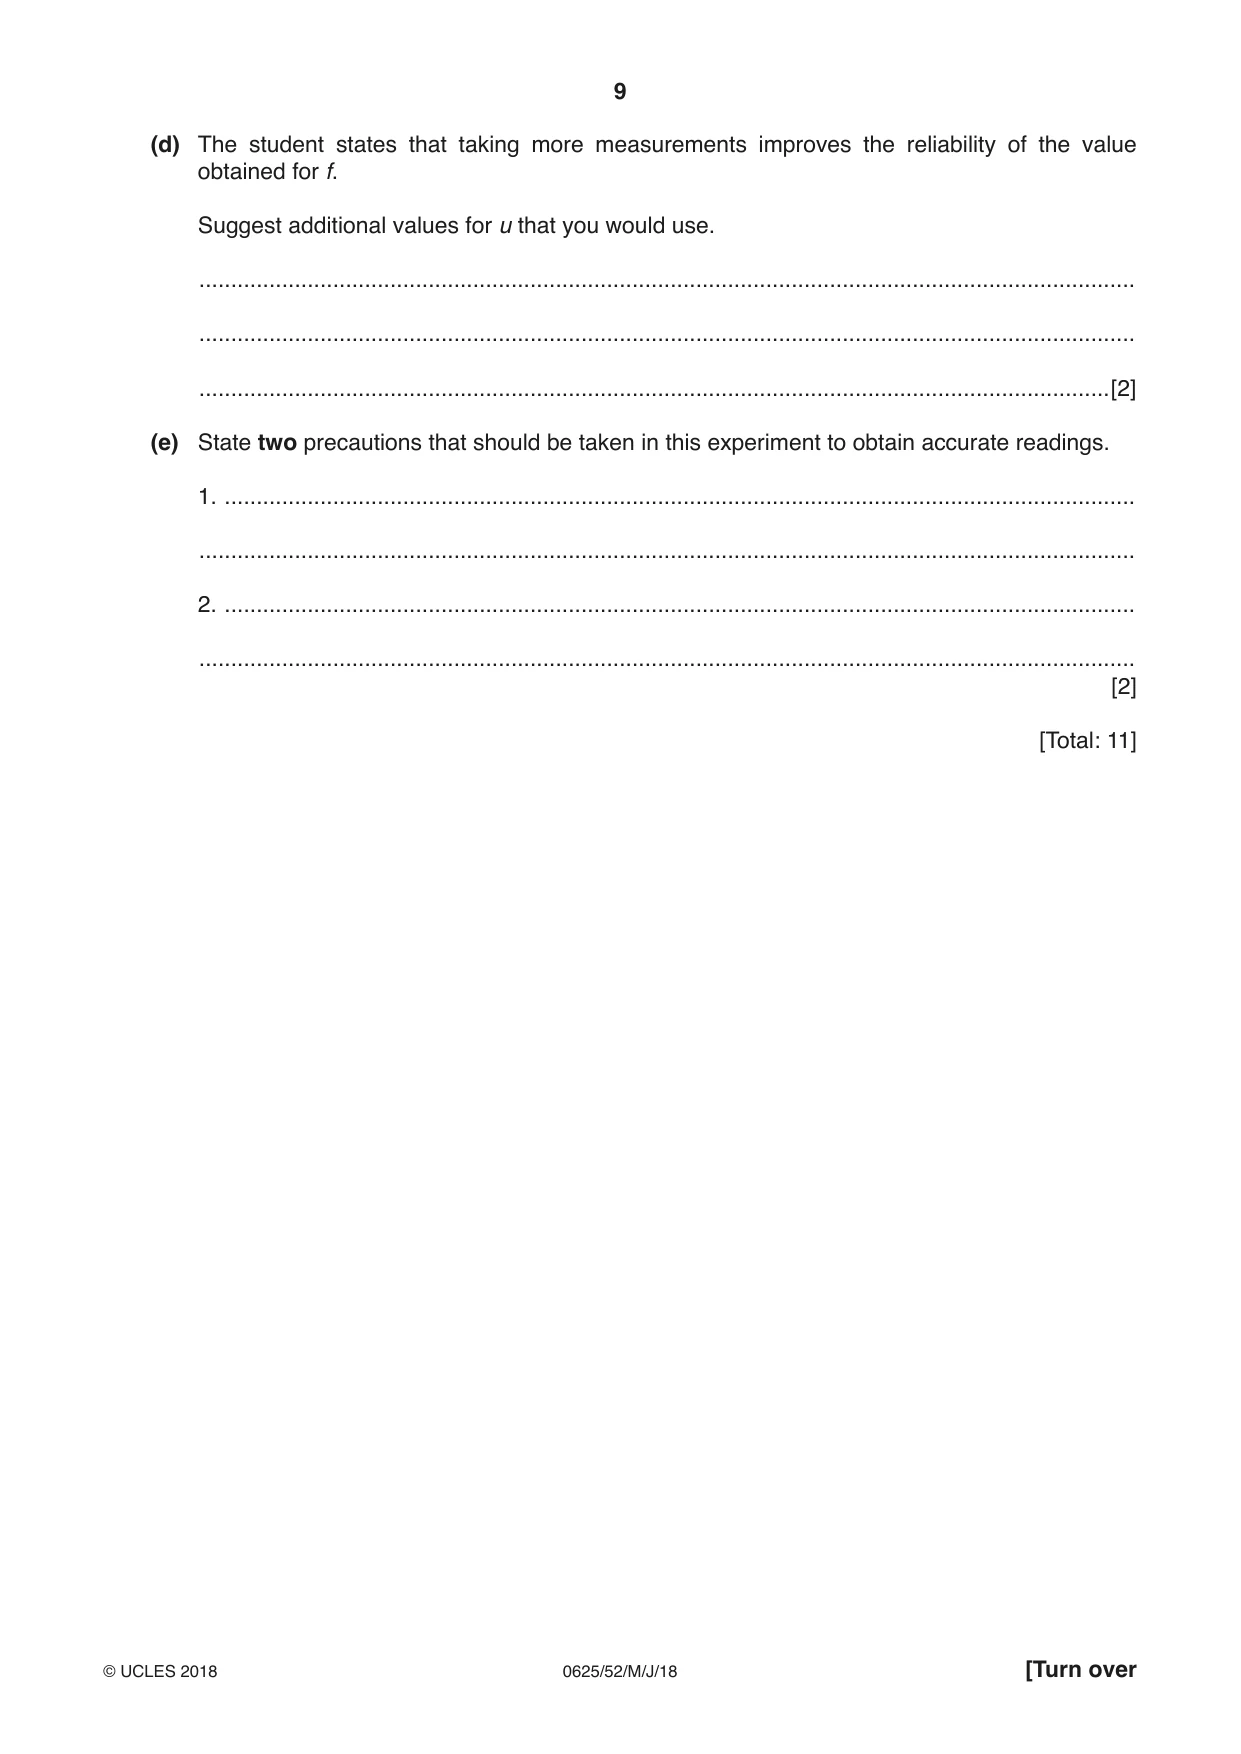
3 In this experiment, you will determine the focal length f of a lens. Carry out the following instructions referring to Fig. 3.1. illuminated object u v screen lens Fig. 3.1 (a) • Place the screen about 100 cm from the illuminated object. • Place the lens between the object and the screen so that the centre of the lens is at a distance u1 = 20.0 cm from the object. • Adjust the position of the screen until a clearly focused image is formed on the screen. (i) Measure the distance v1 between the centre of the lens and the screen. v1 = .......................................................... [1] u1v1 (ii) Calculate the focal length f1 of the lens using the equation f1 = (u1 + v1). f1 = .......................................................... [1] (b) (i) Repeat the procedure in (a), placing the lens between the object and the screen so that the centre of the lens is at a distance u2 = 30.0 cm from the object. v2 = .......................................................... [1] u2v2 (ii) Calculate the focal length f2 of the lens using the equation f2 = (u2 + v2). f2 = .......................................................... [2] (c) Calculate the average value of the focal length f of the lens, using the two results from parts (a) and (b). Give your answer to a suitable number of significant figures for this experiment. f = .......................................................... [2] (d) The student states that taking more measurements improves the reliability of the value obtained for f. Suggest additional values for u that you would use. ................................................................................................................................................... ................................................................................................................................................... ...............................................................................................................................................[2] (e) State two precautions that should be taken in this experiment to obtain accurate readings. 1. ............................................................................................................................................... ................................................................................................................................................... 2. ............................................................................................................................................... ................................................................................................................................................... [2] [Total: 11]
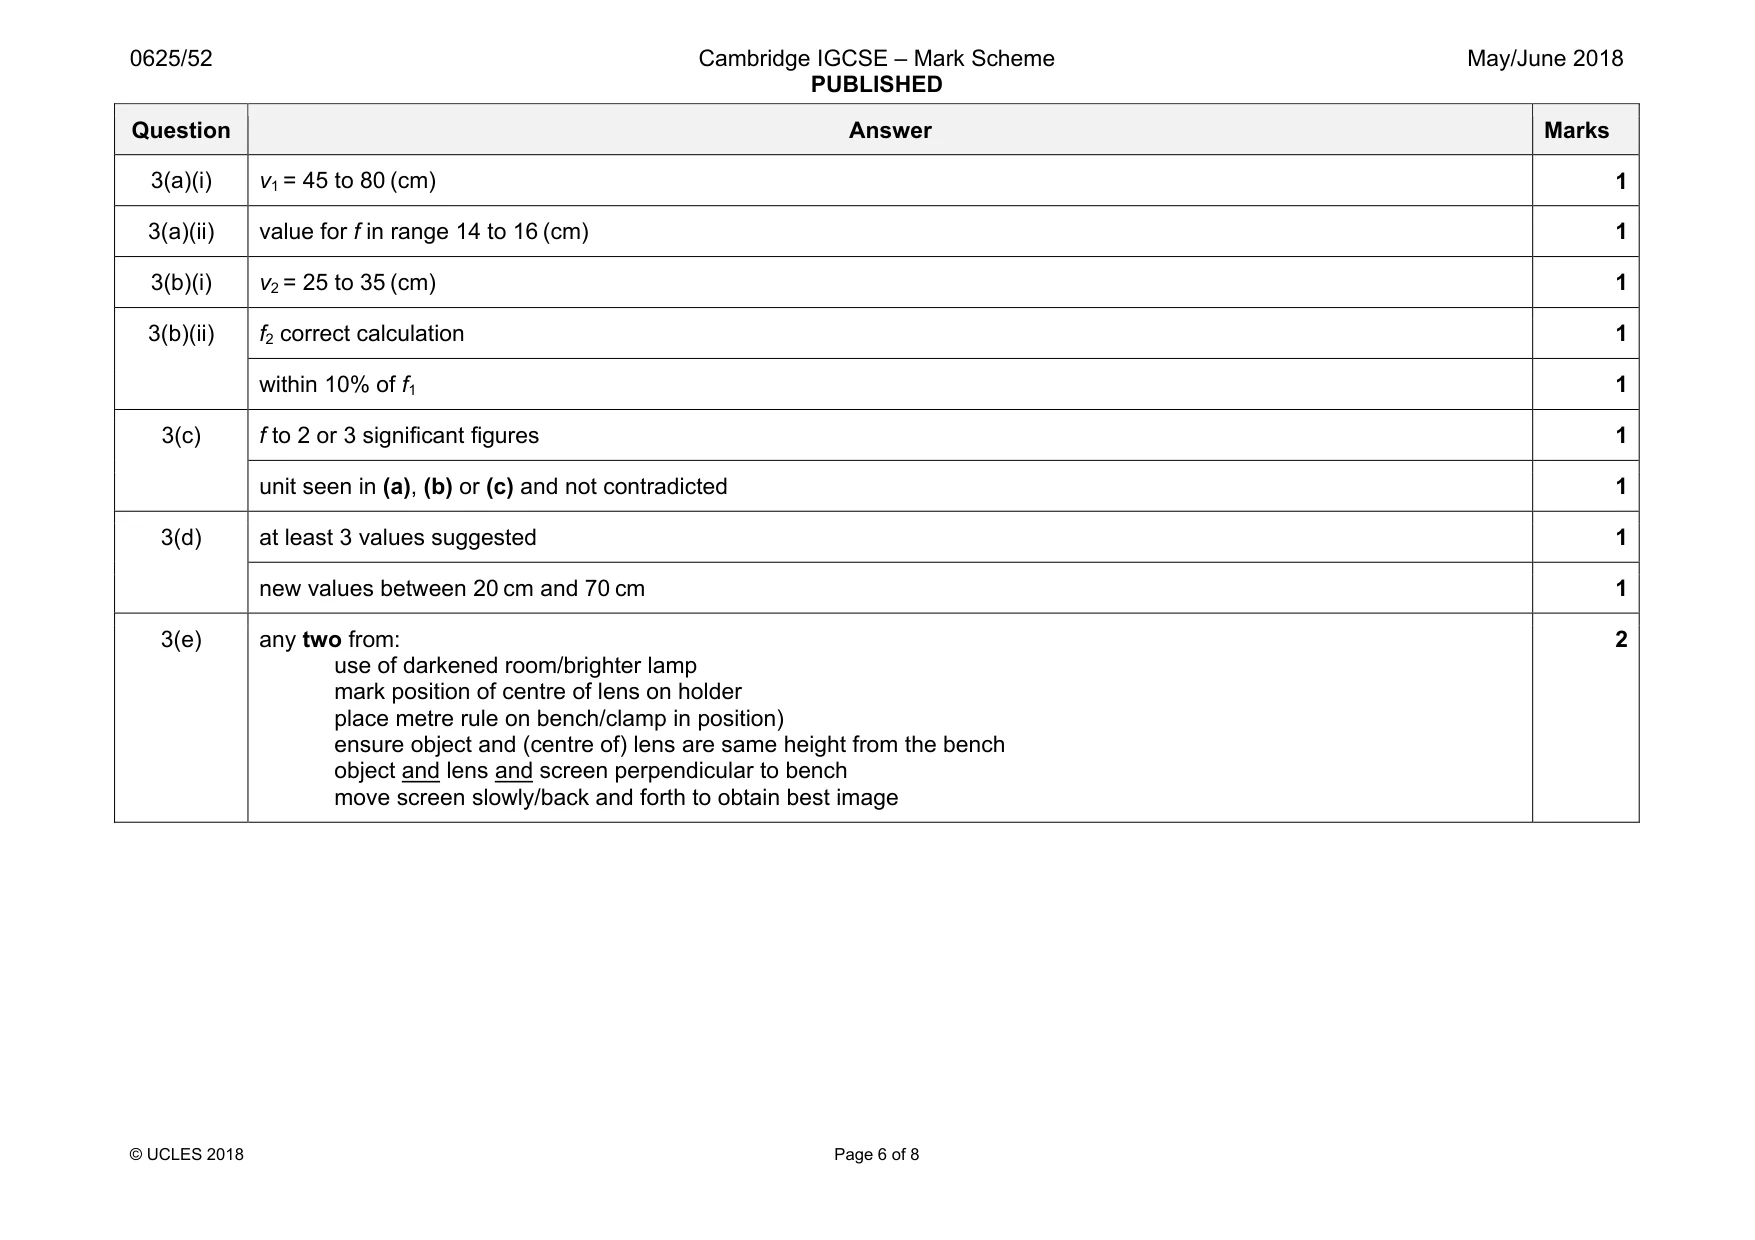
Mark scheme: 3(a)(i) v1 = 45 to 80 (cm) 1 3(a)(ii) value for f in range 14 to 16 (cm) 1 3(b)(i) v2 = 25 to 35 (cm) 1 3(b)(ii) f2 correct calculation 1 within 10% of f1 1 3(c) f to 2 or 3 significant figures 1 unit seen in (a), (b) or (c) and not contradicted 1 3(d) at least 3 values suggested 1 new values between 20 cm and 70 cm 1 3(e) any two from: use of darkened room/brighter lamp mark position of centre of lens on holder place metre rule on bench/clamp in position) ensure object and (centre of) lens are same height from the bench object and lens and screen perpendicular to bench move screen slowly/back and forth to obtain best image 2
Q4 · A student is investigating whether the distance that a toy truck will travel along a…
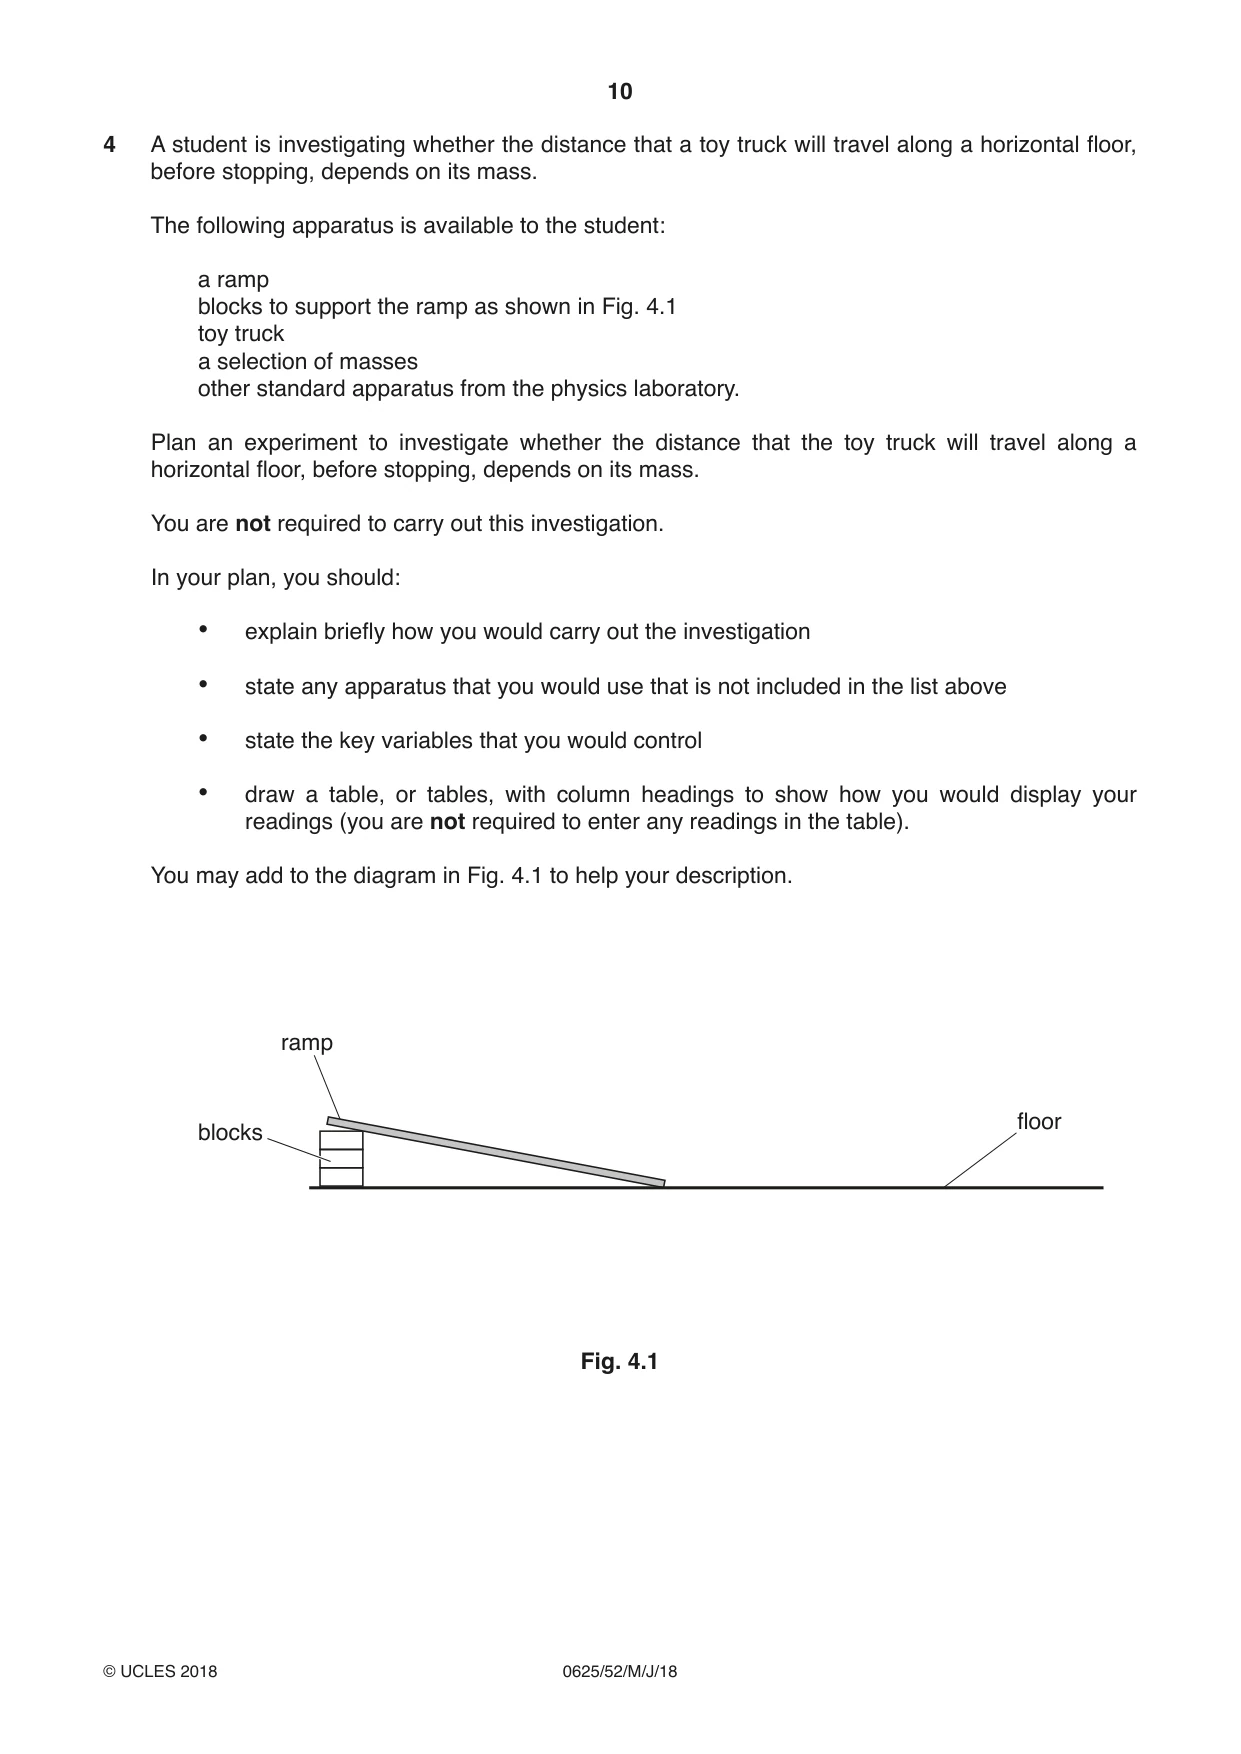
4 A student is investigating whether the distance that a toy truck will travel along a horizontal floor, before stopping, depends on its mass. The following apparatus is available to the student: a ramp blocks to support the ramp as shown in Fig. 4.1 toy truck a selection of masses other standard apparatus from the physics laboratory. Plan an experiment to investigate whether the distance that the toy truck will travel along a horizontal floor, before stopping, depends on its mass. You are not required to carry out this investigation. In your plan, you should: • explain briefly how you would carry out the investigation • state any apparatus that you would use that is not included in the list above • state the key variables that you would control • draw a table, or tables, with column headings to show how you would display your readings (you are not required to enter any readings in the table). You may add to the diagram in Fig. 4.1 to help your description. ramp floor blocks Fig. 4.1 ................................................................................................................................................... ................................................................................................................................................... ................................................................................................................................................... ................................................................................................................................................... ................................................................................................................................................... ................................................................................................................................................... ................................................................................................................................................... ................................................................................................................................................... ................................................................................................................................................... ................................................................................................................................................... ................................................................................................................................................... ................................................................................................................................................... ................................................................................................................................................... ................................................................................................................................................... ................................................................................................................................................... ................................................................................................................................................... ...............................................................................................................................................[7] [Total: 7]
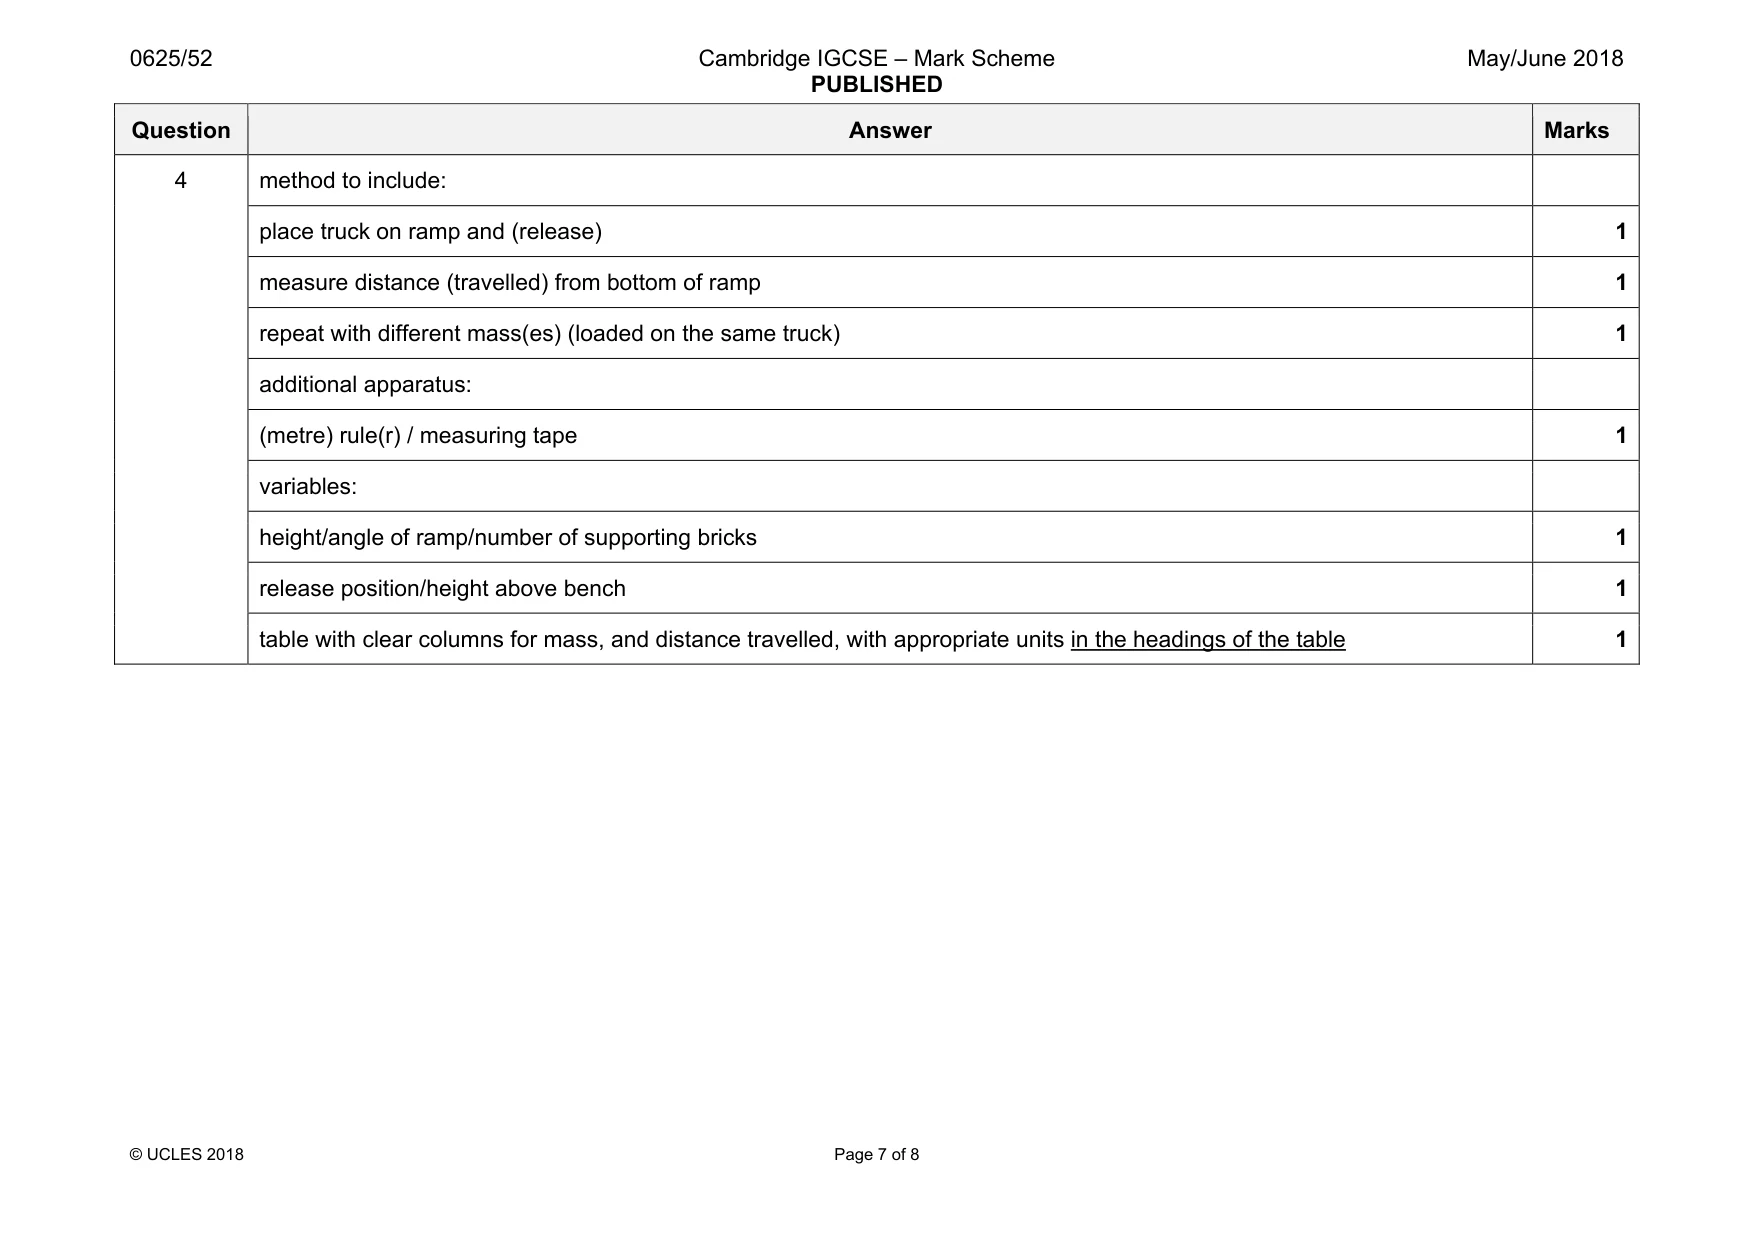
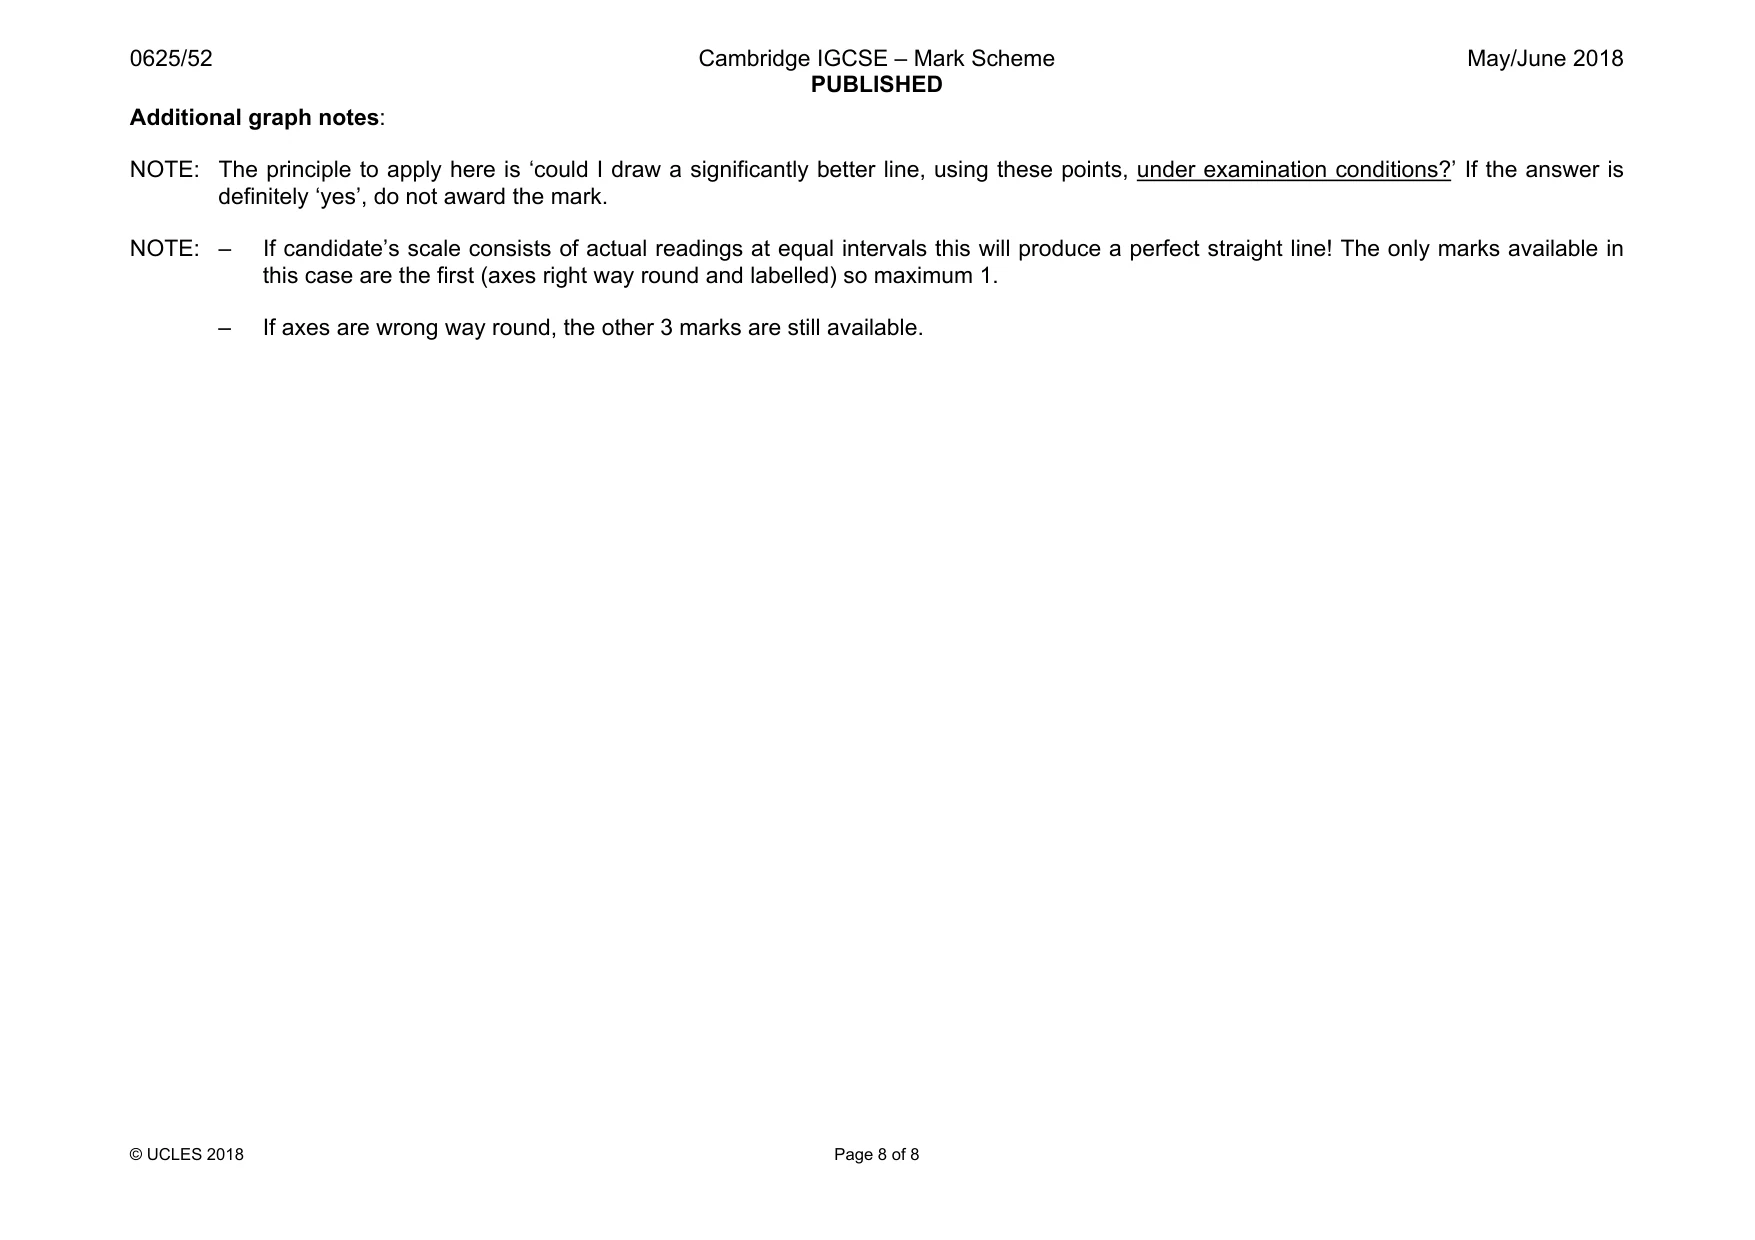
Mark scheme: 4 method to include: place truck on ramp and (release) 1 measure distance (travelled) from bottom of ramp 1 repeat with different mass(es) (loaded on the same truck) 1 additional apparatus: (metre) rule(r) / measuring tape 1 variables: height/angle of ramp/number of supporting bricks 1 release position/height above bench 1 table with clear columns for mass, and distance travelled, with appropriate units in the headings of the table 1 NOTE: The principle to apply here is ‘could I draw a significantly better line, using these points, under examination conditions?’ If the answer is definitely ‘yes’, do not award the mark. NOTE: – If candidate’s scale consists of actual readings at equal intervals this will produce a perfect straight line! The only marks available in this case are the first (axes right way round and labelled) so maximum 1. – If axes are wrong way round, the other 3 marks are still available.
What was in this paper
The subtopics covered by these 4 questions, and how many questions each got. Open one in a new tab to see every Cambridge question on it.
What you needed in this session
Cambridge’s own grade thresholds for 2018 May/June, Paper 5 · Variant 2. A higher threshold means an easier paper — the bar moves with how the cohort did.