Cambridge IGCSE Physics 0625 — 2018 May/June Paper 5 · Variant 3
0625/53/M/J/18 · 4 questions · 40 marks · ≈45 min
The question paper and its mark scheme, free to read here and free to download. This is Cambridge’s own paper, exactly as it was sat.
Question paper12 pages


Mark scheme7 pages
Answers below. Sit the paper first if you are practising.
Questions as text
Q1 · In this experiment, you will investigate how partly covering the surface of the water in…
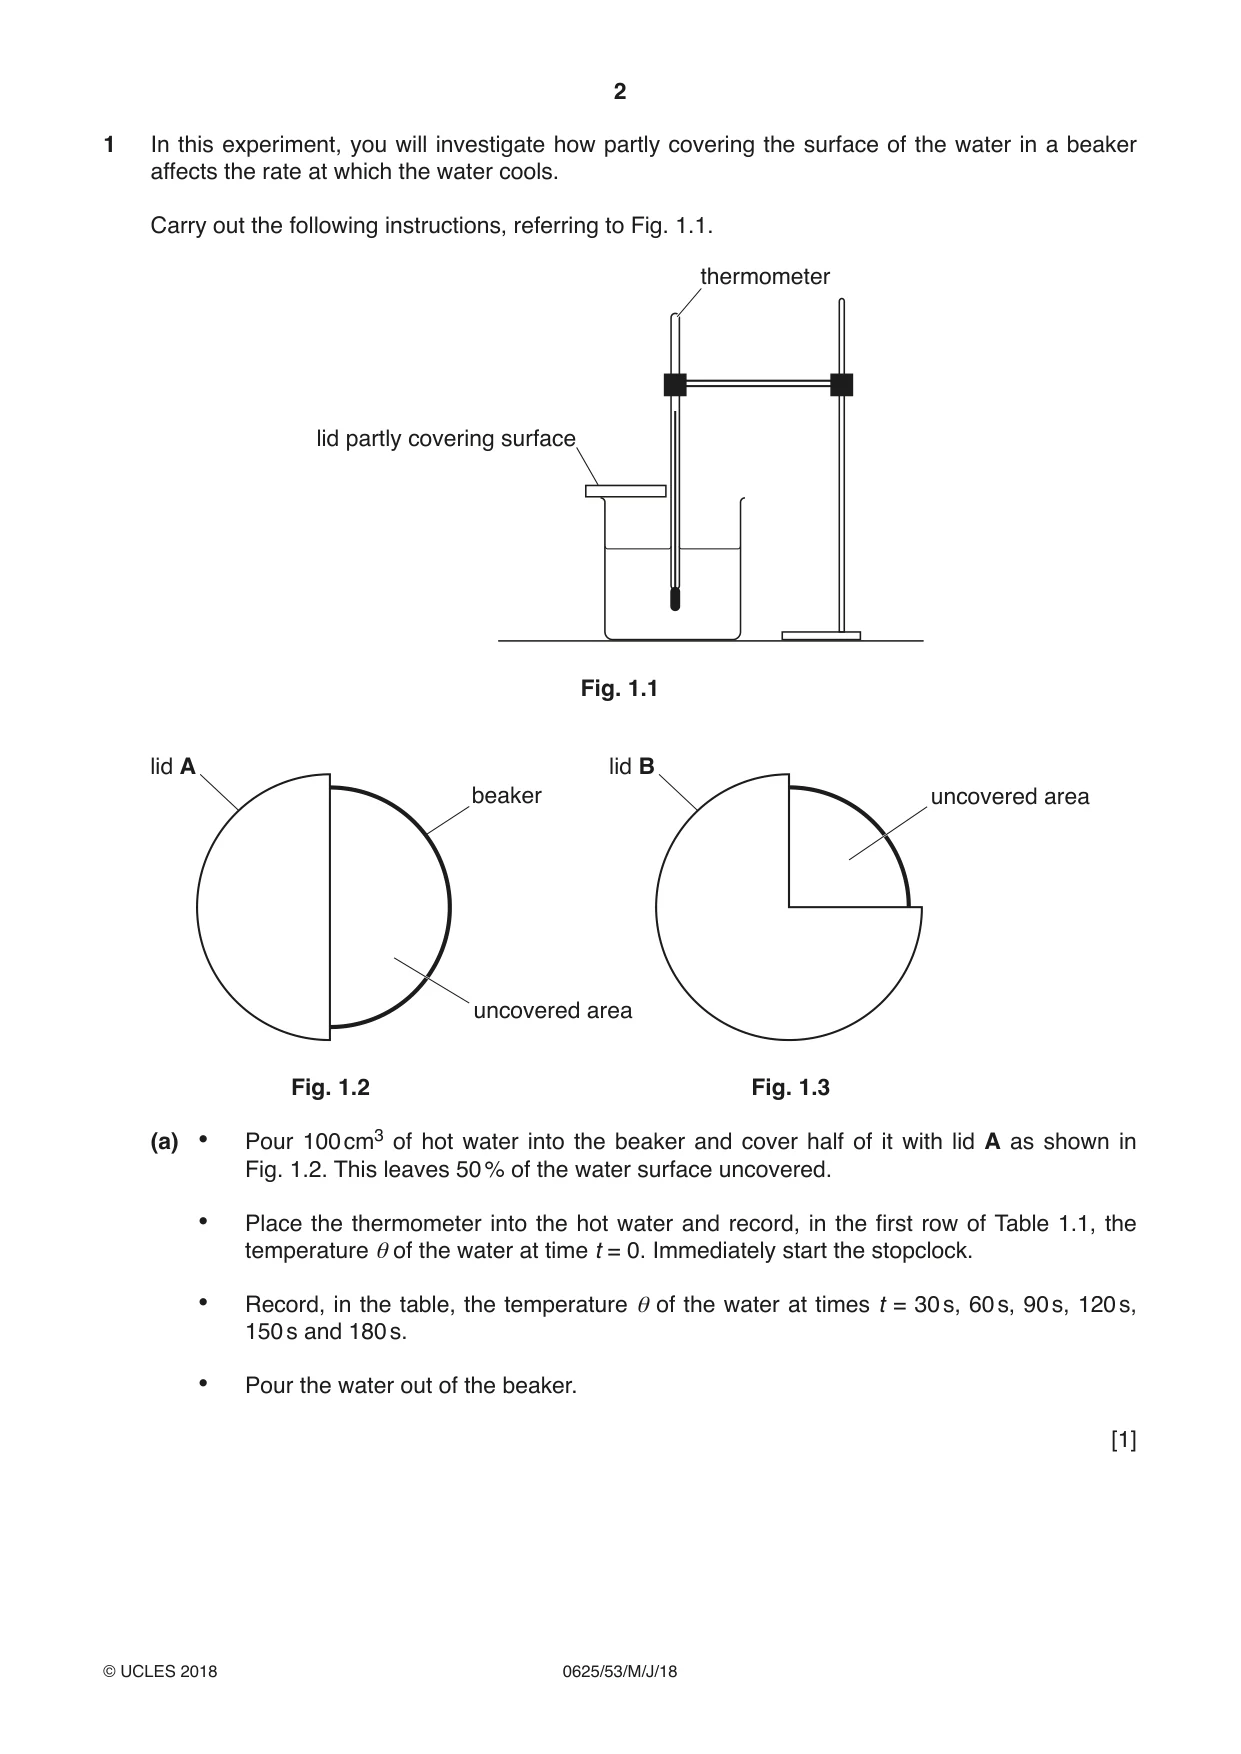
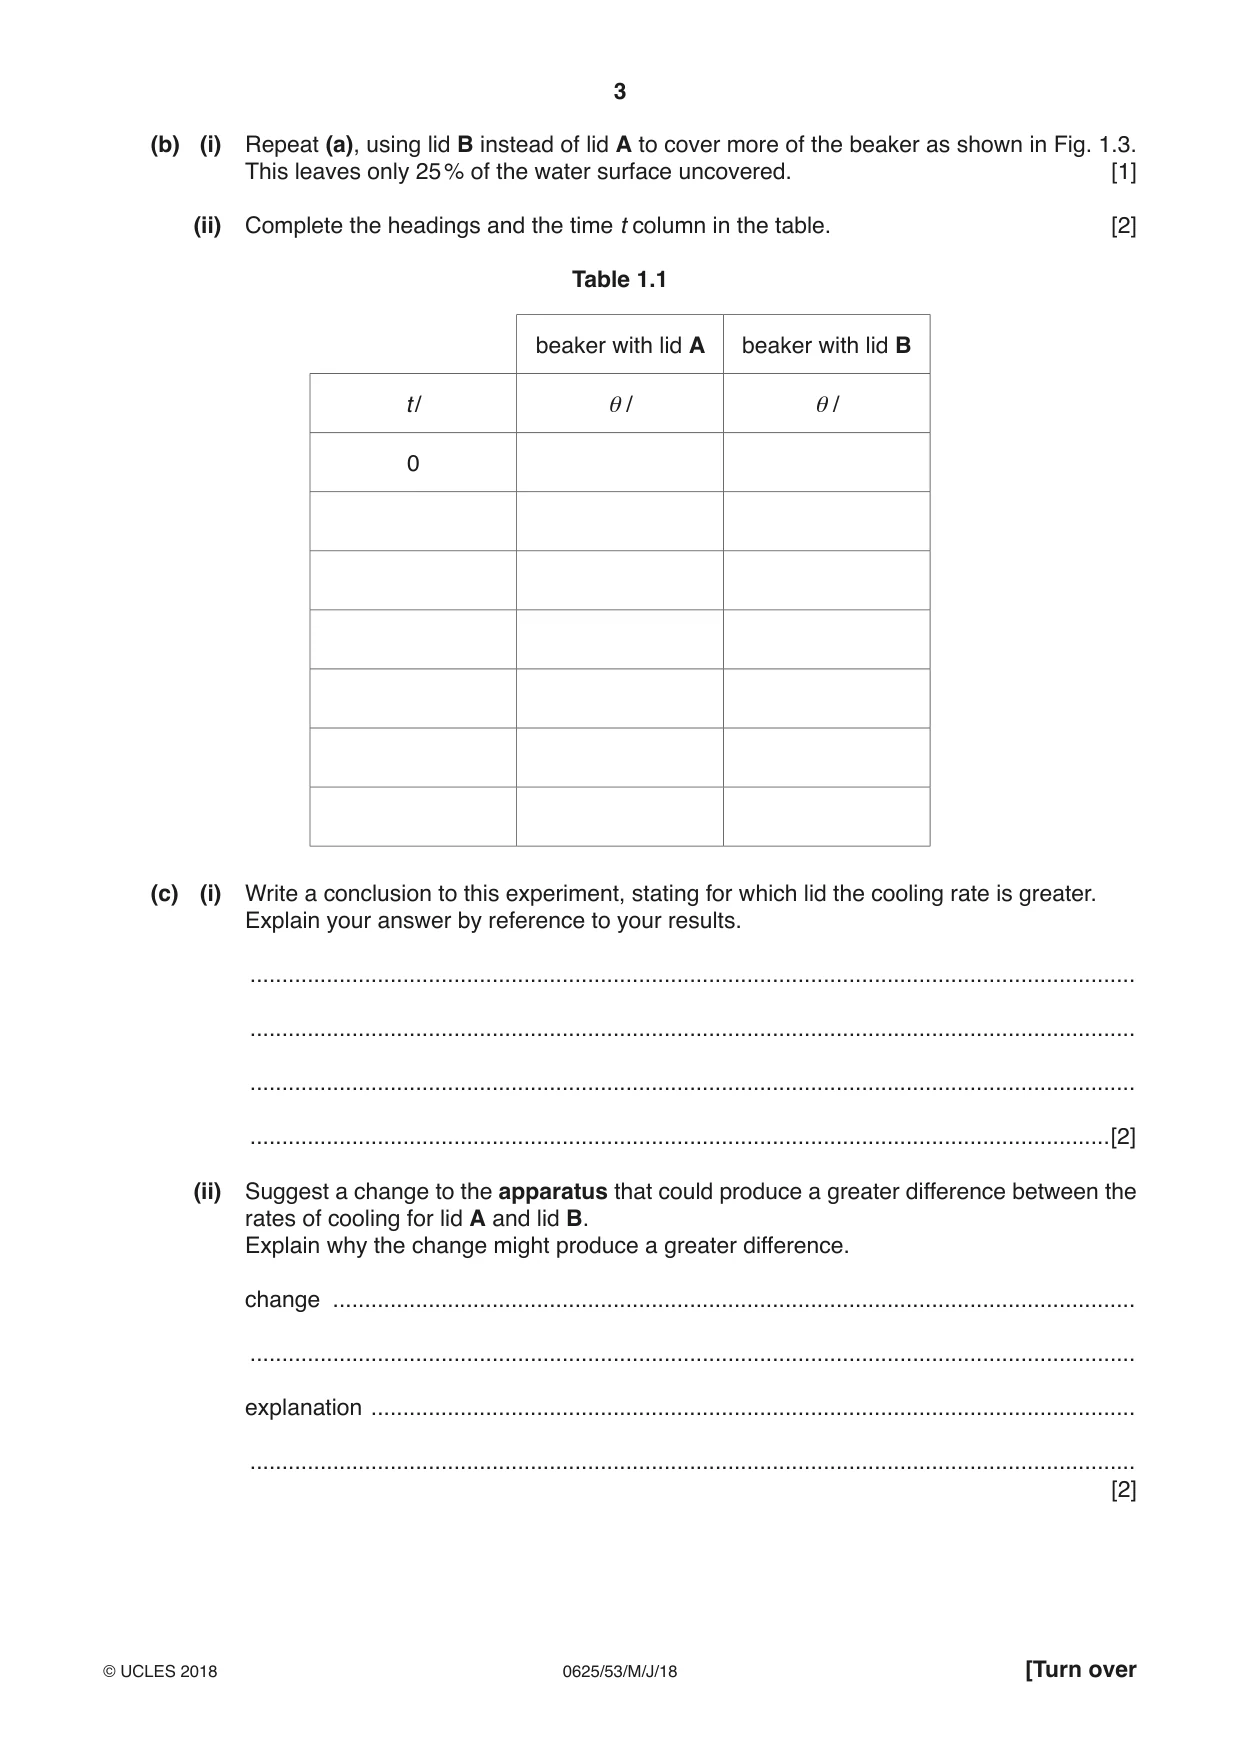
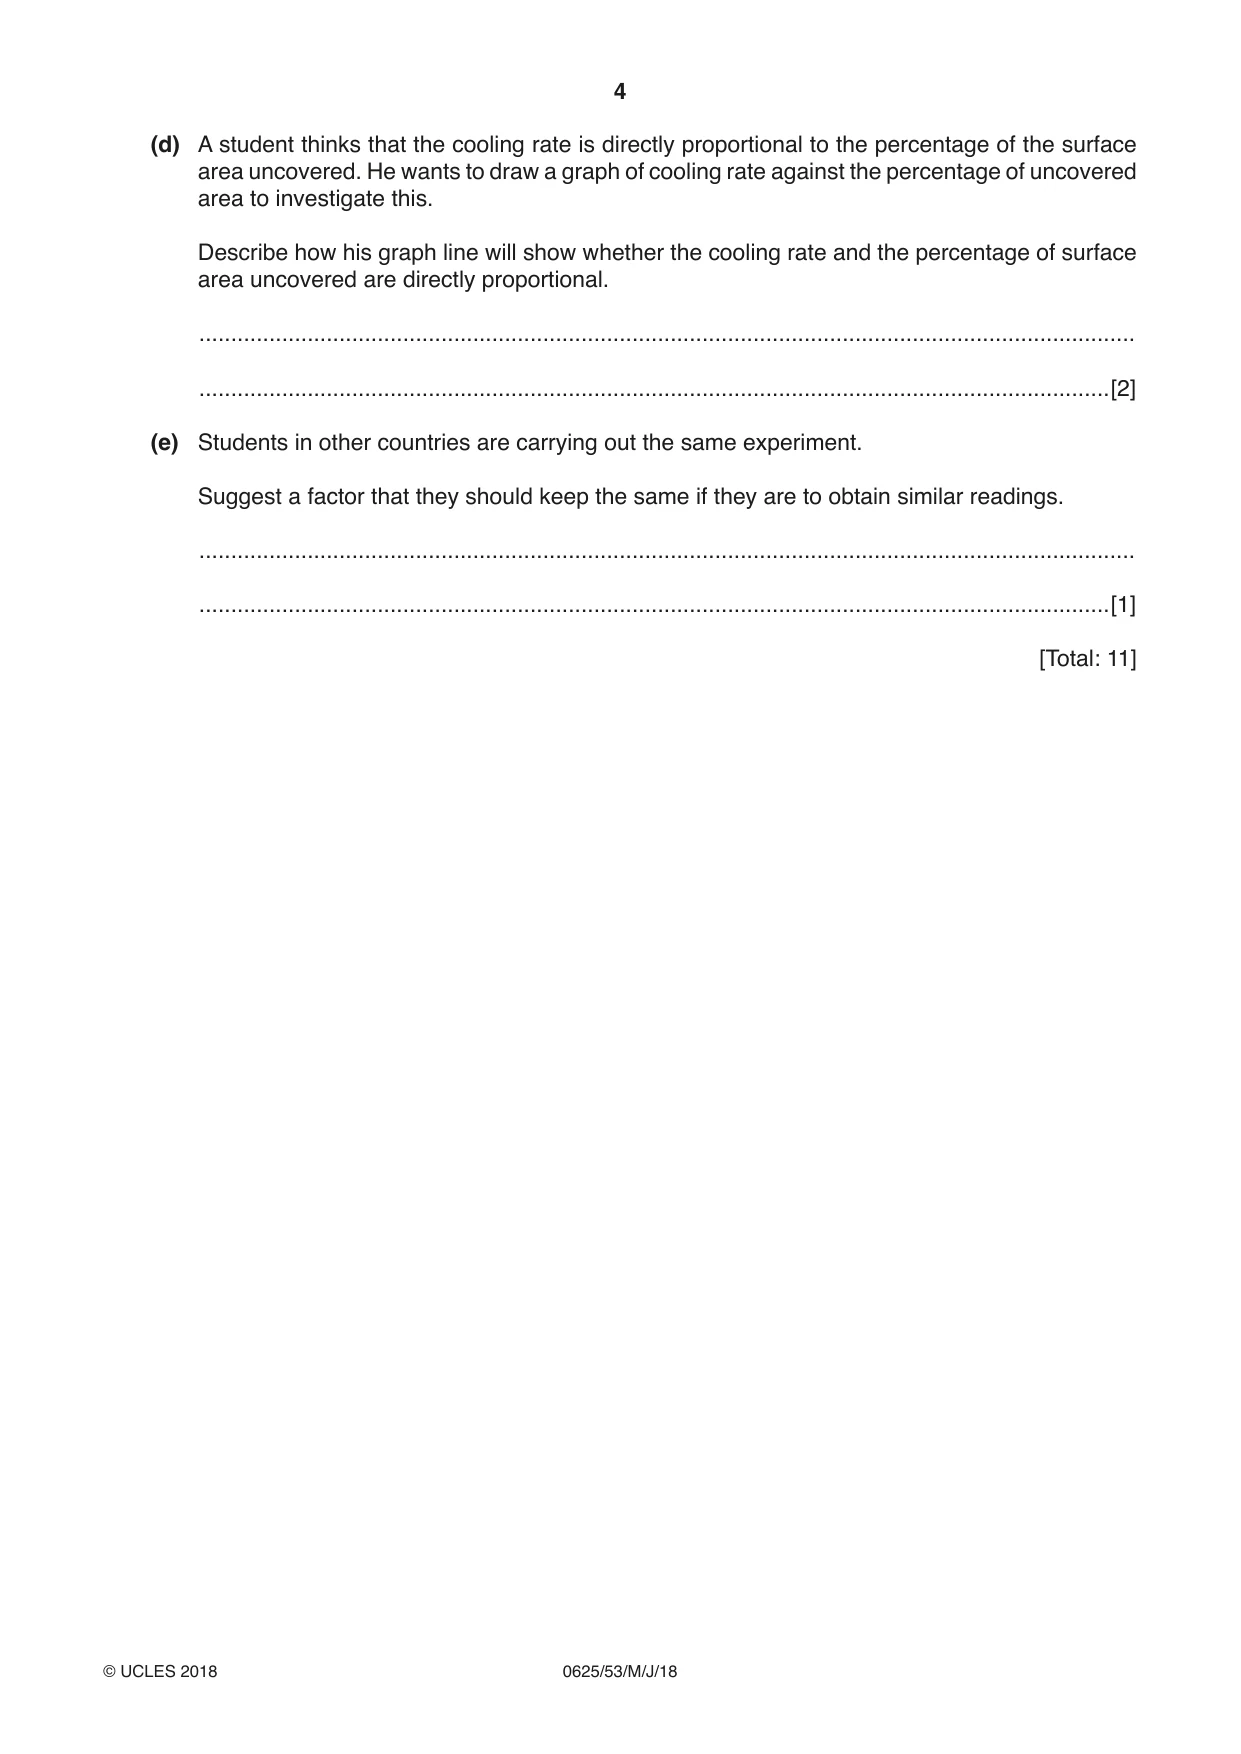
1 In this experiment, you will investigate how partly covering the surface of the water in a beaker affects the rate at which the water cools. Carry out the following instructions, referring to Fig. 1.1. thermometer lid partly covering surface Fig. 1.1 lid A lid B beaker uncovered area uncovered area Fig. 1.2 Fig. 1.3 (a) • Pour 100 cm3 of hot water into the beaker and cover half of it with lid A as shown in Fig. 1.2. This leaves 50 % of the water surface uncovered. • Place the thermometer into the hot water and record, in the first row of Table 1.1, the temperature θ of the water at time t = 0. Immediately start the stopclock. • Record, in the table, the temperature θ of the water at times t = 30 s, 60 s, 90 s, 120 s, 150 s and 180 s. • Pour the water out of the beaker. [1] (b) (i) Repeat (a), using lid B instead of lid A to cover more of the beaker as shown in Fig. 1.3. This leaves only 25 % of the water surface uncovered. [1] (ii) Complete the headings and the time t column in the table. [2] Table 1.1 beaker with lid A beaker with lid B t / θ / θ / 0 (c) (i) Write a conclusion to this experiment, stating for which lid the cooling rate is greater. Explain your answer by reference to your results. ........................................................................................................................................... ........................................................................................................................................... ........................................................................................................................................... .......................................................................................................................................[2] (ii) Suggest a change to the apparatus that could produce a greater difference between the rates of cooling for lid A and lid B. Explain why the change might produce a greater difference. change .............................................................................................................................. ........................................................................................................................................... explanation ........................................................................................................................ ........................................................................................................................................... [2] (d) A student thinks that the cooling rate is directly proportional to the percentage of the surface area uncovered. He wants to draw a graph of cooling rate against the percentage of uncovered area to investigate this. Describe how his graph line will show whether the cooling rate and the percentage of surface area uncovered are directly proportional. ................................................................................................................................................... ...............................................................................................................................................[2] (e) Students in other countries are carrying out the same experiment. Suggest a factor that they should keep the same if they are to obtain similar readings. ................................................................................................................................................... ...............................................................................................................................................[1] [Total: 11]
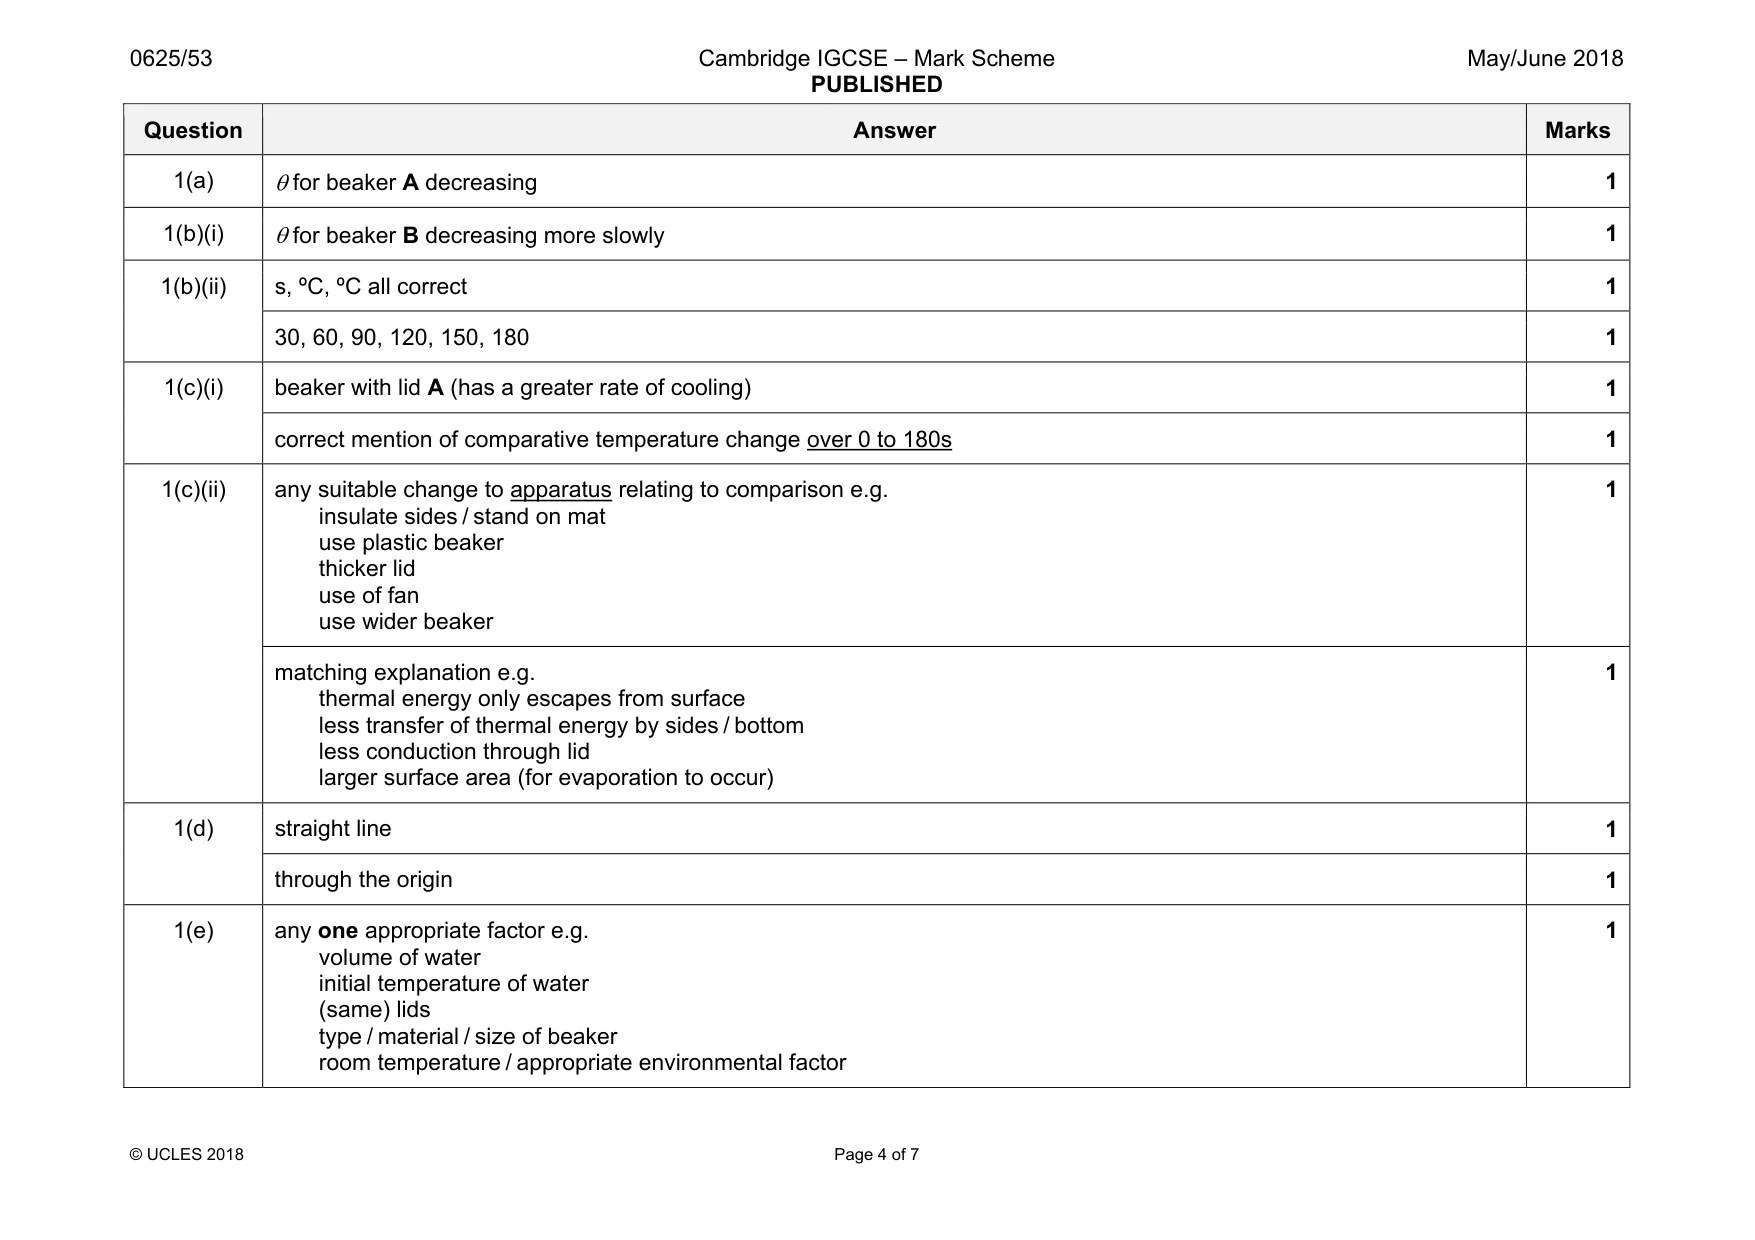
Mark scheme: 1(a) 1 1(b)(i) θ for beaker B decreasing more slowly 1 1(b)(ii) s, ºC, ºC all correct 1 30, 60, 90, 120, 150, 180 1 1(c)(i) beaker with lid A (has a greater rate of cooling) 1 correct mention of comparative temperature change over 0 to 180s 1 1(c)(ii) any suitable change to apparatus relating to comparison e.g. insulate sides / stand on mat use plastic beaker thicker lid use of fan use wider beaker 1 matching explanation e.g. thermal energy only escapes from surface less transfer of thermal energy by sides / bottom less conduction through lid larger surface area (for evaporation to occur) 1 1(d) straight line 1 through the origin 1 1(e) any one appropriate factor e.g. volume of water initial temperature of water (same) lids type / material / size of beaker room temperature / appropriate environmental factor 1
Q2 · In this experiment, you will investigate a circuit containing resistors
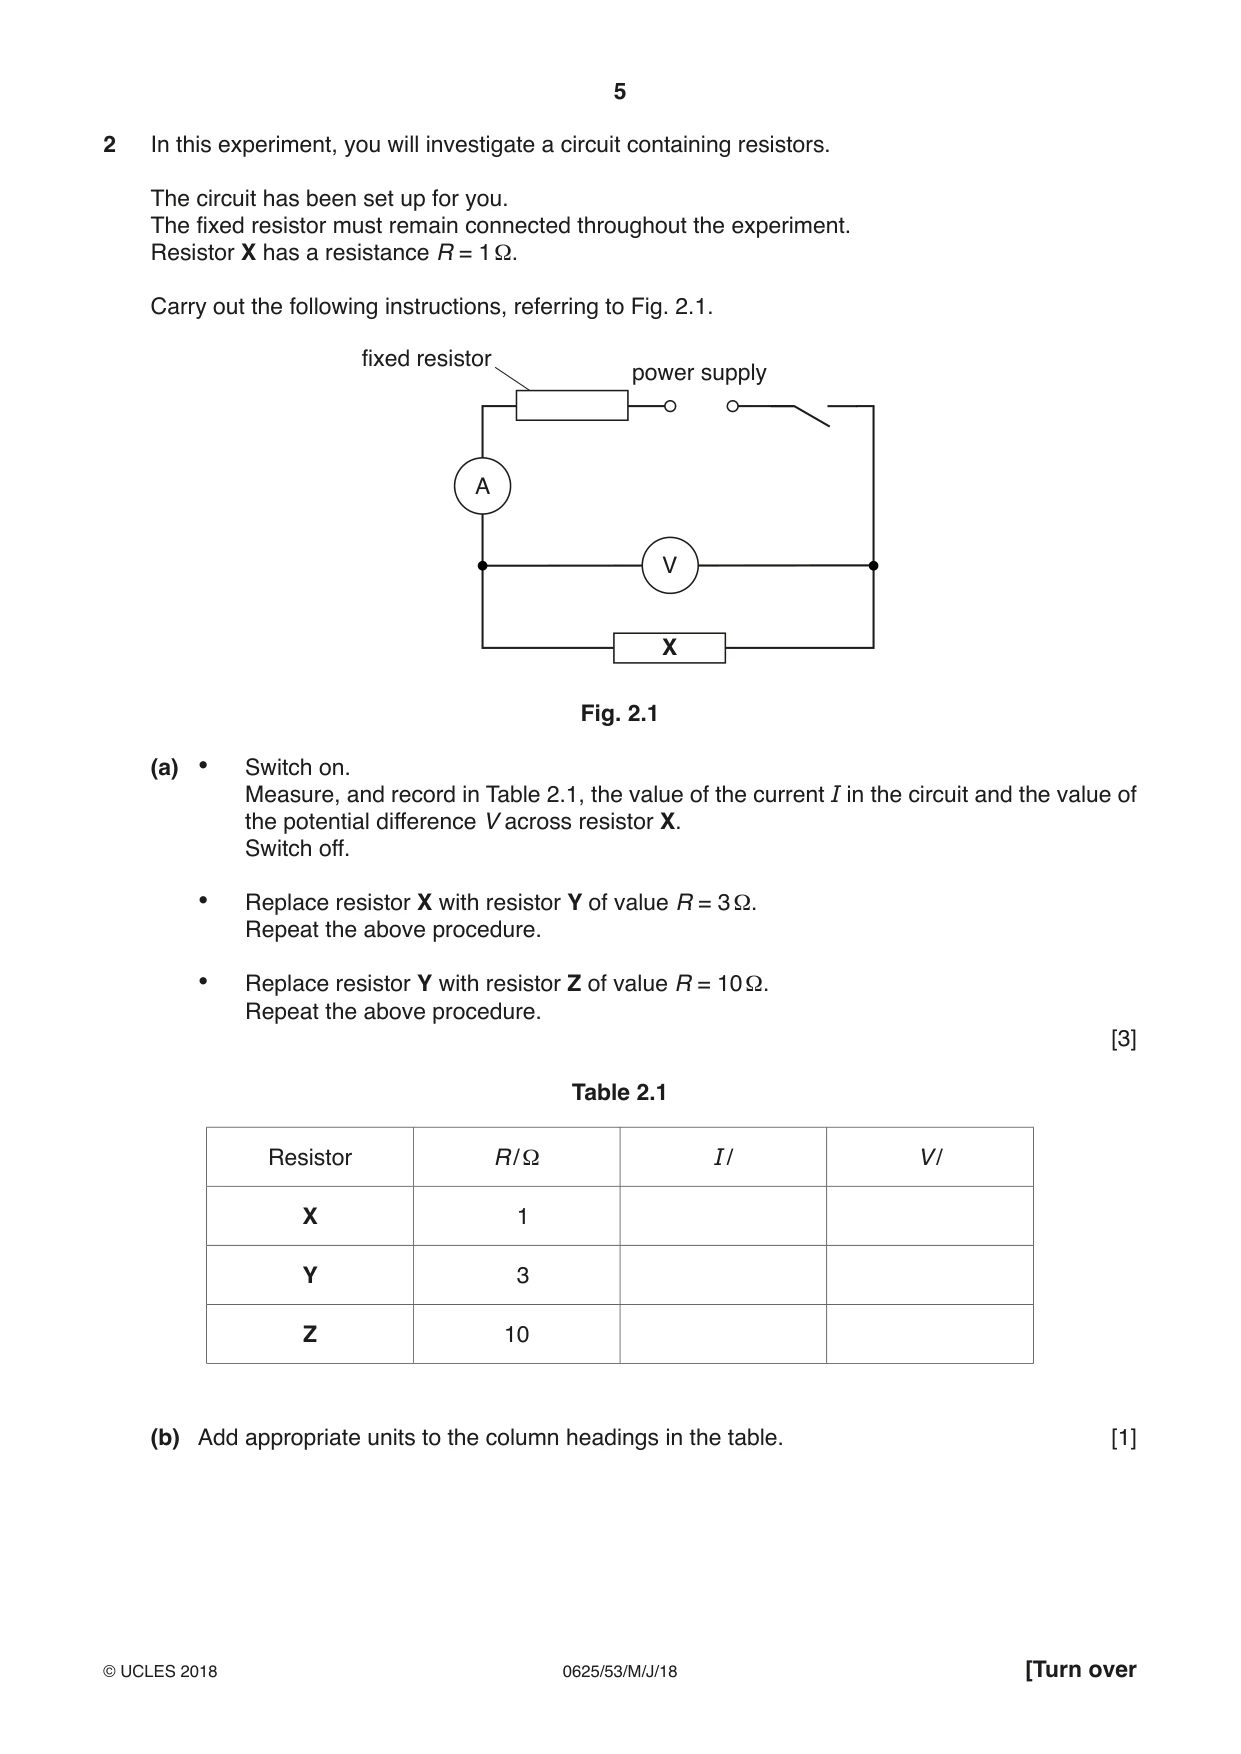
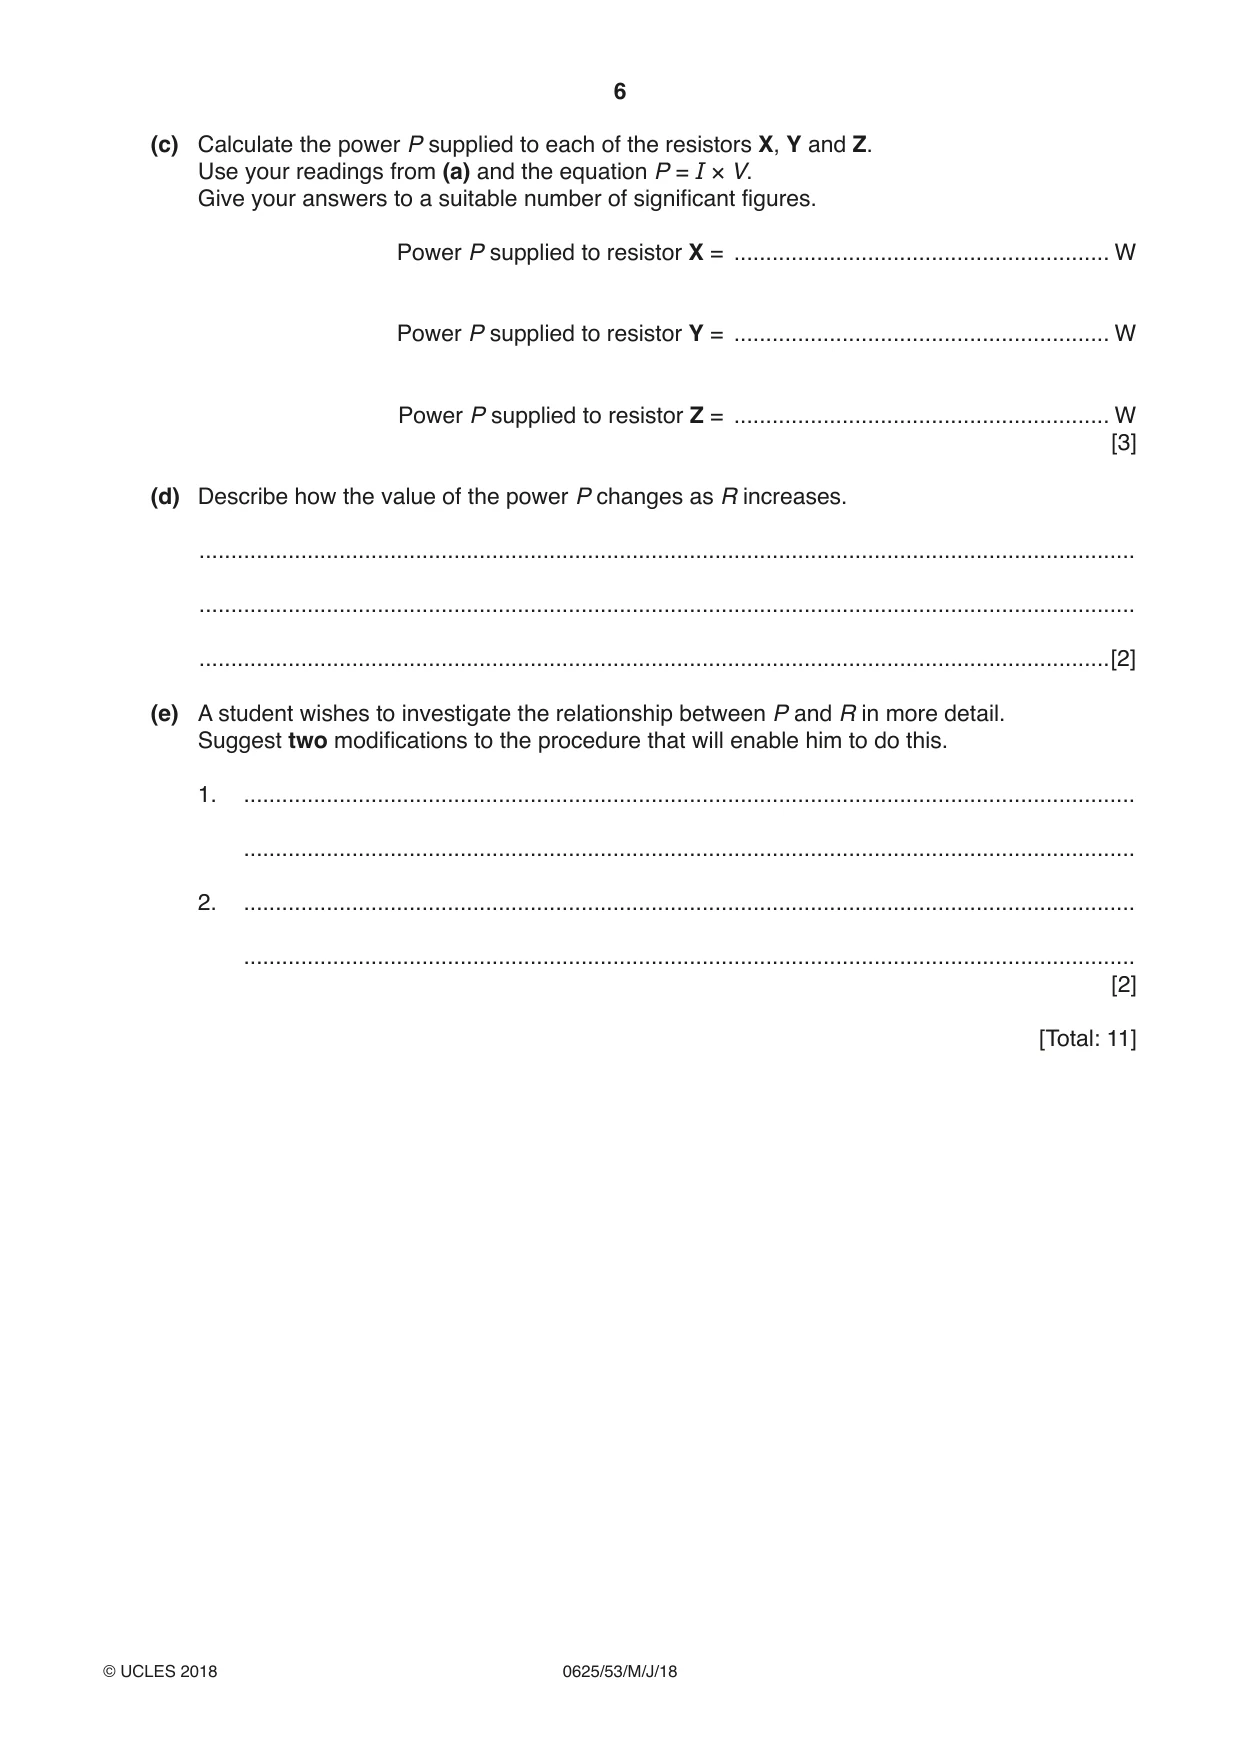
2 In this experiment, you will investigate a circuit containing resistors. The circuit has been set up for you. The fixed resistor must remain connected throughout the experiment. Resistor X has a resistance R = 1 Ω. Carry out the following instructions, referring to Fig. 2.1. fixed resistor power supply A V X Fig. 2.1 (a) • Switch on. Measure, and record in Table 2.1, the value of the current I in the circuit and the value of the potential difference V across resistor X. Switch off. • Replace resistor X with resistor Y of value R = 3 Ω. Repeat the above procedure. • Replace resistor Y with resistor Z of value R = 10 Ω. Repeat the above procedure. [3] Table 2.1 Resistor R / Ω I / V / X 1 Y 3 Z 10 (b) Add appropriate units to the column headings in the table. [1] (c) Calculate the power P supplied to each of the resistors X, Y and Z. Use your readings from (a) and the equation P = I × V. Give your answers to a suitable number of significant figures. Power P supplied to resistor X = ........................................................... W Power P supplied to resistor Y = ........................................................... W Power P supplied to resistor Z = ........................................................... W [3] (d) Describe how the value of the power P changes as R increases. ................................................................................................................................................... ................................................................................................................................................... ...............................................................................................................................................[2] (e) A student wishes to investigate the relationship between P and R in more detail. Suggest two modifications to the procedure that will enable him to do this. 1. ............................................................................................................................................ ............................................................................................................................................ 2. ............................................................................................................................................ ............................................................................................................................................ [2] [Total: 11]
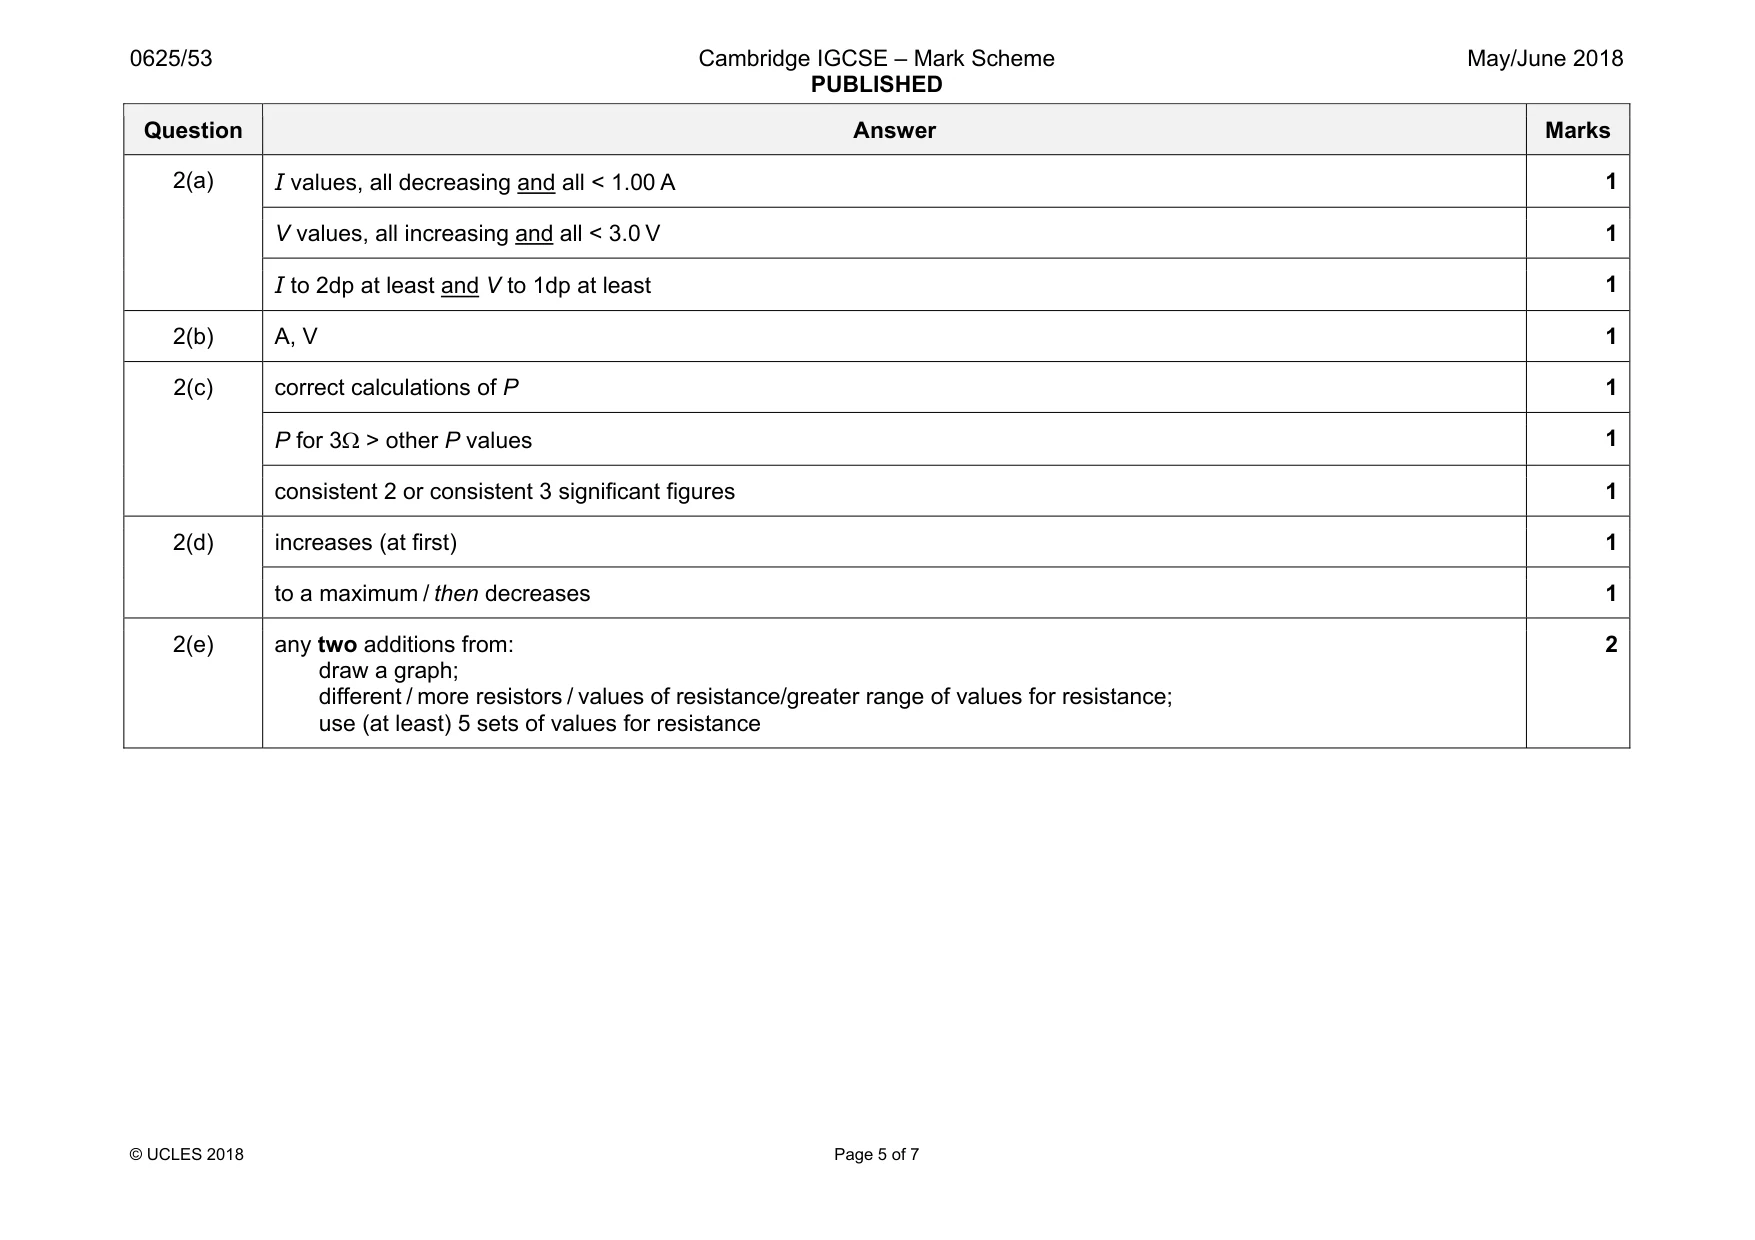
Mark scheme: 2(a) 1 V values, all increasing and all < 3.0 V 1 I to 2dp at least and V to 1dp at least 1 2(b) A, V 1 2(c) correct calculations of P 1 P for 3Ω > other P values 1 consistent 2 or consistent 3 significant figures 1 2(d) increases (at first) 1 to a maximum / then decreases 1 2(e) any two additions from: draw a graph; different / more resistors / values of resistance/greater range of values for resistance; use (at least) 5 sets of values for resistance 2
Q3 · In this experiment, you will investigate the image produced by a converging lens
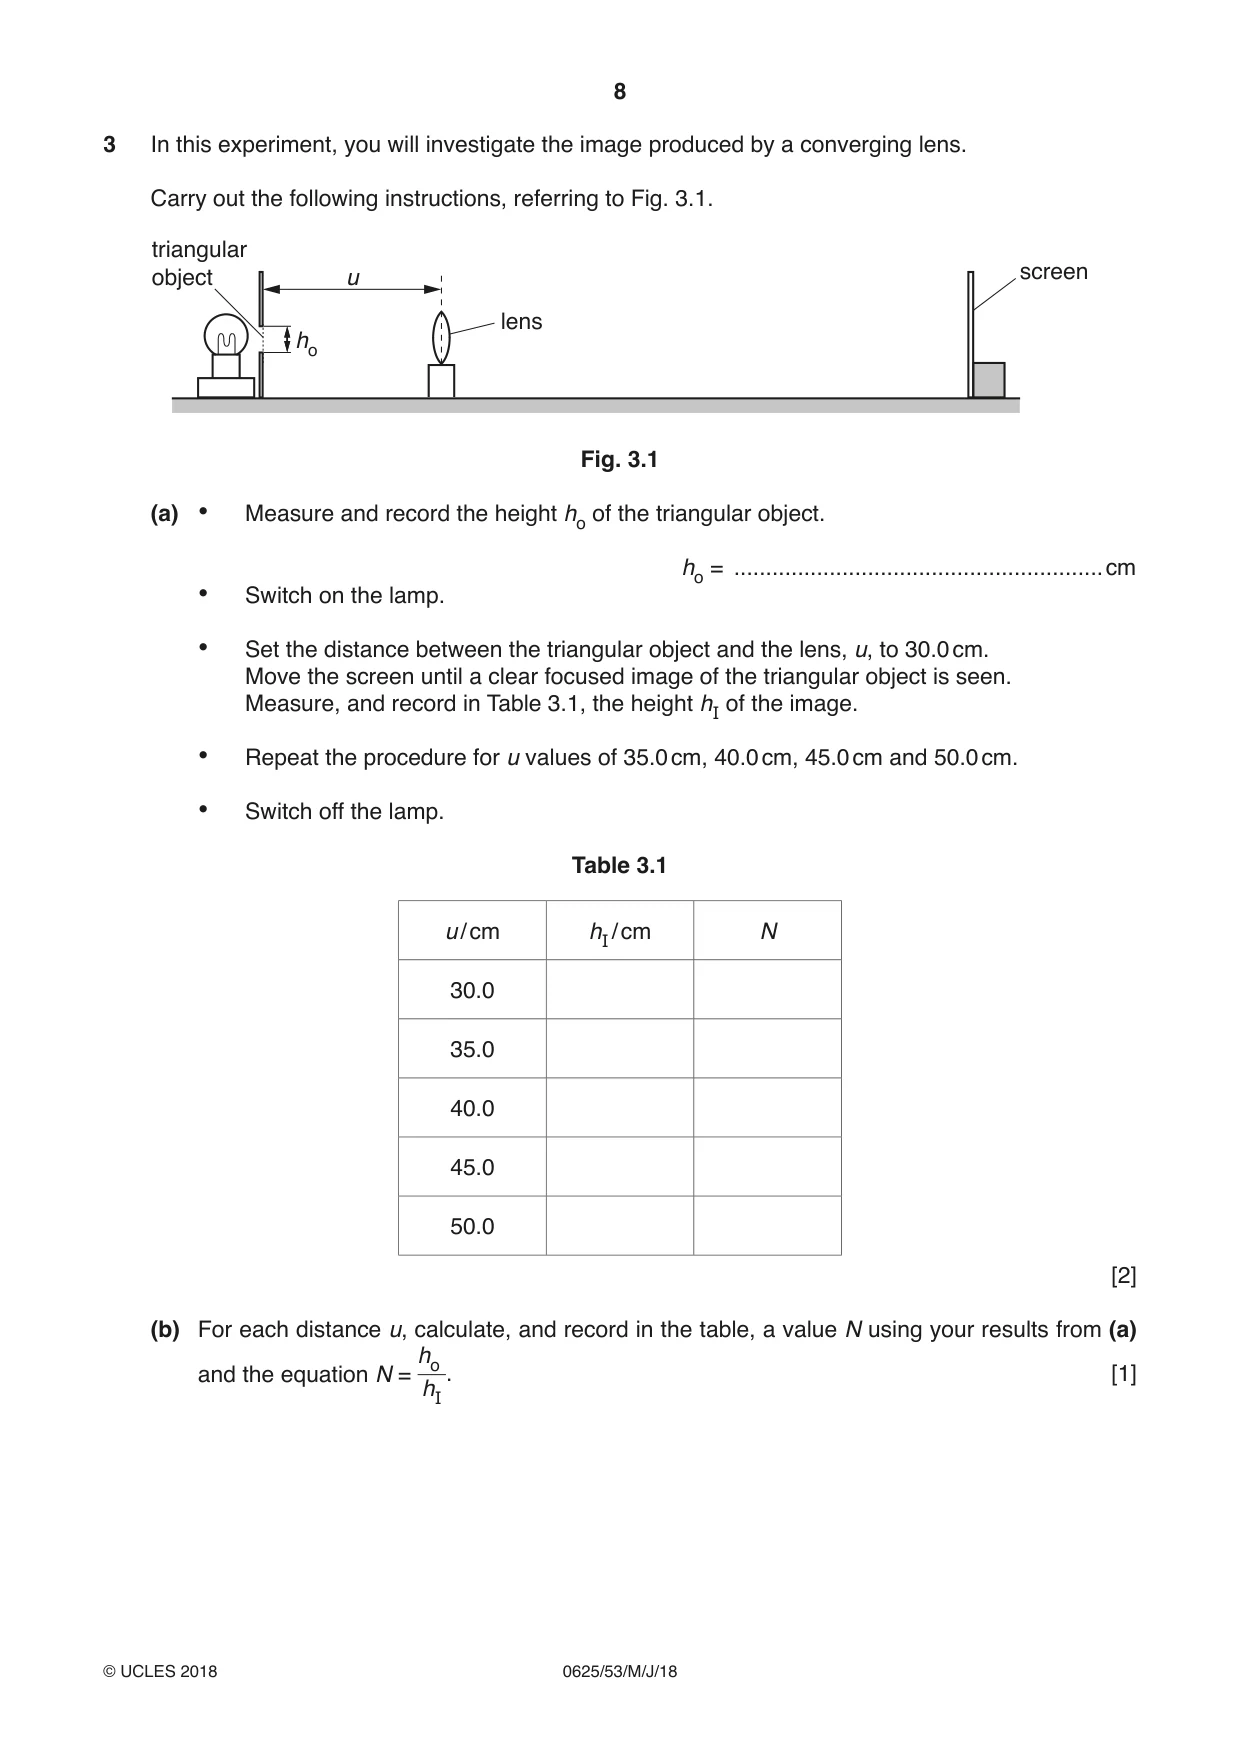
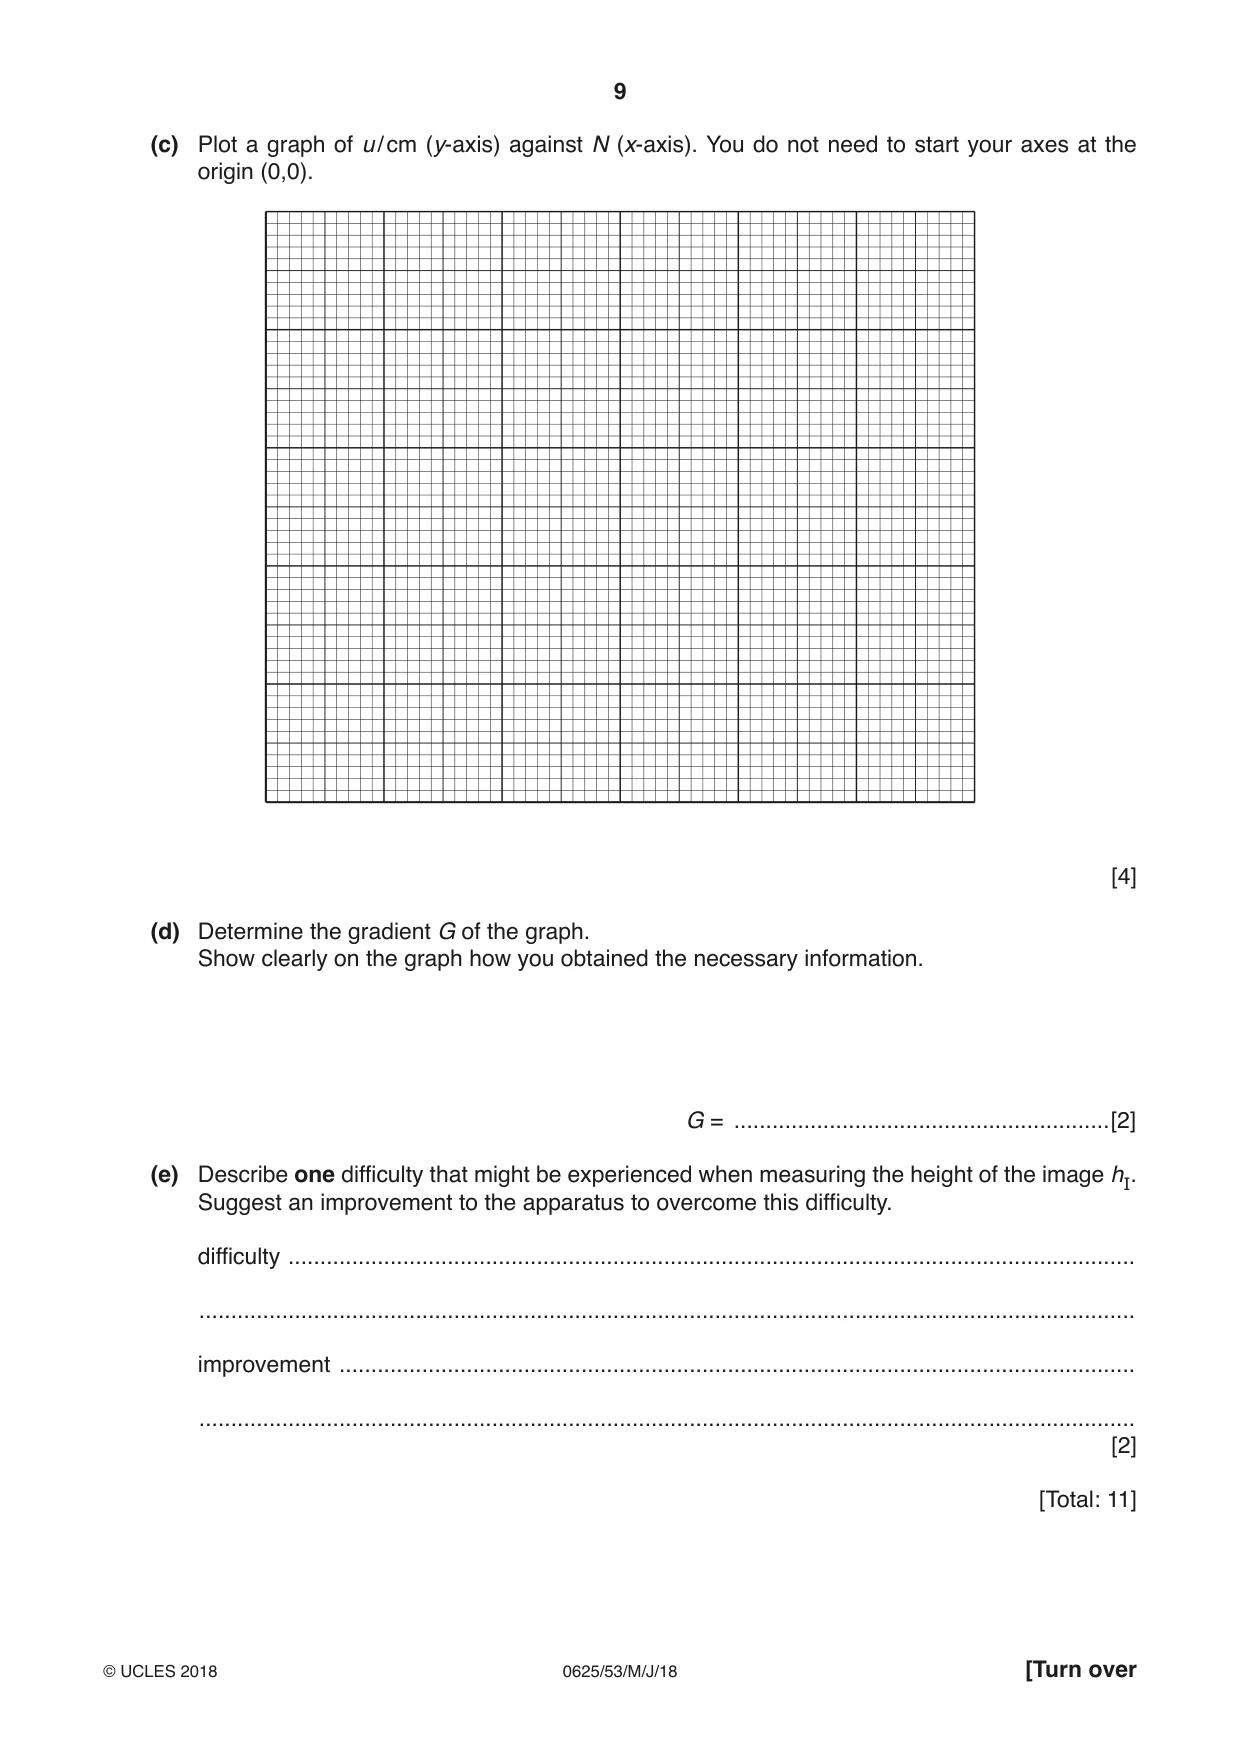
3 In this experiment, you will investigate the image produced by a converging lens. Carry out the following instructions, referring to Fig. 3.1. triangular object u screen lens ho Fig. 3.1 (a) • Measure and record the height ho of the triangular object. ho = ..........................................................cm • Switch on the lamp. • Set the distance between the triangular object and the lens, u, to 30.0 cm. Move the screen until a clear focused image of the triangular object is seen. Measure, and record in Table 3.1, the height hI of the image. • Repeat the procedure for u values of 35.0 cm, 40.0 cm, 45.0 cm and 50.0 cm. • Switch off the lamp. Table 3.1 u / cm hI / cm N 30.0 35.0 40.0 45.0 50.0 [2] (b) For each distance u, calculate, and record in the table, a value N using your results from (a) ho and the equation N = . [1] hI (c) Plot a graph of u / cm (y-axis) against N (x-axis). You do not need to start your axes at the origin (0,0). [4] (d) Determine the gradient G of the graph. Show clearly on the graph how you obtained the necessary information. G = ...........................................................[2] (e) Describe one difficulty that might be experienced when measuring the height of the image hI. Suggest an improvement to the apparatus to overcome this difficulty. difficulty ..................................................................................................................................... ................................................................................................................................................... improvement ............................................................................................................................. ................................................................................................................................................... [2] [Total: 11]
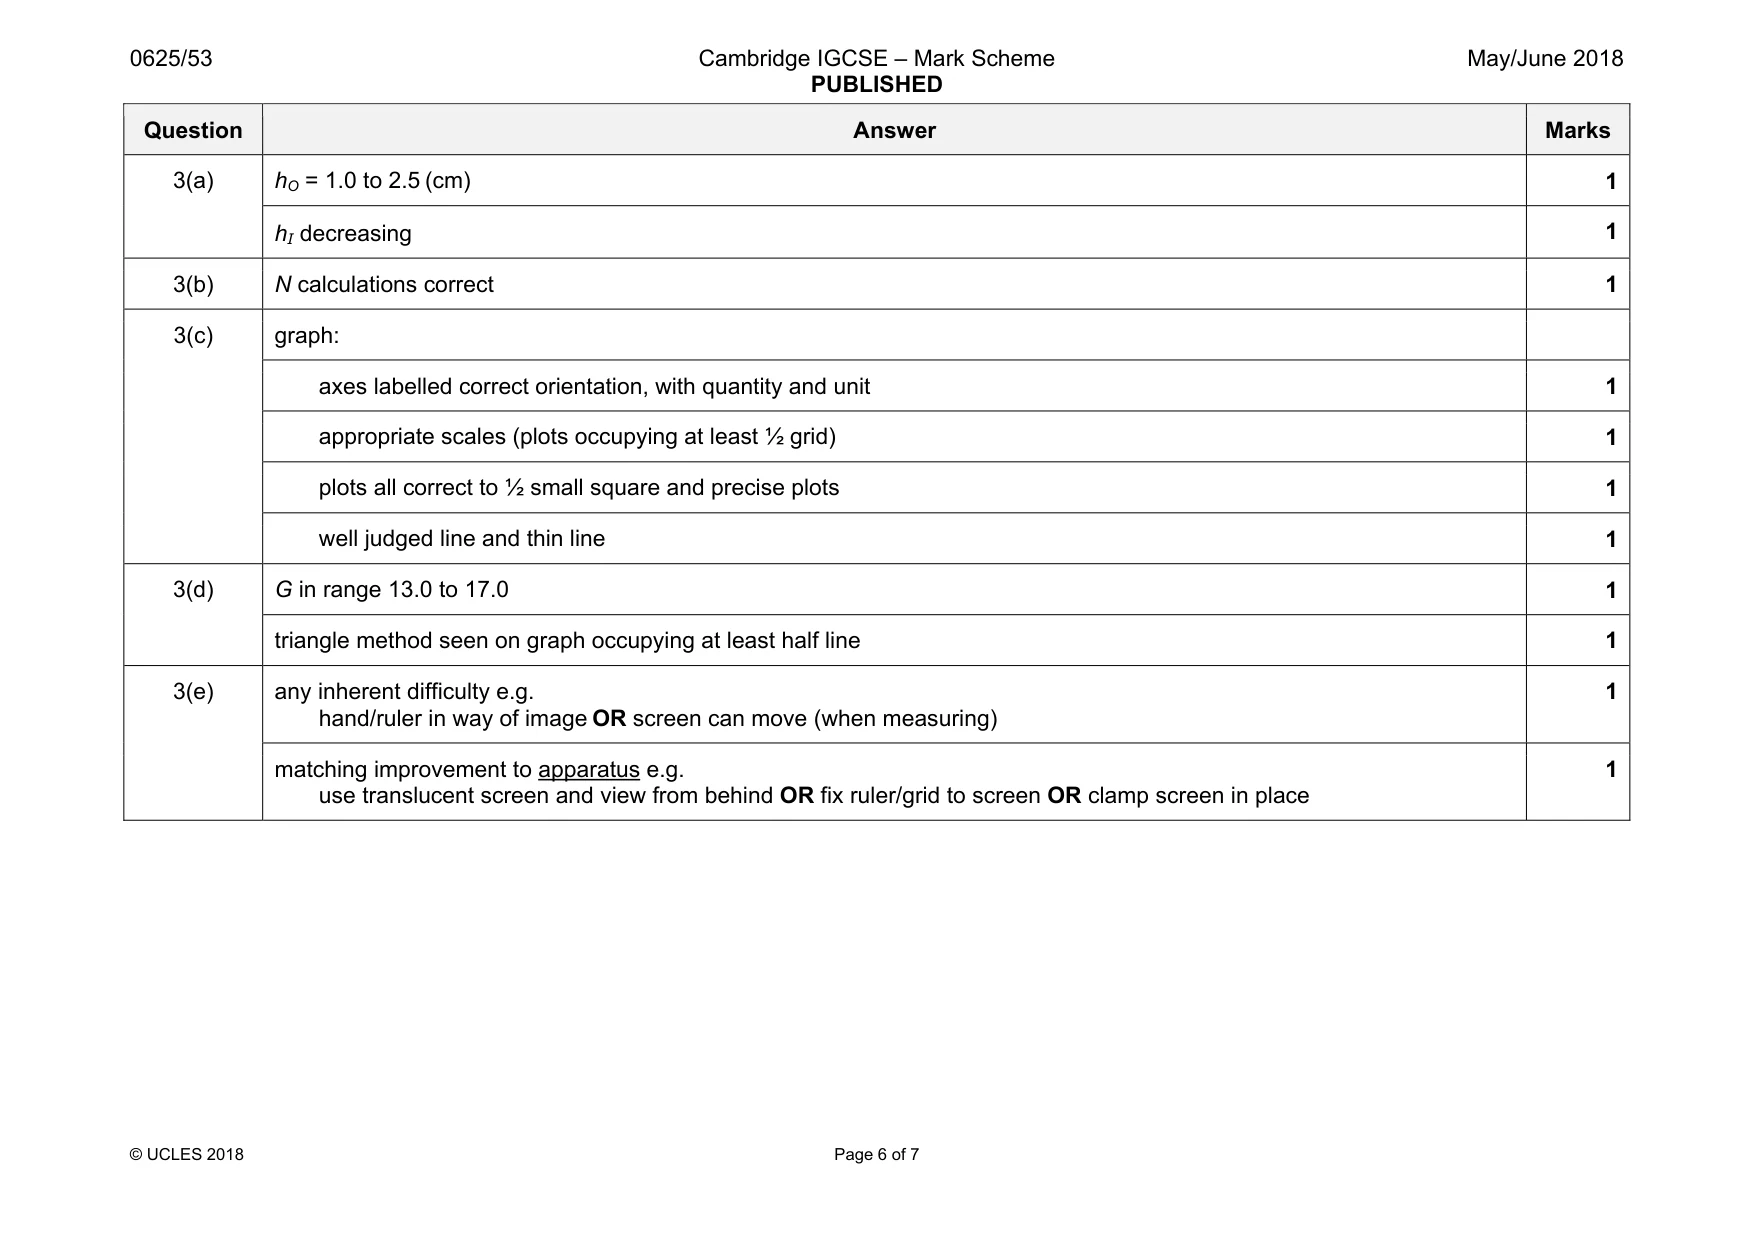
Mark scheme: 3(a) hO = 1.0 to 2.5 (cm) 1 hI decreasing 1 3(b) N calculations correct 1 3(c) graph: axes labelled correct orientation, with quantity and unit 1 appropriate scales (plots occupying at least ½ grid) 1 plots all correct to ½ small square and precise plots 1 well judged line and thin line 1 3(d) G in range 13.0 to 17.0 1 triangle method seen on graph occupying at least half line 1 3(e) any inherent difficulty e.g. hand/ruler in way of image OR screen can move (when measuring) 1 matching improvement to apparatus e.g. use translucent screen and view from behind OR fix ruler/grid to screen OR clamp screen in place 1
Q4 · A student is investigating the force needed to just slide a block across a surface
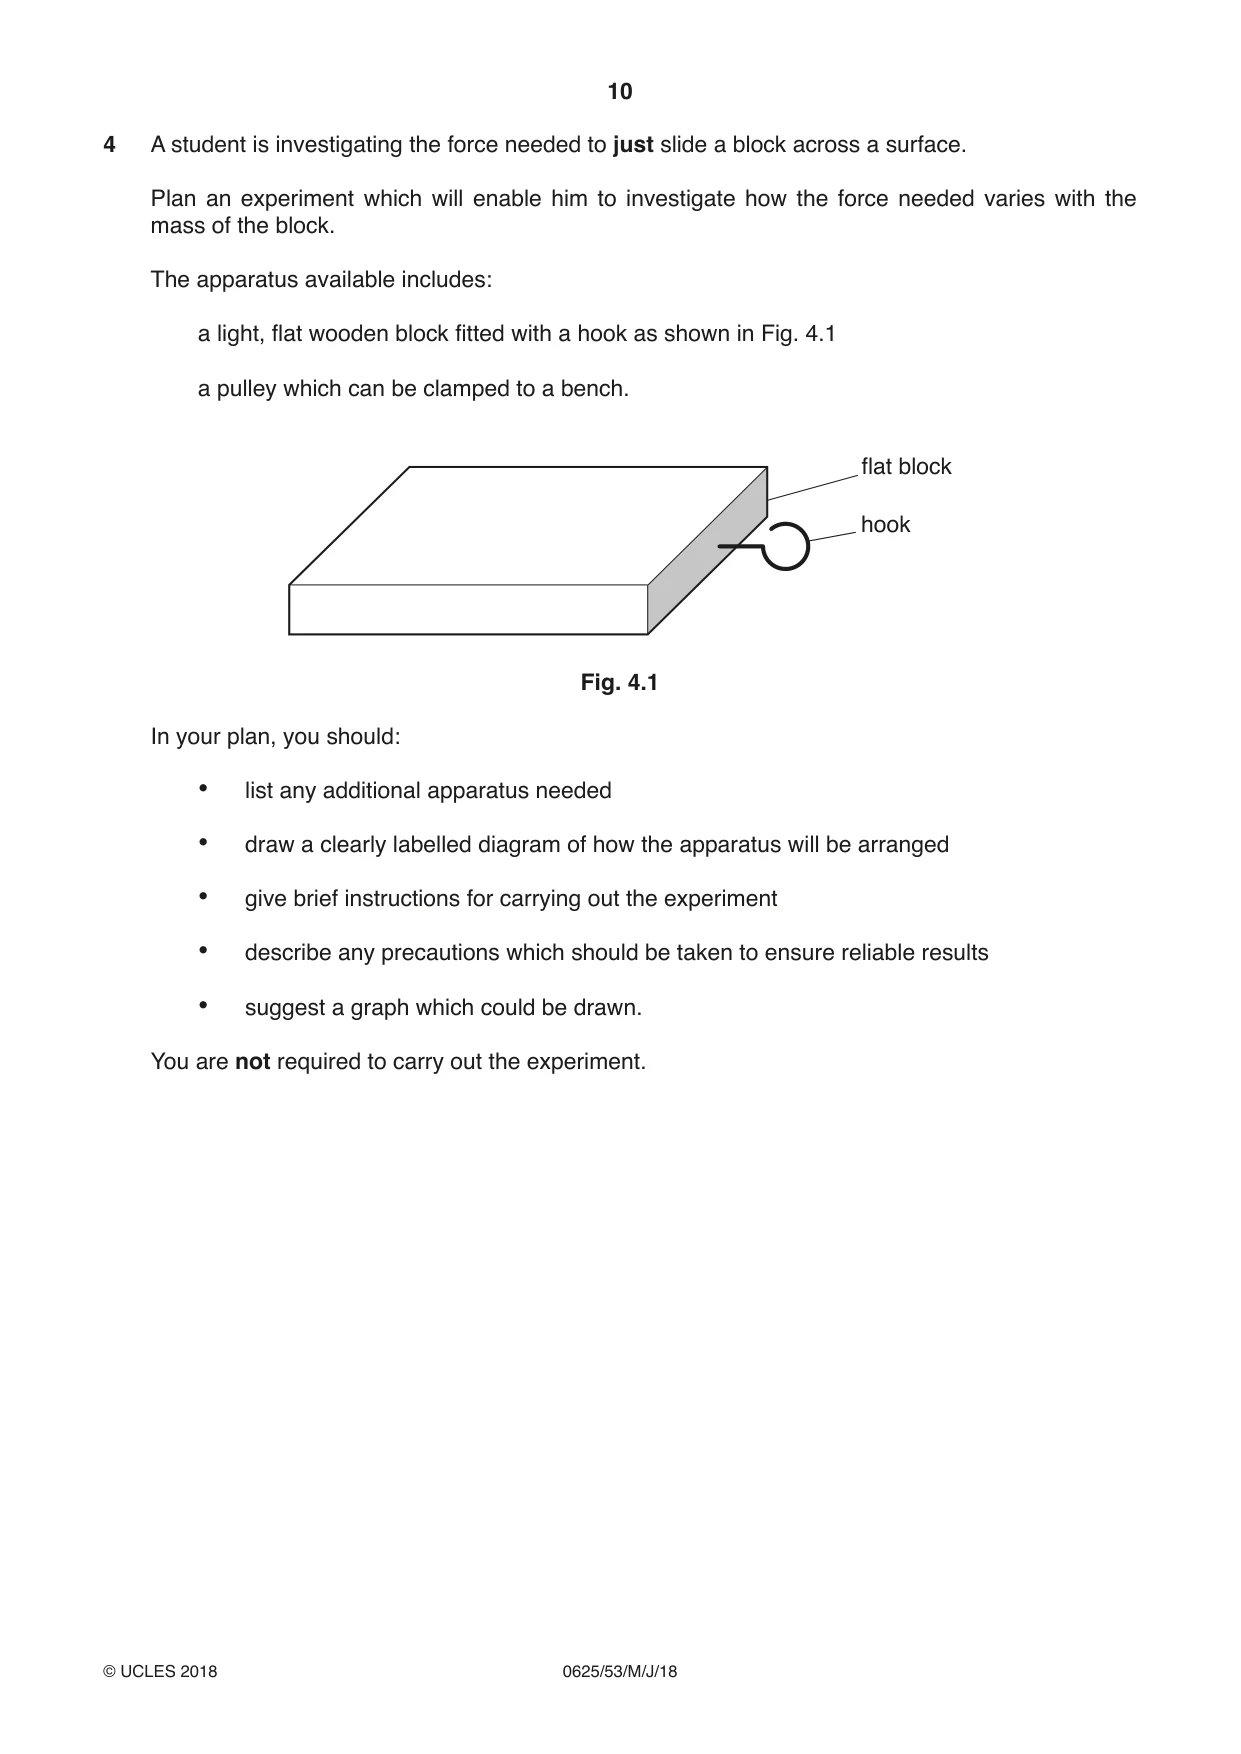
4 A student is investigating the force needed to just slide a block across a surface. Plan an experiment which will enable him to investigate how the force needed varies with the mass of the block. The apparatus available includes: a light, flat wooden block fitted with a hook as shown in Fig. 4.1 a pulley which can be clamped to a bench. flat block hook Fig. 4.1 In your plan, you should: • list any additional apparatus needed • draw a clearly labelled diagram of how the apparatus will be arranged • give brief instructions for carrying out the experiment • describe any precautions which should be taken to ensure reliable results • suggest a graph which could be drawn. You are not required to carry out the experiment. .......................................................................................................................................................... .......................................................................................................................................................... .......................................................................................................................................................... .......................................................................................................................................................... .......................................................................................................................................................... .......................................................................................................................................................... .......................................................................................................................................................... .......................................................................................................................................................... .......................................................................................................................................................... .......................................................................................................................................................... .......................................................................................................................................................... .......................................................................................................................................................... .......................................................................................................................................................... .......................................................................................................................................................... .......................................................................................................................................................... .......................................................................................................................................................... .......................................................................................................................................................... .......................................................................................................................................................... .......................................................................................................................................................... .......................................................................................................................................................... .......................................................................................................................................................... ......................................................................................................................................................[7] [Total: 7]
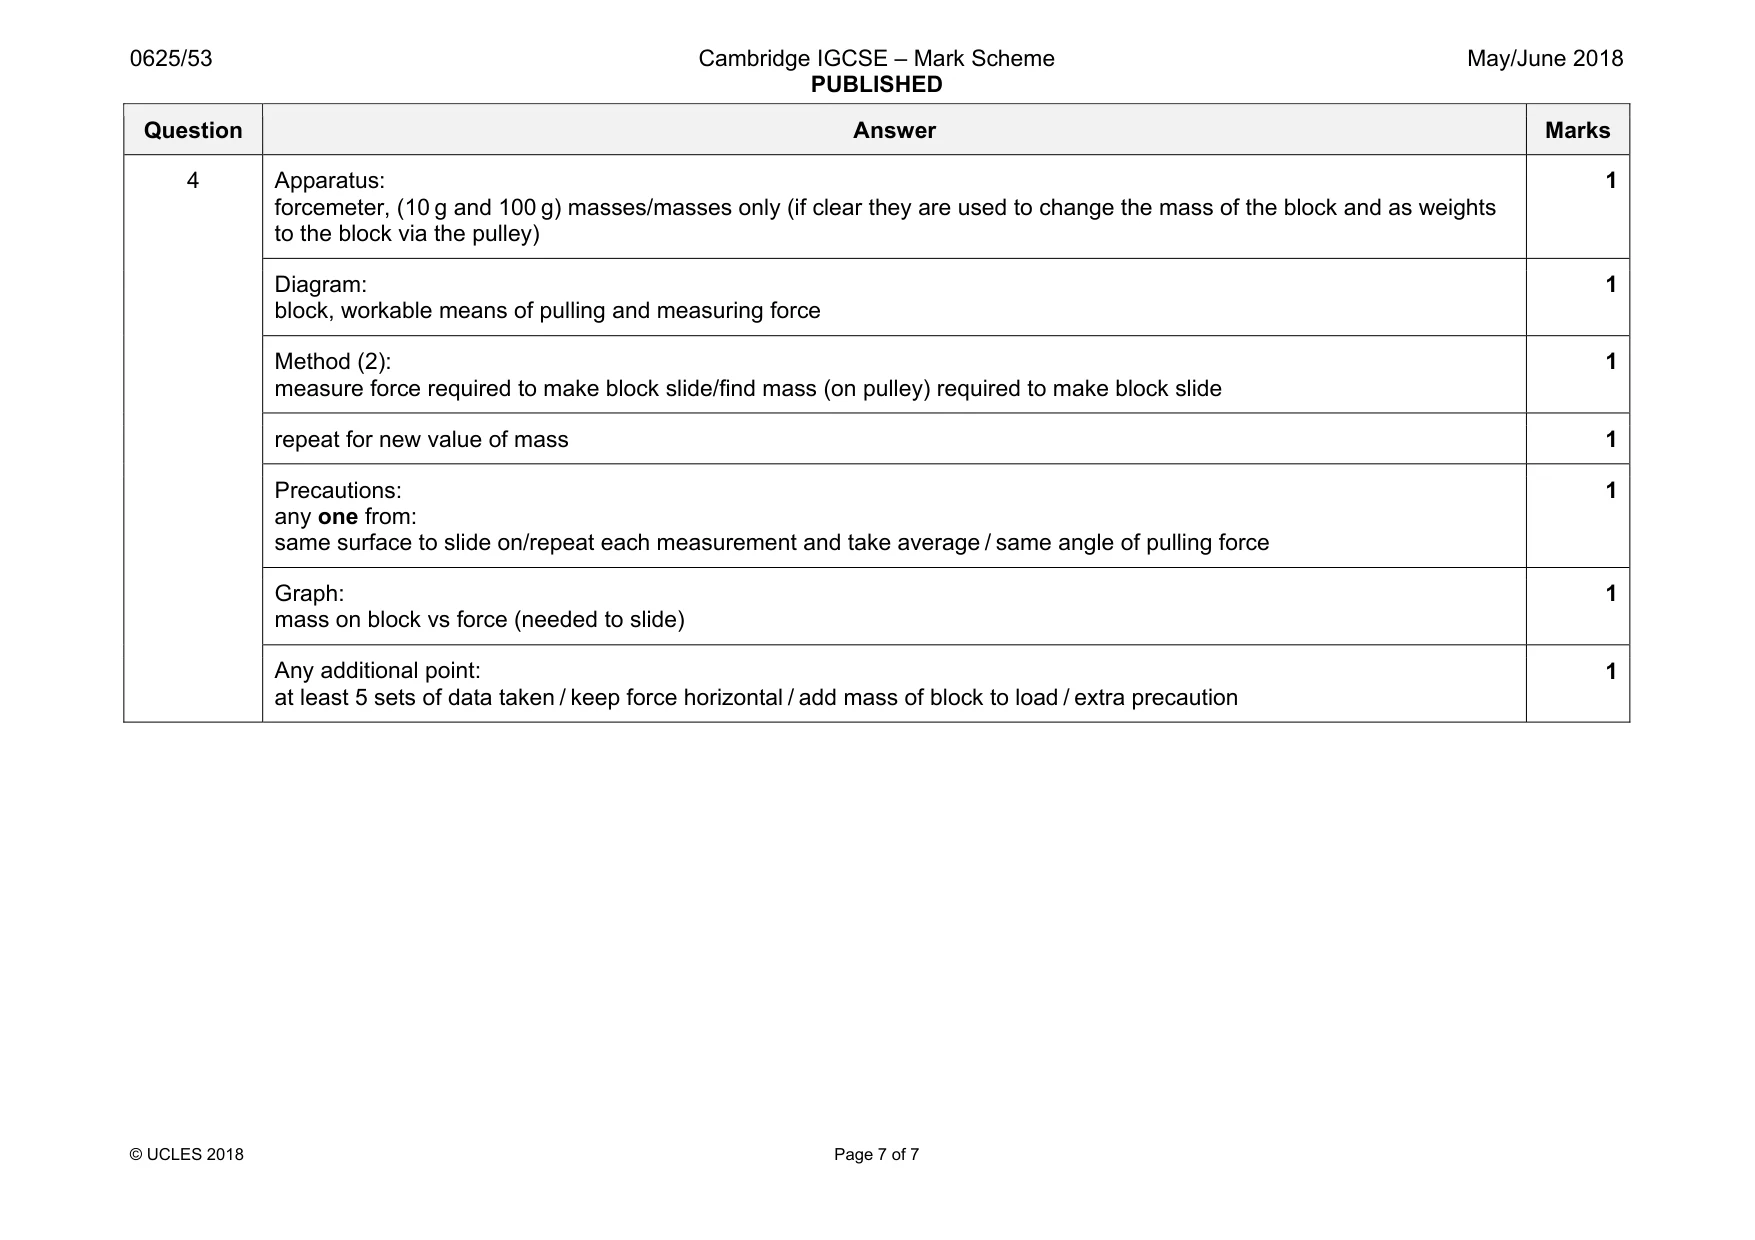
Mark scheme: 4 Apparatus: forcemeter, (10 g and 100 g) masses/masses only (if clear they are used to change the mass of the block and as weights to the block via the pulley) 1 Diagram: block, workable means of pulling and measuring force 1 Method (2): measure force required to make block slide/find mass (on pulley) required to make block slide 1 repeat for new value of mass 1 Precautions: any one from: same surface to slide on/repeat each measurement and take average / same angle of pulling force 1 Graph: mass on block vs force (needed to slide) 1 Any additional point: at least 5 sets of data taken / keep force horizontal / add mass of block to load / extra precaution 1
What was in this paper
The subtopics covered by these 4 questions, and how many questions each got. Open one in a new tab to see every Cambridge question on it.
What you needed in this session
Cambridge’s own grade thresholds for 2018 May/June, Paper 5 · Variant 3. A higher threshold means an easier paper — the bar moves with how the cohort did.