Cambridge IGCSE Physics 0625 — 2016 Oct/Nov Paper 5 · Variant 3
0625/53/O/N/16 · 4 questions · 40 marks · ≈45 min
The question paper and its mark scheme, free to read here and free to download. This is Cambridge’s own paper, exactly as it was sat.
Question paper12 pages


Mark scheme6 pages
Answers below. Sit the paper first if you are practising.
Questions as text
Q1 · In this experiment, you will investigate how the surface area of water exposed to the air…
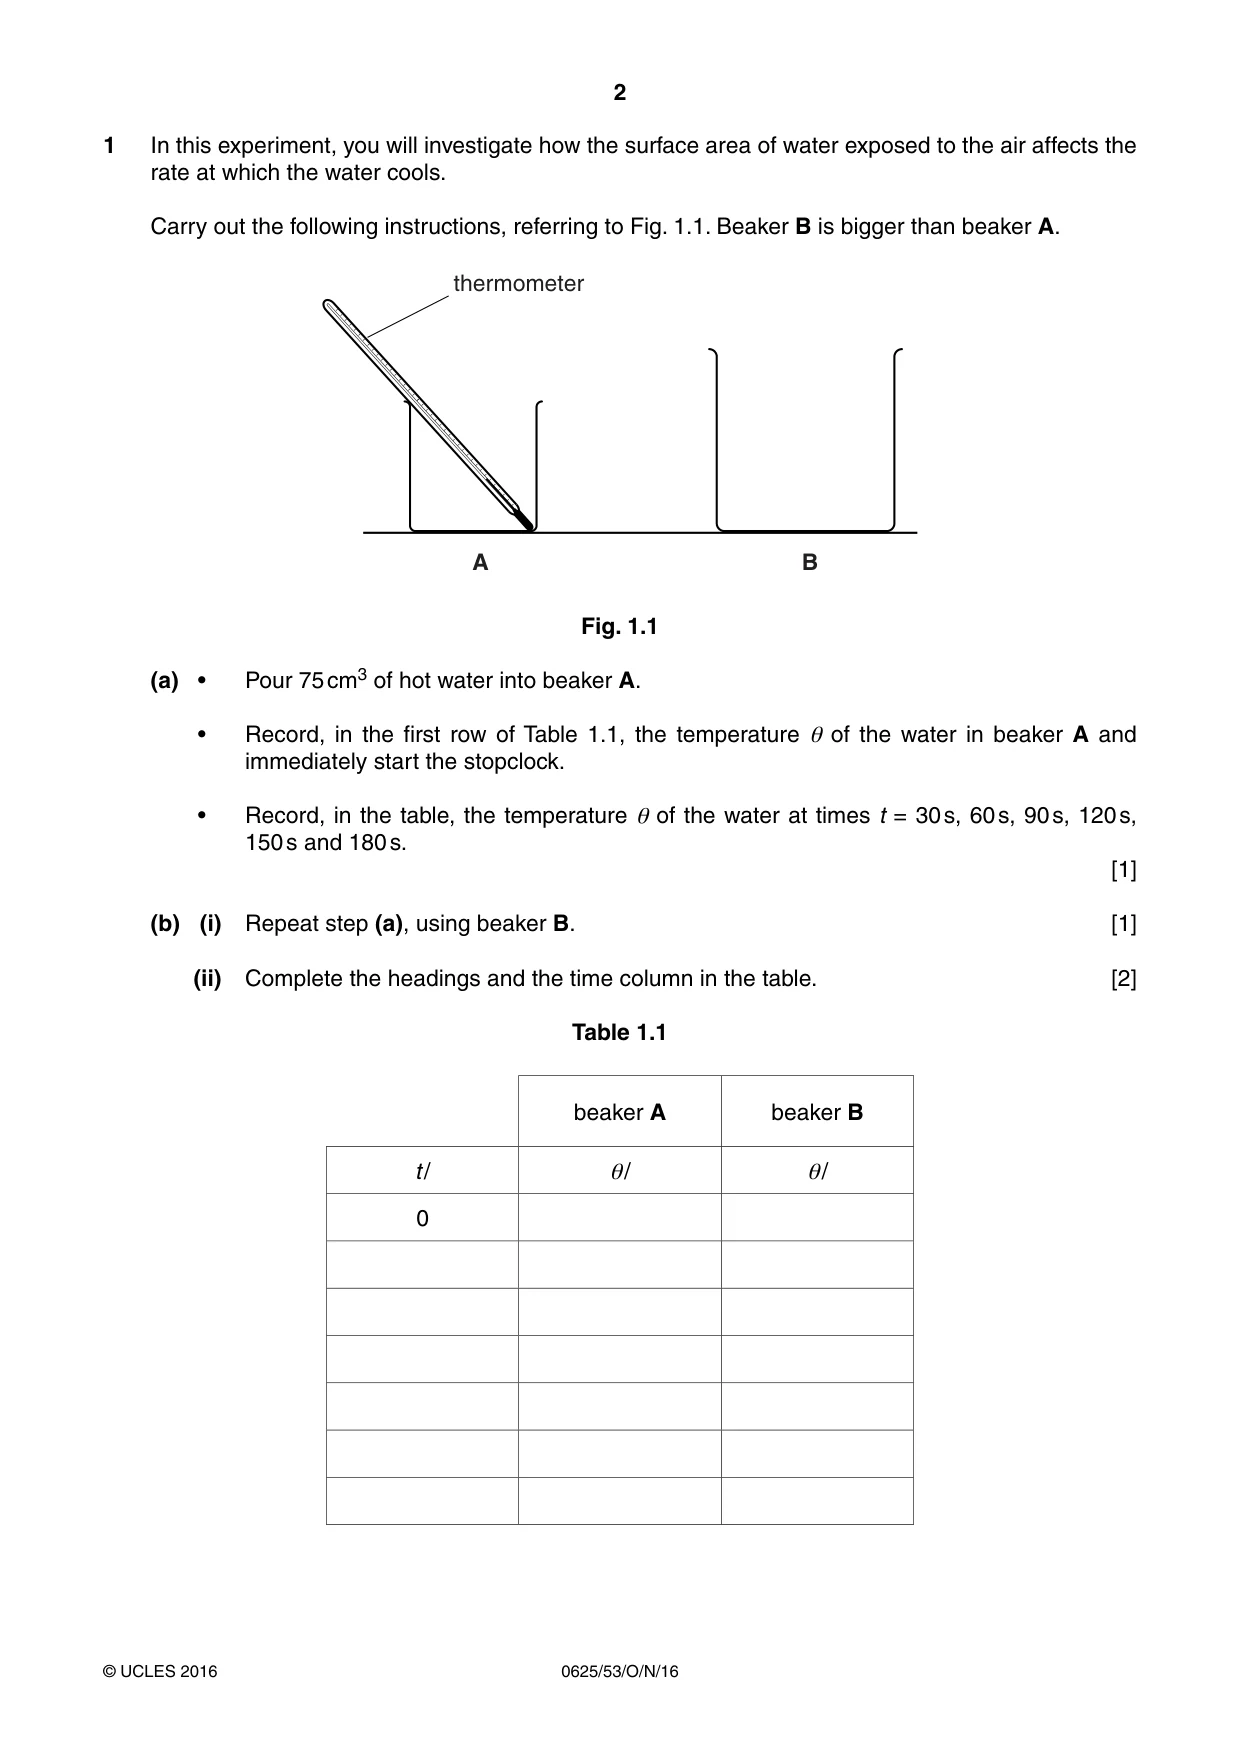
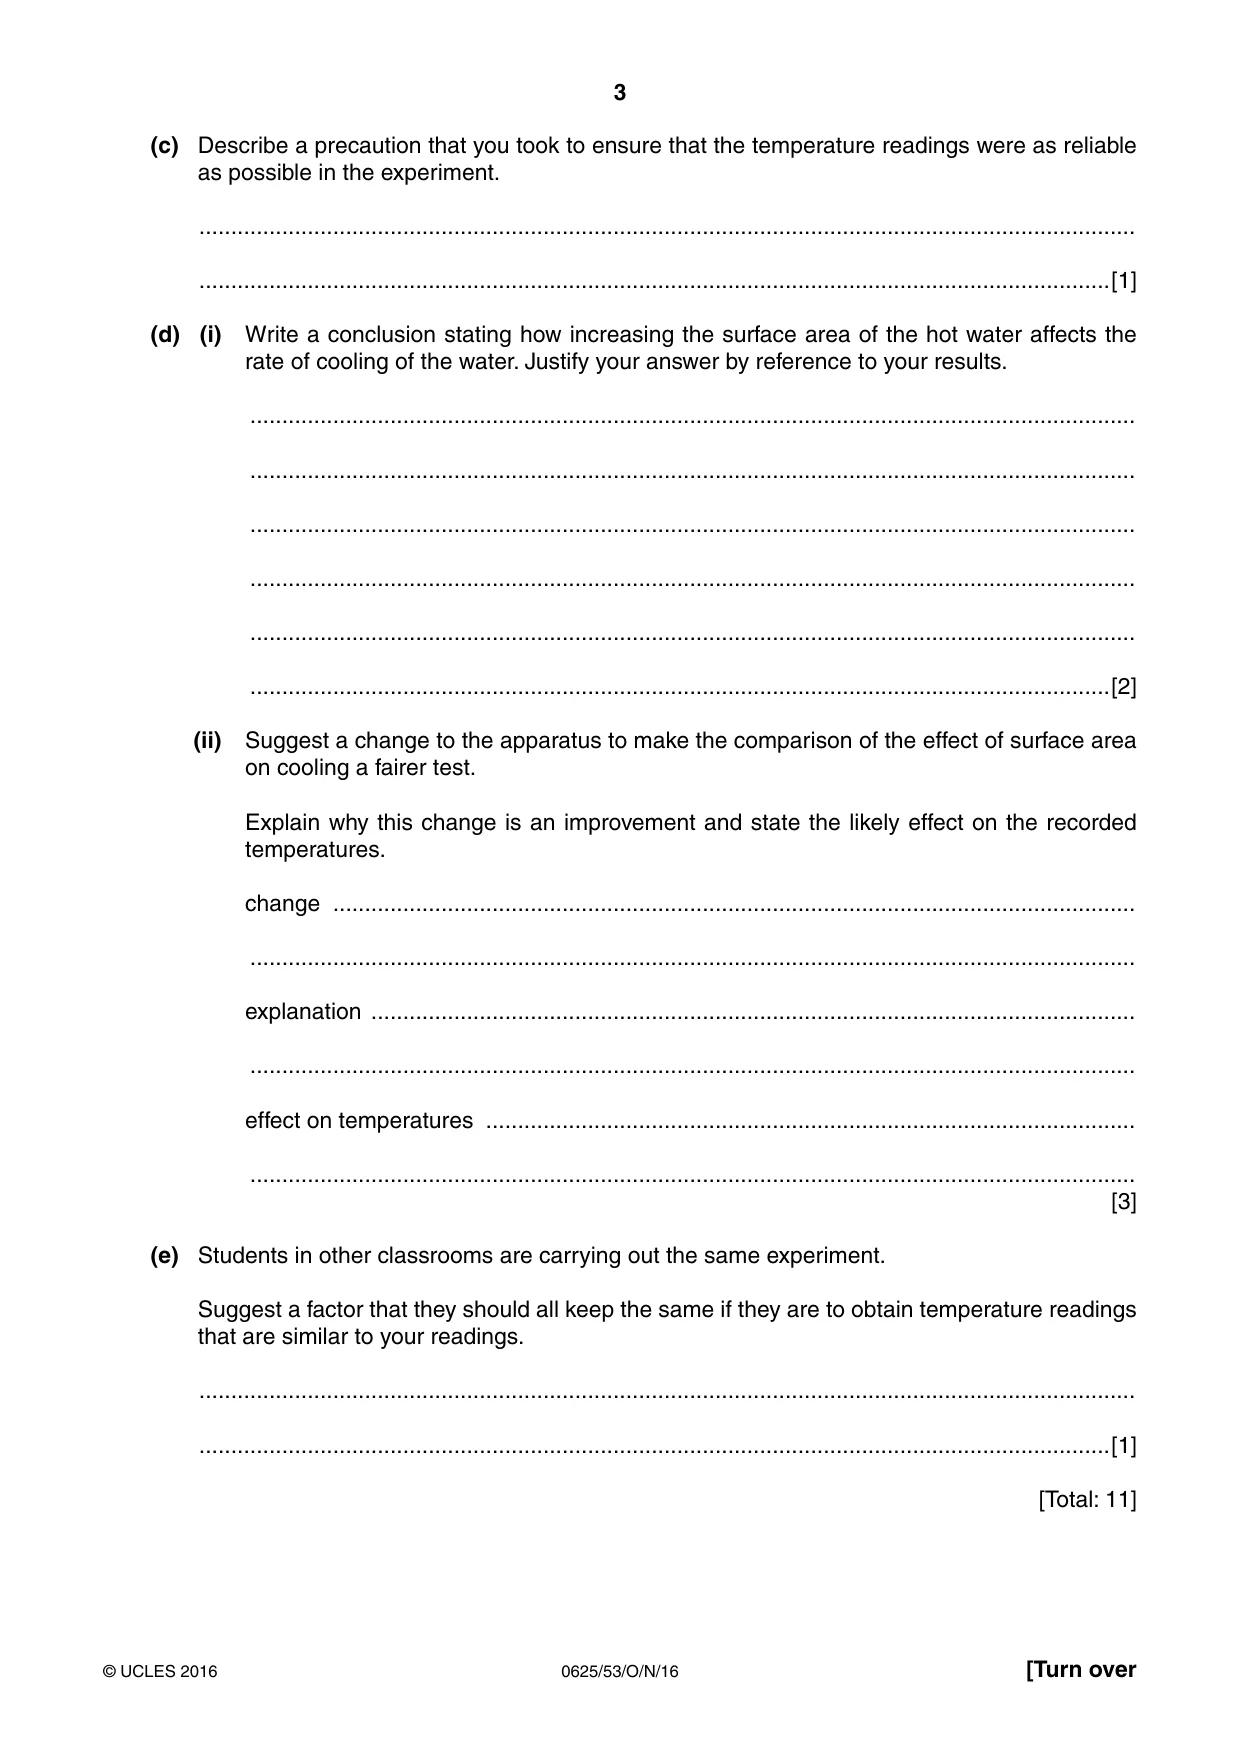
1 In this experiment, you will investigate how the surface area of water exposed to the air affects the rate at which the water cools. Carry out the following instructions, referring to Fig. 1.1. Beaker B is bigger than beaker A. thermometer A B Fig. 1.1 (a) • Pour 75 cm3 of hot water into beaker A. • Record, in the first row of Table 1.1, the temperature θ of the water in beaker A and immediately start the stopclock. • Record, in the table, the temperature θ of the water at times t = 30 s, 60 s, 90 s, 120 s, 150 s and 180 s. [1] (b) (i) Repeat step (a), using beaker B. [1] (ii) Complete the headings and the time column in the table. [2] Table 1.1 beaker A beaker B t / θ/ θ/ 0 (c) Describe a precaution that you took to ensure that the temperature readings were as reliable as possible in the experiment. ................................................................................................................................................... ...............................................................................................................................................[1] (d) (i) Write a conclusion stating how increasing the surface area of the hot water affects the rate of cooling of the water. Justify your answer by reference to your results. ........................................................................................................................................... ........................................................................................................................................... ........................................................................................................................................... ........................................................................................................................................... ........................................................................................................................................... .......................................................................................................................................[2] (ii) Suggest a change to the apparatus to make the comparison of the effect of surface area on cooling a fairer test. Explain why this change is an improvement and state the likely effect on the recorded temperatures. change .............................................................................................................................. ........................................................................................................................................... explanation ........................................................................................................................ ........................................................................................................................................... effect on temperatures ...................................................................................................... ........................................................................................................................................... [3] (e) Students in other classrooms are carrying out the same experiment. Suggest a factor that they should all keep the same if they are to obtain temperature readings that are similar to your readings. ................................................................................................................................................... ...............................................................................................................................................[1] [Total: 11]
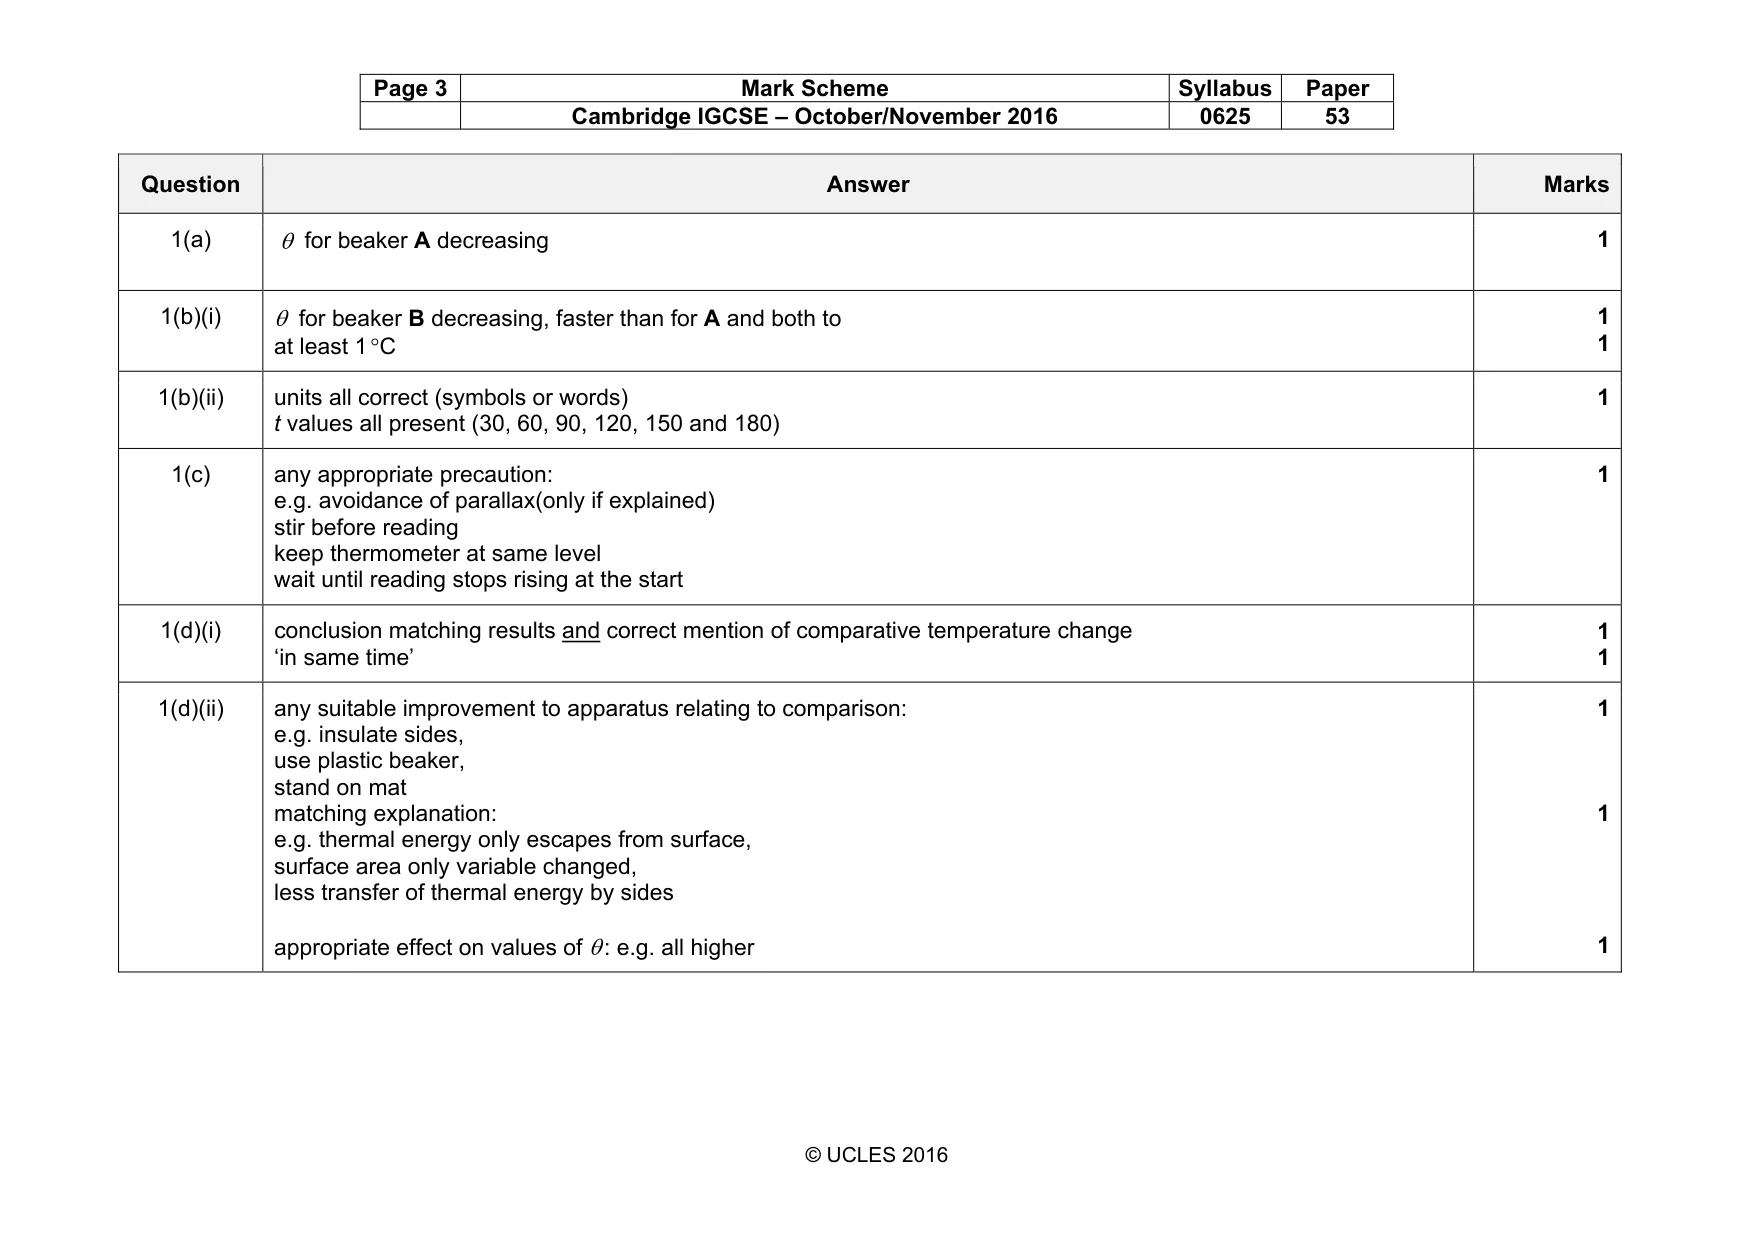
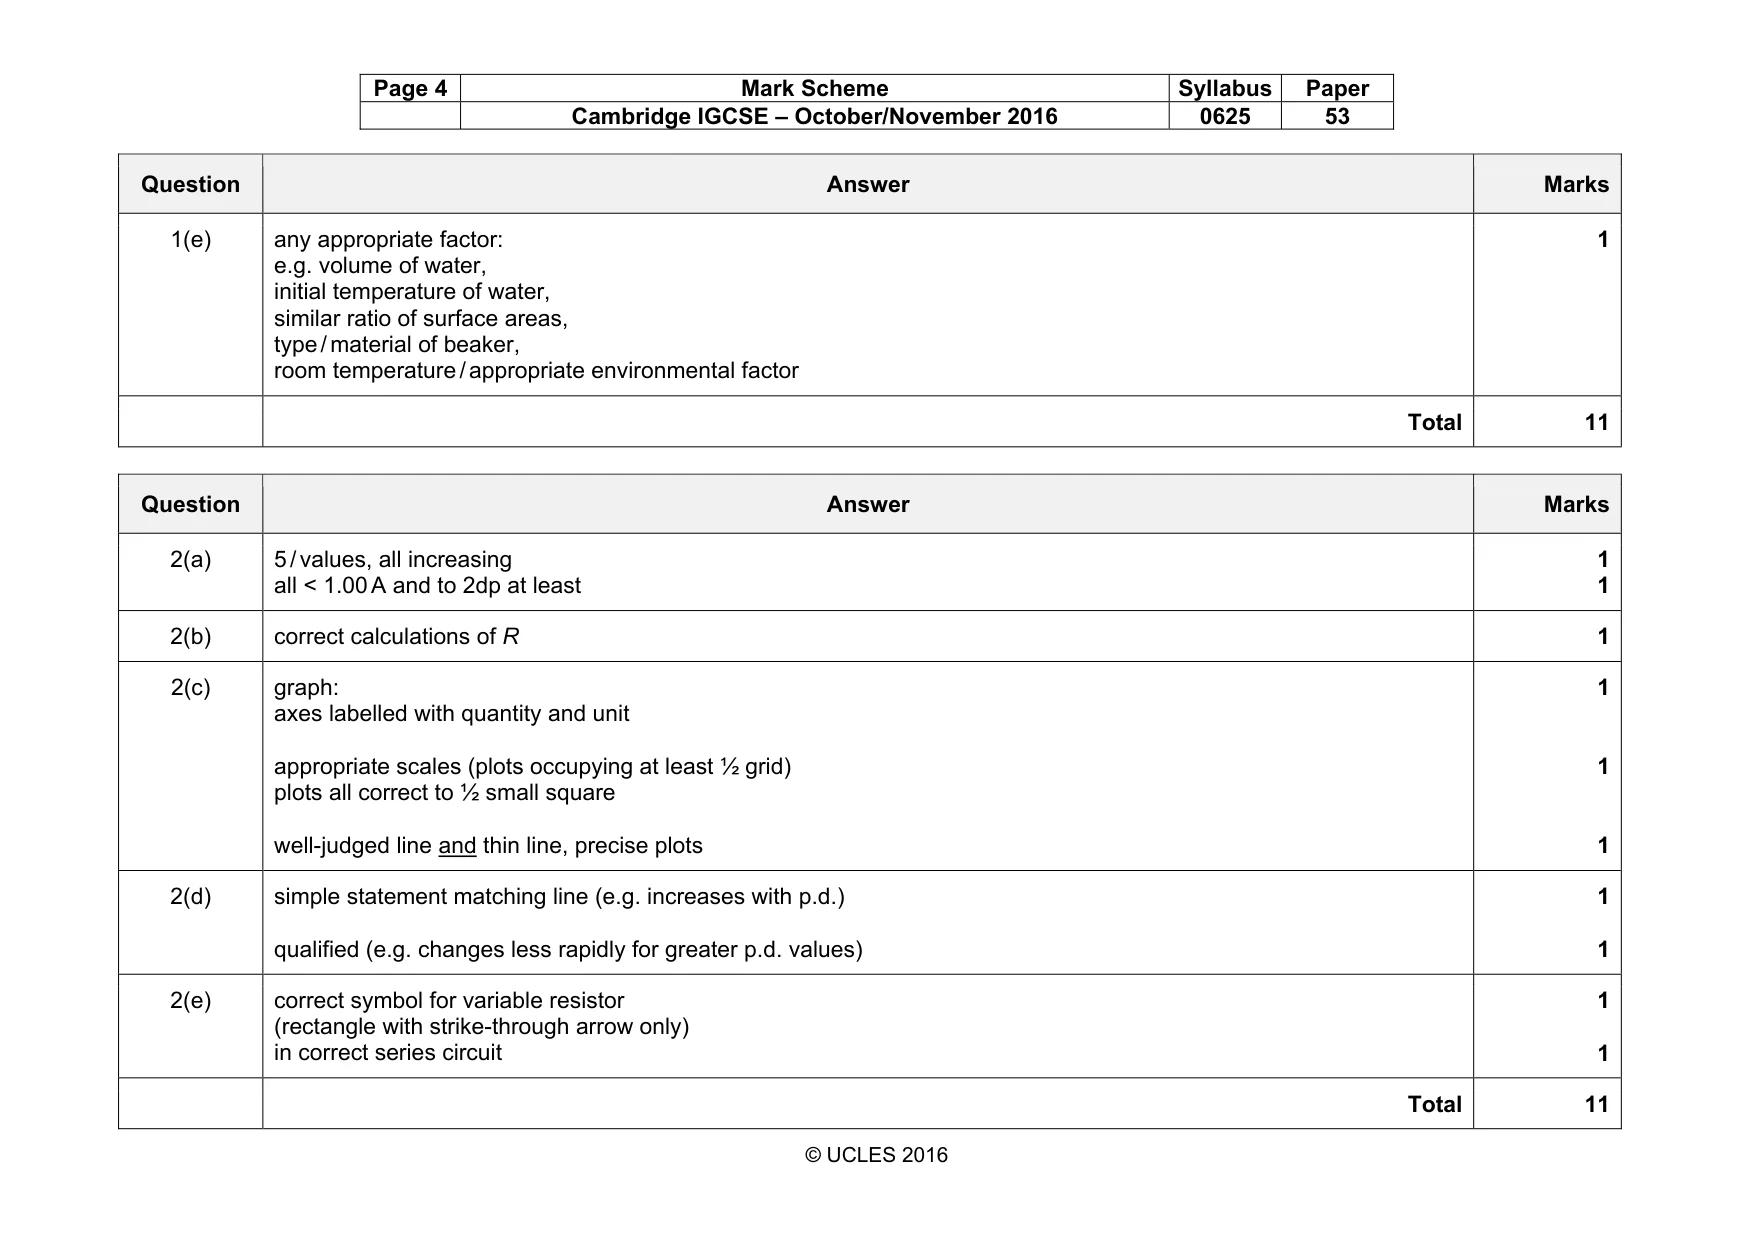
Mark scheme: 1(a) 1 1(b)(i) θ for beaker B decreasing, faster than for A and both to at least 1 °C 1 1 1(b)(ii) units all correct (symbols or words) t values all present (30, 60, 90, 120, 150 and 180) 1 1(c) any appropriate precaution: e.g. avoidance of parallax(only if explained) stir before reading keep thermometer at same level wait until reading stops rising at the start 1 1(d)(i) conclusion matching results and correct mention of comparative temperature change ‘in same time’ 1 1 1(d)(ii) any suitable improvement to apparatus relating to comparison: e.g. insulate sides, use plastic beaker, stand on mat matching explanation: e.g. thermal energy only escapes from surface, surface area only variable changed, less transfer of thermal energy by sides appropriate effect on values of θ : e.g. all higher 1 1 1 Question Answer Marks 1(e) any appropriate factor: e.g. volume of water, initial temperature of water, similar ratio of surface areas, type / material of beaker, room temperature / appropriate environmental factor 1 Total 11
Q2 · In this experiment, you will investigate the resistance of a lamp
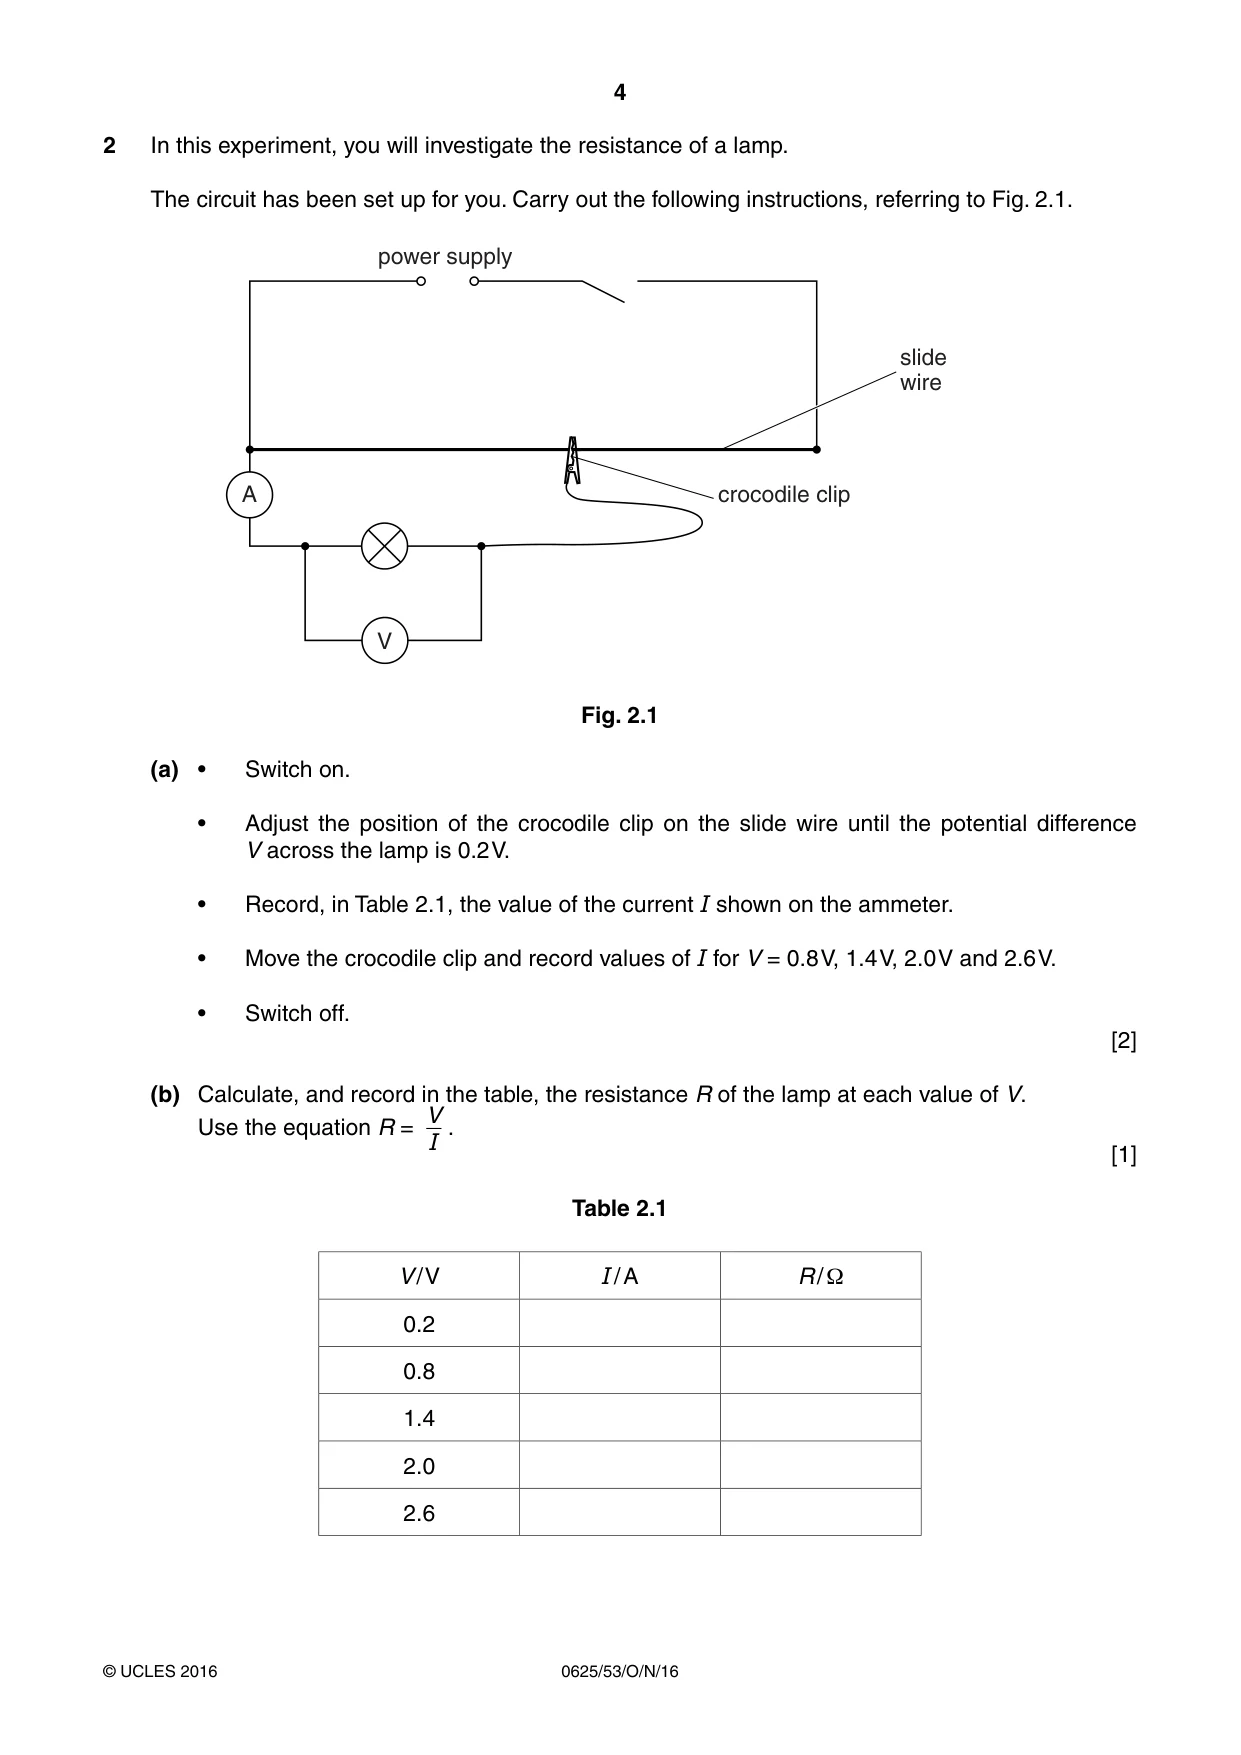
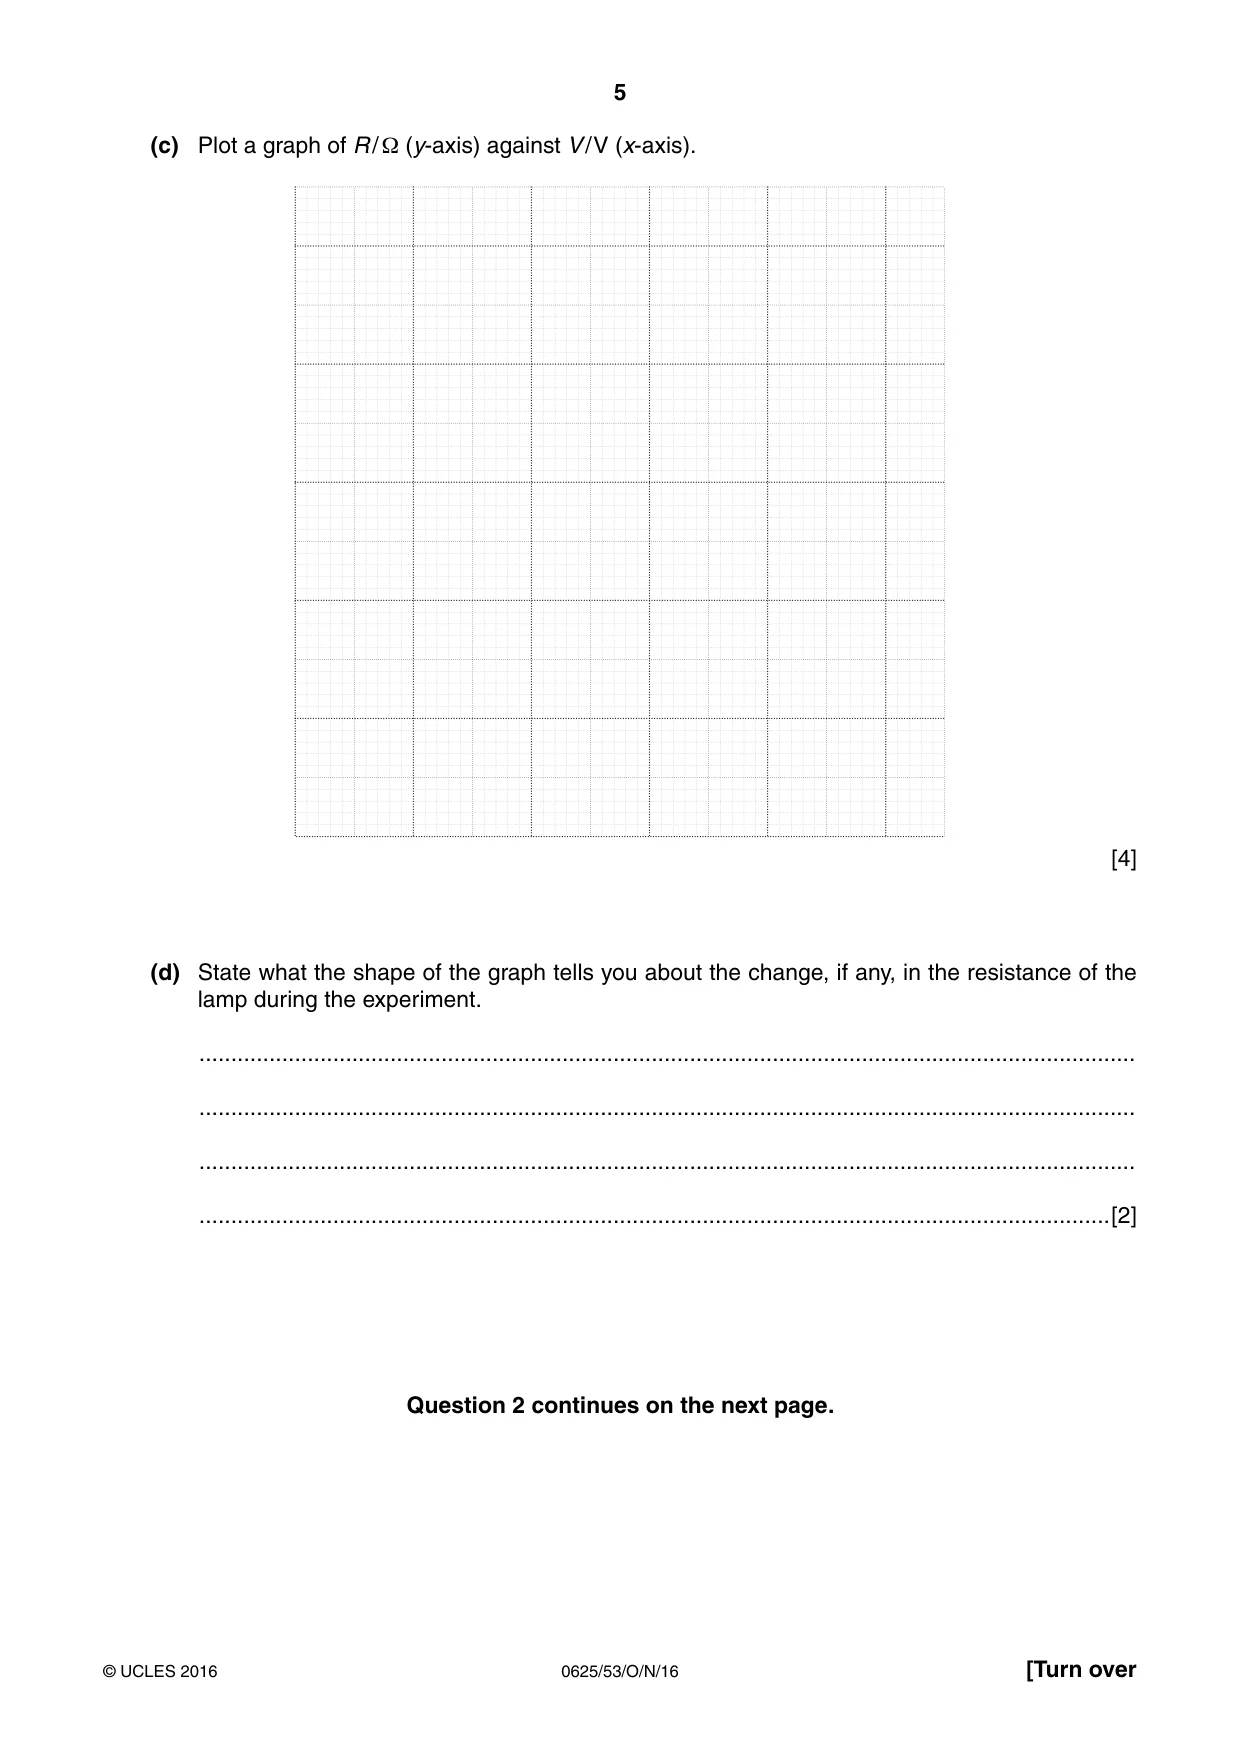
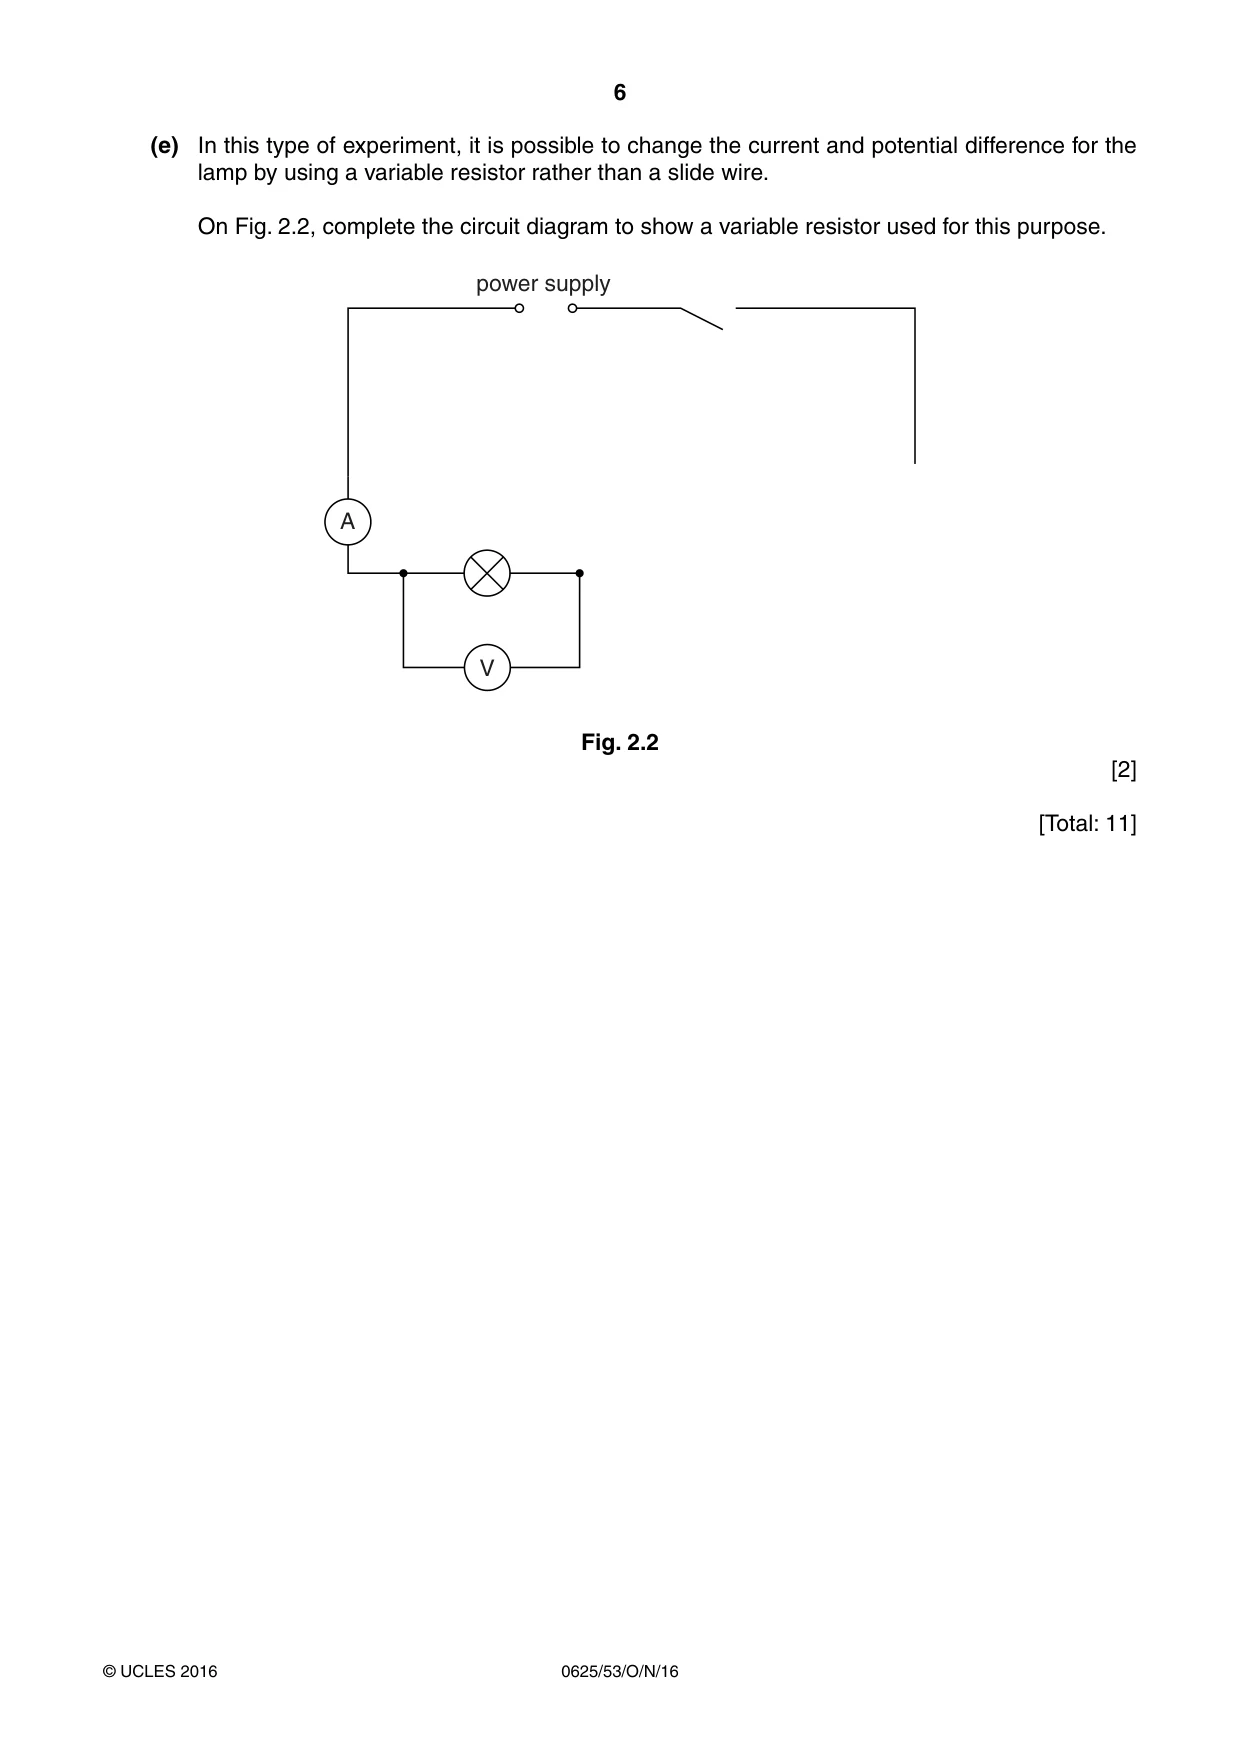
2 In this experiment, you will investigate the resistance of a lamp. The circuit has been set up for you. Carry out the following instructions, referring to Fig. 2.1. power supply slide wire A crocodile clip V Fig. 2.1 (a) • Switch on. • Adjust the position of the crocodile clip on the slide wire until the potential difference V across the lamp is 0.2 V. • Record, in Table 2.1, the value of the current I shown on the ammeter. • Move the crocodile clip and record values of I for V = 0.8 V, 1.4 V, 2.0 V and 2.6 V. • Switch off. [2] (b) Calculate, and record in the table, the resistance R of the lamp at each value of V. V Use the equation R = . I [1] Table 2.1 V / V I / A R / Ω 0.2 0.8 1.4 2.0 2.6 (c) Plot a graph of R / Ω (y-axis) against V / V (x-axis). [4] (d) State what the shape of the graph tells you about the change, if any, in the resistance of the lamp during the experiment. ................................................................................................................................................... ................................................................................................................................................... ................................................................................................................................................... ...............................................................................................................................................[2] Question 2 continues on the next page. (e) In this type of experiment, it is possible to change the current and potential difference for the lamp by using a variable resistor rather than a slide wire. On Fig. 2.2, complete the circuit diagram to show a variable resistor used for this purpose. power supply A V Fig. 2.2 [2] [Total: 11]
Mark scheme: 2(a) 5 / values, all increasing all < 1.00 A and to 2dp at least 1 1 2(b) correct calculations of R 1 2(c) graph: axes labelled with quantity and unit appropriate scales (plots occupying at least ½ grid) plots all correct to ½ small square well-judged line and thin line, precise plots 1 1 1 2(d) simple statement matching line (e.g. increases with p.d.) qualified (e.g. changes less rapidly for greater p.d. values) 1 1 2(e) correct symbol for variable resistor (rectangle with strike-through arrow only) in correct series circuit 1 1 Total 11
Q3 · In this experiment, you will determine the focal length of a converging lens by two…
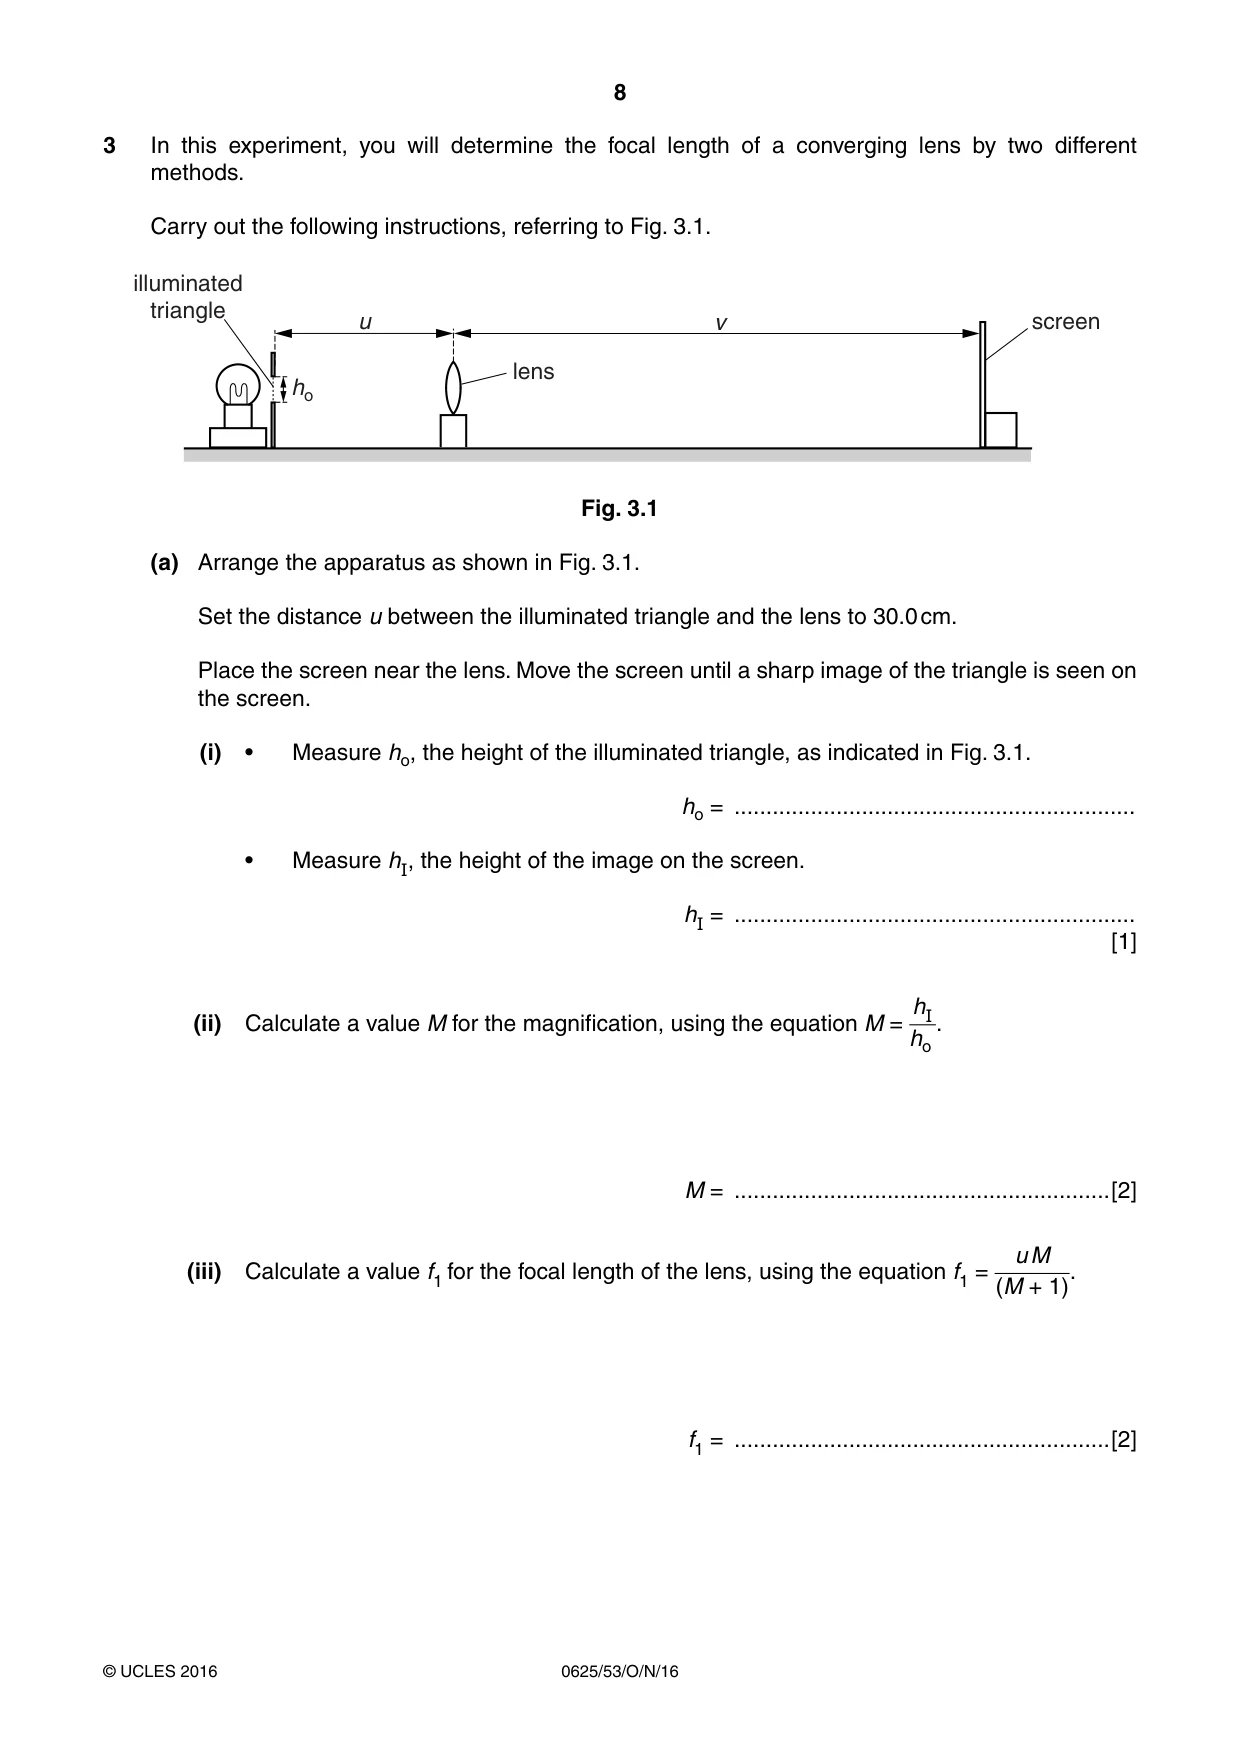
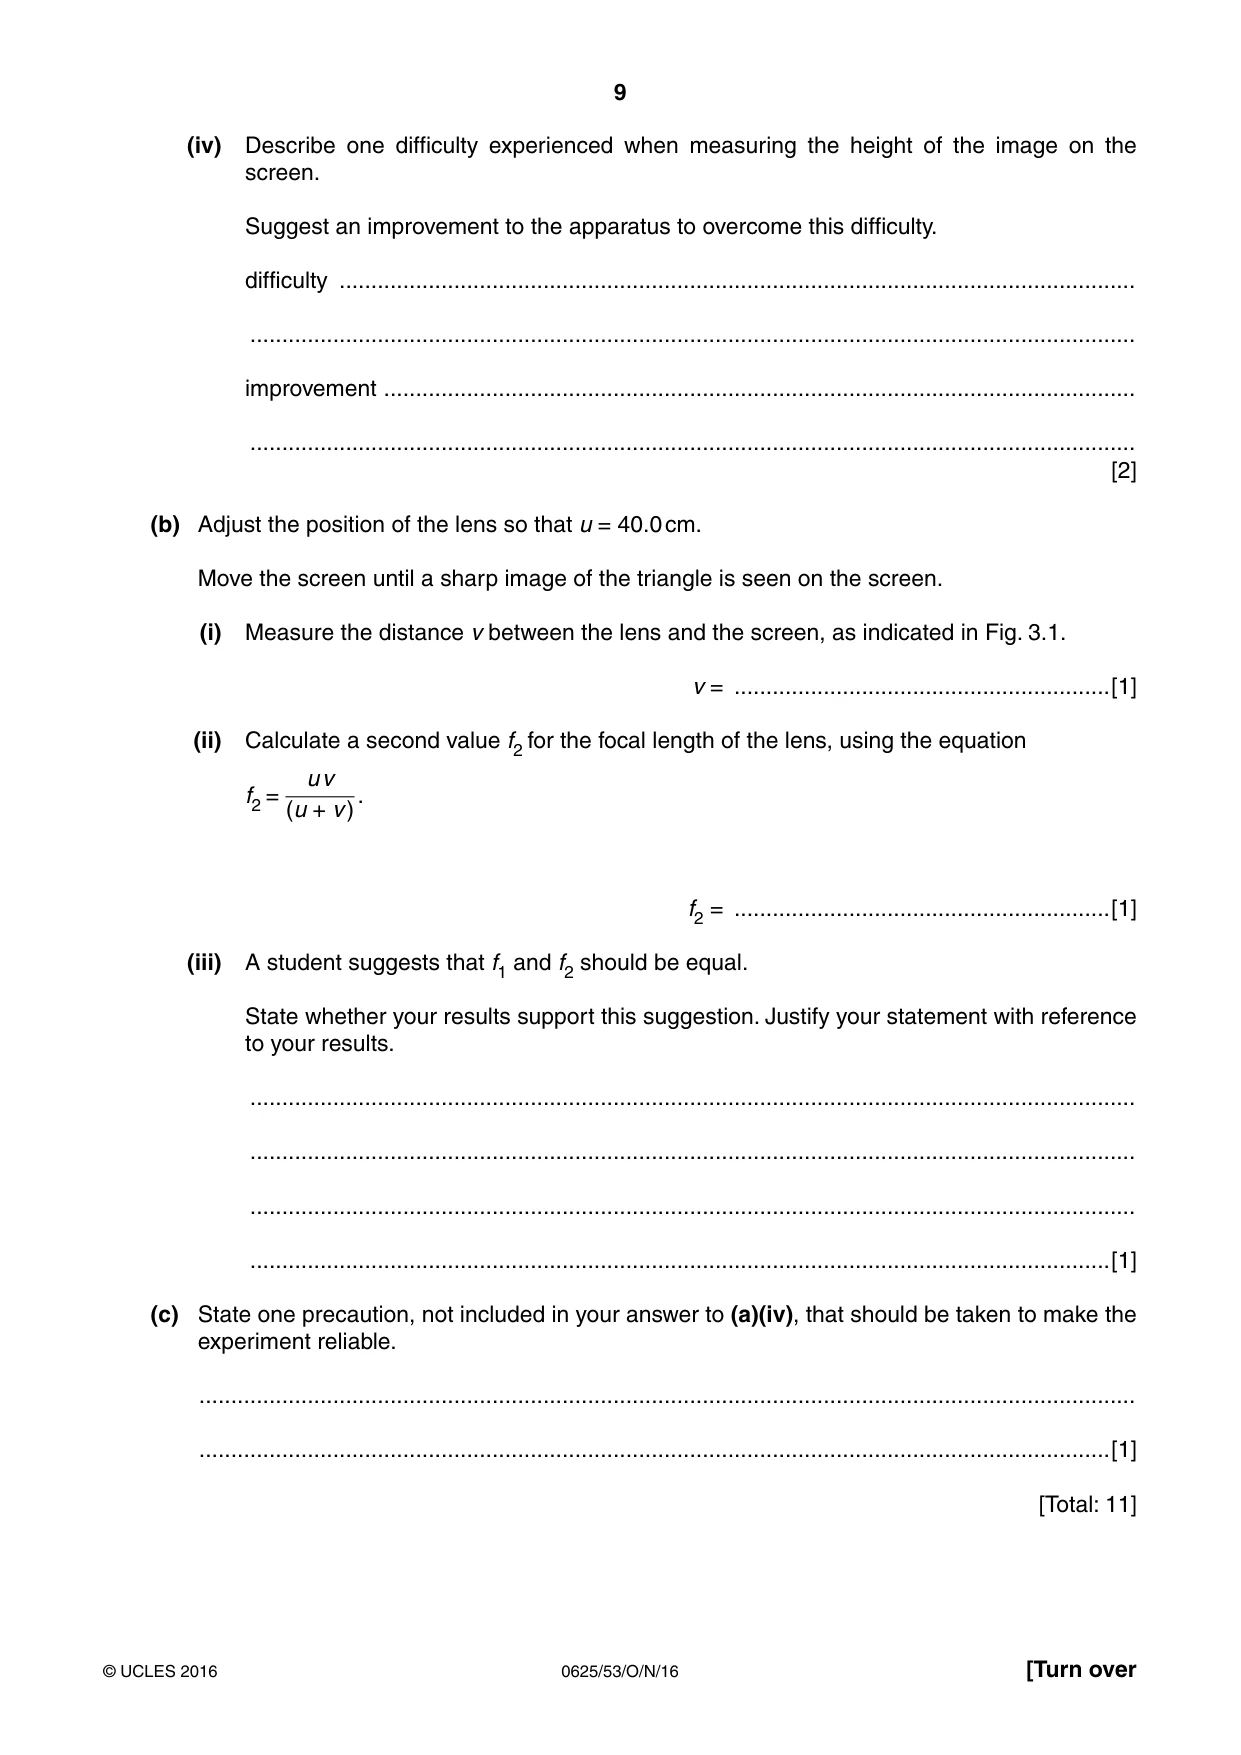
3 In this experiment, you will determine the focal length of a converging lens by two different methods. Carry out the following instructions, referring to Fig. 3.1. illuminated triangle u v screen lens ho Fig. 3.1 (a) Arrange the apparatus as shown in Fig. 3.1. Set the distance u between the illuminated triangle and the lens to 30.0 cm. Place the screen near the lens. Move the screen until a sharp image of the triangle is seen on the screen. (i) • Measure ho, the height of the illuminated triangle, as indicated in Fig. 3.1. ho = ............................................................... • Measure hI, the height of the image on the screen. hI = ............................................................... [1] hI (ii) Calculate a value M for the magnification, using the equation M = . ho M = ...........................................................[2] u M (iii) Calculate a value f1 for the focal length of the lens, using the equation f1 = (M + 1). f1 = ...........................................................[2] (iv) Describe one difficulty experienced when measuring the height of the image on the screen. Suggest an improvement to the apparatus to overcome this difficulty. difficulty ............................................................................................................................. ........................................................................................................................................... improvement ...................................................................................................................... ........................................................................................................................................... [2] (b) Adjust the position of the lens so that u = 40.0 cm. Move the screen until a sharp image of the triangle is seen on the screen. (i) Measure the distance v between the lens and the screen, as indicated in Fig. 3.1. v = ...........................................................[1] (ii) Calculate a second value f2 for the focal length of the lens, using the equation u v f2 = . (u + v ) f2 = ...........................................................[1] (iii) A student suggests that f1 and f2 should be equal. State whether your results support this suggestion. Justify your statement with reference to your results. ........................................................................................................................................... ........................................................................................................................................... ........................................................................................................................................... .......................................................................................................................................[1] (c) State one precaution, not included in your answer to (a)(iv), that should be taken to make the experiment reliable. ................................................................................................................................................... ...............................................................................................................................................[1] [Total: 11]
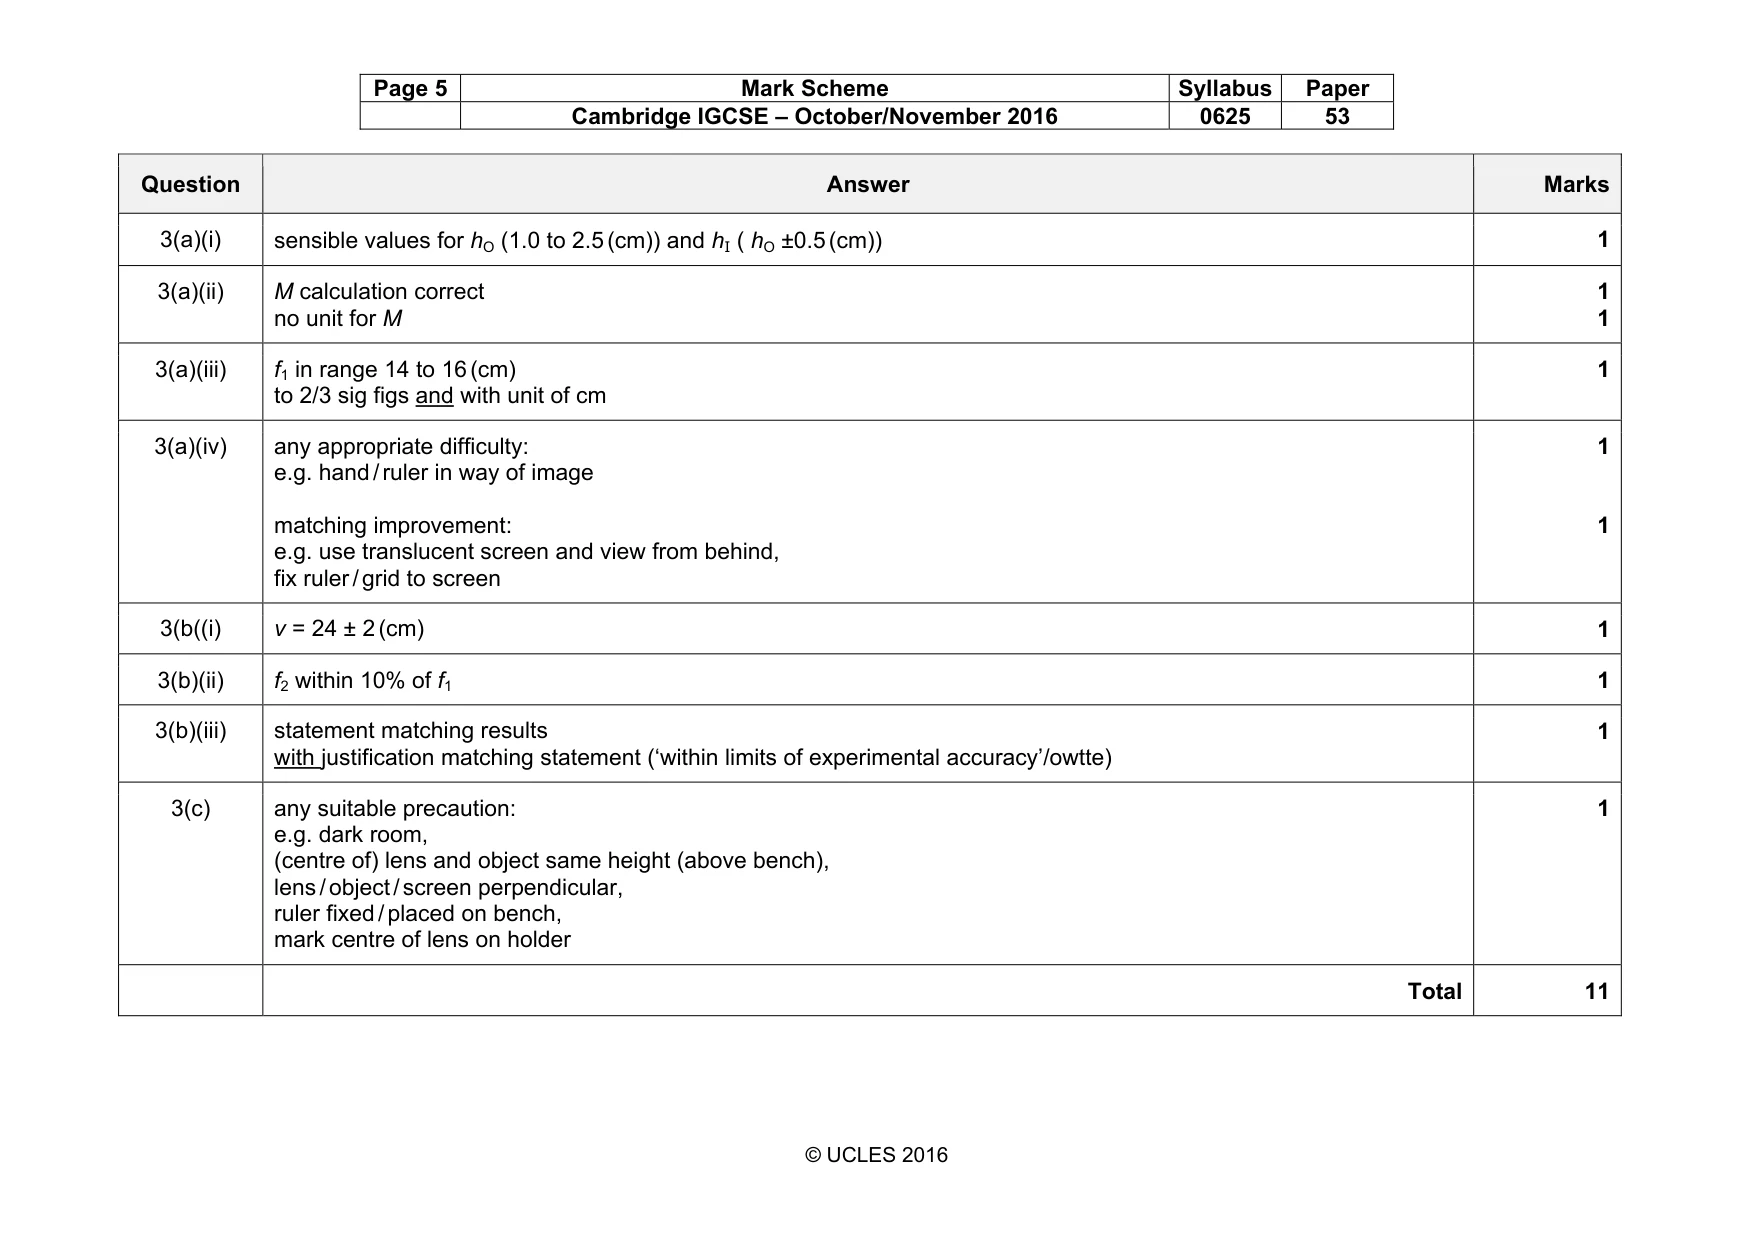
Mark scheme: 3(a)(i) sensible values for hO (1.0 to 2.5 (cm)) and hI ( hO ±0.5 (cm)) 1 3(a)(ii) M calculation correct no unit for M 1 1 3(a)(iii) f1 in range 14 to 16 (cm) to 2/3 sig figs and with unit of cm 1 3(a)(iv) any appropriate difficulty: e.g. hand / ruler in way of image matching improvement: e.g. use translucent screen and view from behind, fix ruler / grid to screen 1 1 3(b((i) v = 24 ± 2 (cm) 1 3(b)(ii) f2 within 10% of f1 1 3(b)(iii) statement matching results with justification matching statement (‘within limits of experimental accuracy’/owtte) 1 3(c) any suitable precaution: e.g. dark room, (centre of) lens and object same height (above bench), lens / object / screen perpendicular, ruler fixed / placed on bench, mark centre of lens on holder 1 Total 11
Q4 · A student has noticed that different types of paper have different strengths
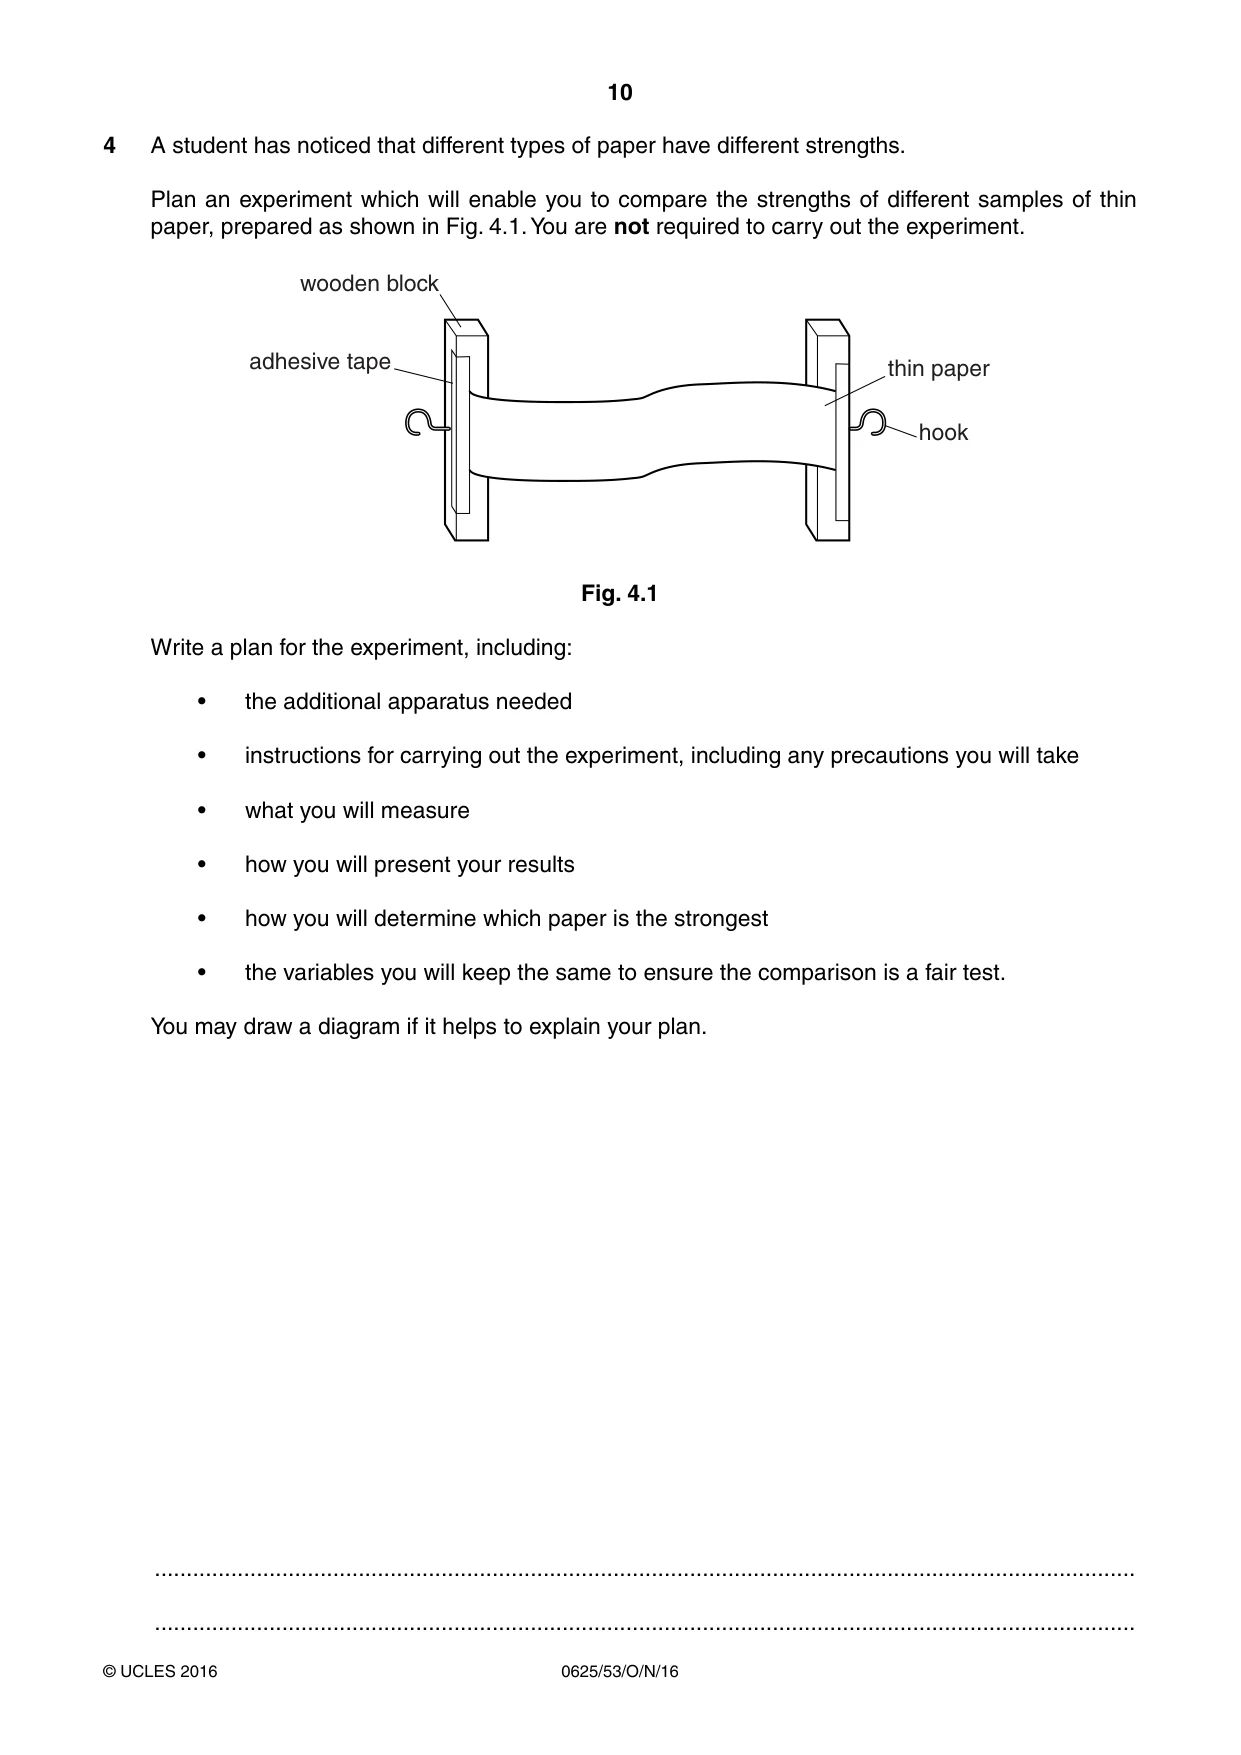
4 A student has noticed that different types of paper have different strengths. Plan an experiment which will enable you to compare the strengths of different samples of thin paper, prepared as shown in Fig. 4.1. You are not required to carry out the experiment. wooden block adhesive tape thin paper hook Fig. 4.1 Write a plan for the experiment, including: • the additional apparatus needed • instructions for carrying out the experiment, including any precautions you will take • what you will measure • how you will present your results • how you will determine which paper is the strongest • the variables you will keep the same to ensure the comparison is a fair test. You may draw a diagram if it helps to explain your plan. .......................................................................................................................................................... .......................................................................................................................................................... .......................................................................................................................................................... .......................................................................................................................................................... .......................................................................................................................................................... .......................................................................................................................................................... .......................................................................................................................................................... .......................................................................................................................................................... .......................................................................................................................................................... .......................................................................................................................................................... .......................................................................................................................................................... .......................................................................................................................................................... .......................................................................................................................................................... .......................................................................................................................................................... .......................................................................................................................................................... .......................................................................................................................................................... .......................................................................................................................................................... .......................................................................................................................................................... .......................................................................................................................................................... .......................................................................................................................................................... .......................................................................................................................................................... .......................................................................................................................................................... .......................................................................................................................................................... .......................................................................................................................................................... .......................................................................................................................................................... .......................................................................................................................................................... .......................................................................................................................................................... .......................................................................................................................................................... ..................................................................................................................................................... [7]
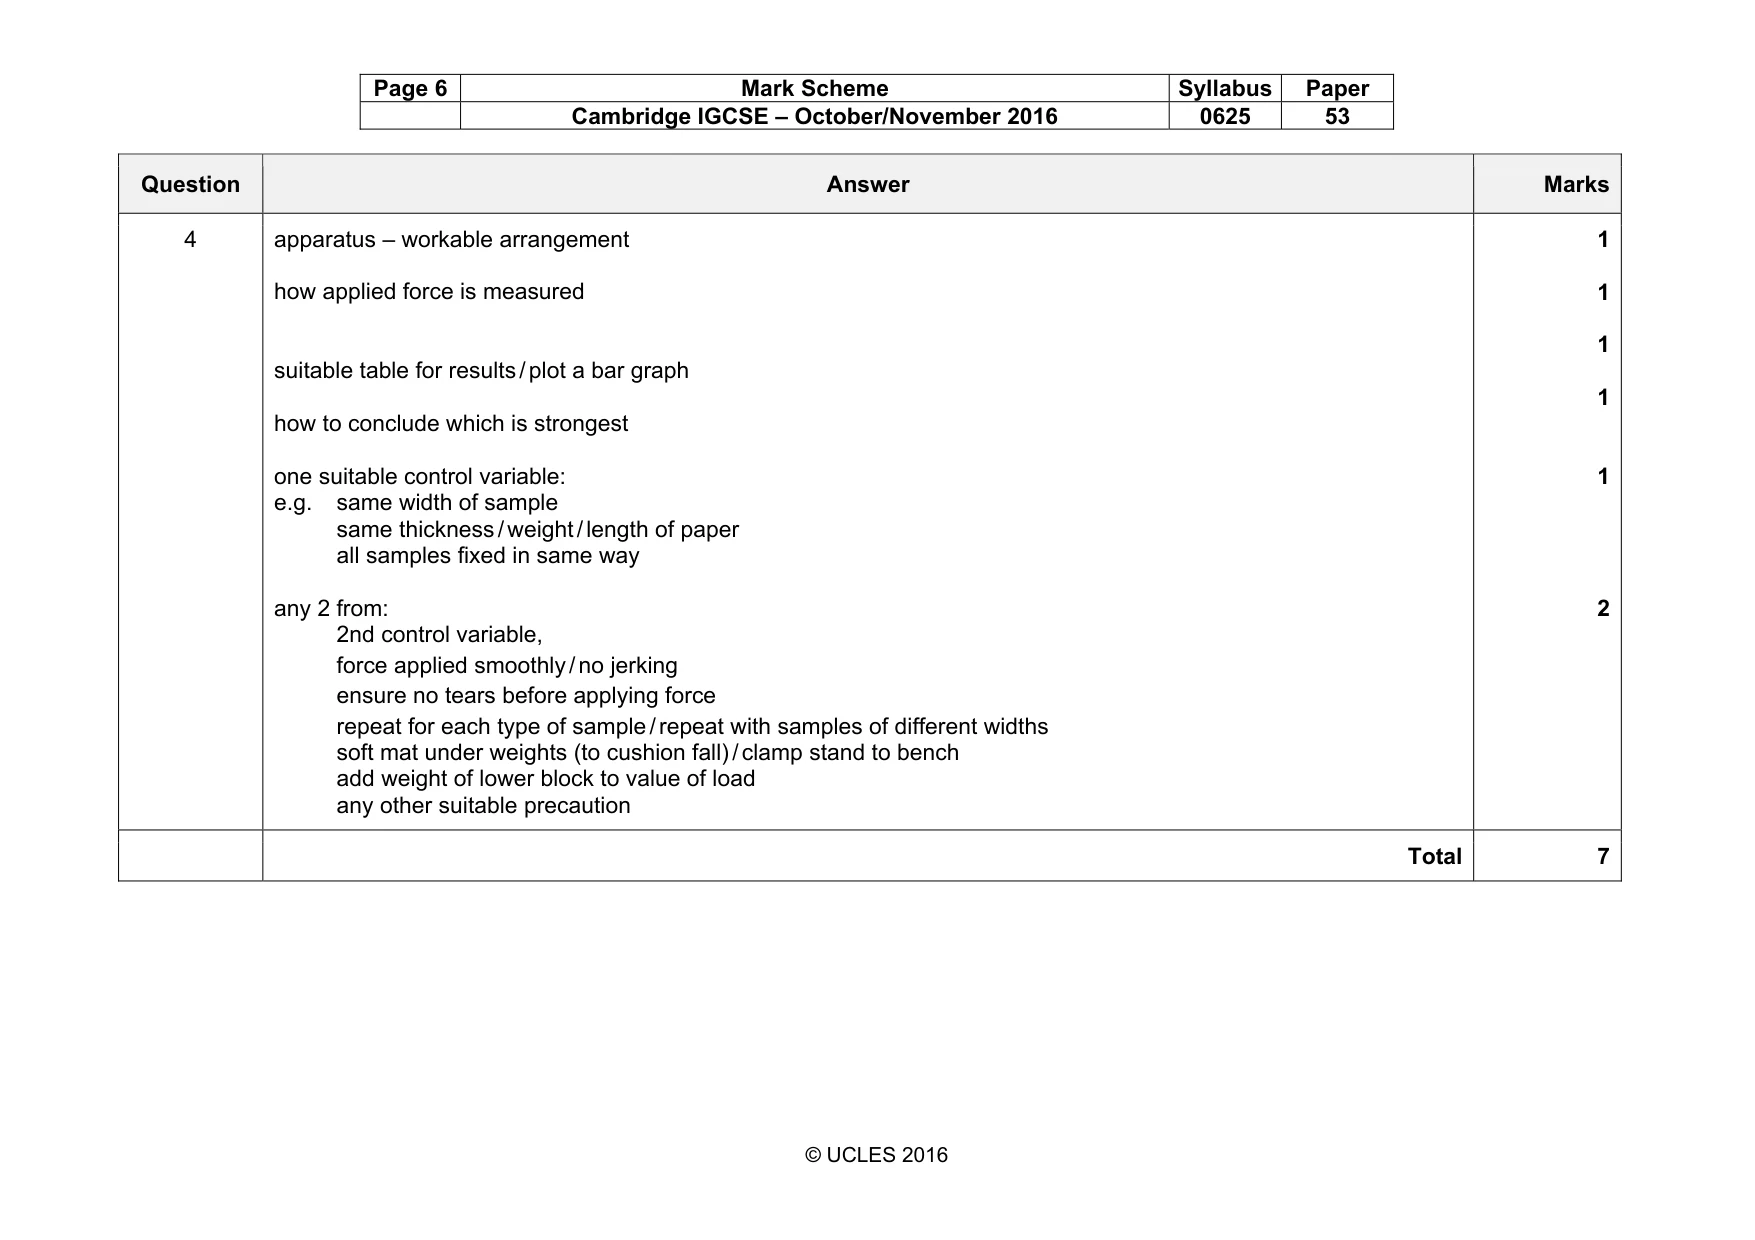
Mark scheme: 4 apparatus – workable arrangement how applied force is measured suitable table for results / plot a bar graph how to conclude which is strongest one suitable control variable: e.g. same width of sample same thickness / weight / length of paper all samples fixed in same way any 2 from: 2nd control variable, force applied smoothly / no jerking ensure no tears before applying force repeat for each type of sample / repeat with samples of different widths soft mat under weights (to cushion fall) / clamp stand to bench add weight of lower block to value of load any other suitable precaution 1 1 1 1 1 2 Total 7
What was in this paper
The subtopics covered by these 4 questions, and how many questions each got. Open one in a new tab to see every Cambridge question on it.
What you needed in this session
Cambridge’s own grade thresholds for 2016 Oct/Nov, Paper 5 · Variant 3. A higher threshold means an easier paper — the bar moves with how the cohort did.