Cambridge IGCSE Physics 0625 — 2024 Oct/Nov Paper 5 · Variant 3
0625/53/O/N/24 · 4 questions · 40 marks · ≈45 min
The question paper and its mark scheme, free to read here and free to download. This is Cambridge’s own paper, exactly as it was sat.
Question paper12 pages
Mark scheme8 pages
Answers below. Sit the paper first if you are practising.
Questions as text
Q1 · In this experiment, you will investigate the cooling of water in different sized beakers
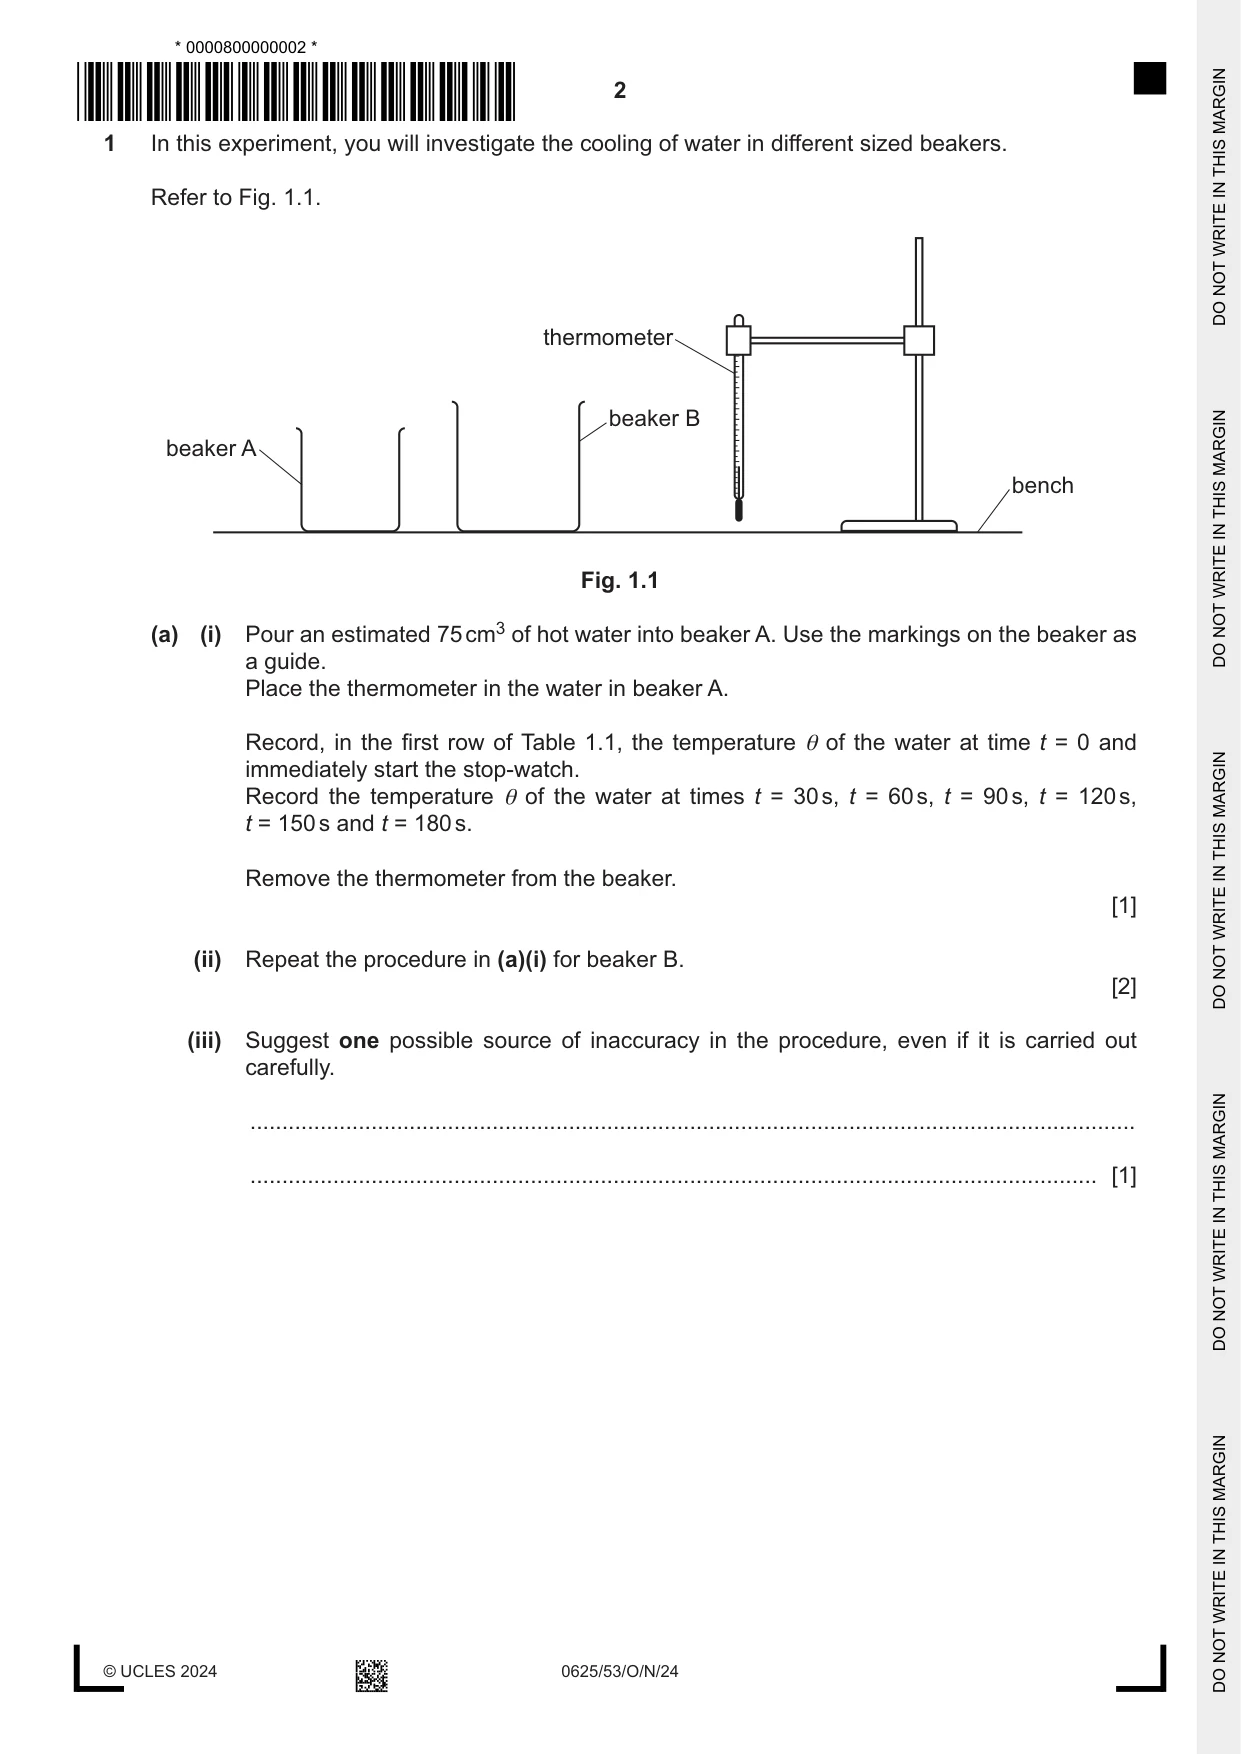
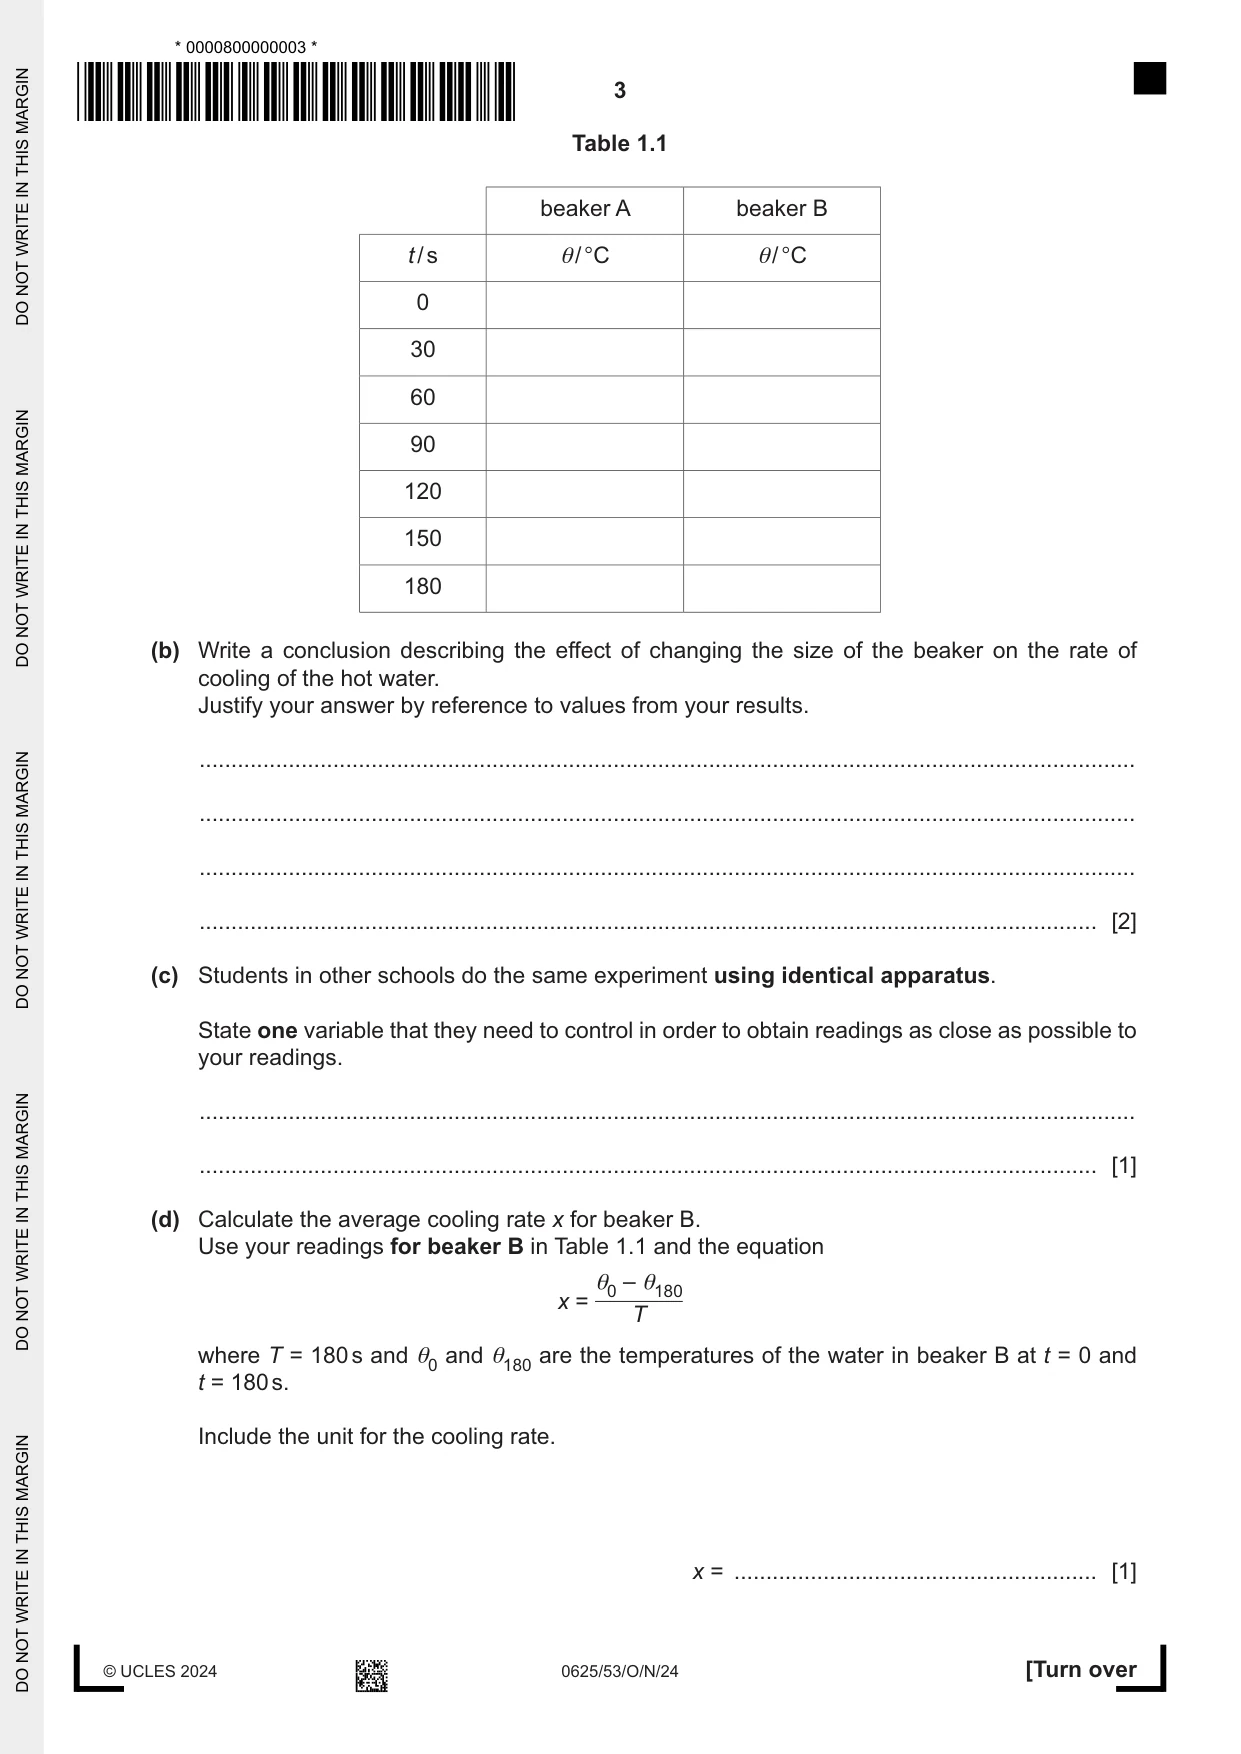
1 In this experiment, you will investigate the cooling of water in different sized beakers. Refer to Fig. 1.1. thermometer beaker B beaker A bench Fig. 1.1 (a) (i) Pour an estimated 75 cm3 of hot water into beaker A. Use the markings on the beaker as a guide. Place the thermometer in the water in beaker A. Record, in the first row of Table 1.1, the temperature θ of the water at time t = 0 and immediately start the stop-watch. Record the temperature θ of the water at times t = 30 s, t = 60 s, t = 90 s, t = 120 s, t = 150 s and t = 180 s. Remove the thermometer from the beaker. [1] (ii) Repeat the procedure in (a)(i) for beaker B. [2] (iii) Suggest one possible source of inaccuracy in the procedure, even if it is carried out carefully. ........................................................................................................................................... ..................................................................................................................................... [1] Table 1.1 beaker A beaker B t / s θ/ °C θ/ °C 0 30 60 90 120 150 180 (b) Write a conclusion describing the effect of changing the size of the beaker on the rate of cooling of the hot water. Justify your answer by reference to values from your results. ................................................................................................................................................... ................................................................................................................................................... ................................................................................................................................................... ............................................................................................................................................. [2] (c) Students in other schools do the same experiment using identical apparatus. State one variable that they need to control in order to obtain readings as close as possible to your readings. ................................................................................................................................................... ............................................................................................................................................. [1] (d) Calculate the average cooling rate x for beaker B. Use your readings for beaker B in Table 1.1 and the equation θ0 – θ180 x = T where T = 180 s and θ0 and θ180 are the temperatures of the water in beaker B at t = 0 and t = 180 s. Include the unit for the cooling rate. x = ......................................................... [1] (e) (i) A student thinks that more thermal energy is lost from the surface of the water in beaker B than from the sides of beaker B. Suggest an additional experiment that she can do with beaker B to test her idea. You are not required to do this additional experiment. ........................................................................................................................................... ..................................................................................................................................... [1] (ii) Suggest how the cooling rate of the water in beaker B in this additional experiment compares with the value of x in (d) if her idea is correct. ........................................................................................................................................... ........................................................................................................................................... ..................................................................................................................................... [2] [Total: 11]
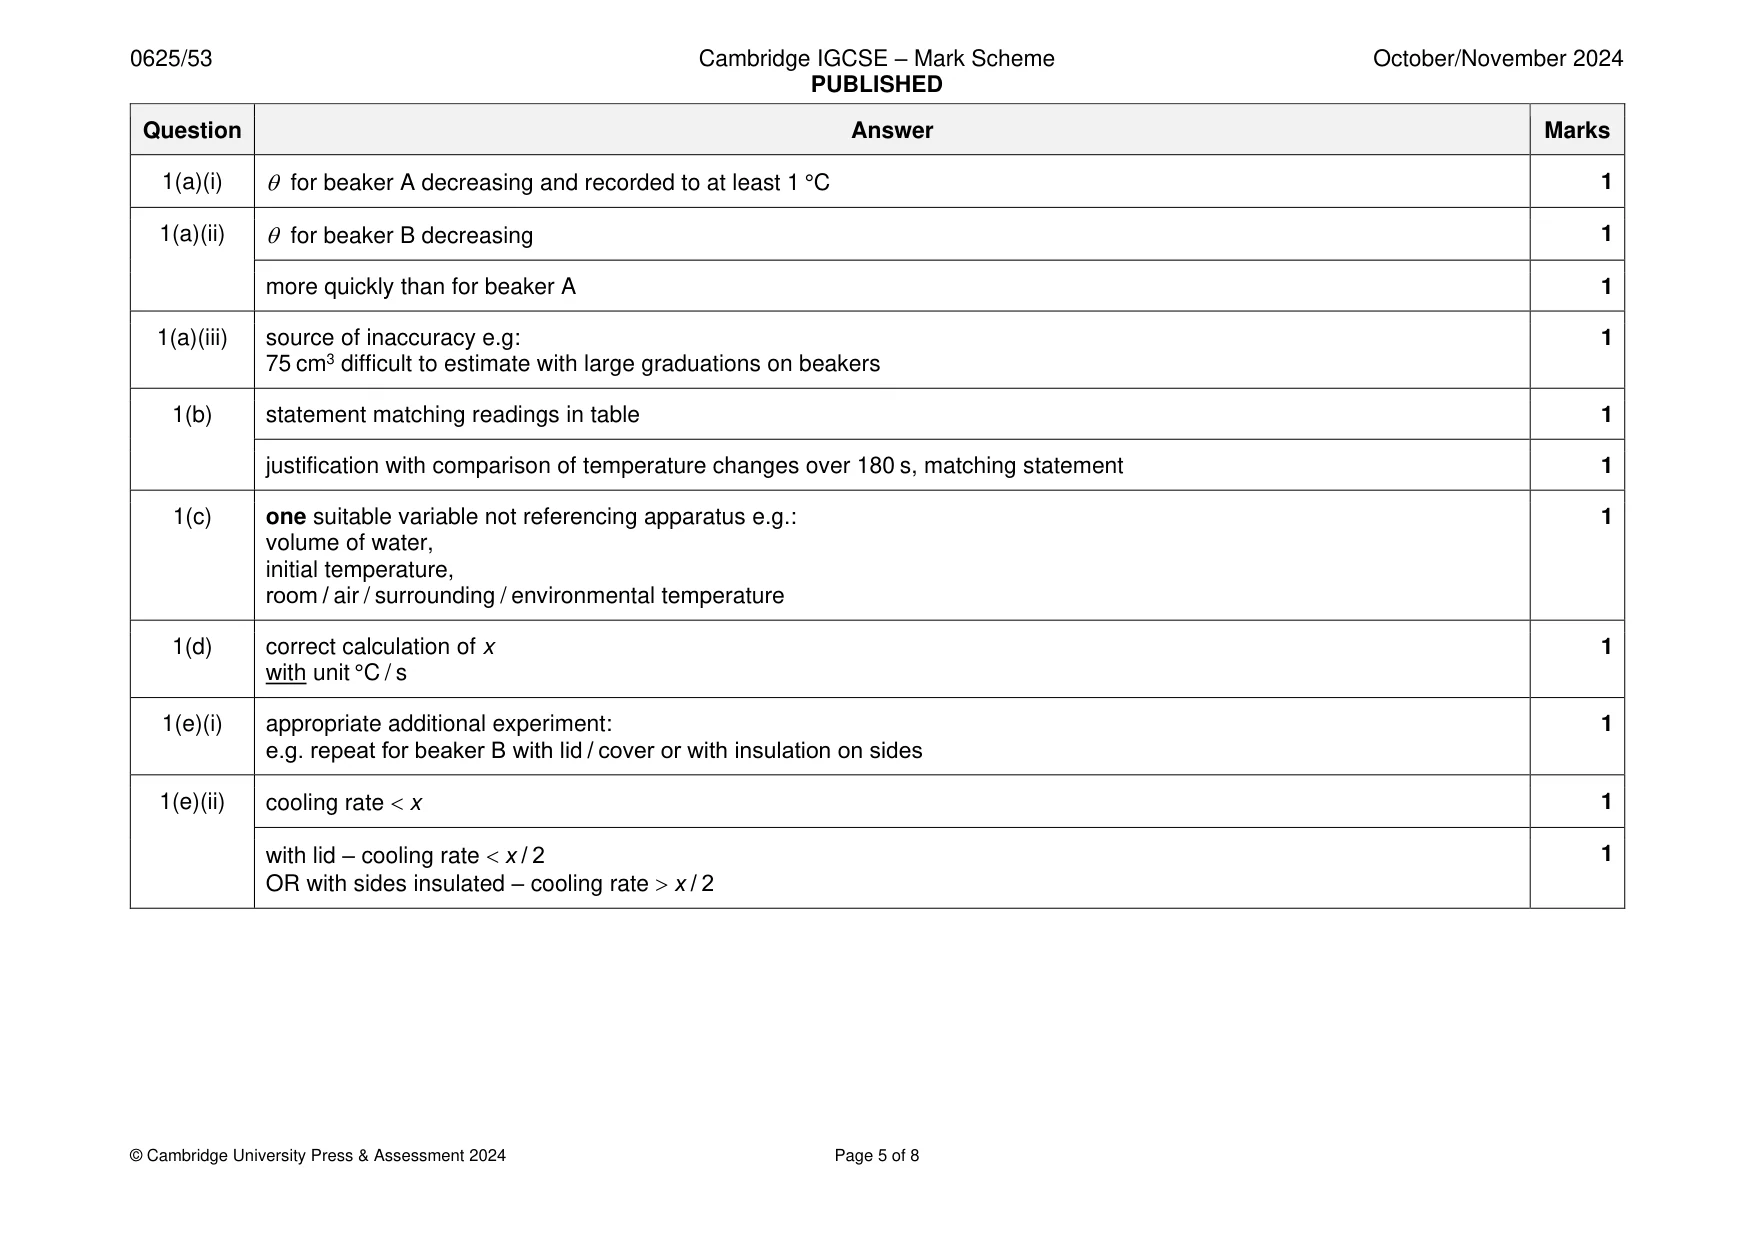
Mark scheme: Question Answer Marks 1(a)(i) for beaker A decreasing and recorded to at least 1 °C 1 1(a)(ii) for beaker B decreasing 1 more quickly than for beaker A 1 1(a)(iii) source of inaccuracy e.g: 1 75 cm3 difficult to estimate with large graduations on beakers 1(b) statement matching readings in table 1 justification with comparison of temperature changes over 180 s, matching statement 1 1(c) one suitable variable not referencing apparatus e.g.: 1 volume of water, initial temperature, room / air / surrounding / environmental temperature 1(d) correct calculation of x 1 with unit °C / s 1(e)(i) appropriate additional experiment: 1 e.g. repeat for beaker B with lid / cover or with insulation on sides 1(e)(ii) cooling rate x 1 with lid – cooling rate x / 2 1 OR with sides insulated – cooling rate x / 2
Q2 · In this experiment, you will determine the resistance of a resistor
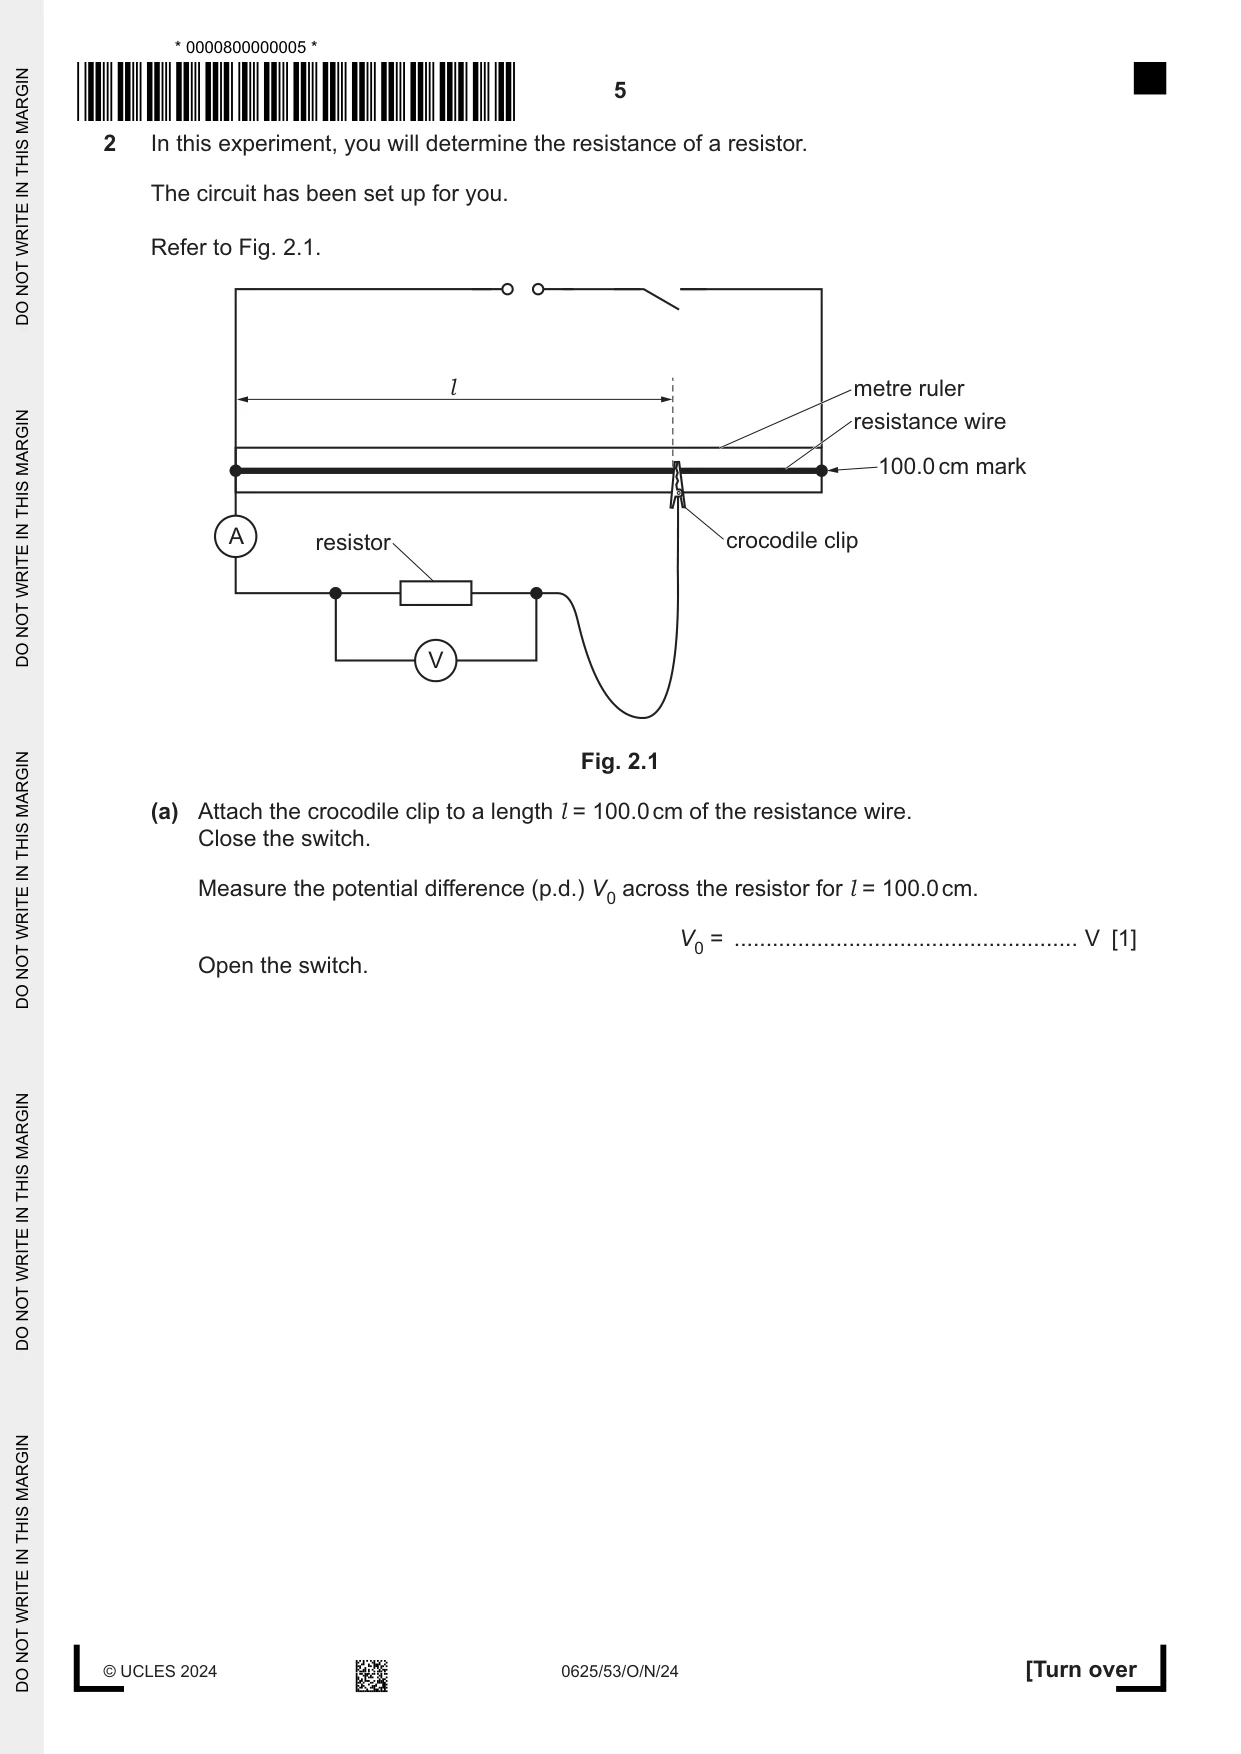
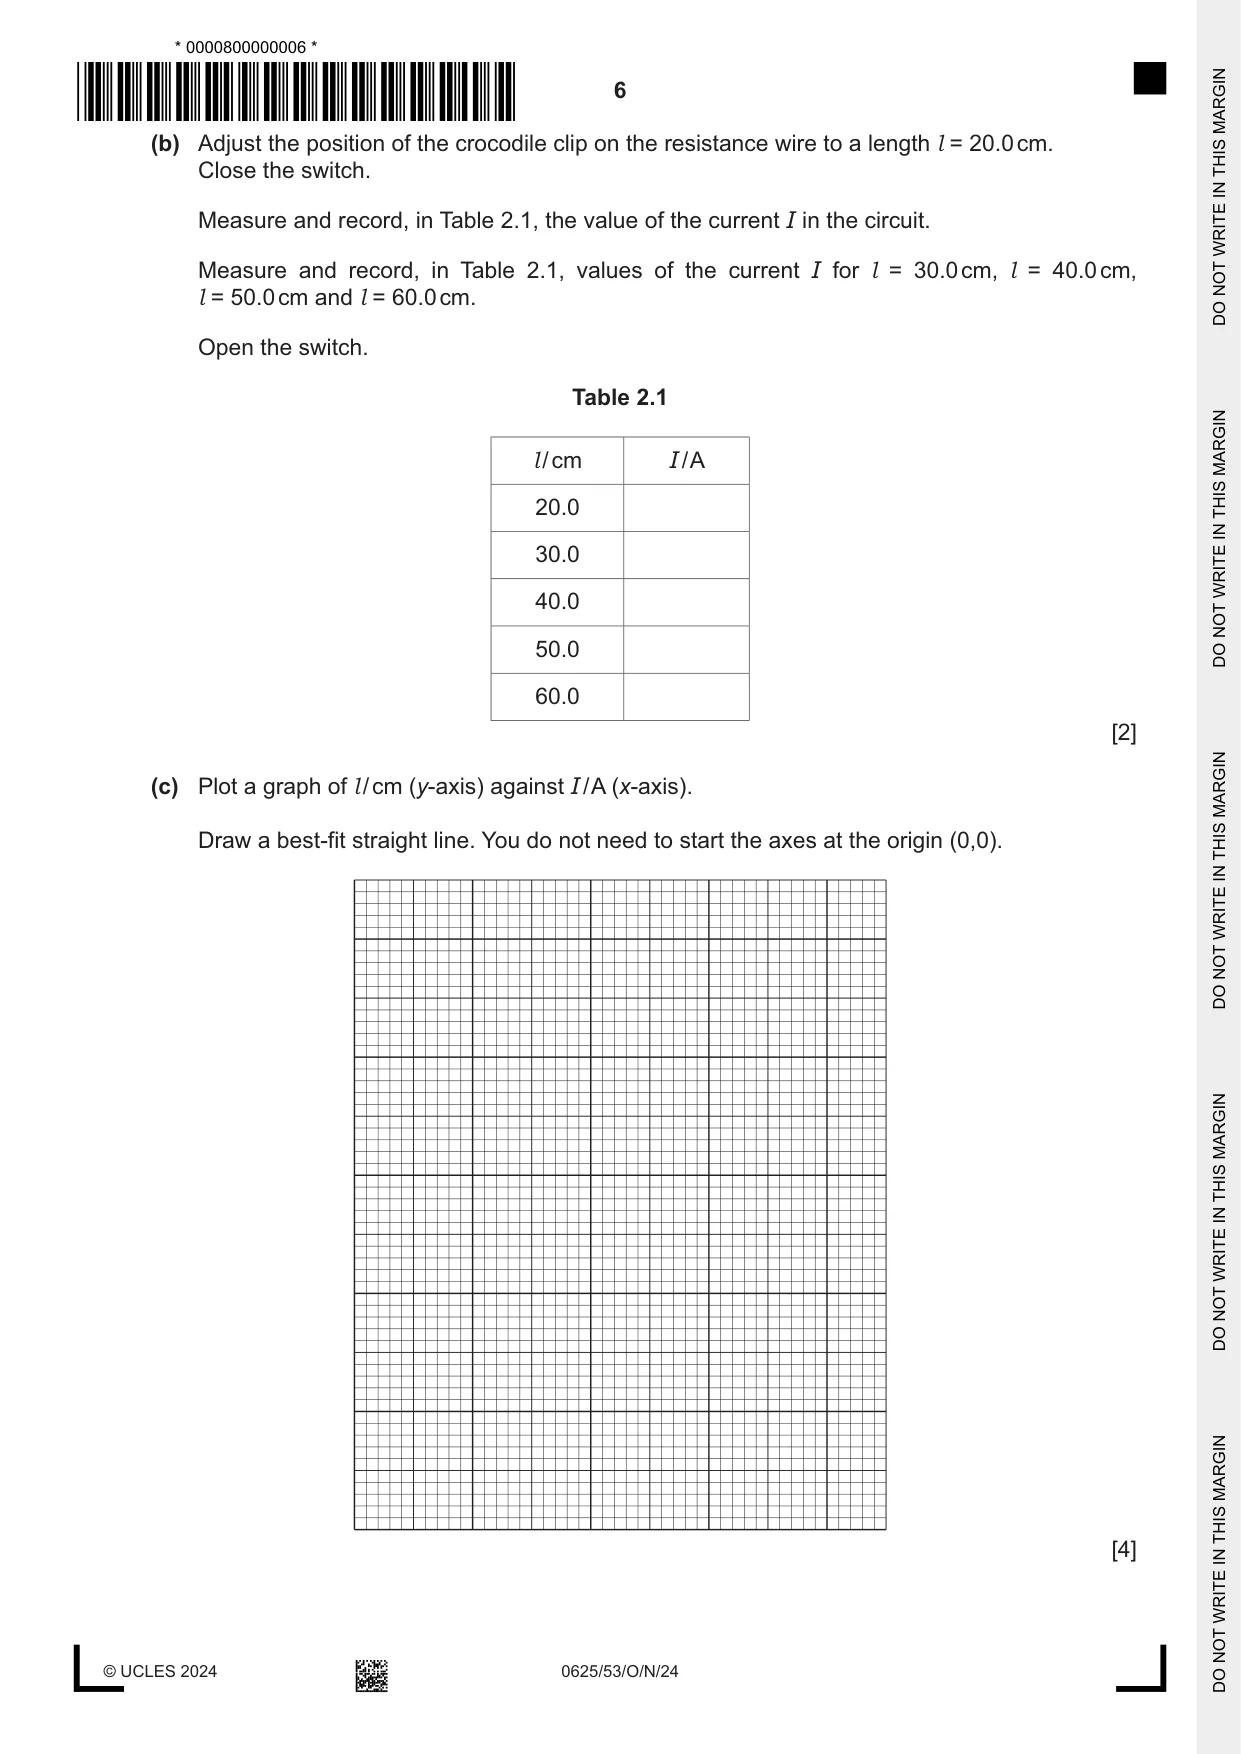
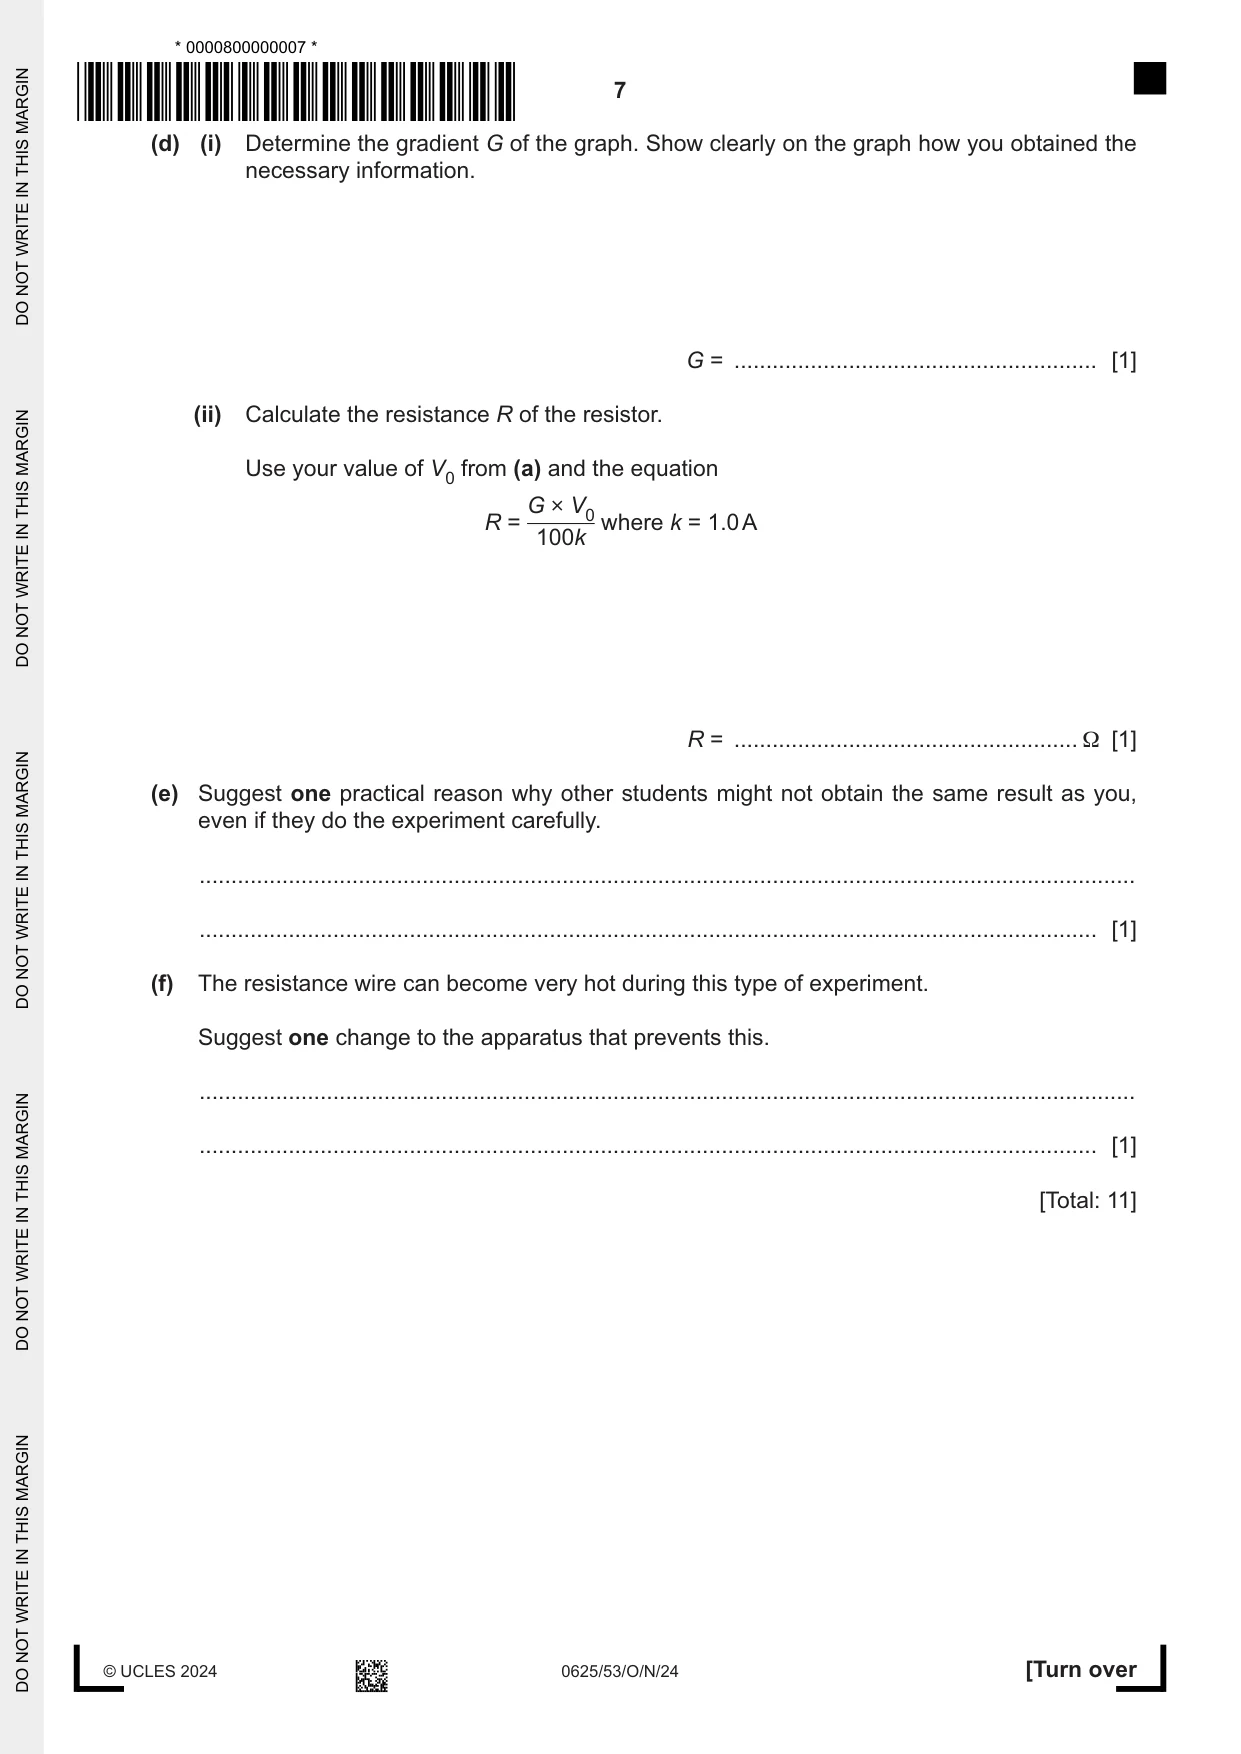
2 In this experiment, you will determine the resistance of a resistor. The circuit has been set up for you. Refer to Fig. 2.1. l metre ruler resistance wire 100.0 cm mark A resistor crocodile clip V Fig. 2.1 (a) Attach the crocodile clip to a length l = 100.0 cm of the resistance wire. Close the switch. Measure the potential difference (p.d.) V0 across the resistor for l = 100.0 cm. V0 = ...................................................... V [1] Open the switch. (b) Adjust the position of the crocodile clip on the resistance wire to a length l = 20.0 cm. Close the switch. Measure and record, in Table 2.1, the value of the current I in the circuit. Measure and record, in Table 2.1, values of the current I for l = 30.0 cm, l = 40.0 cm, l = 50.0 cm and l = 60.0 cm. Open the switch. Table 2.1 l / cm I / A 20.0 30.0 40.0 50.0 60.0 [2] (c) Plot a graph of l / cm (y-axis) against I / A (x-axis). Draw a best-fit straight line. You do not need to start the axes at the origin (0,0). [4] (d) (i) Determine the gradient G of the graph. Show clearly on the graph how you obtained the necessary information. G = ......................................................... [1] (ii) Calculate the resistance R of the resistor. Use your value of V0 from (a) and the equation G × V0 R = where k = 1.0 A 100k R = ...................................................... Ω [1] (e) Suggest one practical reason why other students might not obtain the same result as you, even if they do the experiment carefully. ................................................................................................................................................... ............................................................................................................................................. [1] (f) The resistance wire can become very hot during this type of experiment. Suggest one change to the apparatus that prevents this. ................................................................................................................................................... ............................................................................................................................................. [1] [Total: 11]
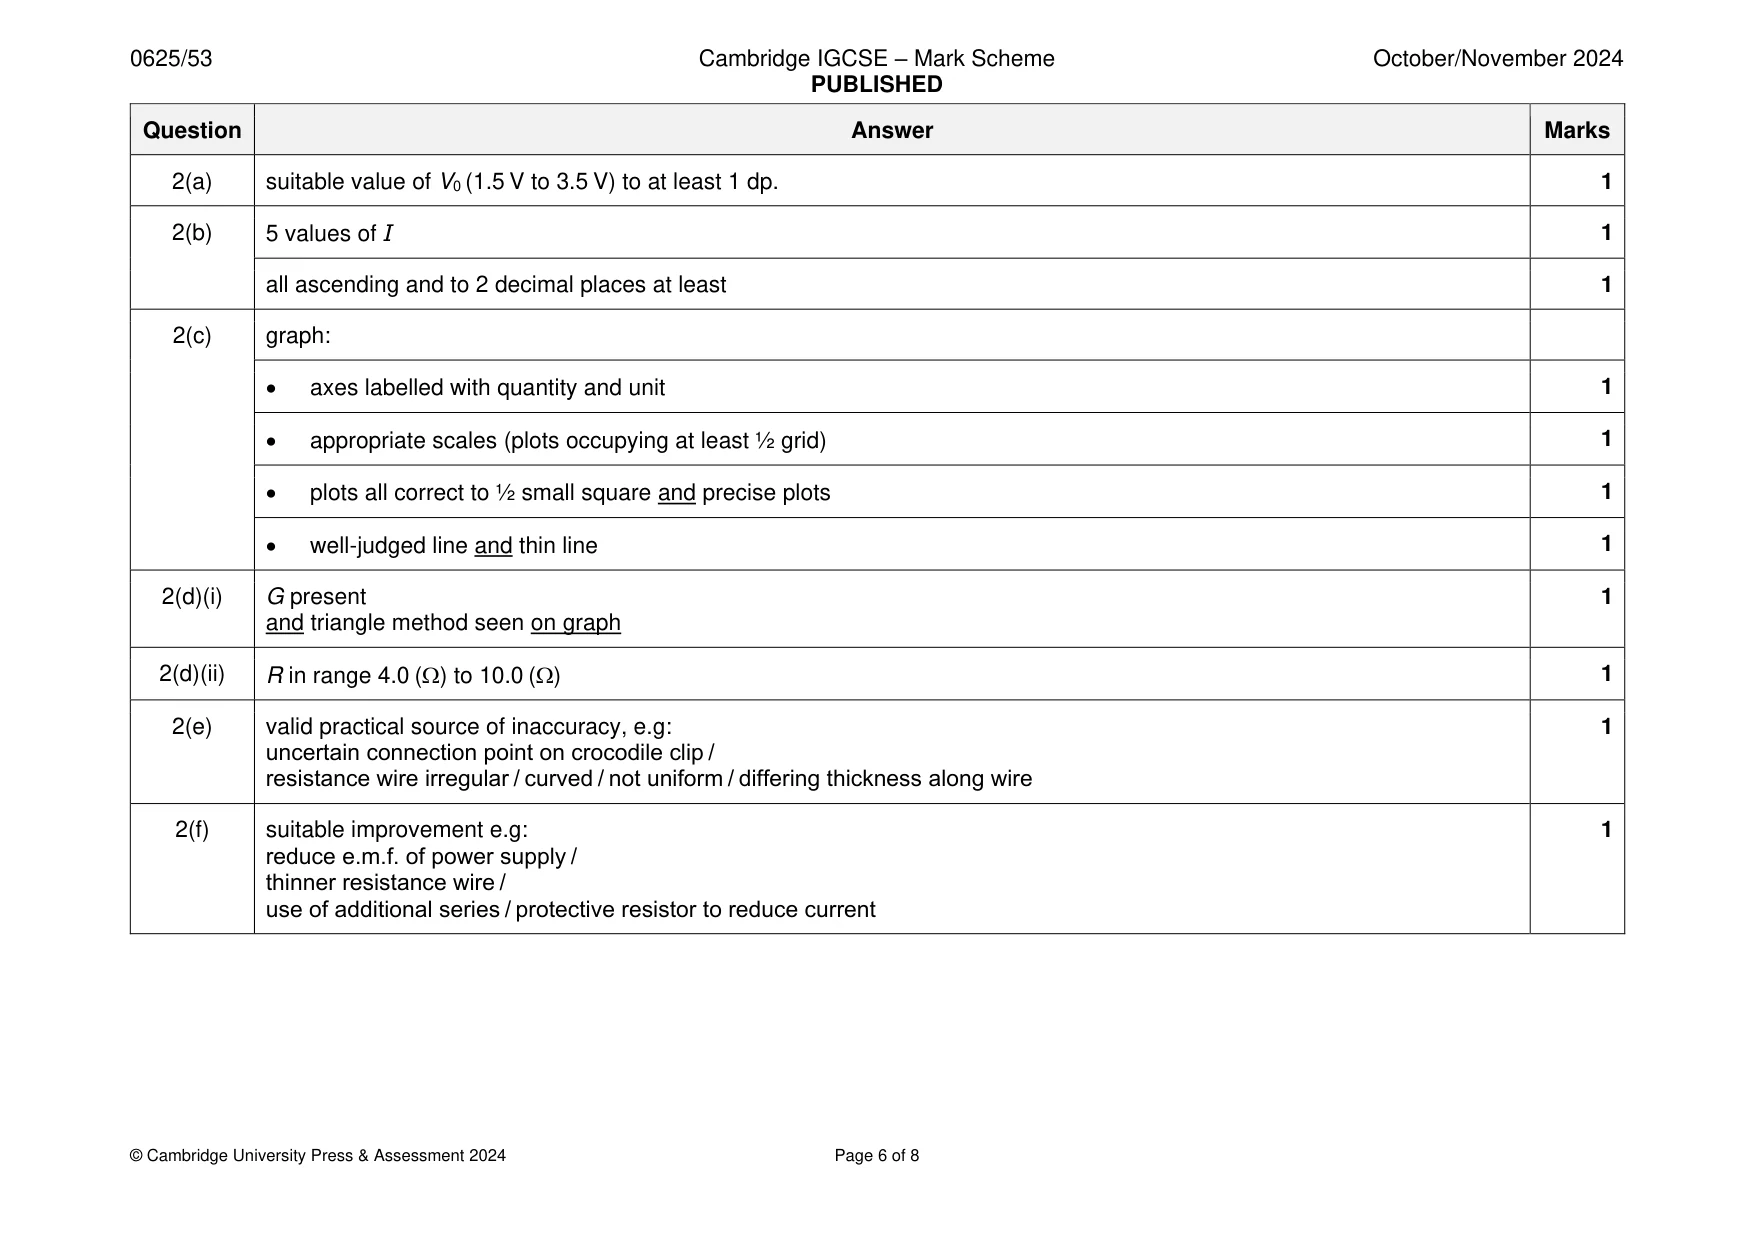
Mark scheme: 2(a) suitable value of V0 (1.5 V to 3.5 V) to at least 1 dp. 1 2(b) 5 values of I 1 all ascending and to 2 decimal places at least 1 2(c) graph: • axes labelled with quantity and unit 1 • appropriate scales (plots occupying at least ½ grid) 1 • plots all correct to ½ small square and precise plots 1 • well-judged line and thin line 1 2(d)(i) G present 1 and triangle method seen on graph 2(d)(ii) R in range 4.0 () to 10.0 () 1 2(e) valid practical source of inaccuracy, e.g: 1 uncertain connection point on crocodile clip / resistance wire irregular / curved / not uniform / differing thickness along wire 2(f) suitable improvement e.g: 1 reduce e.m.f. of power supply / thinner resistance wire / use of additional series / protective resistor to reduce current
Q3 · In this experiment, you will investigate the refraction of light by a transparent block
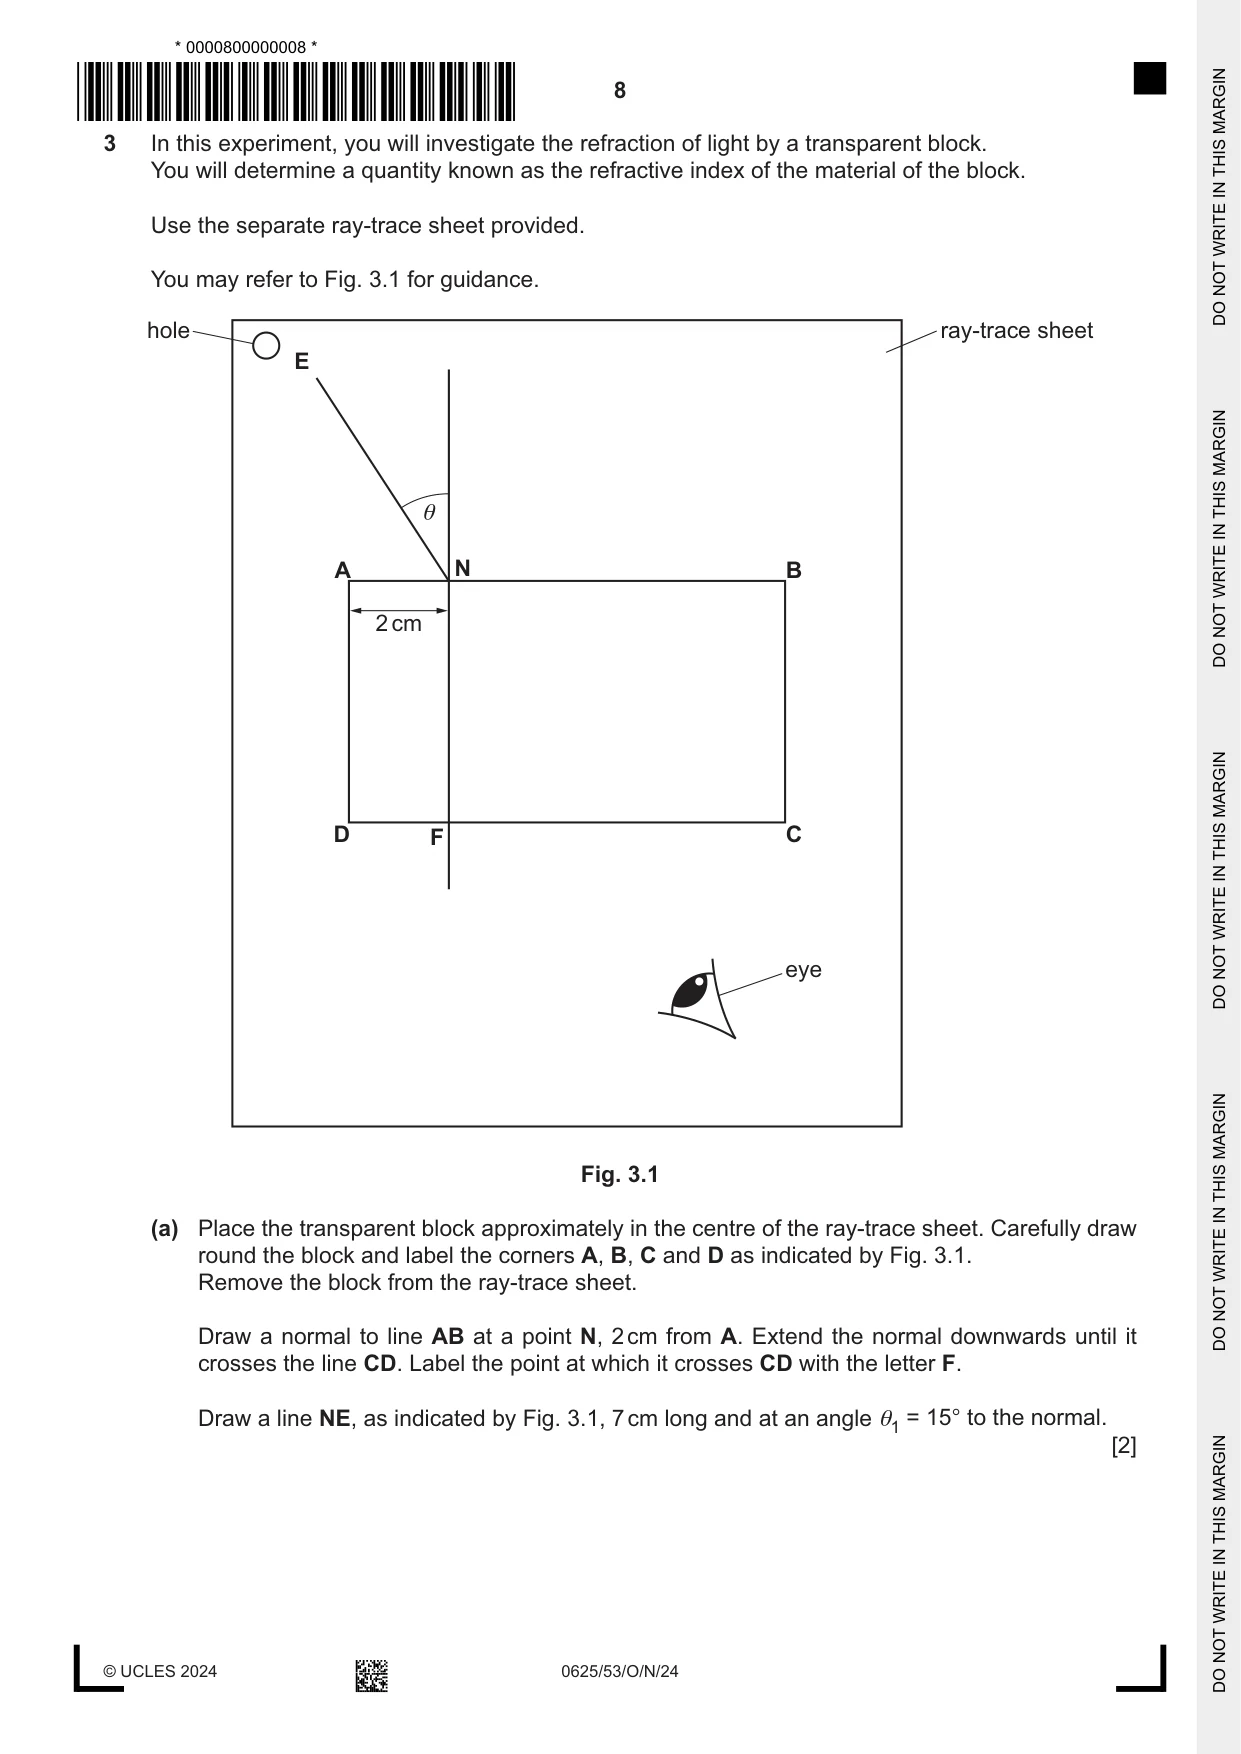
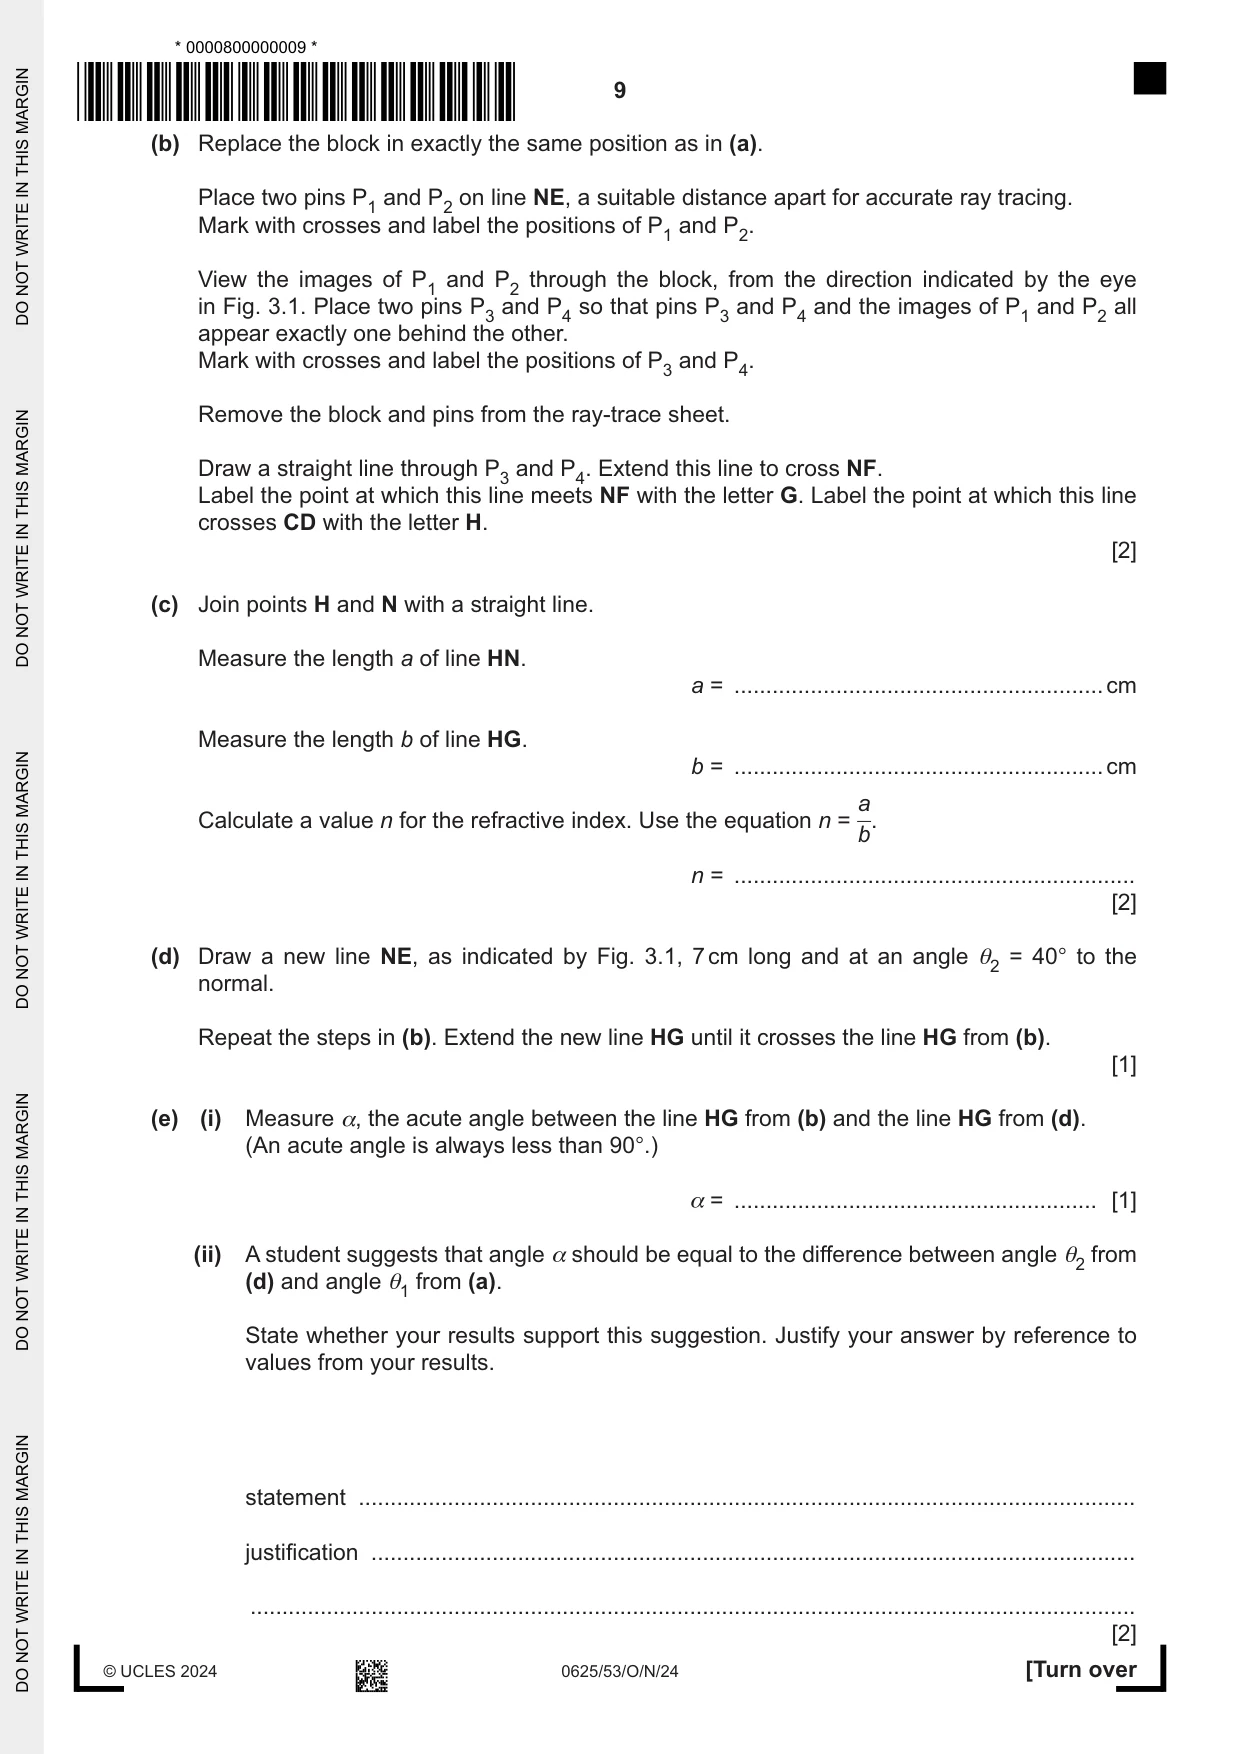
3 In this experiment, you will investigate the refraction of light by a transparent block. You will determine a quantity known as the refractive index of the material of the block. Use the separate ray-trace sheet provided. You may refer to Fig. 3.1 for guidance. hole ray-trace sheet E θ A N B 2 cm D F C eye Fig. 3.1 (a) Place the transparent block approximately in the centre of the ray-trace sheet. Carefully draw round the block and label the corners A, B, C and D as indicated by Fig. 3.1. Remove the block from the ray-trace sheet. Draw a normal to line AB at a point N, 2 cm from A. Extend the normal downwards until it crosses the line CD. Label the point at which it crosses CD with the letter F. Draw a line NE, as indicated by Fig. 3.1, 7 cm long and at an angle θ1 = 15° to the normal. [2] (b) Replace the block in exactly the same position as in (a). Place two pins P1 and P2 on line NE, a suitable distance apart for accurate ray tracing. Mark with crosses and label the positions of P1 and P2. View the images of P1 and P2 through the block, from the direction indicated by the eye in Fig. 3.1. Place two pins P3 and P4 so that pins P3 and P4 and the images of P1 and P2 all appear exactly one behind the other. Mark with crosses and label the positions of P3 and P4. Remove the block and pins from the ray-trace sheet. Draw a straight line through P3 and P4. Extend this line to cross NF. Label the point at which this line meets NF with the letter G. Label the point at which this line crosses CD with the letter H. [2] (c) Join points H and N with a straight line. Measure the length a of line HN. a = .......................................................... cm Measure the length b of line HG. b = .......................................................... cm a Calculate a value n for the refractive index. Use the equation n = b. n = ............................................................... [2] (d) Draw a new line NE, as indicated by Fig. 3.1, 7 cm long and at an angle θ2 = 40° to the normal. Repeat the steps in (b). Extend the new line HG until it crosses the line HG from (b). [1] (e) (i) Measure α, the acute angle between the line HG from (b) and the line HG from (d). (An acute angle is always less than 90°.) α = ......................................................... [1] (ii) A student suggests that angle α should be equal to the difference between angle θ2 from (d) and angle θ1 from (a). State whether your results support this suggestion. Justify your answer by reference to values from your results. statement .......................................................................................................................... justification ........................................................................................................................ ........................................................................................................................................... [2] (f) Suggest one technique to use in this type of experiment to ensure results are accurate. ................................................................................................................................................... ............................................................................................................................................. [1] [Total: 11] Write your name, centre number and candidate number on your ray-trace sheet. Tie your ray-trace sheet into this Booklet between pages 8 and 9.
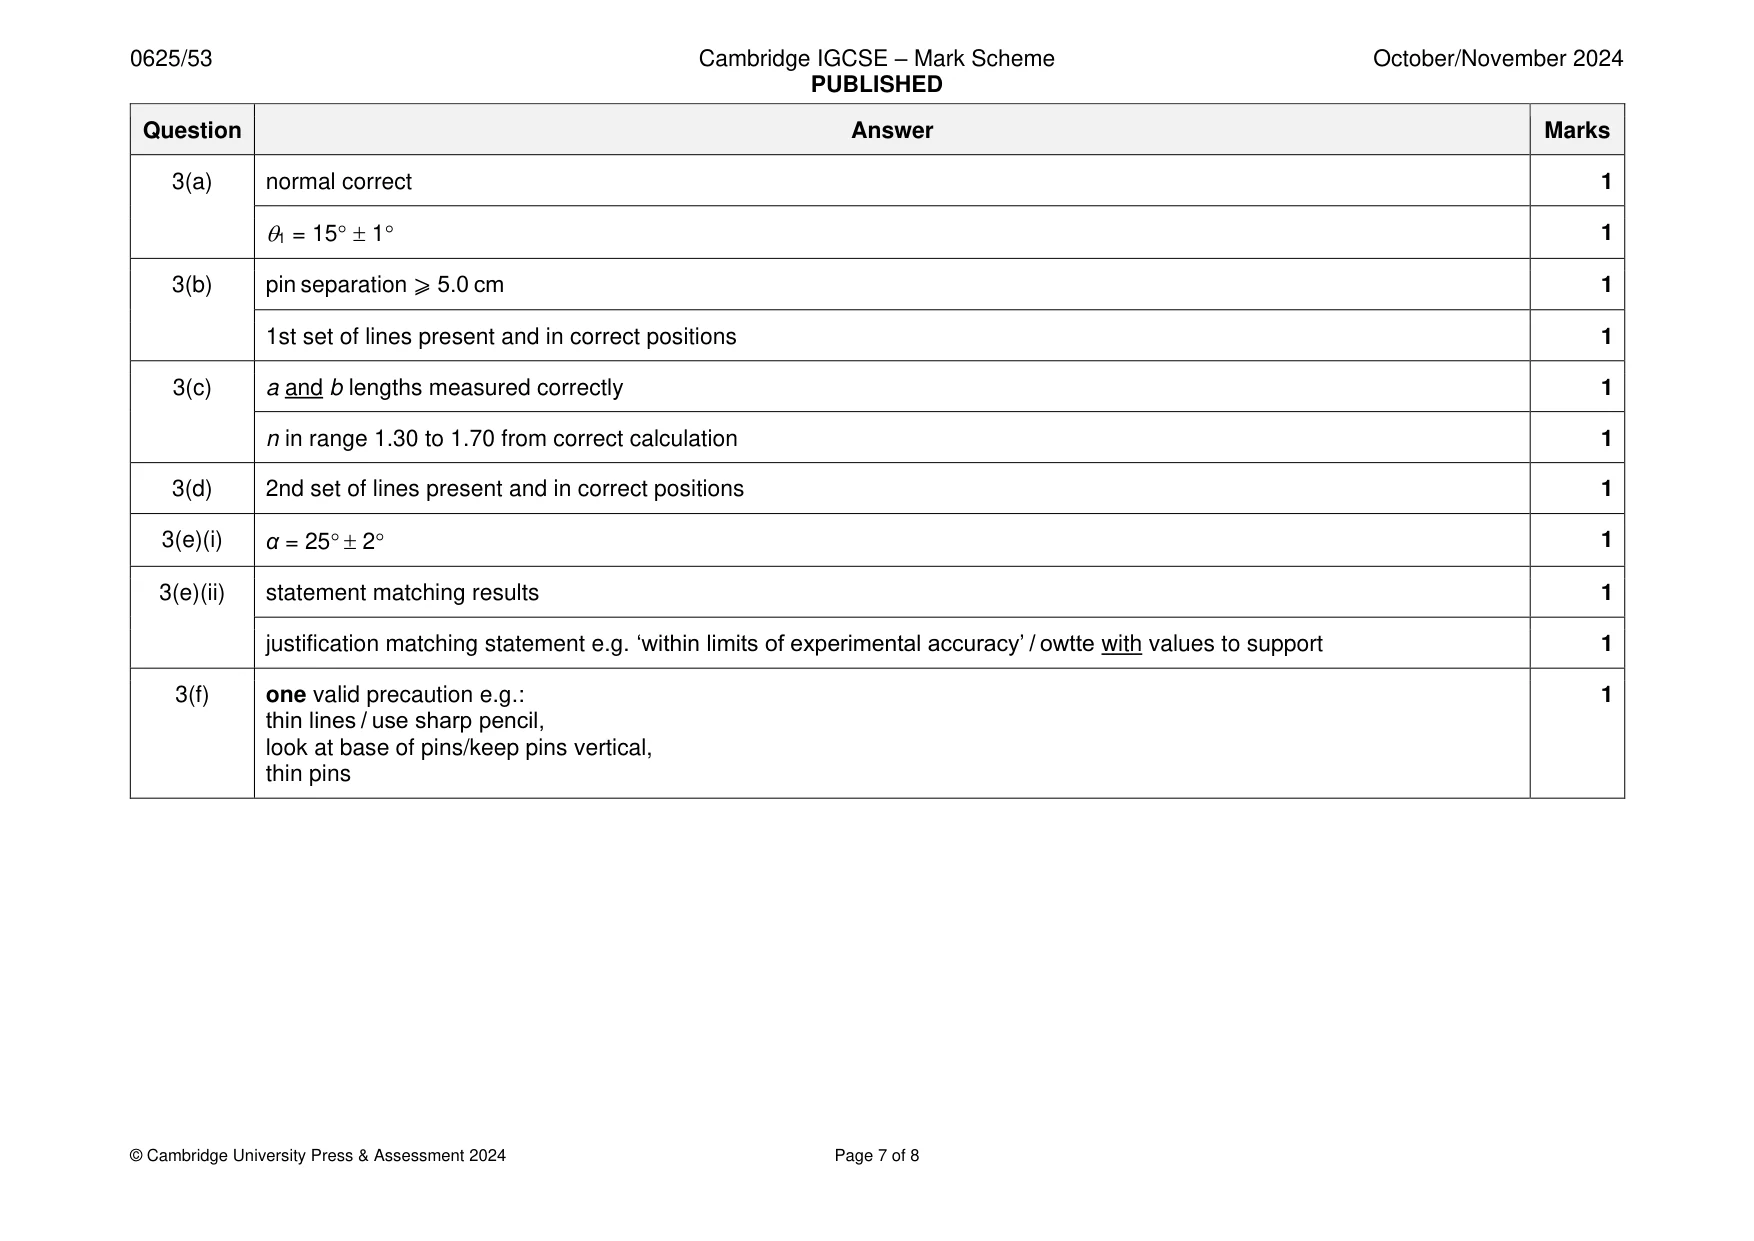
Mark scheme: 3(a) normal correct 1 1 = 15 1 1 3(b) pin separation ⩾ 5.0 cm 1 1st set of lines present and in correct positions 1 3(c) a and b lengths measured correctly 1 n in range 1.30 to 1.70 from correct calculation 1 3(d) 2nd set of lines present and in correct positions 1 3(e)(i) α = 25 2 1 3(e)(ii) statement matching results 1 justification matching statement e.g. ‘within limits of experimental accuracy’ / owtte with values to support 1 3(f) one valid precaution e.g.: 1 thin lines / use sharp pencil, look at base of pins/keep pins vertical, thin pins
Q4 · A student investigates the speed of a small trolley moving down a sloping ramp
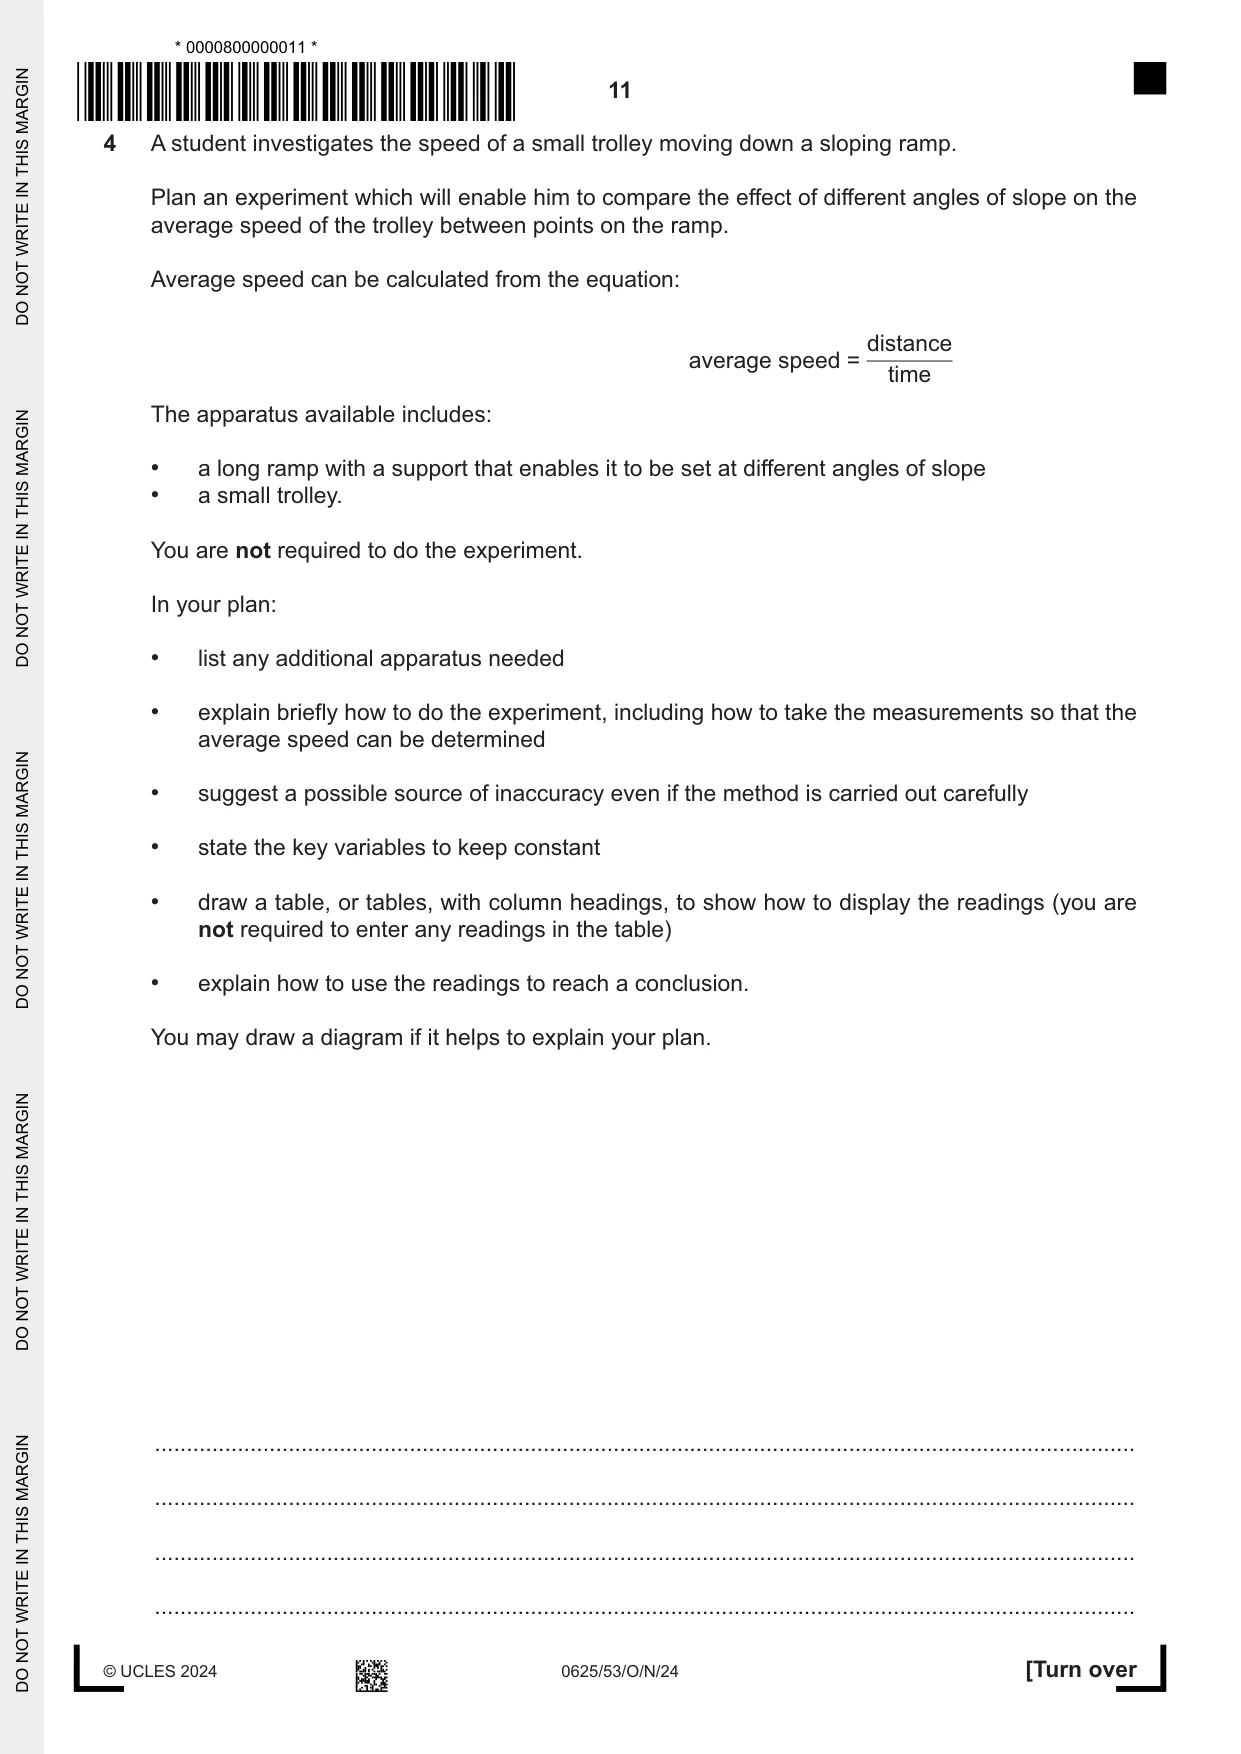
4 A student investigates the speed of a small trolley moving down a sloping ramp. Plan an experiment which will enable him to compare the effect of different angles of slope on the average speed of the trolley between points on the ramp. Average speed can be calculated from the equation: distance average speed = time The apparatus available includes: • a long ramp with a support that enables it to be set at different angles of slope • a small trolley. You are not required to do the experiment. In your plan: • list any additional apparatus needed • explain briefly how to do the experiment, including how to take the measurements so that the average speed can be determined • suggest a possible source of inaccuracy even if the method is carried out carefully • state the key variables to keep constant • draw a table, or tables, with column headings, to show how to display the readings (you are not required to enter any readings in the table) • explain how to use the readings to reach a conclusion. You may draw a diagram if it helps to explain your plan. .......................................................................................................................................................... .......................................................................................................................................................... .......................................................................................................................................................... .......................................................................................................................................................... .......................................................................................................................................................... .......................................................................................................................................................... .......................................................................................................................................................... .......................................................................................................................................................... .......................................................................................................................................................... .......................................................................................................................................................... .......................................................................................................................................................... .......................................................................................................................................................... .......................................................................................................................................................... .......................................................................................................................................................... .......................................................................................................................................................... .......................................................................................................................................................... .......................................................................................................................................................... .......................................................................................................................................................... .......................................................................................................................................................... .......................................................................................................................................................... .......................................................................................................................................................... .......................................................................................................................................................... .................................................................................................................................................... [7]
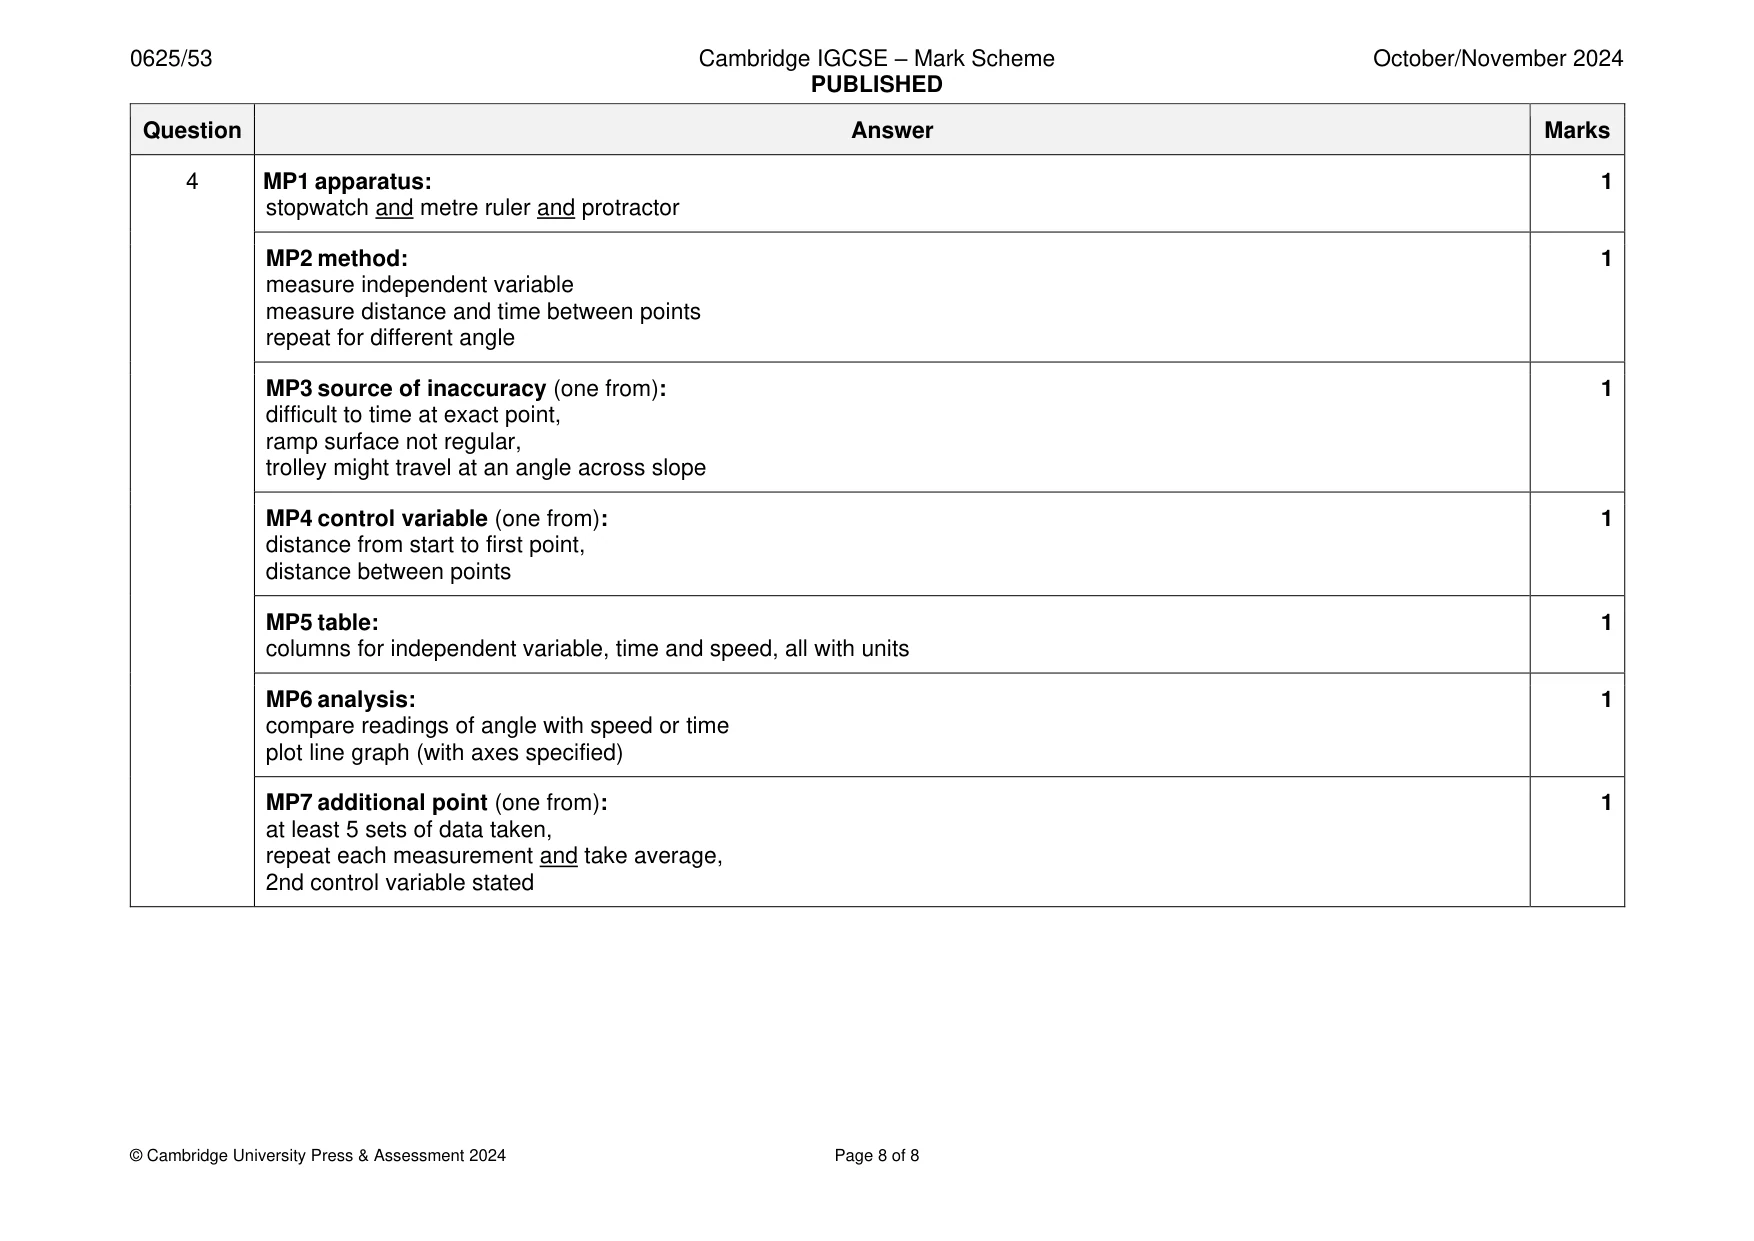
Mark scheme: 4 MP1 apparatus: 1 stopwatch and metre ruler and protractor MP2 method: 1 measure independent variable measure distance and time between points repeat for different angle MP3 source of inaccuracy (one from): 1 difficult to time at exact point, ramp surface not regular, trolley might travel at an angle across slope MP4 control variable (one from): 1 distance from start to first point, distance between points MP5 table: 1 columns for independent variable, time and speed, all with units MP6 analysis: 1 compare readings of angle with speed or time plot line graph (with axes specified) MP7 additional point (one from): 1 at least 5 sets of data taken, repeat each measurement and take average, 2nd control variable stated
What was in this paper
The subtopics covered by these 4 questions, and how many questions each got. Open one in a new tab to see every Cambridge question on it.
What you needed in this session
Cambridge’s own grade thresholds for 2024 Oct/Nov, Paper 5 · Variant 3. A higher threshold means an easier paper — the bar moves with how the cohort did.